Article

The Role of Carbon to Nitrogen Ratio on the Performance of Denitrifying Biocathodes for Decentralized Wastewater Treatment

Department of Civil & Environmental Engineering, University of South Florida, Tampa, FL 33620, USA
*
Author to whom correspondence should be addressed.
Water 2022, 14(19), 3076; https://doi.org/10.3390/w14193076
Submission received: 25 August 2022 / Revised: 23 September 2022 / Accepted: 27 September 2022 / Published: 30 September 2022
(This article belongs to the Topic Advances in Environmental Biotechnology (AEB))

Abstract

:
Bioelectrochemical systems with denitrifying biocathodes have been of interest for the removal of nitrate in decentralized wastewater treatment applications. Only a few studies have directly focused on this application, but the removal rates have been very low. This study evaluated the operational parameters that affect the nitrate removal of two-chambered microbial fuel cells (MFCs) with a biocathode, particularly, the carbon to nitrogen ratio (C:N) and proton diffusivity across electrode chambers. The results show that proton diffusion across a proton exchange membrane is not a limiting step in nitrogen removal performance. At C:N ratios of 4 and 8, biocathodes with a continuously supplied carbon source at the anode were able to achieve complete nitrogen removal at a rate of 0.97 ± 0.21 and 1.15 ± 0.13 mg N L−1 d−1, respectively. However, as the C:N ratio increased from 4, 8, 16, and 32, the electrode potentials decreased accordingly. Ratio 4 C:N had a cathodic reduction potential of +66.1 ± 5.3 mV vs. SHE and dropped to −78.6 ± 9.8 mV vs. SHE at 32 C:N. The cathode electrode potential can be controlled by way of the carbon concentrations at the anode, which can have major indirect implications on the evolution of cathodic microbial communities that have preference to particular ranges of reduction potentials. The cathodic biofilms in this study were dominated by the phyla Proteobacteria, Acidobacteria, Bacteroidetes and Nitrospirae, which are known to have key denitrifying microorganisms. The genus Stenotrophomonas was found in abundance within the attached cathode biofilm and to a lesser extent in the suspended biomass. Vibrio, Acidobacteria_Gp4, Nitrosomonas, and Candidatus Competibacter were also cultivated in both the suspended and attached biomass. Nitrospira was only found in the attached biofilm. Regardless of operational scheme, nitrogen removal was improved at low C:N ratios, with 8 C:N having the best performance overall. This indicates that higher C:N ratios than were previously explored (>4 C:N) provide sufficient coulombs to facilitate denitrification at the cathode even while the anodic CEs remain low. Reactor design modifications should be considered to fully support robust denitrifying communities, enhancing the overall nitrogen removal for decentralized wastewater treatment applications.

Graphical Abstract

1. Introduction

Bioelectrochemical systems (BES), particularly microbial fuel cells (MFCs), have been widely studied for the biological transformation of organic matter to generate power and current. While scaling up the current and power productions in bench-scale BES for practical applications has been difficult, they continue to be of significant interest for the generation of alternative renewable energy sources and for the treatment of carbon- and nitrogen-rich wastewaters [1,2]. Several BES have been used in conjunction with other existing wastewater treatment technologies, such as struvite precipitation and anaerobic membrane bioreactors (AnMBRs), that cannot directly remove or completely recover dissolved nitrogen or phosphorus [3,4,5]. In these examples, BES are primarily used as a polishing step for removing ammonium or its nitrified compounds.
For wastewater treatment applications, two-chamber MFCs with denitrifying biocathodes offer significant advantages for the proliferation of decentralized wastewater treatment. These include but are not limited to the simultaneous removal of carbon and nitrogen-based compounds, reduction in odor levels, low production of biomass, current and power generation to some degree, and coupling disinfection capabilities [6,7,8,9].
To date, most decentralized wastewater treatment systems that have pilot-tested BES have focused on carbon removal at the anode which have been coupled with either air-cathodes to facilitate oxygen reduction since these offer high cathodic reduction efficiencies or with a separate nitrifying reactor that feeds into a denitrifying biocathode for complete nitrogen removal [10,11,12,13,14,15]. What makes the application of BES more complex for decentralized wastewater treatment applications is the large variability in influent concentrations, intermittent flow rates, unstable electricity access, and long periods of dormancy due to maintenance or other unexpected failures. Therefore, such operational parameters should be considered within the context of designing and operating MFCs with denitrifying biocathodes.
A multitude of studies have focused on the removal of nitrate and other oxidized nitrogen species from two-chamber MFCs since it was first demonstrated by Clauwaert et al. in 2007 [16,17,18]. In this first study, a nitrogen removal rate of 146 mg N L−1 d−1 was achieved utilizing a tubular two-chamber MFC under a poised potential. Nguyen et al. also studied the effects of nitrogen removal when coupling a biocathode to a biological anode and to an electrically assisted abiotic anode [19]. Nitrogen removal efficiency and removal rates were highest, 75% and 2.4 mg N L−1 d−1, respectively, in a MFC operated in a closed circuit (1000 Ω) with a biological anode and cathode as opposed to a reactor with an electrically assisted anode or poised cathode. Kondaveeti et al. revealed that biocathodes can perform on par with abiotic cathodes that contain platinum catalyst, both showing 91% and 87% nitrate removal, respectively, at an applied voltage of 0.7 V [20]. Poised potential electrodes work well and more efficiently in laboratory settings, however, supporting a potentiostat to maintain an electrode potential may not be feasible for systems in settings with unstable or intermittent electricity access.
The performance of denitrifying biocathodes coupled with biological anodes will be dependent on the anode substrate source, coulombic efficiency (CE) of the anode, and the availability of protons from the anode. It has been shown that nitrogen removal by a biocathode is improved with increasing initial carbon concentration at the anode [21,22,23,24], although the carbon to nitrogen (C:N) ratios tested have ranged from very small values (0.2–0.4) up to 4.5 and carbon sources have varied between acetate and complex carbohydrates. It is anticipated that MFCs used for decentralized treatment with local inoculum, instead of previously enriched biofilms, will observe low anodic CEs. Similarly, MFCs starting with mixed microbial inoculum from local sources have reported anodic CEs anywhere between 1% and 40% [25,26,27]. While the theoretical minimum carbon to nitrate-nitrogen ratio for complete heterotrophic denitrification using acetate as the main carbon and energy source is 1.6 mg C/mg NO3-N, low anodic CE can limit microbial activities at the biocathode. These low observed CEs suggest that there is still room for improvement in reactor design and anode operation to optimize the removal performance by biocathodes. For decentralized wastewater treatment applications, physical methods to control the cathode potential is desirable.
Furthermore, BES that control the cathode potential, whether by using an external resistor or a potentionstat, have shown that the rate of denitrification can be improved [16]. One method to control the half-cell potentials in a two chamber BES with a bioanode and biocathode, which is not often discussed in the literature, is to control the organic substrate availability at the anode to regulate the microbial activities at the cathode. The anodic electrode potential can highly influence how well a BES performs under varied parameters. Using Gibbs free energy, Δ G ° , the energy gained by microorganisms can be described by the following equation:
Δ G a n o d e ° = n F   ( E s u b s t r a t e ° E a n o d e ° )
Δ G c a t h o d e ° = n F   ( E c a t h o d e ° E o x i d a n t ° )
where n is the number of electrons transferred, F is the Faraday constant (96,485 C mol−1 e), and E°′ are the standard potentials of the donor (organic substrate at the anode or cathode electrode) and acceptor (anode electrode or nitrate for denitrifying biocathodes) [28]. The half-cell reactant potentials are determined by the Nernst equation:
E r e d / o x = E r e d / o x ° R T n F ln Q r
where Ered/ox is the reduction potential, R is the universal gas constant, T is temperature in Kelvin, and Qr is the reaction quotient representing the ratio of reductant and oxidant concentrations. By using a potentiostat the cathode potential can be controlled, but in a similar fashion, by controlling the organic load to the anode and the ratio between the carbon in the anode to the nitrogen in the cathode, modifying the cathode electrode potential can also be achieved. Furthermore, proton availability to complete the redox reactions at the anode and cathode to generate ΔG as described by Equations (1) and (2) can also limit the denitrification process. Evaluating carbon to nitrogen ratios in two-chamber BES as well as the proton transfer between anodes and cathodes across a proton exchange membrane (PEM) can improve the understanding in design, operation, and performance of biocathodes for denitrification.
Therefore, the purpose of this paper was to evaluate operational parameters that can affect nitrogen removal in biocathodes within the context of decentralized wastewater treatment. The study focused on evaluating the effects of high C:N ratios, operational schemes, and PEM size on denitrification. The carbon to nitrogen ratios of 4, 8, 16, and 32 were evaluated under two operational schemes relevant to decentralized wastewater systems, semi-batch anode and continuous feed anode both with a batch cathode, to evaluate the nitrogen removal effectiveness. Additionally, the effects of protons transfer across different PEM sizes on denitrification were also assessed.

2. Materials and Methods

2.1. Reactor Configuration and Operation

For simplicity in design, two-chamber MFC configurations with a PEM were used to evaluate the effects of carbon to nitrogen ratios, the reactor flow operation, and the proton diffusion across the PEM on nitrogen removal performance by biocathodes.
The MFC anode and cathode chambers comprised two 250 mL bottles with a working liquid volume of 200 mL each and were hydraulically partitioned using a cationic PEM (CMI-7000, Membranes International; Ringwood, NJ, USA). The PEM surface area was 5.0 cm2. Both the anode and cathode electrodes were composed of four graphite felt pieces (9 × 3 × 0.3 cm each) with a projected surface area of 0.024 m2. An external load of 10 Ω was placed between anode and cathode throughout the study. Each MFC contained a Ag/AgCl reference electrode next to the cathode. The anode and cathode chambers were both inoculated with activated sludge from the City of Largo Wastewater Reclamation Facility that employs an A2O (anaerobic/anoxic/aerobic) process. The inoculum was diluted 1:5 with the respective anode or cathode media and included 1:10 of soil sediments suspended in pond water from a nearby university pond. The wastewater sludge had a total suspended solids (TSS) of 280 mg/L and volatile suspended solids (VSS) of 240 mg/L. The pond sediments contained 2100 mg TSS/L and 660 mg VSS/L. Four replicate reactors were constructed and operated simultaneously under the same testing parameters. The replicates decreased to three reactors as one was used sacrificially for DNA analysis.
The 200-mL MFCs were first operated at four distinct initial anode carbon to cathode nitrogen ratios of 4, 8, 16, and 32 and operated as semi-batch reactors (Phase I) (Figure S1 in Supplemental Materials). Since the rate of nitrate removal at the cathode was vastly slower than the rate of organic source at the anode, the end of the batch cycle was determined by total removal of carbon source. During this period, the anode was fed a solution of 1.386 g Na2HPO4, 0.849 g KH2PO4, 0.050 g NH4Cl, and 0.050 g MgSO4 per liter. CH3OONa was used as the main carbon source and the concentrations correlated to 1.39 g, 1.39 g, 2.78 g, and 2.78 g per liter for each respective C:N ratio. The cathode media comprised of 0.710 g Na2HPO4, 1.50 g KH2PO4, 0.050 g MgSO4, and 2.94 g NaHCO3. Sodium nitrate concentrations in each of the respective C:N ratios tested were 0.60 g, 0.30 g, 0.30 g, and 0.15 g per liter. Additionally, trace mineral solutions were added to both the anode and cathode media as described by Castro et al. [12]. The anode and cathode chambers of each MFC were continuously stirred and connected to a 1 L media bottle and operated under recycle batch at a recycle time of 6 min. During each batch cycle, anode and cathode liquid samples were collected until the cell voltage dropped to a steady state. Samples were filtered using 0.45 μm syringe filters, stored at −20 °C, and processed within a week from collection. Acetate concentrations were also measured immediately after sampling to determine the end of the batch, where the concentration of acetic acid was <5 mg COD/L.
Following this period, the same C:N ratios of 4, 8, 16, and 32 were again tested under anode electron donor non-limiting conditions (Phase II) (Figure S1 in Supplemental Materials). The anode was continuously fed the same media as previously described, with the sodium acetate as the main carbon source and the concentrations correlating to 0.348 g, 0.695 g, 1.39 g, and 2.78 g per liter for each respective C:N ratio. The cathode was also fed the same media as previously mentioned but with a sodium nitrate concentration of 0.15 g NaNO3 per liter during all C:N ratios tested. The hydraulic retention time of the anode was 1.2 days. The cathode was maintained in recycle batch operation and each cycle was operated for 18 days. The pH of the cathode was measured and adjusted with HCl to maintain levels below pH 8. All media was sparged for at least 30 min with nitrogen gas and reactor samples were collected every 3 days, filtered, and stored at −20 °C until processed. Each cycle was operated twice across three replicates, with the first cycle being an acclimation period for the microorganisms to adjust to the changing anodic environment.
To assess the differences in denitrification performance due to varying membrane size, two additional sets of two-chamber reactors were constructed in triplicates, each containing a working volume of 100 mL per electrode chamber (Phase III). The membrane surface area for each reactor set were 4 cm2 and 16 cm2, with a projected electrode surface area of 0.001 m2. A 10 Ω external load was placed between the anode and cathode. The anode and cathode were inoculated with effluent from the 200-mL MFC anode and cathodes, respectively, after operating for over 9 months. All reactors were operated for one month prior to data collection to allow for acclimatization before testing began. The 100-mL MFCs were all operated as semi-batch reactors (Figure S1 in Supplemental Materials). The anode and cathodes, respectively, were both fed similar medias as prior MFCs, with the addition of 0.695 g of sodium acetate to the anode and 0.15 g of sodium nitrate to the cathode, correlating to a C:N ratio of 8. The anode media was replaced every 3 days at which the COD removal was >94% during the initial acclimatization period. The cathode media was replaced every 7 days to assess the removal rates within a weeklong period. All reactors were continuously stirred using a benchtop shaker between media changes and operated for over 3 months. A summary of all three phases describing the anode and cathode carbon and nitrogen concentrations and operational schemes is shown in Table 1.

2.2. Abiotic Ion Transport Tests

To observe the effects of PEM size on proton transfer rates from anode to cathode, the 100-mL two-chamber MFCs were tested under abiotic conditions. Both the anode and cathode contained a solution of DI water with the abiotic anode side manually adjusted to an initial pH 9 using NaOH and the cathode side adjusted to pH 5 with HCl. Each side was mixed continuously during the experimental period. Passive proton transfer was monitored under no potential difference as well as under a +1.0 V external voltage input across the cell for each of the respective membrane surface areas tested. The applied external voltage was selected to provide a cathode potential slightly above that of +0.8 V desired for denitrification. The anode and cathode solutions were allowed to stabilize for the first 10 min prior to beginning the tests followed by pH monitoring for 120 h to observe the rate of proton transfer during that period. The rate of proton transfer was determined by linear regression of the pH over time before the pH levels reach equilibrium.

2.3. Chemical Analysis

A Shimadzu TOC-V was used to analyze dissolved total organic carbon (TOC) and dissolved total nitrogen (TN) for both anode and cathode samples. Ion chromatography (Metrohm 930; Herisau, Switzerland) was used to measure nitrate, nitrite, and ammonium concentrations. The pH and conductivity were also measured for each sample immediately after sample collection. Additionally, anode samples were analyzed for acetic acid using gas chromatography (GC) (Agilent 7820A; North Kingstown, RI) to check against the TOC measurements.

2.4. Electrochemical Analysis

During Phase I, the fuel cell potentials of the 200-mL MFCs were measured using a handheld digital multimeter. All subsequent tests used a Keithley datalogger (2700 model; Cleveland, OH) to measured fuel cell potentials and cathode potentials. The anode or cathode potentials were determined by calculating the difference between the fuel cell potential and the anode or the cathode potential, respectively. The anode and cathode reduction potentials are all presented as mV vs. SHE. The anodic and cathodic coulombic efficiencies (CEs) were determined using the calculation methods for batch and continuous reactors as described by Logan [28].

2.5. DNA Analysis

After Phase I was complete, six randomly selected pieces of carbon felt were removed from a replicate reactor. The biofilm was scraped off with a sterile spatula and placed inside a centrifuge tube along with the felt pieces. The tube was centrifuged at 5000 RPM for 10 min. The felt pieces were removed and the remainder of solids were used for downstream DNA analysis. A 30 mL liquid sample was also taken from the initial wastewater inoculum as well as from the bulk liquid of the same replicate reactor and each sample was passed through a 0.22 μm filter. Environmental DNA was extracted using MoBio Powersoil kits (Hilden, Germany) following the manufacturer’s specifications. PCR-amplified 16S rRNA samples were commercially sequenced using Illumina 300 bp paired-end sequencing (Applied Biological Materials, Inc., Richmond, BC, Canada) and following methods as described in detail by Davis et al. [29]. Sequence results were processed using Mothur software following the MiSeq standard operating procedure [30,31]. Sample sequences were aligned to the Silva reference alignment (Version 128) for initial taxonomic identification [32]. The top 100 genera were used as a cut-off and each bacterial OTU reference sequence was used to conduct a provisional identification of the taxonomy using NCBI Blastn [33]. Taxa-level community analysis and diversity estimations (Chao1, abundance-based coverage estimator (ACE), Shannon index, Simpson index) were conducted using the Phyloseq package in R [34,35].

2.6. Statistical Analysis

Comparison of mean averages between the C:N scenarios were conducted using one-way ANOVA in R. Any p values < 0.05 were considered statistically significant. Tukeys Honest Significant Test was also used to identify the statistical difference of means between the different C:N ratio results.

3. Results

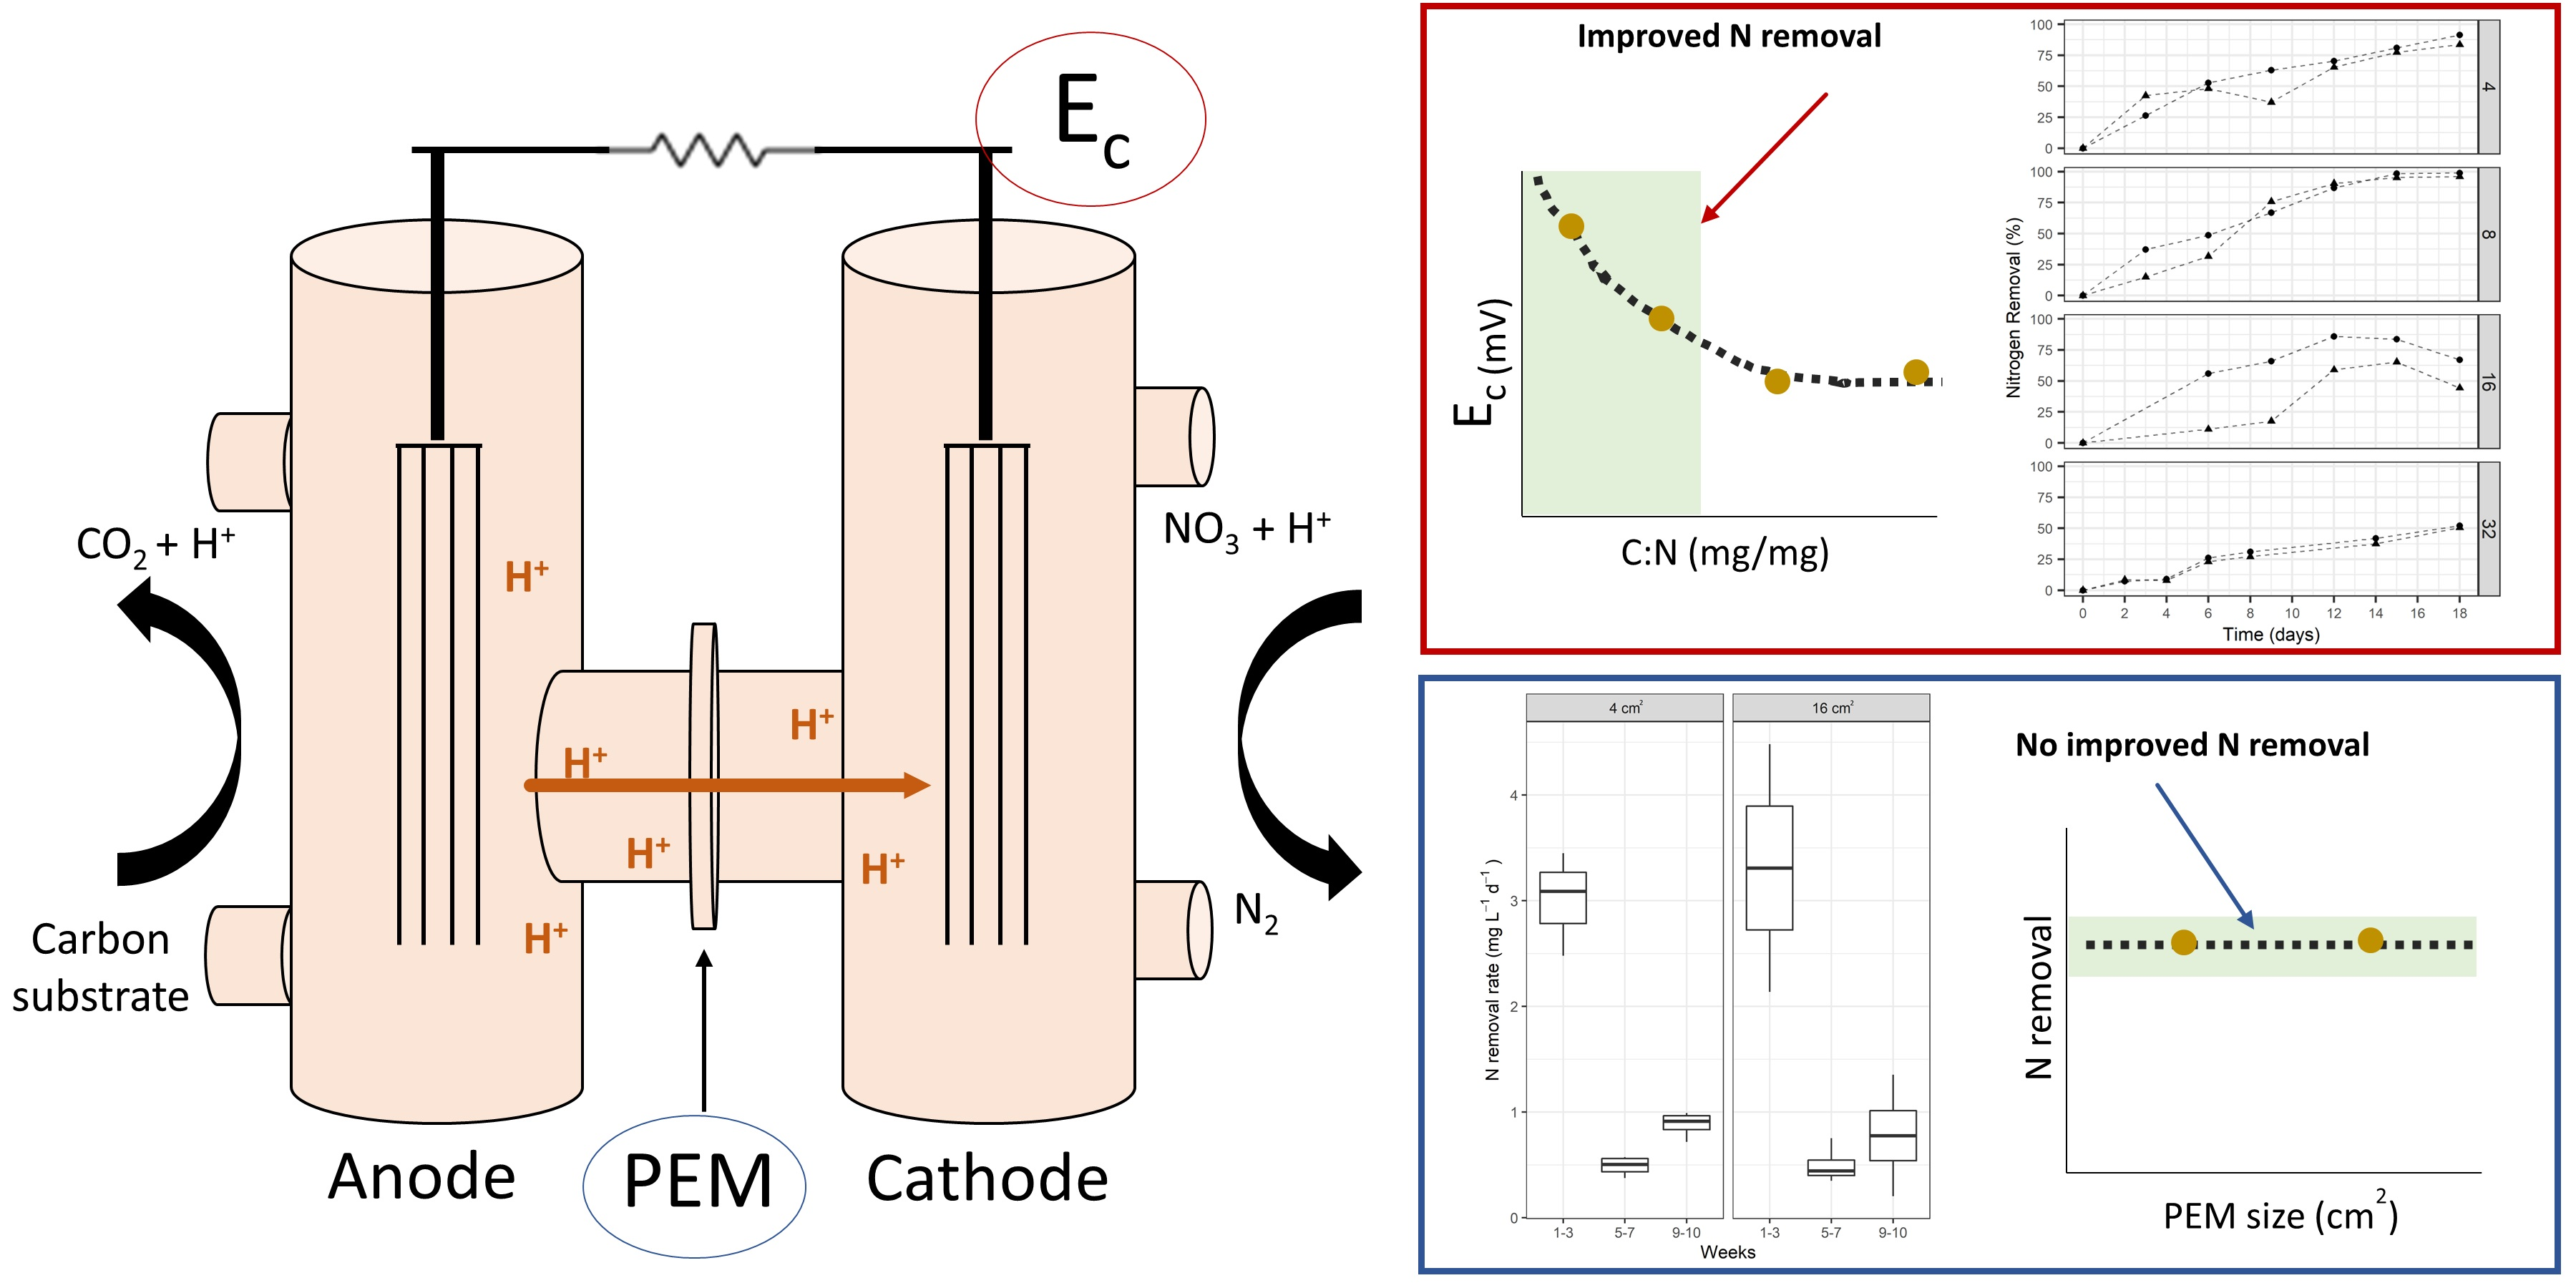
3.1. Increase in C:N Does Not Enhance N Removal in Batch MFCs

Four different initial carbon to nitrogen ratios of 4, 8, 16, and 32 were tested in two-chamber MFCs operated in batch mode to assess the role that carbon at the anode plays in dictating the performance of denitrifying biocathodes under intermittent flows similarly to what could be observed for decentralized wastewater treatment systems. Under these anode donor-limiting conditions, the nitrogen removal rate at the cathode was evaluated over an anode batch cycle. The nitrate removal, measured as total nitrogen, was monitored during each of these batch cycles (Figure 1A). The average removal rates of nitrogen under these conditions were 4.21 ± 2.28, 9.97 ± 8.81, 2.1 ± 0.45, and 2.03 ± 1.36 mg N L−1 d−1 at C:N ratios of 4, 8, 16, and 32, respectively. Analysis of these results revealed that there was no statistically significant difference (p > 0.05) in nitrogen removal rate means across the different starting C:N ratios. In all C:N scenarios, the continual drop of C:N was due primarily to the oxidation of the anode carbon source during the batch cycle (Figure S2 in Supplemental Materials). The batch cycles for C:N ratio of 4 and 8 were shorter due to a lower carbon concentration of 1000 mg COD/L as compared to the C:N ratios of 16 and 32 which contained 2000 mg COD/L. However, while the carbon source was completely degraded over all the batch cycles, the anodic CEs remained low and below 20%, with 8 C:N showing the highest average anodic CE of 16.5 ± 3.94 across all replicate MFCs (Figure 1A). There was a statistical difference between the anodic CEs of 4 and 8 C:N ratio (p < 0.05), with 8 C:N observing an average nitrogen removal of 9.97 mg N L−1 d−1. Overall, the nitrogen removal rate at various C:N ratios remained the same primarily due to similarly low anodic CEs across all C:N ratios. Since both the carbon at the anode and nitrogen at the cathode varied between ratios in Phase I, the Cathodic CEs were evaluated to assess the cathodic activity (e.g., denitrification performance) due to the variation in coulombs transferred to the cathode. While the anodic CEs observed a slight increased and remained constant after 8 C:N, the average cathodic CEs between replicates remained high at low C:N ratios (38.0 ± 22% for 4 C:N and 41.3 ± 24% for 8 C:N) and decreased at higher C:N ratios. However, due to the variation between replicates, the means were not statistically different across C:N ratios.
With increasing C:N ratios, nitrogen removal in batch operation was observed but not significantly improved with an increase in ratios. In 8 C:N, nitrogen concentrations at the cathode increased slightly for two of the replicate MFCs after all the carbon source was depleted at the anode at day 3 (Figure 1B). This was likely caused by a lack of available electrons to the cathode and subsequent signs of endogenous decay.
After 7 months of operation, biological samples from the cathode biofilm and effluent were collected and sequenced. Community analysis of the biocathode before and after prolonged enrichment revealed that Proteobacteria was the largest phyla within the attached biofilm (25.9%) and in suspension (42.6%) with Alpha-, Beta-, and Gamma- proteobacteria classes accounting for the highest relative abundances of 6.2%, 4.9%, and 13.4%, respectively, in the attached biofilm (Figure 2A). The genus Stenotrophomonas within the family Xanthomonadaceae was most dominant within the initial inoculum and the attached biofilm, with a relative abundance of 26.2% on the attached biofilm and only 12.4% representation within the suspended biomass (Figure 2B). Within this genus, the species Stenotrophomonas maltophilia is a known facultative anaerobe able to respire electrodes and facilitate anaerobic nitrate reduction [36]. Other Proteobacteria represented within the attached biomass were Vibrio (4.6%) and Nitrosomonas (4.1%). Interestingly, both genera were in higher abundance within the suspended biomass, 10.3% and 5.6%, respectively. Some Nitrosomonas are capable of both nitrification and denitrification, which further supports the increase in nitrate production observed after electron transport from anode to cathode ceased and endogenous decay ensued at the cathode [37]. In addition, the biofilm Phyla composition was followed by the presence of Bacteriodetes (21.0%), Acidobacteria (13.6%), and Nitrospirae (7.4%). Nitrospirae saw a 4.6-fold increase in abundance between the inoculum and the attached biofilm while Acidobacteria saw a 4.1-fold increase. At the genus level, these Phyla were primarily represented within the attached biofilm by Flavilitoribacter, Acidobacteria_Gp4, and Nitrospira.
Other studies of biocathode MFCs have shown similar diversity of phyla such as Proteobacteria, Bacteroidetes, Actinobacteria, Acidobacteria, Firmicutes, and Planctomycetes [18,38,39,40]. Denitrifiers are known to belong primarily to these taxa and therefore cultivation of nitrate and nitrite oxidizers was successful within the cathode even while complete denitrification was not always observed during batch operation. The attached biofilm showed a large diversity in microorganisms not unlike the inoculum as depicted by the Shannon and Simpson diversity indices (Figure 2D). This suggests that there was generally little change in diversity between the inoculum bacterial communities and those associated with the attached biofilms. Species richness, however, decreased with prolonged enrichment in the cathode (Figure 2C).

3.2. Dependence of Carbon Fluxes on Nitrogen Removal by Biocathodes

In the second phase of testing, the anode was operated in continuous flow to provide a constant flux of electrons to the cathode side. In this way, cathode performance could be explored without endogenous decay occurring. The same four C:N ratios of 4, 8, 16, and 32 were again tested under this operational scheme and correlated to an organic loading rate (OLR) at the anode of 0.21, 0.42, 0.83, and 1.7 g COD L−1 d−1. For comparison, a recent study of an onsite wastewater treatment system that treated blackwater observed an average OLR of 0.4–0.6 g COD L−1 d−1 [41]. The cathode’s initial nitrate concentrations remained constant at 25 mg N/L during each C:N ratio tested while the anode acetate concentration varied, respectively, to the initial C:N ratio. The cathode batch length was set to 18 days and was based on the slowest removal rate observed during the previously mentioned testing scheme.
With a continuous flow anode, C:N ratios of 4 and 8 observed near complete removal of nitrogen within 18 days, with removal rates of 0.97 ± 0.21 and 1.15 ± 0.13 mg N L−1 d−1, respectively, (Figure 3). The nitrogen removal performance decreased as the C:N ratio increased. While the influent anode carbon concentrations were all distinct, each C:N ratio observed significant carbon removal. On average, the anode carbon removal performance across the respective replicates was 90.9 ± 23.2%, 94.2 ± 5.7%, 92.8 ± 26.8%, and 93.9 ± 24.7% for C:N ratios 4, 8, 16, and 32, respectively. The anodic CEs also improved with a constant carbon flux, observing values of 32.7 ± 0.15%, 19.9 ± 0.03%, 20.7 ± 0.06%, and 25.6 ± 0.06% for C:N ratios 4, 8, 16, and 32, respectively. While the microbial community composition of the anode was not explored, both anode and cathode began with the same rich and diverse inoculum. It is speculated that the combination of low anodic CE and high COD removal suggest that organic matter was oxidized by microorganisms that did not utilize the anode as an electron acceptor. Carbon diversion to methane production is likely but was not quantified. Interestingly, the observed cathode potentials also decreased with rising C:N ratios. The cathode potential and current production had an inverse relationship (Figure 4). The cathode potential decreased with increasing carbon availability at the anode. The average potentials during the cycles for ratios 4, 8, 16, and 32 were 66.1 ± 5.3, −17.7 ± 3.4, −104 ± 7.0, and −78.6 ± 9.8 mV vs. SHE.

3.3. Denitrifying Biocathodes with Different PEM Sizes

To further assess where rate limitations of nitrate removal by a biocathode may be occurring, the effects of proton availability at the cathode were also investigated. First, the proton transfer rates were estimated using 100-mL abiotic MFCs with a membrane size of either 4 cm2 or 16 cm2 and compared between passive proton transfer (no voltage input) and an applied voltage of +1 V. From the results, the change in pH in the cathode was 3.6 times faster when the PEM was 4 times the size larger, suggesting a linear correlation between the transport rate of protons from anode to cathode and membrane size (Figure S3 in Supplemental Materials). This same trend was observed for both passive proton transfer and electrically assisted transfer. Furthermore, when an external voltage was applied between anode and cathode, the rate of transfer was increased by 10 times the rate observed during passive transfer (Table S1 in Supplemental Materials).
To assess the role of the PEM size on proton availability at the cathode, triplicate 100-mL biocathode MFCs were operated at 8 C:N and tested with either a 4 cm2 or 16 cm2 PEM. After operating for four weeks during a start-up period, the reactors were operated in semi-batch flow, with media replaced every three and seven days on both the anode and cathode sides, respectively, to identify rates of removal based on PEM size availability. The nitrogen removal rates for MFCs with either 4 or 16 cm2 decreased significantly during the first 3 weeks of data collection (Figure 5). The removal rates bounced back slightly by the end of the study, with PEM size 4 cm2 observing an average nitrogen removal of 0.88 ± 0.12 mg N L−1 d−1. The availability of a larger proton diffusion zone did not have a significant impact on the rate of denitrification by a biocathode. The data suggests that the relationship between the availability of electron donor and protons to facilitate reaction kinetics is complex and is further dependent upon the active microorganisms that enable the process.

4. Discussion

This study aimed to understand how a range of C:N ratios and operational schemes affected the performance of nitrogen removal by biocathode MFCs. The results from this study showed that biocathodes performed better in terms of nitrogen removal at low C:N ratios within the range tested. However, relative to other studies that have explored C:N ratios, the lowest C:N ratio of 4 and 8 tested in this study were relatively high. While initial carbon was high (500–2000 mg COD/L), the low anodic CE and coulombic delivery to the cathode were supplemented by higher COD. This method may not be appropriate for all system, particularly those that have limited carbon concentration. However, decentralized wastewater systems have a large range of influent concentrations to be able to support higher carbon loads at the anode. Increasing the size of the PEM did not have a statistically significant effect on the nitrogen removal, thus, it is likely that proton transfer is not a limiting step for denitrifying biocathodes. The C:N ratios in dual-chamber MFCs played an important role in the rate of nitrogen removal at the cathode, influenced primarily by the observed cathode potentials and overall current densities.
The carbon to nitrogen ratios were key parameters in controlling the cathode potentials. There is evidence that the increase in continuously supplied carbon on the anode had a negative thermodynamic effect on the cathode electrode reduction potentials. The average electrode potentials dropped from +66.1 mV at 4 C:N to −104 mV at 16 C:N. From the Nernst equation, concentration differences between carbon and nitrogen involved in the reaction quotient increased with higher C:N ratios, decreasing the observed half-cell potentials of the cathode. Electrode potentials play a critical role in selecting electrochemically active microbial communities on electrode biofilms. From the Gibbs free energy equation, there is an understanding that the difference between the cathode electrode potential and the final electron acceptor (i.e., nitrate) must yield an energetically favorable reaction to proceed. To gain the most energy thermodynamically, a high negative electrode potential is desired, however, this approach does not yield the desired response from all microorganisms. Nitrogen removal has been observed at poised cathodes anywhere between −800 mV to +1200 mV vs. SHE [19,42,43,44]. Lower cathodic potentials (+450 to −300 mV vs. SHE) than the reduction potential of complete denitrification (+750 mV vs. SHE) tend to yield improved nitrogen removal; however, the range of these potentials is not well defined and possibly correlated to other factors such as inoculum source, electrode material, and enriched microbial community composition. For example, the type of microbial species in biocathode MFCs has been correlated to the electrode material. The phyla Bacteroidetes and Proteobacteria are dominant across a range of electrode materials including granular activated carbon, granular semicoke, and carbon felt [40]. In biocathodes, direct electron transfer has been shown among the class Betaproteobacteria and the phylum Firmicutes and both types of bacteria were observed in our study, with Proteobacteria being the most dominant phylum [38]. It is also likely that a highly conductive carbon-based electrode material can aid in achieving higher anodic CEs while also improving biofilm densities which will further improve the overall treatment performance at the cathode [45].
Electrochemically active microorganisms have a wide range of activation potentials for direct or indirect electron transfer, and this has been heavily studied in anode-associated biofilms, particularly, Geobacter species [46]. While a multitude of studies have focused on poising the cathodic reduction potentials to improve electricity production, there is still limited knowledge about what specific bacterial species are associated with cathode oxidation. This makes it difficult to select cathode potentials to enrich for cathode-oxidizing bacterial. Nevertheless, this study shows that there is an indirect method of setting the cathode reduction potential and that potentials between −0.02 and 0.7 V vs. SHE are able to support complete denitrification using a bioanode to achieve dual wastewater treatment goals.
MFCs for power production are known to have large limitations, particularly when scaled up. In practicality, denitrifying biocathode MFCs are best suited for contaminant removal and for polishing a variety of low concentration waste streams instead of power production. Furthermore, they should be used in combination with other nitrogen treatment methods that include ammonia removal or transformation. While biocathodes can remove nitrate well, it is an inherently a slow process. Many of the studies on MFCs for nitrogen and carbon removal at the bench scale result in low nitrogen removal rates and thus systems with high influent nitrate concentrations will require longer hydraulic retention times. The highest nitrogen removal observed in this study by one of the replicates was 19.9 mg N L−1 d−1. With a continuous carbon source at the anode, nitrogen removal rates were much lower, 0.65–1.03 mg N L−1 d−1.
Considering a decentralized wastewater treating primarily blackwater, the anticipated nitrogen concentrations are very high, 250–350 mg N L−1 and almost entirely composed of ammonium-nitrogen [47]. With such low removal rates by biocathodes, it would not be feasible to use a biocathode as a primary method for nitrogen removal but in combination with other nitrogen removal methods. One example of integrating a biocathode MFC to a decentralized treatment system would be to couple a biocathode to an AnMBR followed by ion exchange media. The AnMBR does well with removing solids and carbon, while the ion exchange media would primarily adsorb ammonium. The effluent of an AnMBR coupled with ion exchange and activated carbon has been shown to have < 10 mg NO3-N L−1 and residual carbon near 100 mg COD/L suitable for sustaining a two-chamber denitrifying biocathode [41]. To achieve higher C:N ratios closer to 8, carbon addition may also be required which would influence the overall cost of the system and increase maintenance requirements by the operators. However, such a system may be limited by the need for high water production rates to meet the water demand of local communities. Furthermore, several decentralized treatment systems tend to observe periods of dormancy where there are no users at a site, or it is down for maintenance. This study also showed that biocathodes need a constant flux of electron donor, otherwise, endogenous decay occurs which may have long term effects if the system is down for long periods of time.
Lastly, decentralized systems for off-grid applications are vexed with technical difficulties due to the nature of specific site locations, limitation of electrical power, and system complexity [48]. Developing a passive method to control the cathode potential and enrich for cathode-oxidizing bacteria make denitrifying biocathodes a viable treatment option in situations where water demand does not need to be met, such as for remediation purposes. Taking into consideration the environmental challenges in operation and design of decentralized treatment systems in conjunction with the results of this work, the performance of denitrifying biocathodes can still be further improved.

5. Conclusions

The results from this study showed that the carbon and nitrogen ratios tested (4, 8, 16, and 32) can directly affect the cathode reduction potentials and the current densities observed when cathode received constant flux of electrons. Biocathodes observed complete nitrogen removal when the C:N ratio was low (4 and 8) and the carbon source was constant. These values are much higher than previous studies have focused on, highlighting that when CEs are low, higher C:N ratios are needed to facilitate denitrification. Increasing the size of the PEM did not have a statistically significant effect on the nitrogen removal rate, therefore, it was clear that the concentration differences between the anode reductant and cathode oxidant played a more significant role in the rate of nitrogen removal. Biocathode MFCs are currently limited for decentralized wastewater treatment applications due to the slow removal rates observed. However, novel reactor designs coupled with operational schemes that improve coulombic efficiencies and promote activity of cathode oxidizing-bacteria can make the technology viable for nitrogen treatment in decentralized treatment applications.

Supplementary Materials

The following supporting information can be downloaded at: https://www.mdpi.com/article/10.3390/w14193076/s1. The supporting information includes diagrams of the reactor orientation and operation (Figure S1), C:N ratio changes over a batch cycle during Stage I (Figure S2), changes in pH transfer between anode and cathode in abiotic tests (Figure S3), and Summary of proton transfer with varying PEM in abiotic tests (Table S1).

Author Contributions

C.J.C.—Conceptualization, data curation, formal analysis, investigation, methodology, project administration, supervision, visualization, writing—original draft, writing—review and editing; K.T.—data curation, investigation, methodology; I.K.—data curation, investigation, methodology; D.H.Y.—Conceptualization, resources, funding acquisition. All authors have read and agreed to the published version of the manuscript.

Funding

This work was supported by the Bill & Melinda Gates Foundation grant number INV-006612.

Data Availability Statement

Not applicable.

Acknowledgments

We would like to thank Zachary Cross from the Membrane Biotechnology Lab at USF for his assistance on reactor operation and Madison Davis for assisting in processing the DNA sequencing data. Additionally, we would like to thank the reviewers for their insightful comments to improve the manuscript.

Conflicts of Interest

The authors declare no conflict of interest. The funders had no role in the design of the study; in the collection, analyses, or interpretation of data; in the writing of the manuscript; or in the decision to publish the results.

References

  1. Dong, H.; Liu, X.; Xu, T.; Wang, Q.; Chen, X.; Chen, S.; Zhang, H.; Liang, P.; Huang, X.; Zhang, X. Hydrogen peroxide generation in microbial fuel cells using graphene-based air-cathodes. Bioresour. Technol. 2018, 247, 684–689. [Google Scholar] [CrossRef] [PubMed]
  2. Zhang, G.; Zhou, Y.; Yang, F. Hydrogen production from microbial fuel cells-ammonia electrolysis cell coupled system fed with landfill leachate using Mo 2 C/N-doped graphene nanocomposite as HER catalyst. Electrochim. Acta 2019, 299, 672–681. [Google Scholar] [CrossRef]
  3. Kim, T.; An, J.; Jang, J.K.; Chang, I.S. Coupling of anaerobic digester and microbial fuel cell for COD removal and ammonia recovery. Bioresour. Technol. 2015, 195, 217–222. [Google Scholar] [CrossRef] [PubMed]
  4. Cerrillo, M.; Viñas, M.; Bonmatí, A. Microbial fuel cells for polishing effluents of anaerobic digesters under inhibition, due to organic and nitrogen overloads. J. Chem. Technol. Biotechnol. 2017, 92, 2912–2920. [Google Scholar] [CrossRef]
  5. Cunningham, J.A.; Orner, K.D.; Mihelcic, J.R. Struvite precipitation and microbial fuel cell for recovery of nutrients and energy from digester effluent. U.S. Patent 2018/0282189, 4 October 2018. [Google Scholar]
  6. Gajda, I.; Greenman, J.; Melhuish, C.; Ieropoulos, I.A. Electricity and disinfectant production from wastewater: Microbial Fuel Cell as a self-powered electrolyser. Sci. Rep. 2016, 6, 25571. [Google Scholar] [CrossRef]
  7. Yan, H.; Saito, T.; Regan, J.M. Nitrogen removal in a single-chamber microbial fuel cell with nitrifying biofilm enriched at the air cathode. Water Res. 2012, 46, 2215–2224. [Google Scholar] [CrossRef]
  8. Jung, R.K.; Dec, J.; Bruns, M.A.; Logan, B.E. Removal of odors from swine wastewater by using microbial fuel cells. Appl. Environ. Microbiol. 2008, 74, 2540–2543. [Google Scholar] [CrossRef]
  9. Jadhav, D.A.; Das, I.; Ghangrekar, M.M.; Pant, D. Moving towards practical applications of microbial fuel cells for sanitation and resource recovery. J. Water Process Eng. 2020, 38, 101566. [Google Scholar] [CrossRef]
  10. Liang, Z.; Nguyen, H.Q.; Das, A.; Hu, Z. Improving Nitrogen Removal in Two Modified Decentralized Wastewater Systems. Water Environ. Res. 2011, 83, 722–730. [Google Scholar] [CrossRef]
  11. Linares, R.L.; Domínguez-Maldonado, J.; Rodríguez-Leal, E.; Patrón, G.; Castillo-Hernández, A.; Miranda, A.; Romero, D.D.; Moreno-Cervera, R.; Camara-chale, G.; Borroto, G.G.; et al. Scale up of Microbial Fuel Cell Stack System for Residential Wastewater Treatment in Continuous Mode Operation. Water 2019, 11, 217. [Google Scholar] [CrossRef] [Green Version]
  12. Castro, C.J.; Srinivasan, V.; Jack, J.; Butler, C.S. Decentralized wastewater treatment using a bioelectrochemical system to produce methane and electricity. J. Water Sanit. Hyg. Dev. 2016, 6, 613–621. [Google Scholar] [CrossRef]
  13. Castro, C.J.; Goodwill, J.E.; Rogers, B.; Henderson, M.; Butler, C.S. Deployment of the microbial fuel cell latrine in Ghana for decentralized sanitation. J. Water Sanit. Hyg. Dev. 2014, 4, 663–671. [Google Scholar] [CrossRef]
  14. Ieropoulos, I.A.; Stinchcombe, A.; Gajda, I.; Forbes, S.; Merino-Jimenez, I.; Pasternak, G.; Sanchez-Herranz, D.; Greenman, J. Pee power urinal—Microbial fuel cell technology field trials in the context of sanitation. Environ. Sci. Water Res. Technol. 2016, 2, 336–343. [Google Scholar] [CrossRef]
  15. Leton, T.G.; Yusuf, M.; Akatah, B.M. Utilization of Multistage Microbial Fuel Cell for Septic Wastewater Treatment. IOSR J. Mech. Civ. Eng. (IOSR-JMCE) 2016, 13, 80–86. [Google Scholar] [CrossRef]
  16. Clauwaert, P.; Rabaey, K.; Aelterman, P.; De Schamphelaire, L.; Pham, T.H.; Boeckx, P.; Boon, N.; Verstraete, W. Biological denitrification in microbial fuel cells. Environ. Sci. Technol. 2007, 41, 3354–3360. [Google Scholar] [CrossRef] [PubMed]
  17. Srinivasan, V.; Weinrich, J.; Butler, C. Nitrite accumulation in a denitrifying biocathode microbial fuel cell. Environ. Sci. 2016, 2, 344–352. [Google Scholar] [CrossRef]
  18. Zhao, H.; Zhao, J.; Li, F.; Li, X. Performance of denitrifying microbial fuel cell with biocathode over nitrite. Front. Microbiol. 2016, 7, 344. [Google Scholar] [CrossRef]
  19. Nguyen, V.K.; Hong, S.; Park, Y.; Jo, K.; Lee, T. Autotrophic denitrification performance and bacterial community at biocathodes of bioelectrochemical systems with either abiotic or biotic anodes. J. Biosci. Bioeng. 2015, 119, 180–187. [Google Scholar] [CrossRef]
  20. Kondaveeti, S.; Min, B. Nitrate reduction with biotic and abiotic cathodes at various cell voltages in bioelectrochemical denitrification system. Bioprocess Biosyst. Eng. 2013, 36, 231–238. [Google Scholar] [CrossRef]
  21. Lefebvre, O.; Al-Mamun, A.; Ng, H.Y. A microbial fuel cell equipped with a biocathode for organic removal and denitrification. Water Sci. Technol. 2008, 58, 881–885. [Google Scholar] [CrossRef]
  22. Zhu, G.; Huang, S.; Lu, Y.; Gu, X. Simultaneous nitrification and denitrification in the bio-cathode of a multi-anode microbial fuel cell. Environ. Technol. 2021, 42, 1260–1270. [Google Scholar] [CrossRef] [PubMed]
  23. Huang, B.; Feng, H.; Wang, M.; Li, N.; Cong, Y.; Shen, D. The effect of C/N ratio on nitrogen removal in a bioelectrochemical system. Bioresour. Technol. 2013, 132, 91–98. [Google Scholar] [CrossRef] [PubMed]
  24. Feng, H.; Huang, B.; Zou, Y.; Li, N.; Wang, M.; Yin, J.; Cong, Y.; Shen, D. The effect of carbon sources on nitrogen removal performance in bioelectrochemical systems. Bioresour. Technol. 2013, 128, 565–570. [Google Scholar] [CrossRef]
  25. Yazdi, H.; Alzate-Gaviria, L.; Ren, Z.J. Pluggable microbial fuel cell stacks for septic wastewater treatment and electricity production. Bioresour. Technol. 2015, 180, 258–263. [Google Scholar] [CrossRef] [PubMed]
  26. Özkaya, B.; Cetinkaya, A.Y.; Cakmakci, M.; Karadaǧ, D.; Sahinkaya, E. Electricity generation from young landfill leachate in a microbial fuel cell with a new electrode material. Bioprocess Biosyst. Eng. 2013, 36, 399–405. [Google Scholar] [CrossRef]
  27. Aelterman, P.; Freguia, S.; Keller, J.; Verstraete, W.; Rabaey, K. The anode potential regulates bacterial activity in microbial fuel cells. Appl. Microbiol. Biotechnol. 2008, 78, 409–418. [Google Scholar] [CrossRef]
  28. Logan, B.E. Microbial Fuel Cells; John Wiley & Sons: Hoboken, NJ, USA, 2008. [Google Scholar]
  29. Davis, M.C.; Garey, J.R. Microbial function and hydrochemistry within a stratified anchialine sinkhole: A window into coastal aquifer interactions. Water 2018, 10, 972. [Google Scholar] [CrossRef]
  30. Schloss, P.D.; Westcott, S.L.; Ryabin, T.; Hall, J.R.; Hartmann, M.; Hollister, E.B.; Lesniewski, R.A.; Oakley, B.B.; Parks, D.H.; Robinson, C.J.; et al. Introducing mothur: Open-source, platform-independent, community-supported software for describing and comparing microbial communities. Appl. Environ. Microbiol. 2009, 75, 7537–7541. [Google Scholar] [CrossRef]
  31. Kozich, J.J.; Westcott, S.L.; Baxter, N.T.; Highlander, S.K.; Schloss, P.D. Development of a dual-index sequencing strategy and curation pipeline for analyzing amplicon sequence data on the miseq illumina sequencing platform. Appl. Environ. Microbiol. 2013, 79, 5112–5120. [Google Scholar] [CrossRef]
  32. Quast, C.; Pruesse, E.; Yilmaz, P.; Gerken, J.; Schweer, T.; Yarza, P.; Peplies, J.; Glöckner, F.O. The Silva ribosomal RNA gene database project: Improved data processing and web-based tools. Nucleic Acids Res 2013, 41, 590–596. [Google Scholar] [CrossRef]
  33. Altschul, S.F.; Gish, W.; Miller, W.; Myers, E.W.; Lipman, D.J. Basic Local alignment search tool. J. Mol. Biol. 1990, 215, 403–410. [Google Scholar] [CrossRef]
  34. McMurdie, P.J.; Holmes, S. phyloseq: An R package for reproducible interactive analysis and graphics of microbiome census data. PLoS ONE 2013, 8, e61217. [Google Scholar] [CrossRef] [PubMed]
  35. R Core Team. R: A Language and Environmental for Statistical Computing; R Foundation for Statistical Computing: Vienna, Austria, 2022; Available online: https://www.R-project.org/ (accessed on 16 September 2022).
  36. Venkidusamy, K.; Megharaj, M.; Marzorati, M.; Lockington, R.; Naidu, R. Enhanced removal of petroleum hydrocarbons using a bioelectrochemical remediation system with pre-cultured anodes. Sci. Total Environ. 2015, 539, 61–69. [Google Scholar] [CrossRef] [PubMed]
  37. Zorz, J.K.; Kozlowski, J.A.; Stein, L.Y.; Strous, M.; Kleiner, M. Comparative Proteomics of Three Species of Ammonia-Oxidizing Bacteria. Front. Microbiol. 2018, 9, 938. [Google Scholar] [CrossRef]
  38. Chen, G.-W.; Choi, S.-J.; Lee, T.-H.; Lee, G.-Y.; Cha, J.-H.; Kim, C.-W. Application of biocathode in microbial fuel cells: Cell performance and microbial community. Appl. Microbiol. Biotechnol. 2008, 79, 379–388. [Google Scholar] [CrossRef]
  39. Liao, C.; Wu, J.; Zhou, L.; Li, T.; Du, Q.; An, J.; Li, N.; Wang, X. Optimal set of electrode potential enhances the toxicity response of biocathode to formaldehyde. Sci. Total Environ. 2018, 644, 1485–1492. [Google Scholar] [CrossRef]
  40. Sun, Y.; Wei, J.; Liang, P.; Huang, X. Microbial community analysis in biocathode microbial fuel cells packed with different materials. AMB Express 2012, 2, 21. [Google Scholar] [CrossRef]
  41. Shyu, H.-Y.; Bair, R.A.; Castro, C.J.; Xaba, L.; Delgado-Navarro, M.; Sindall, R.; Cottingham, R.; Uman, A.E.; Buckley, C.A.; Yeh, D.H. The NEWgenerator non-sewered sanitation system: Long-term field testing at an informal settlement community in eThekwini municipality, South Africa. J. Environ. Manag. 2021, 296, 112921. [Google Scholar] [CrossRef]
  42. Virdis, B.; Rabaey, K.; Yuan, Z.; Keller, J. Microbial fuel cells for simultaneous carbon and nitrogen removal. Water Res. 2008, 42, 3013–3024. [Google Scholar] [CrossRef]
  43. Pous, N.; Puig, S.; Balaguer, M.D.; Colprim, J. Cathode potential and anode electron donor evaluation for a suitable treatment of nitrate-contaminated groundwater in bioelectrochemical systems. Chem. Eng. J. 2015, 263, 151–159. [Google Scholar] [CrossRef] [Green Version]
  44. Gregoire, K.P.; Glaven, S.; Hervey, W.; Lin, B.; Tender, L.M. Enrichment of a High-Current Density Denitrifying Microbial Biocathode. J. Electrochem. Soc. 2014, 161, H3049–H3057. [Google Scholar] [CrossRef]
  45. Yaqoob, A.A.; Mohamad Ibrahim, M.N.; Rafatullah, M.; Chua, Y.S.; Ahmad, A.; Umar, K. Recent Advances in Anodes for Microbial Fuel Cells: An Overview. Materials 2020, 13, 2078. [Google Scholar] [CrossRef] [PubMed]
  46. Kato, S. Influence of Anode Potentials on Current Generation and Extracellular Electron Transfer Paths of Geobacter Species. Int. J. Mol. Sci. 2017, 18, 108. [Google Scholar] [CrossRef] [PubMed]
  47. Castro, C.; Shyu, H.; Xaba, L.; Bair, R.; Yeh, D. Performance and onsite regeneration of natural zeolite for ammonium removal in a field-scale non-sewered sanitation system. Sci. Total Environ. 2021, 776, 145938. [Google Scholar] [CrossRef] [PubMed]
  48. Sindall, R.; Cottingham, R.; Arumugam, P.; Mercer, S.; Sutherland, C.; Alcock, N.; Buckley, C.; Gounden, G. Lessons learned from operating a pre-commercialisation field-testing platform for innovative non-sewered sanitation in Durban, South Africa. Water SA 2021, 47, 385–395. [Google Scholar] [CrossRef]
Figure 1. (A) Average nitrogen removal rates, anodic CE, and cathodic CE among MFC replicates. n = 4, 3, 3, and 4 for C:N ratios of 4, 8, 16, and 32, respectively; (B) concentrations of anode carbon (unfilled) and total cathode nitrogen (filled) for all replicates during 4 C:N. each shape in (B) represents a different replicate.
Water 14 03076 g001
Figure 2. (A) Phylum level and (B) genus level relative abundance, (C) species richness, and (D) diversity indices of the original inoculum for both anode and cathode, suspended biomass in the cathode, and attached biofilm in the cathode after operating for 7 months. The “Other” legend key represents the aggregate of all taxa level identification with a relative abundance < 2%. ACE = abundance-based coverage estimator.
Water 14 03076 g002
Figure 3. Nitrogen removal during an 18-day period at C:N ratios of 4, 8, 16, and 32 with a continuous flow anode and recycle batch cathode. Triangles represent NO3-N removal and circles represent TN removal. Data shown is from one replicate reactor. Ammonium and nitrite concentrations were also measured but below the detection limits, thus, they are now shown.
Water 14 03076 g003
Figure 4. Electrochemical performance of MFCs depicting (A) cathode potential and (B) current density when operated under C:N ratios of 4, 8, 16, and 32 in Phase II.
Water 14 03076 g004
Figure 5. Nitrogen removal rates in 100-mL MFCs with denitrifying biocathodes. MFCs with PEM size 4 cm2 are shown to the left and MFCs with PEM 16 cm2 are to the right.
Water 14 03076 g005
Table 1. Summary of MFC biocathode testing scheme and operation with theoretical C:N starting concentrations.
Liquid Vol. aPEM SizeReactor OperationC:N RatiosAnode CarbonCathode Nitrogen
Literscm2AnodeCathodemg C/mg Nmg C (mg COD)/Lmg NO3-N/L
Phase I0.25.0Recycle batchRecycle batch4400 (1000)100
8400 (1000)50
16800 (2000)50
32800 (2000)25
Phase II0.25.0ContinuousRecycle batch4100 (250)25
8200 (500)25
16400 (1000)25
32800 (2000)25
Phase III0.14.0Semi-batchSemi-batch8200 (500)25
0.115Semi-batchSemi-batch8200 (500)25
Notes: a anode and cathode chambers were of equal volumes.
Publisher’s Note: MDPI stays neutral with regard to jurisdictional claims in published maps and institutional affiliations.

