Article

Insight into the Removal of Enoxacin in an Anaerobic Sulfur-Mediated Wastewater Treatment System: Performance, Kinetics and Mechanisms

1
School of Ecology, Shenzhen Campus, Sun Yat-sen University, Shenzhen 518107, China
2
School of Environmental Science and Engineering, Sun Yat-sen University, Guangzhou 510006, China
3
Guangdong Provincial Key Laboratory of Environmental Pollution Control and Remediation Technology, Sun Yat-sen University, Guangzhou 510006, China
*
Authors to whom correspondence should be addressed.
These authors contributed equally to this work.
Water 2022, 14(18), 2896; https://doi.org/10.3390/w14182896
Submission received: 24 July 2022 / Revised: 4 September 2022 / Accepted: 9 September 2022 / Published: 16 September 2022

Abstract

:
The removal of enoxacin (ENO), a broad-spectrum fluoroquinolone antibiotic, was firstly examined in a sulfate-reducing up-flow sludge bed (SRUSB) bioreactor over a long-term operation (366 days). Over 94% of the ENO was removed in the SRUSB bioreactor via adsorption and biodegradation at different initial ENO concentrations (i.e., 25–1000 μg/L). Based on the results of the batch tests, the sulfate-reducing sludge exhibited a high ENO adsorption capacity within a kd of 22.7–28.9 L/g-SS. The adsorption of ENO by the sulfate-reducing sludge was a spontaneous (ΔG° < 0 KJ/mol) and exothermic (ΔH° < 0 KJ/mol) process including physisorption and chemisorption (absolute value of ΔH° = 51.882 KJ/mol). Moreover, ENO was effectively biodegraded by the sulfate-reducing sludge within specific rates of 2.5–161.3 μg/g-SS/d. The ENO biodegradation process in the sulfate-reducing sludge system was most accurately described by the first-order kinetic model. Collectively, our findings provide insight into the applicability of a sulfate-reducing sludge system for ENO-contaminated wastewater treatment.

1. Introduction

Environmental pollution due to the extensive use of antibiotics has recently become a topic of wide concern [1]. The residue of antibiotics in the environment can facilitate the transmission of antibiotic resistance genes (ARGs), which pose a serious threat to the health of both humans and the ecosystem [2,3]. Fluoroquinolones (FQs) account for 17% of the global market in antibiotic consumption [4], and they are the third largest group of antibiotics worldwide. Enoxacin (ENO), an oral broad-spectrum FQ, which is commonly used to treat respiratory and urinary tract infections [5], has frequently been detected in aquatic environments, including surface water, groundwater and hospital and pharmaceutical wastewaters as well as municipal wastewater treatment plants (WWTPs) [6,7,8,9], thus attracting increasing attention among the scientific community [10,11].
WWTPs are among the major sources of environmental antibiotic pollution [12]. Conventional biological wastewater treatment processes, which show advantages in the removal of organic matter and nutrients, are widely applied in global WWTPs, but they cannot effectively remove emerging pollutants such as antibiotics [4,12]. Therefore, the development of a biotechnology to remove organic matter, nutrients and antibiotics is imperative. Recently, a sulfate-reducing sludge system with inherent advantages (e.g., less sludge production, low energy consumption and high tolerance toward antibiotics) has been widely applied, attracting significant attention [13,14,15]. Moreover, in our previous study, we found that sulfamethoxazole (SMX) and ciprofloxacin (CIP) can be effectively removed via adsorption and biodegradation in the sulfate-reducing sludge system [16,17], thus demonstrating the potential applicability of sulfur-mediated sludge systems for the treatment of antibiotic-contaminated wastewater.
Several studies have evaluated the removal of FQ antibiotics (including ENO) in biological treatment processes [18,19] and reported that adsorption was the main removal pathway of FQ antibiotics [20,21]. Li and Zhang [22] found that FQ antibiotics were removed by rapid adsorption (above 90%) in an aerobic sludge system in 15 min at an initial FQ antibiotic concentration of 100 μg/L. Zhou et al. [23] also found that adsorption was the primary removal route of FQ antibiotics in aerobic, anoxic and anaerobic methanogenic sludges. Moreover, a 43.8%–60% FQ antibiotic biodegradation was achieved in aerobic and nitrifying sludge at initial FQ antibiotic concentrations of 500 μg/L using batch tests [24]. However, very few studies have characterized the removal mechanisms of FQ antibiotics (especially ENO) in sulfate-reducing sludge systems including adsorption and biodegradation [25].
Therefore, this study sought to characterize the removal mechanisms of ENO (physical and chemical properties of ENO were shown in Table S1) in sulfate-reducing sludge systems, especially adsorption and biodegradation. Specifically, we examined ENO removal via a long-term operation of a sulfate-reducing up-flow sludge bed (SRUSB) bioreactor. Additionally, a series of batch tests were conducted to investigate the roles and characteristics of ENO adsorption and biodegradation in a sulfate-reducing sludge system. Moreover, different models were employed to describe the adsorption and biodegradation kinetics of ENO in the sulfate-reducing sludge system. Taken together, our findings demonstrate the potential of sulfur-mediated biological processes for FQ antibiotic-contaminated wastewater treatment.

2. Materials and Methods

2.1. SRUSB Bioreactor Setup and Operation

A lab-scale SRUSB bioreactor with a working volume of 1.08 L (Figure S1 in the Supplementary Materials) was seeded with sulfate-reducing bacteria (SRB)-enriched sludge taken from a mother SRUSB in our laboratory. The bioreactor was fed with the synthetic wastewater, which contained different concentrations of ENO (i.e., 25–1000 μg/L, according to ENO concentrations in sewage, pharmaceutical and hospital wastewaters [4,7,8,26]) and continuously operated at a hydraulic retention time (HRT) of 6 h for 366 days. The characteristics of the synthetic wastewater are shown in Table S2 in the Supplementary Materials. Specifically, the ENO concentrations were 0 μg/L in Stage 1 (Day 1 to 55); 28.6 ± 2.9 μg/L in Stage 2 (Day 56 to 107); 45.6 ± 1.2 μg/L in Stage 3 (Day 108 to 160); 117.64 ± 5.0 μg/L in Stage 4 (Day 161 to 211); 247.1 ± 4.0 μg/L in Stage 5 (Day 212 to 262); 492.1 ± 6.7 μg/L in Stage 6 (Day 263 to 314); 1009.3 ± 13.4 μg/L in Stage 7 (Day 315 to 366). The SRUSB bioreactor was operated with a sludge retention time (SRT) of 25 days, and the average concentration of the volatile suspended solids (VSS) was 6.9 ± 0.7 g/L (a VSS/suspended solids (SS) ratio of 0.68 ± 0.01) in the SRUSB bioreactor during the 366 days of operation. The influent and effluent samples were collected from the SRUSB bioreactor on alternate days, and routine analyses (i.e., sulfate, thiosulfate, sulfite, and chemical oxygen demand (COD) concentrations) were conducted following standard procedures [27] in addition to ENO analyses. Sludge samples were collected weekly to examine the ENO concentration. More details on the analysis protocol are provided in the section of ENO analyses in the Supplementary Materials. Finally, the removal efficiency and specific removal rate of ENO in the SRUSB bioreactor were determined (more details were shown in the section of ENO removal efficiency and specific removal rate in the Supplementary Materials).

2.2. Batch Experiments

2.2.1. Adsorption and Biodegradation

A series of batch experiments, including three groups, were conducted to investigate the mechanisms of ENO removal in the sulfate-reducing sludge system (see Table S3 in the Supplementary Materials for more details). Group I, without sulfate-reducing sludge, was used as a control to examine the possible hydrolysis of ENO. Group II was operated for 24 h to examine the adsorption of ENO in the sulfate-reducing sludge system (within 0.1% NaN3 to inhibit microbial activity). Different from Group I and Group II, Group III (operated for 5 days) was conducted to investigate the biodegradation of ENO. The average concentration of the suspended solids was 1.5 g-SS/L in each serum bottle, and more details on the experiment can found in Jia et al. [25]. The concentrations of ENO evaluated in this study (100–5000 μg/L) were higher than those in the SRUSB bioreactor, as previous studies have indicated that FQ antibiotics (including ENO) can be quickly adsorbed by biological sludges in batch tests with adsorption capacities as high as 1000 μg/g-SS [17,21,28]. In each serum bottle, 2 mL of mixed liquor samples were regularly taken to determine the ENO concentration in the aquatic and solid phases, after which we determined the adsorption and biodegradation efficiencies and specific rates (see ENO removal efficiency and specific removal rate section in the Supplementary Materials).

2.2.2. Adsorption Isotherms and Thermodynamics

To gain insight into the adsorption isotherms and thermodynamics of ENO in the sulfate-reducing sludge system, a series of batch tests were conducted at different temperatures (5–35 °C) and at different initial ENO concentrations (i.e., 100–5000 μg/L). The batch tests followed the same experimental program for Group II as described above. The Henry, Freundlich and Langmuir adsorption isotherms (Equations (S7)–(S9) in the Supplementary Materials) were used to investigate the adsorption behavior and capacity of ENO by the sulfate-reducing sludge. The thermodynamic parameters related to the feasibility and properties of the adsorption process, including Gibbs free energy (ΔG°), enthalpy change (ΔH°) and entropy change (ΔS°), were calculated as described by Ahmed [29] (details in the section of Adsorption isotherms and thermodynamics in the Supplementary Materials).

2.3. Kinetic Models

2.3.1. Adsorption Kinetic Models

Pseudo-first-order and pseudo-second-order kinetic models were selected to identify the ENO adsorption kinetics in the sulfate-reducing sludge system. These two kinetic models can be expressed as follows:
l n q e q t = l n q e k 1 t
t q t = 1 k 2 q e 2 + 1 q e t
where k 1 is the rate constant of the pseudo-first-order model (1/h); k 2 is the rate constant of the pseudo-second-order model (g/μg/h); q e is the mass of the ENO adsorbed onto the sulfate-reducing sludge at equilibrium (μg/g-SS); q t is the mass of the ENO adsorbed onto the sulfate-reducing sludge at a given time, t (μg/g-SS).
Moreover, the adsorption coefficient (kd, L/g-SS), which is commonly used to evaluate the ENO adsorption capacity, can be calculated by Equation (3) as follows:
k d = C 0 C e X S S × C e
where C 0 and C e are the ENO concentrations at the initial and equilibrium conditions (μg/L), respectively; X S S is the total suspended solids (SS) concentration in the mixed liquor (g-SS/L).

2.3.2. Biodegradation Kinetic Models

Three biodegradation kinetic models, zero-, first- and second-order kinetic models (Equations (4)–(6), respectively), were used to characterize the biodegradation process of ENO in the sulfate-reducing sludge system.
d c d t = k 0
d c d t = k 1 c
d c d t = k 2 c 2
where c is the ENO concentration at time t (μg/L); k 0 is the zero-order rate constant (μg/L/d); k 1 is the first-order rate constant (1/d); k 2 is the second-order rate constant (L/(μg·d)). Based on the three kinetic models, the half-lives (t1/2) of ENO can be derived through the following equations:
t   1 / 2 zero = C 0 2 k 0
t   1 / 2 first = l n 2 k 1
t   1 / 2 sec ond = 1 k 2 C 0
where C 0 is the ENO concentration at the initial and equilibrium conditions (μg/L); t   ( zero ) is the half-life of ENO based on the zero-order kinetic model (d); t   ( first ) is the half-life of ENO based on the first-order kinetic model (d);   t   ( sec ond ( is the half-life of ENO based on the second-order kinetic model (d).

2.4. Microbial Community Analyses

The microbial community at each stage in the SRUSB bioreactor was analyzed by 16S rRNA-targeted Illumina sequencing. Sludge samples were collected from the SRUSB bioreactor at the end of each stage (i.e., Day 55 in Stage 1; Day 107 in Stage 2; Day 160 in Stage 3; Day 211 in Stage 4; Day 262 in Stage 5; Day 314 in Stage 6; Day 366 in Stage 7) for DNA extraction. Total genomic DNA from each sludge sample was extracted using the PowerSoil DNA isolation kit (MoBio Laboratories, Carlsbad, CA, USA) as per the manufacturer’s protocols. DNA samples were amplified in triplicate by polymerase chain reaction (PCR) using the primer set F515 and R926 for the V4–V5 regions of the 16S rRNA gene; then, the PCR products were sequenced by an Illumina MiSeq platform (Illumina Inc., San Diego, CA, USA). Raw MiSeq sequencing data were processed and analyzed using the Mothur software package (v.1.25.1).

2.5. Analytical Methods

Sulfate, thiosulfate and sulfite in the aqueous phase were determined using an ion chromatograph as described by Jia et al. [25]. The total dissolved sulfide, COD, SS and VSS concentrations were analyzed following standard procedures [27]. The ENO in the aqueous phase (influent and effluent) and the sludge samples was determined via ultra-performance liquid chromatography (UPLC) with a DAD detector (Dionex, UltiMate 3000, Sunnyvale, CA, USA) using an Acclaim120 C18 column (2.1 × 150 mm, 3 μm, Dionex, Sunnyvale, CA, USA); 75% ultrapure water with 0.1% formic acid was used as for mobile phase A, and 25% acetonitrile was used for mobile phase B. The parameters for the flow rate, column oven temperature, injection volume and monitoring wavelength were 0.3 mL/min, 30 ℃, 25 μL and 285 nm, respectively. More details on the sample preparation method and analysis of the sludge samples are provided in the section of ENO analyses in the Supplementary Materials.

3. Results and Discussion

3.1. Performance of the SRUSB Bioreactor

The performance of COD removal, sulfate reduction and ENO removal by the SRUSB bioreactor was continuously monitored over the long-term operation with different ENO concentrations (i.e., 25–1000 μg/L). Compared to Stage 1 (without ENO addition), COD removal and sulfate reduction in Stages 2, 3, 4, 5, 6 and 7 were not significantly different (p > 0.05). The COD removal and sulfate reduction efficiencies were approximately 80% and 60% over long-term operation (see Table S4 in the Supplementary Materials), respectively, which suggests that ENO addition did not block COD removal and sulfate reduction. Moreover, our study characterized the microbial community’s composition in the bioreactor at each stage, and the total relative abundance of the SRB did not decrease over long-term ENO exposure, suggesting that ENO addition did not inhibit the SRB (Figure S2 in the Supplementary Materials). These results indicate that the SRB (e.g., Desulfobacter) in the SRUSB bioreactor showed a high tolerance toward FQ antibiotics (i.e., ENO) over long-term operation, which is consistent with our previous studies [17,30].

3.2. Removal of ENO in the SRUSB Bioreactor

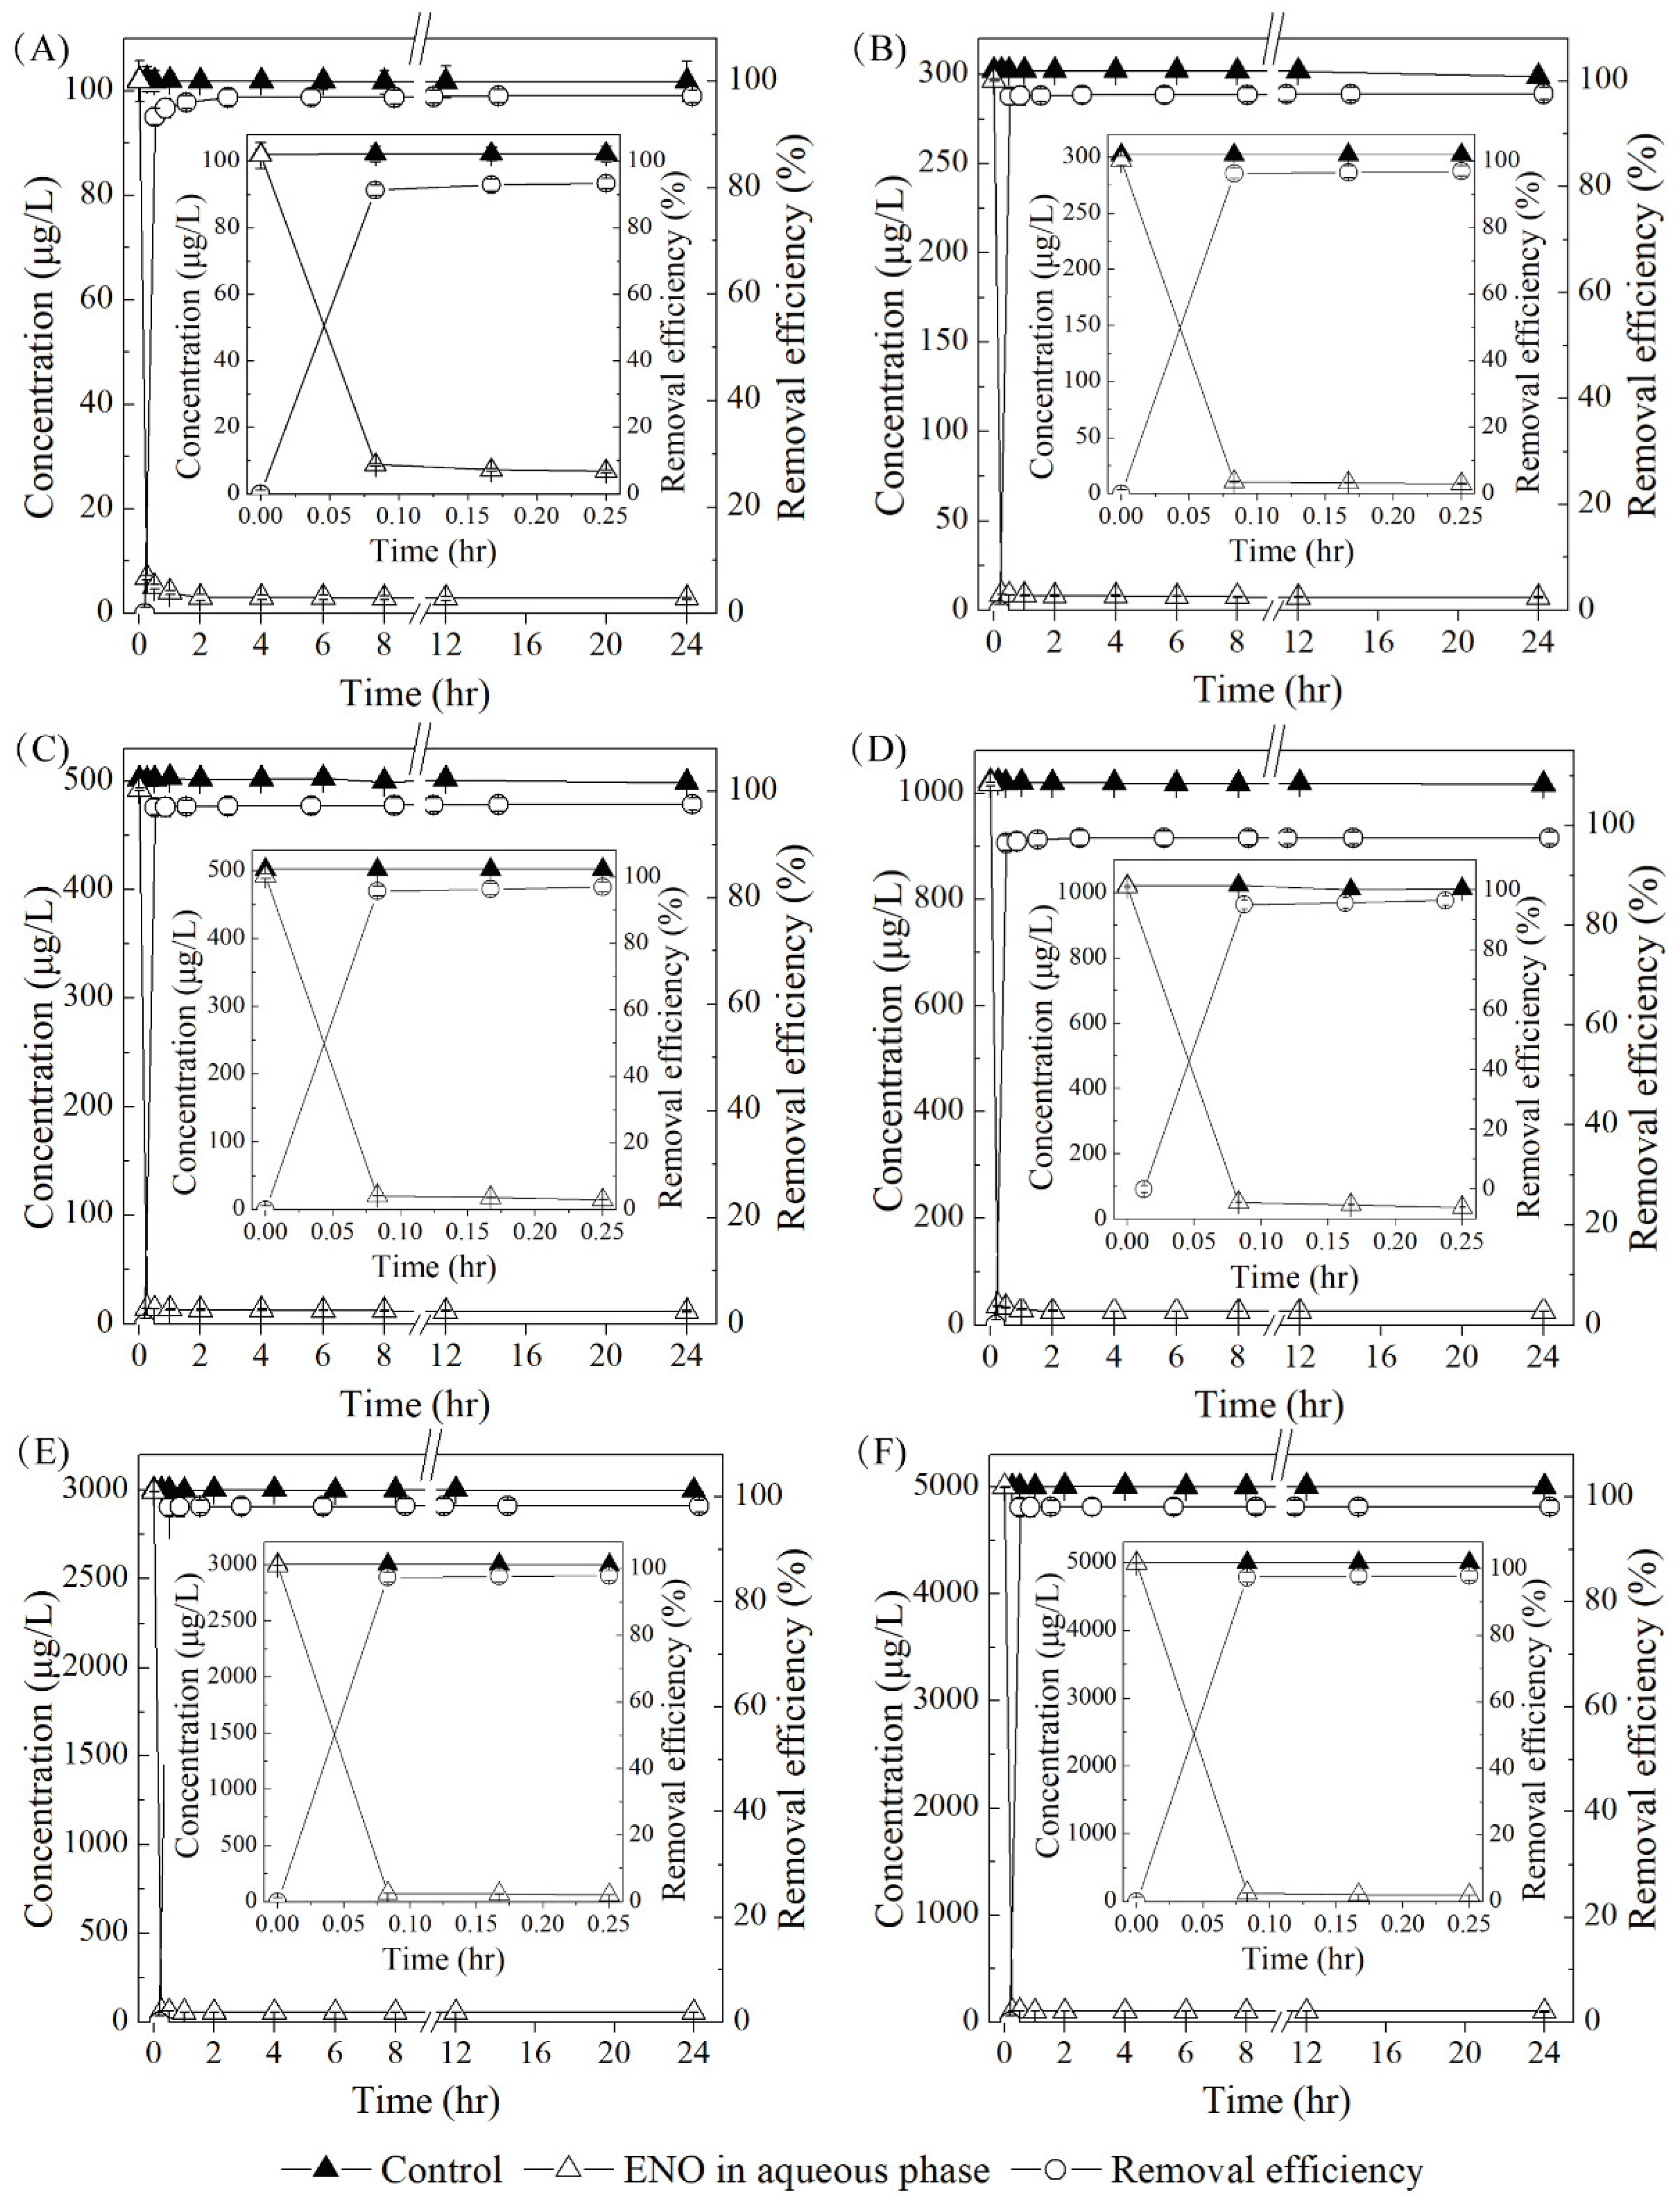
It can be seen that over 90% of the ENO was removed in the SRUSB bioreactor during the long-term operation at different ENO concentrations (Figure 1). According to our batch test results (control test, as shown in Figure 2), ENO removal occurred via hydrolysis and photodegradation could be ignored. Therefore, the removal of ENO in the SRUSB bioreactor was mainly attributed to adsorption and biodegradation. Moreover, the specific removal rate of ENO in the SRUSB bioreactor increased from 13.1 ± 0.3 μg/g-SS/d in Stage 2 to 434.7 ± 4.6 μg/g-SS/d in Stage 7. Interestingly, the biodegradation efficiency of ENO increased from 1.9 ± 0.9% in Stage 2 to 16.9 ± 0.7% in Stage 7, with increasing influent ENO concentrations.
Several studies reported that FQ antibiotics were predominately removed via adsorption in biological wastewater treatment processes [23,31]. Li and Zhang [22] observed that more than 90% of FQ antibiotics, including CIP, norfloxacin (NOR) and ofloxacin (OFL), at an initial concentration of 100 μg/L, were quickly adsorbed (i.e., within 15 min) by the sludge. Thus, FQ antibiotics are frequently detected in the sludge of WWTPs [32]. Obviously, adsorption appears to play an important role in the removal of FQs in biological wastewater treatment processes. However, studies on the biodegradation of FQs in biological wastewater treatment processes are limited. Dorival-García et al. [19] found that 14.9–43.8% of FQs (including CIP, NOR, OFL, moxifloxacin, pipemidic acid and piromidic acid, at an initial concentration of 500 μg/L) were biodegraded by aerobic sludge in a membrane bioreactor, and the specific biodegradation rates were 2.7–7.8 μg/g-SS/d. However, very few studies have been reported on the biodegradation of ENO [25]. ENO biodegradation in the sulfate-reducing sludge system was observed, and the biodegradation efficiency and specific rate varied from 1.9% to 16.9% and from 0.3 to 73.5 μg/g-SS/d, respectively, depending on the influent ENO concentration (i.e., from 25 to 1000 μg/L). These findings indicate that the sulfate-reducing sludge system provides a promising approach for the removal of FQ antibiotics from wastewater. To further explore the removal mechanisms and kinetics of ENO in the sulfate-reducing sludge system, a series of batch experiments were conducted and are discussed in the following sections.

3.3. ENO Adsorption

3.3.1. ENO Adsorption and Kinetics

As shown in Figure 2, more than 97% of the ENO was adsorbed by the inactivated sulfate-reducing sludge in 15 min at different ENO concentrations (i.e., 100–5000 μg/L). This result is consistent with previous studies which demonstrated that FQ antibiotics were quickly adsorbed by sludges in the first 60 min in batch experiments [22,24,28]. Biological sludges exhibit a high adsorption potential toward FQ antibiotics, which can be assessed by the calculated adsorption coefficient (kd) values. The kd values of ENO in this study were 22.7–28.9 L/g-SS at different initial ENO concentrations (details shown in Table S5 in the Supplementary Materials) and were higher than those of FQ antibiotics in aerobic (kd = 0.3–22.5 L/g-SS) [22,23,28], anoxic (kd = 0.3–22.5 L/g-SS) [23,28] and anaerobic methanogenic (kd = 0.7–14.6 L/g-SS) [23] sludge systems. The differences in these results are possibly due to the variations in the characteristics of the sludges or the experimental conditions applied, which could affect interactions between the FQ antibiotics and the sludges such as the cation exchange, ion bridging, surface complexation, ion–dipole forces and the hydrogen bonding [20,33,34,35].
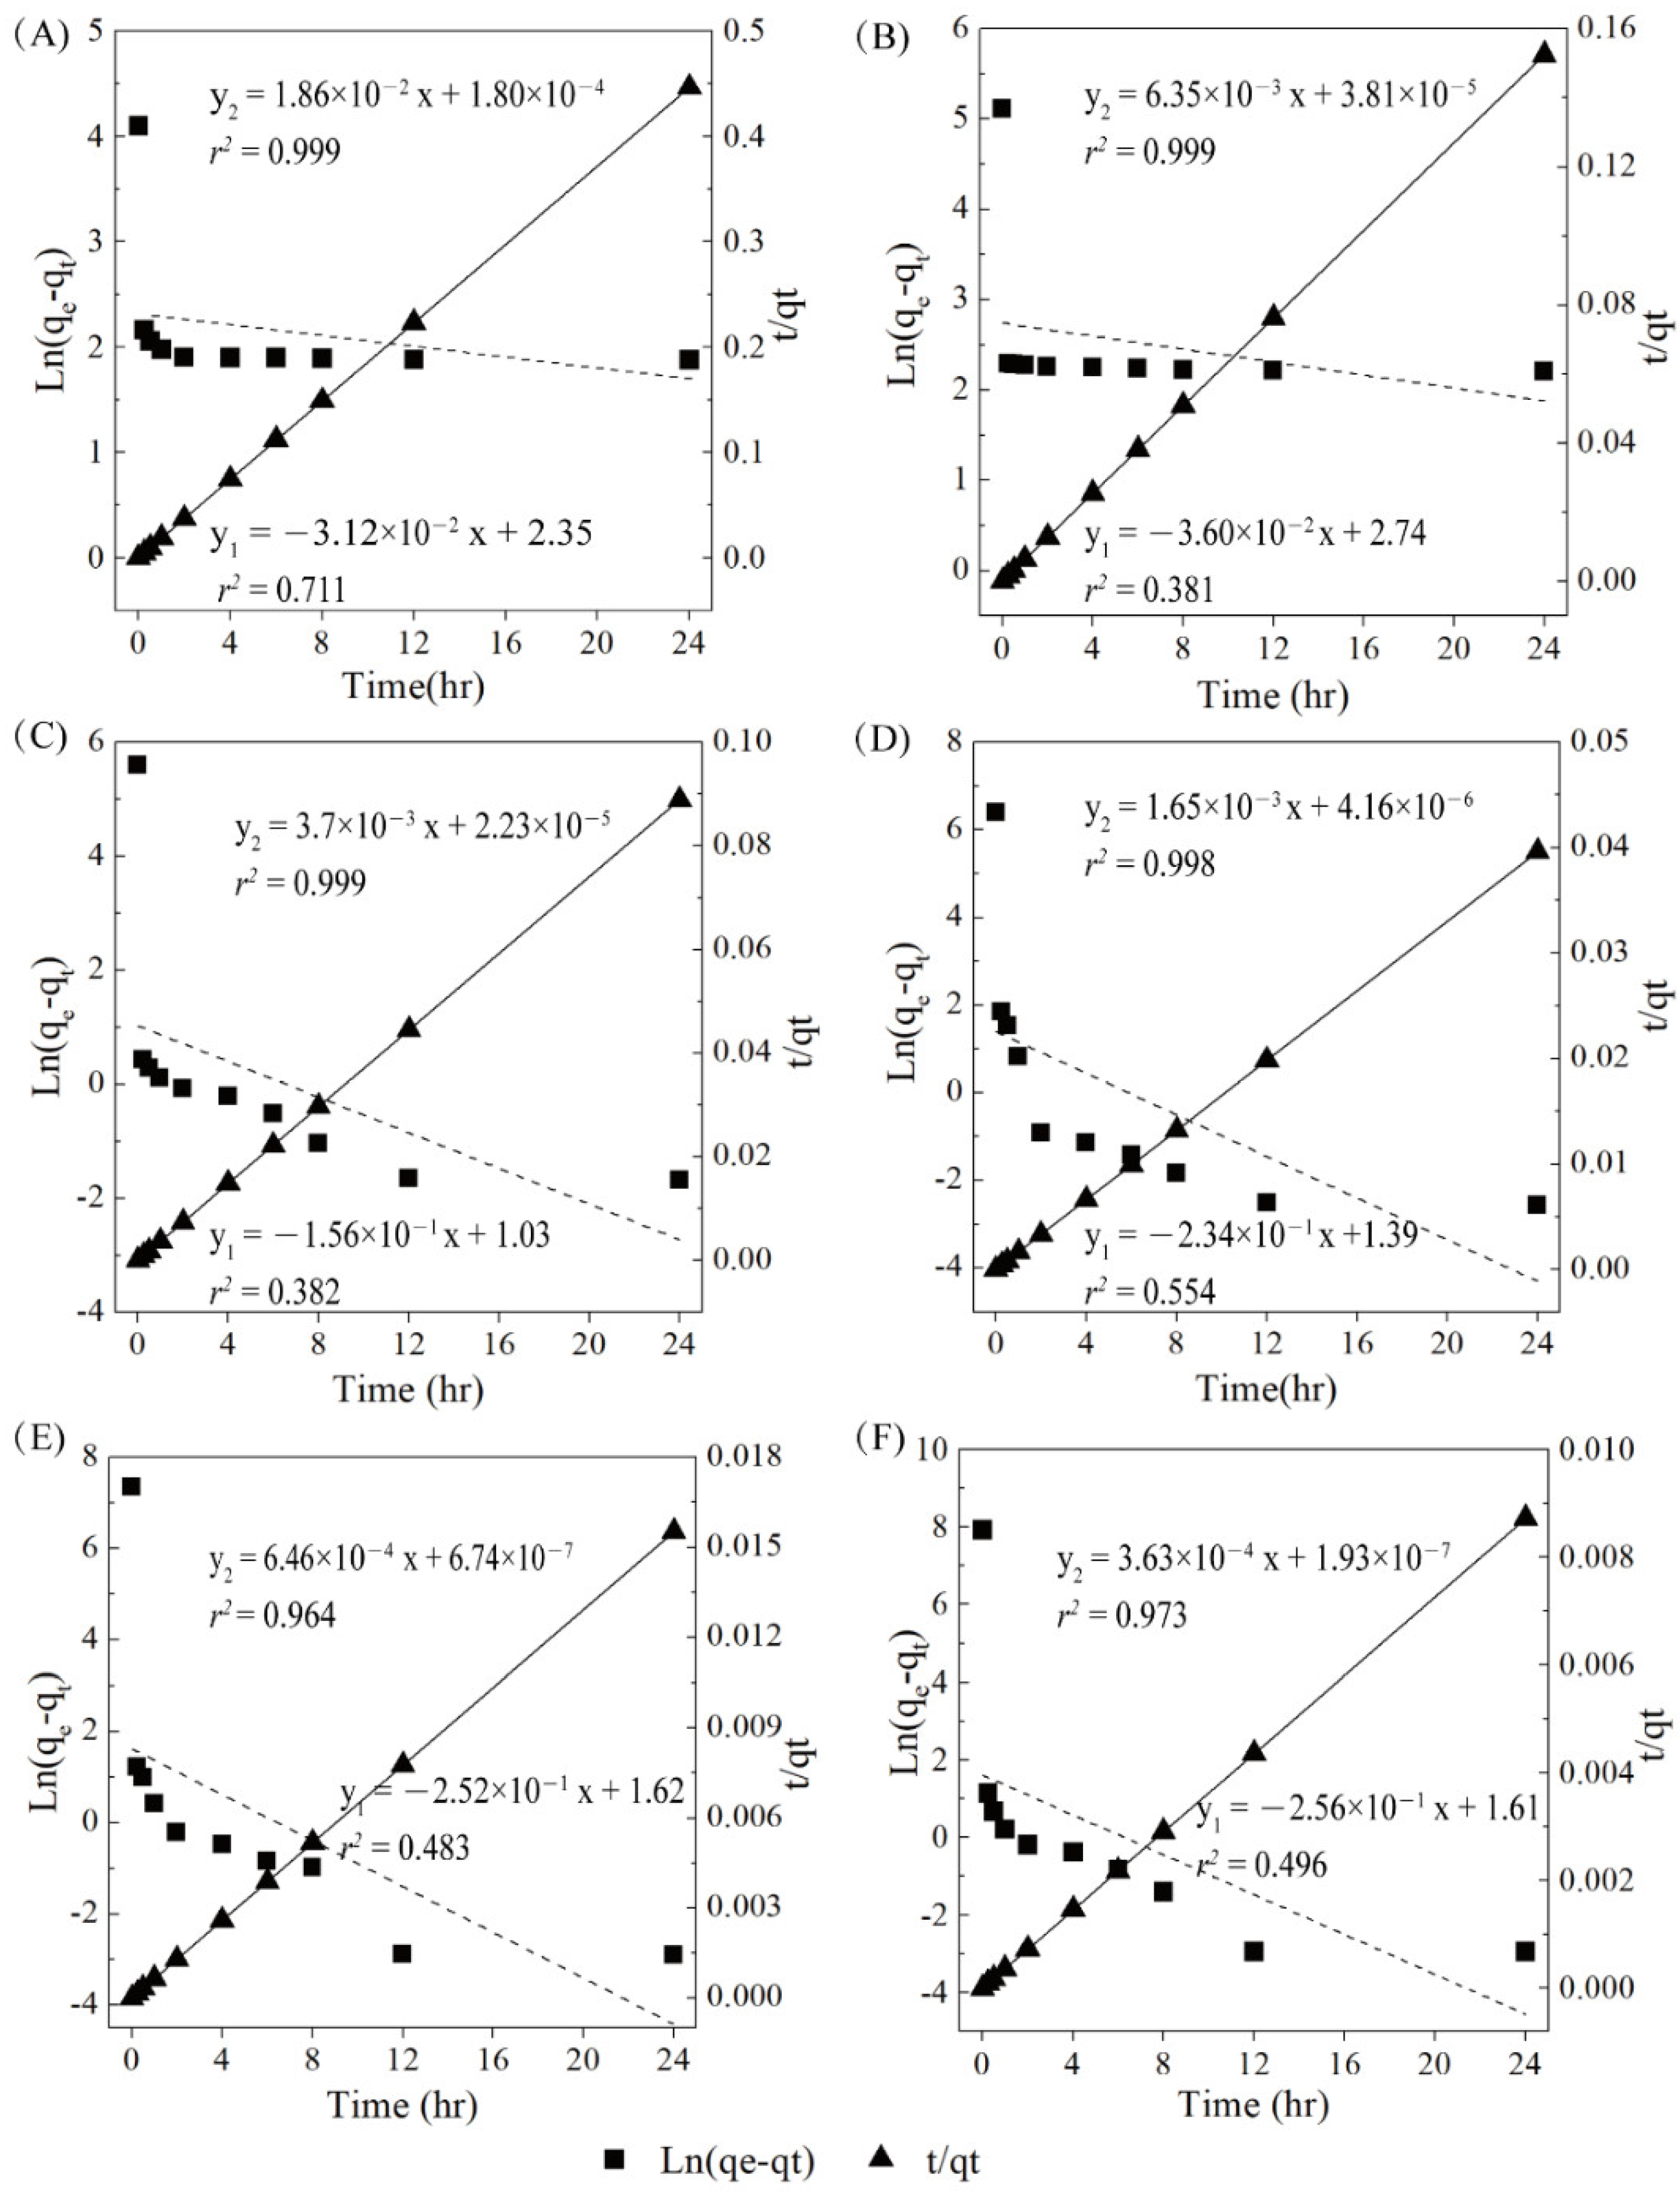
In our study, pseudo-first-order and pseudo-second-order kinetic models were selected to evaluate the ENO adsorption kinetics in the sulfate-reducing sludge system. As shown in Figure 3A–F, the ENO sorption data (i.e., ENO concentrations of 100–5000 μg/L) were fitted to these two kinetic models. However, in contrast to the pseudo-first-order model, the adsorption of ENO by the sulfate-reducing sludge was more accurately described by the pseudo-second-order model (correlation coefficient r2 > 0.96) (Table S5 in the Supplementary Materials). Moreover, the equilibrium adsorption amounts (qe) obtained using the pseudo-second-order model (as shown in Table S5 in the Supplementary Materials) were close to the experimental values (with a relative error < 5.0%). These findings suggest that the ENO adsorption rate by the sulfate-reducing sludge was mainly controlled by chemisorption rather than physisorption [36]. To further investigate the adsorption mechanism of ENO by the sulfate-reducing sludge, the characteristics of the adsorption isotherms and thermodynamics were examined and are discussed in the following section.

3.3.2. ENO Adsorption Isotherms and Thermodynamics

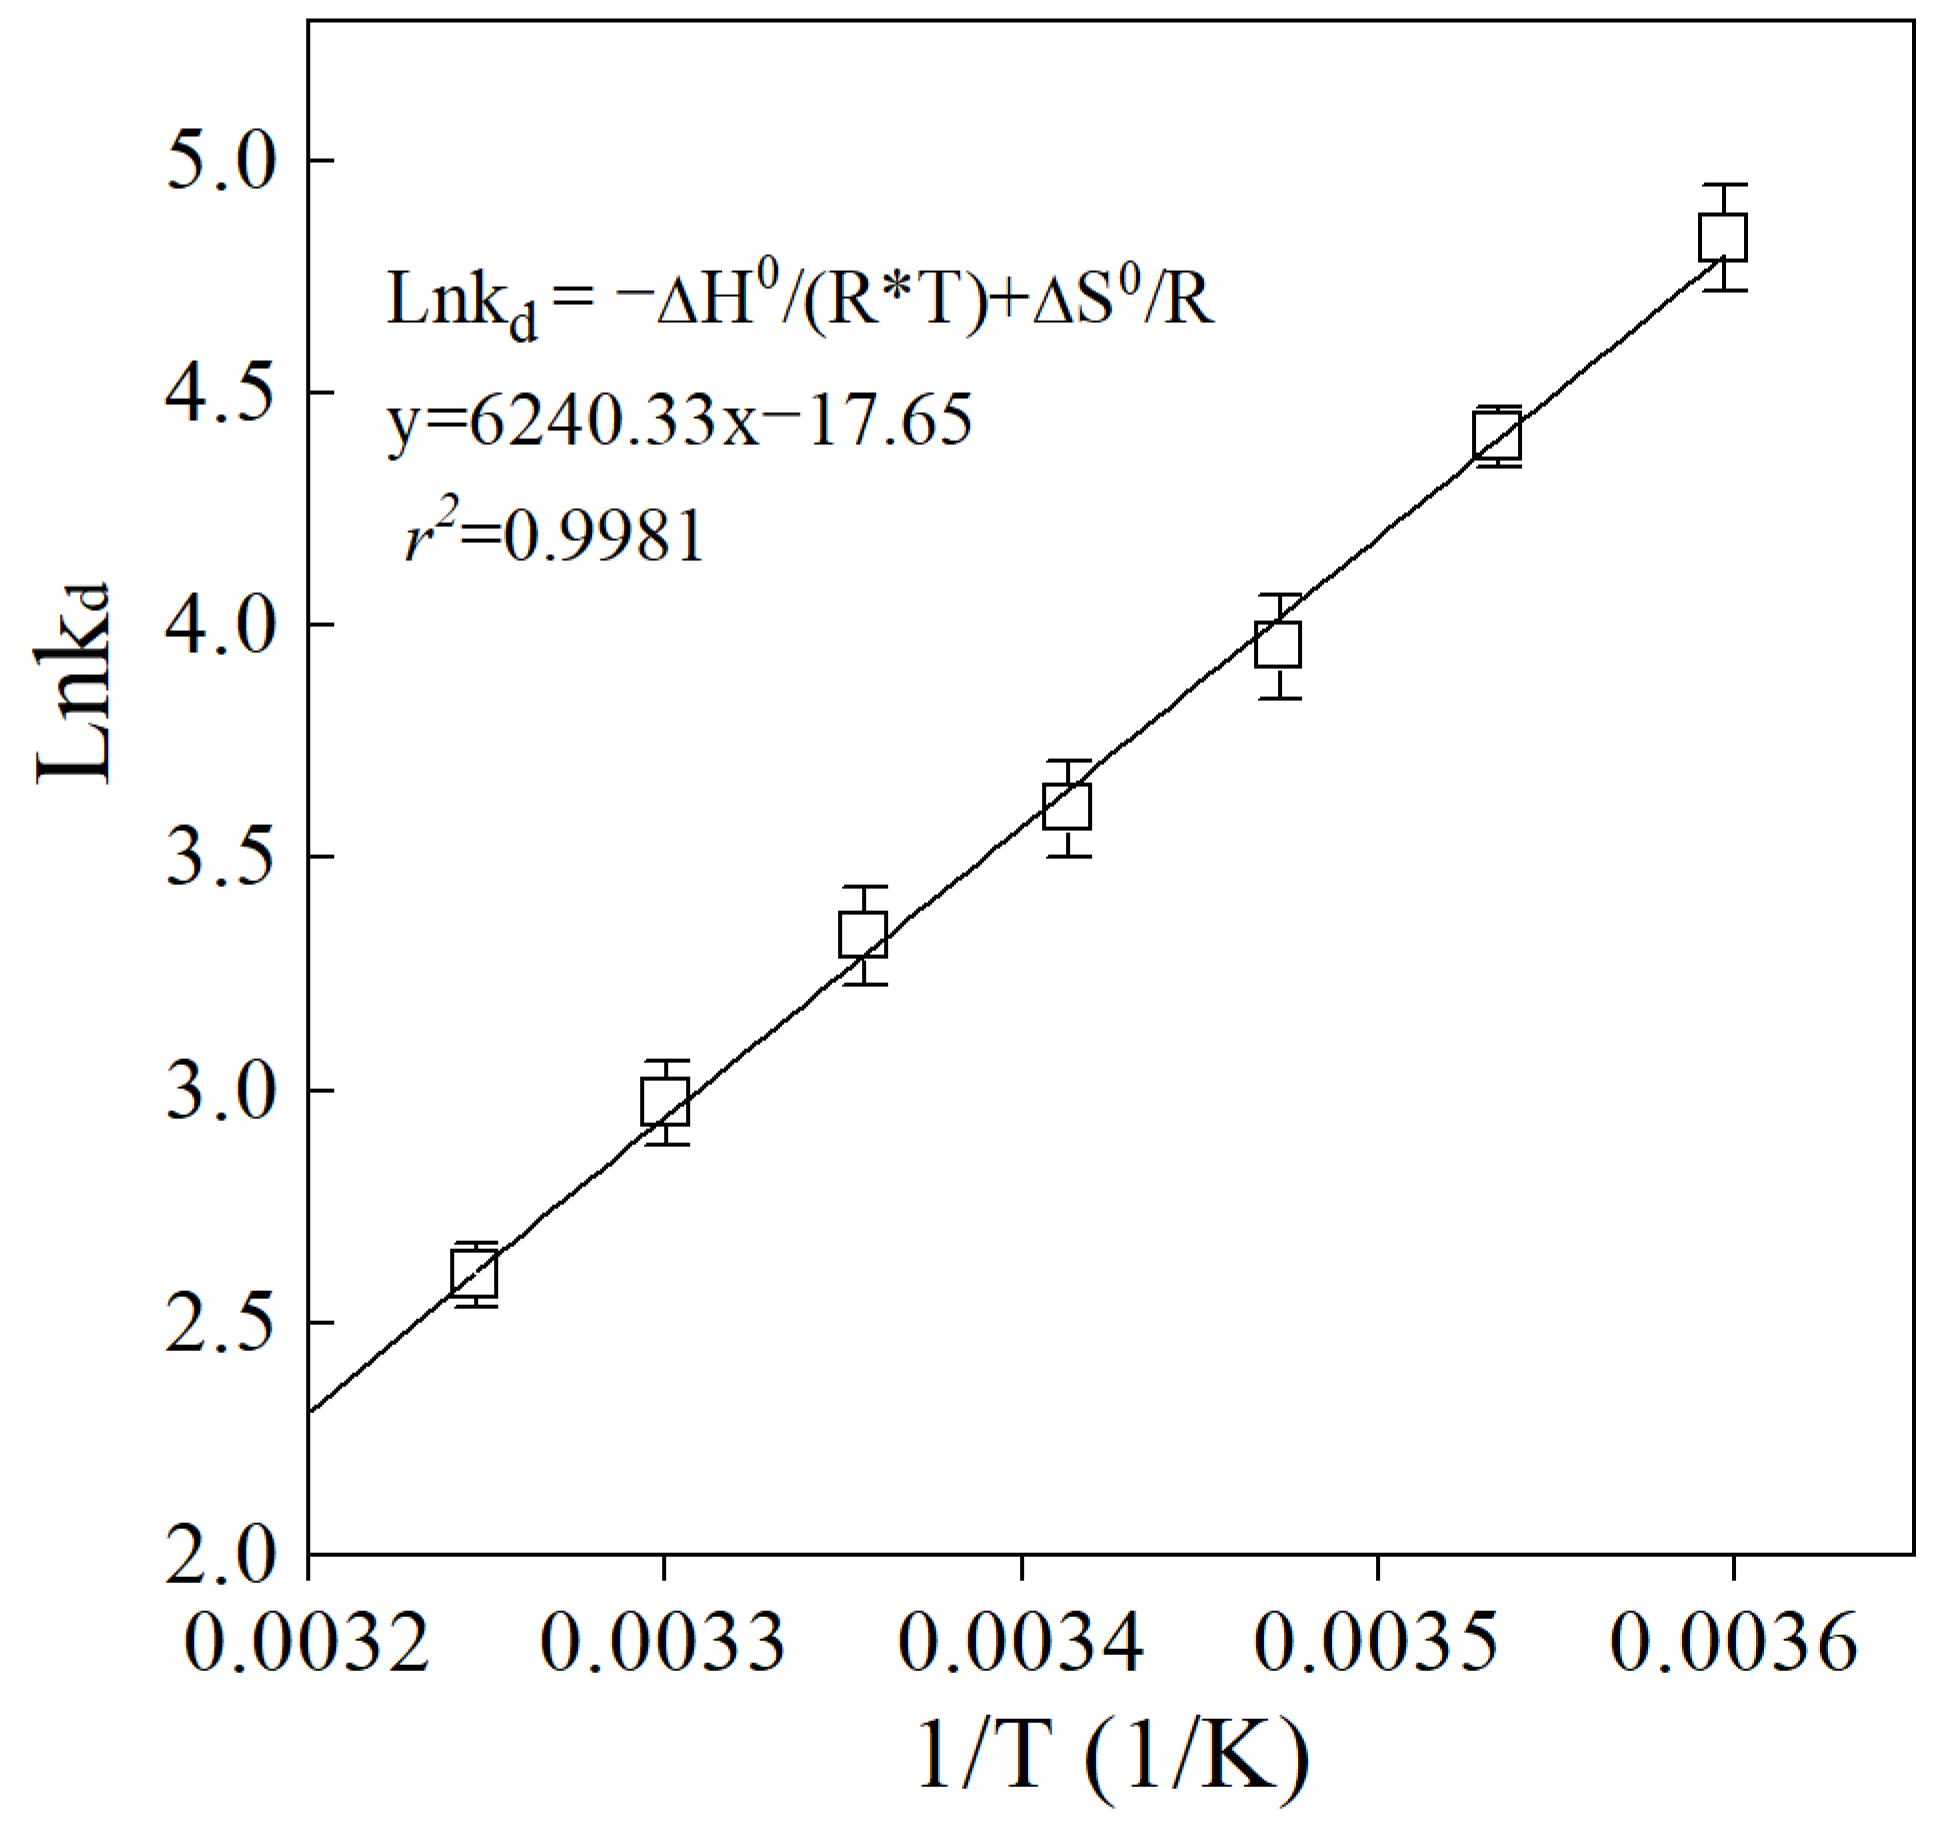
The ENO adsorption isotherms by the sulfate-reducing sludge were evaluated using the Henry, Freundlich and Langmuir adsorption isotherms via batch experiments at different reaction temperatures (i.e., 5–35 °C). The Henry and Freundlich isotherms were well correlated with the adsorption of ENO by the sulfate-reducing sludge based on the correlation coefficient r2 (Table S6 in the Supplementary Materials), suggesting that the adsorption process between ENO and the sulfate-reducing sludge was dominated by multilayer adsorption rather than monolayer adsorption [36,37]. Additionally, the adsorption thermodynamics of ENO were also analyzed to gain insight into the adsorption process as shown in Figure 4 and Table S7 in the Supplementary Materials. The adsorption of ENO by the sulfate-reducing sludge was a spontaneous and exothermic process according to the obtained negative values of Gibbs free energy (ΔG°) and enthalpy change (ΔH°) [28,38,39]. The absolute value of ΔH° is commonly used to distinguish physisorption (adsorption heat within a 0–20 KJ/mol range) and chemisorption (adsorption heat within an 80–400 KJ/mol range) [40,41,42]. The absolute value of the enthalpy change (i.e., ΔH° = 51.882 KJ/mol) of the ENO adsorption by the sulfate-reducing sludge was in the range of 20–80 KJ/mol, suggesting that the adsorption process of ENO by the sulfate-reducing sludge involved both physisorption and chemisorption [43].
In conclusion, the above results suggest that the adsorption of ENO by sulfate-reducing sludge is a spontaneous (ΔG° < 0 KJ/mol), exothermic (ΔH° < 0 KJ/mol) and multilayer adsorption process involving both physisorption and chemisorption, and the adsorption rate was likely controlled by chemisorption.

3.4. ENO Biodegradation

Based on our results from the SRUSB bioreactor experiments (Figure 1), ENO exhibited biodegradation potential in the sulfate-reducing sludge system. Thus, to gain insight into the dynamics of ENO biodegradation in the system, a series of batch experiments were conducted (details are described in Section 2.2). As shown in Figure 5, ENO biodegradation started 24 h after achieving adsorption equilibrium, and it was a slow process compared to adsorption. The biodegradation efficiencies of ENO (at Day 5) in the sulfate-reducing sludge system were 17.9 ± 2.3%, 18.1 ± 1.7%, 21.8 ± 2.5%, 24.3 ± 3.1%, 23.9 ± 0.8% and 24.1 ± 1.2% at initial ENO concentrations of 100–5000 µg/L. The specific biodegradation rates of ENO were 2.5–161.3 μg/g-SS/d in this study, and they were higher than for FQ antibiotics in aerobic (1.3–7.8 μg/g-SS/d) and anoxic (0–0.7 μg/g-SS/d) sludge systems in batch tests [24,28]. These differences could be attributed to variations in the functional microorganisms in the biological sludge systems [44,45].
To investigate the biodegradation kinetics of ENO in the sulfate-reducing sludge system, zero-, first- and second-order kinetic models were selected. The biodegradation of ENO at different initial concentrations was well fitted with the first-order kinetic model, with an r2 correlation coefficient of 0.982–0.997 (Table S8 in the Supplementary Materials). Furthermore, the half-lives (t1/2) of ENO in this study were between 11.61 and 22.26 d, suggesting that ENO biodegradation is a slow process. Dorival-García et al. [24] also found that the half-lives of FQ antibiotics were 5.66–13.75 d in an aerobic sludge system at initial FQ antibiotic concentrations of 500 μg/L within SS of 7 g/L. This suggests that FQ antibiotics were slowly biodegraded in the biological sludge treatments [28,46].

4. Conclusions

The present study characterized the removal of ENO in an anaerobic sulfate-reducing sludge system via the long-term operation of a SRUSB bioreactor in conjunction with batch experiments. ENO was effectively removed in the sulfate-reducing sludge system by quick sorption and slow biodegradation. Moreover, the adsorption of ENO by the sulfate-reducing sludge was a spontaneous, exothermic and multilayer adsorption process involving both physisorption and chemisorption, and the adsorption rate was likely controlled by chemisorption. Additionally, biodegradation also played an important role in ENO removal. This study elucidated the removal mechanisms and kinetics of ENO in a sulfate-reducing sludge system and provides a novel energy-efficient sulfur-mediated biological process for FQ-contaminated wastewater treatment, such as for pharmaceutical and hospital wastewaters.

Supplementary Materials

The following supporting information can be downloaded at: https://www.mdpi.com/article/10.3390/w14182896/s1, Figure S1: Schematic diagram of the lab-scale SRUSB bioreactor, Figure S2: Microbial community characterization of sulfate-reducing sludge samples from SRUSB bioreactor at each stage at phylum (A) (relative abundance >0.1%); and genus (relative abundance >0.1%) (B) levels. Table S1: Physical and chemical properties of ENO, Table S2: Composition of synthetic wastewater, Table S3: Batch experimental program for ENO adsorption and biodegradation by sulfate-reducing sludge, Table S4: Performance of SRUSB bioreactor at different initial ENO concentrations, Table S5: Adsorption kinetic (pseudo-first-order and pseudo-second-order) parameters for ENO adsorption onto sulfate-reducing sludge, Table S6: Adsorption isotherm (Henry, Freundlich and Langmuir) parameters of ENO by sulfate-reducing sludge under different temperature, Table S7: Thermodynamic parameters of ENO adsorption onto sulfate-reducing sludge, Table S8: Biodegradation kinetic (zero, first and second-order) parameters for ENO in sulfate-reducing sludge system.

Author Contributions

Formal analysis, Y.Y., Y.O. and B.Y.; Funding acquisition, Y.J. and H.L.; Investigation, Y.Y.; Project administration, Y.J.; Supervision, Y.J.; Writing—original draft, Y.Y. and Y.O.; Writing—review and editing, B.Y., Y.J., L.S. and H.L. All authors have read and agreed to the published version of the manuscript.

Funding

The study is being supported by the Stabilization Support Plan for Universities of Shenzhen (No. 20200824163152001), the Natural Science Foundation of China (Nos. 52000186 and 52131001), and the Fundamental Research Funds for the Central Universities, Sun Yat-sen University (No. 22qntd2701).

Institutional Review Board Statement

Not applicable.

Informed Consent Statement

Not applicable.

Data Availability Statement

Not applicable.

Conflicts of Interest

The authors declare no conflict of interest.

References

  1. Kümmerer, K. Antibiotics in the aquatic environment—A review–Part I. Chemosphere 2009, 75, 417–434. [Google Scholar] [CrossRef] [PubMed]
  2. Pei, R.; Kim, S.; Carlson, K.; Pruden, A. Effect of river landscape on the sediment concentrations of antibiotics and corresponding antibiotic resistance genes (ARG). Water Res. 2006, 40, 2427–2435. [Google Scholar] [CrossRef] [PubMed]
  3. Janecko, N.; Pokludova, L.; Blahova, J.; Svobodova, Z.; Literak, I. Implications of fluoroquinolone contamination for the aquatic environment—A review. Environ. Toxicol Chem. 2016, 35, 2647–2656. [Google Scholar] [CrossRef] [PubMed]
  4. Van Doorslaer, X.; Dewulf, J.; Van Langenhove, H.D.; Demeestere, K. Fluoroquinolone antibiotics: An emerging class of environmental micropollutants. Sci. Total Environ. 2014, 500–501, 250–269. [Google Scholar] [CrossRef]
  5. Wang, L.; Zhang, L.; Feng, B.; Hua, X.; Li, Y.; Zhang, W.; Guo, Z. The pH dependence and role of fluorinated substituent of enoxacin binding to ferrihydrite. Sci. Total Environ. 2022, 823, 153707. [Google Scholar] [CrossRef]
  6. Adachi, F.; Yamamoto, A.; Takakura, K.; Kawahara, R. Occurrence of fluoroquinolones and fluoroquinolone-resistance genes in the aquatic environment. Sci. Total Environ. 2013, 444, 508–514. [Google Scholar] [CrossRef]
  7. Balakrishna, K.; Rath, A.; Praveenkumarreddy, Y.; Guruge, K.S.; Subedi, B. A review of the occurrence of pharmaceuticals and personal care products in Indian water bodies. Ecotoxicol. Environ. Saf. 2017, 137, 113–120. [Google Scholar]
  8. Fick, J.; Soderstrom, H.; Lindberg, R.H.; Phan, C.; Tysklind, M.; Larsson, D.G. Contamination of surface, ground, and drinking water from pharmaceutical production. Environ. Toxicol. Chem. 2009, 28, 2522–2527. [Google Scholar] [CrossRef]
  9. Zhang, R.; Zhang, R.; Zou, S.; Yang, Y.; Li, J.; Wang, Y.; Fen, T.; Cheng, J.; Zhang, G. Occurrence, Distribution and Ecological Risks of Fluoroquinolone Antibiotics in the Dongjiang River and the Beijiang River, Pearl River Delta, South China. Bull. Environ. Contam. Toxicol. 2017, 99, 46–53. [Google Scholar] [CrossRef]
  10. Santoke, H.; Tong, A.Y.; Mezyk, S.P.; Johnston, K.M.; Braund, R.; Cooper, W.J.; Peake, B.M. UV Photodegradation of Enoxacin in Water: Kinetics and Degradation Pathways. J. Environ. Eng. 2015, 141, 04015027. [Google Scholar]
  11. Annabi, C.; Fourcade, F.; Soutrel, I.; Geneste, F.; Floner, D.; Bellakhal, N.; Amrane, A. Degradation of enoxacin antibiotic by the electro-Fenton process: Optimization, biodegradability improvement and degradation mechanism. J. Environ. Manag. 2016, 96–105. [Google Scholar] [CrossRef] [PubMed]
  12. Luo, Y.; Guo, W.; Ngo, H.H.; Nghiem, L.D.; Hai, F.I.; Zhang, J.; Liang, S.; Wang, X.C. A review on the occurrence of micropollutants in the aquatic environment and their fate and removal during wastewater treatment. Sci. Total Environ. 2014, 473, 619–641. [Google Scholar] [CrossRef] [PubMed]
  13. Lu, H.; Ekama, G.A.; Wu, D.; Feng, J.; van Loosdrecht, M.C.; Chen, G.H. SANI® process realizes sustainable saline sewage treatment: Steady state model-based evaluation of the pilot-scale trial of the process. Water Res. 2012, 46, 475–490. [Google Scholar] [CrossRef] [PubMed]
  14. Wu, D.; Ekama, G.A.; Chui, H.K.; Wang, B.; Cui, Y.X.; Hao, T.W.; van Loosdrecht, M.C.; Chen, G.H. Large-scale demonstration of the sulfate reduction autotrophic denitrification nitrification integrated (SANI®) process in saline sewage treatment. Water Res. 2016, 100, 496–507. [Google Scholar] [PubMed]
  15. Chelliapan, S.; Sallis, P. Anaerobic treatment of high sulphate containing pharmaceutical wastewater. J. Sci. Ind. Res. 2015, 74, 526–530. [Google Scholar]
  16. Jia, Y.Y.; Khanal, S.K.; Zhang, H.Q.; Chen, G.H.; Lu, H. Sulfamethoxazole degradation in anaerobic sulfate-reducing bacteria sludge system. Water Res. 2017, 119, 12–20. [Google Scholar]
  17. Zhang, H.; Jia, Y.; Khanal, S.K.; Lu, H.; Fang, H.; Zhao, Q. Understanding the role of extracellular polymeric substances (EPS) on ciprofloxacin (CIP) adsorption in aerobic sludge, anaerobic sludge and sulfate-reducing bacteria (SRB) sludge systems. Environ. Sci. Technol. 2018, 52, 6476–6486. [Google Scholar] [CrossRef]
  18. Amorim, C.L.; Maia, A.S.; Mesquita, R.B.R.; Rangel, A.O.S.S.; van Loosdrecht, M.C.M.; Tiritan, M.E.; Castro, P.M.L. Performance of aerobic granular sludge in a sequencing batch bioreactor exposed to ofloxacin, norfloxacin and ciprofloxacin. Water Res. 2014, 50, 101–113. [Google Scholar]
  19. Dorival-García, N.; Zafra-Gómez, A.; Navalón, A.; González-López, J.; Vílchez, J.L. Removal of quinolone antibiotics from wastewaters by sorption and biological degradation in laboratory-scale membrane bioreactors. Sci. Total Environ. 2013, 442, 317–328. [Google Scholar] [CrossRef]
  20. Polesel, F.; Lehnberg, K.; Dott, W.; Trapp, S.; Thomas, K.V.; Plósz, B.G. Factors influencing sorption of ciprofloxacin onto activated sludge: Experimental assessment and modelling implications. Chemosphere. 2015, 119, 105–111. [Google Scholar] [CrossRef]
  21. Polesel, F.; Andersen, H.R.; Trapp, S.; Plόsz, B.G. Removal of Antibiotics in Biological Wastewater Treatment Systems-A Critical Assessment Using the Activated Sludge Modeling Framework for Xenobiotics (ASM-X). Environ. Sci. Technol. 2016, 50, 10316–10334. [Google Scholar] [CrossRef] [PubMed]
  22. Li, B.; Zhang, T. Biodegradation and Adsorption of Antibiotics in the Activated Sludge Process. Environ. Sci. Technol. 2010, 44, 3468–3473. [Google Scholar] [CrossRef] [PubMed]
  23. Zhou, X.; Zhang, Y.; Shi, L.; Chen, J.; Qiang, Z.; Zhang, T.C. Partitioning of fluoroquinolones on wastewater sludge. Clean Soil Air Water 2013, 41, 820–827. [Google Scholar] [CrossRef]
  24. Dorival-García, N.; Zafra-Gómez, A.; Navalón, A.; González-López, J.; Hontoria, E.; Vílchez, J.L. Removal and degradation characteristics of quinolone antibiotics in laboratory-scale activated sludge reactors under aerobic, nitrifying and anoxic conditions. J. Environ. Manag. 2013, 120, 75–83. [Google Scholar] [CrossRef] [PubMed]
  25. Jia, Y.Y.; Zhang, H.Q.; Khanal, S.K.; Yin, L.W.; Lu, H. Insights into pharmaceuticals removal in an anaerobic sulfate-reducing bacteria sludge system. Water Res. 2019, 161, 191–201. [Google Scholar] [CrossRef]
  26. Larsson, D.; de Pedro, C.; Paxeus, N. Effluent from drug manufacturers contains extremely high levels of pharmaceuticals. J. Hazard. Mater. 2007, 148, 751–755. [Google Scholar] [CrossRef]
  27. APHA. Standard Methods for the Examination of Water and Wastewater; American Public Health Association: Washington, DC, USA, 2012. [Google Scholar]
  28. Wang, L.; Qiang, Z.; Li, Y.; Ben, W. An insight into the removal of fluoroquinolones in activated sludge process: Sorption and biodegradation characteristics. J. Environ. Sci. 2017, 56, 263–271. [Google Scholar] [CrossRef]
  29. Ahmed, M.J. Adsorption of quinolone, tetracycline, and penicillin antibiotics from aqueous solution using activated carbons: Review. Environ. Toxicol. Pharm. 2017, 50, 1–10. [Google Scholar] [CrossRef]
  30. Jia, Y.Y.; Khanal, S.K.; Shu, H.Y.; Zhang, H.Q.; Chen, G.H.; Lu, H. Ciprofloxacin degradation in anaerobic sulfate-reducing bacteria (SRB) sludge system: Mechanism and pathways. Water Res. 2018, 136, 64–74. [Google Scholar] [CrossRef]
  31. Jia, A.; Wan, Y.; Xiao, Y.; Hu, J. Occurrence and fate of quinolone and fluoroquinolone antibiotics in a municipal sewage treatment plant. Water Res. 2012, 46, 387–394. [Google Scholar] [CrossRef]
  32. Lindberg, R.H.; Olofsson, U.; Rendahl, P.; Johansson, M.I.; Tysklind, M.; Andersson, B.A.V. Behavior of fluoroquinolones and trimethoprim during mechanical, chemical, and active sludge treatment of sewage water and digestion of sludge. Environ. Sci. Technol. 2006, 40, 1042–1048. [Google Scholar] [CrossRef] [PubMed]
  33. Conkle, J.L.; Lattao, C.; White, J.R.; Cook, R.L. Competitive sorption and desorption behavior for three fluoroquinolone antibiotics in a wastewater treatment wetland soil. Chemosphere 2010, 80, 1353–1359. [Google Scholar] [CrossRef] [PubMed]
  34. Golet, E.M.; Xifra, I.; Siegrist, H.; Alder, A.C.; Giger, W. Environmental Exposure Assessment of Fluoroquinolone Antibacterial Agents from Sewage to Soil. Environ. Sci. Technol. 2003, 15, 3243–3249. [Google Scholar] [CrossRef] [PubMed]
  35. Tolls, J. Sorption of Veterinary Pharmaceuticals in Soils: A Review. Environ. Sci. Technol. 2001, 17, 3397–3406. [Google Scholar] [CrossRef] [PubMed]
  36. Shi, Y.J.; Wang, X.H.; Qi, Z.; Diao, M.H.; Gao, M.M.; Xing, S.F.; Wang, S.G.; Zhao, X.C. Sorption and biodegradation of tetracycline by nitrifying granules and the toxicity of tetracycline on granules. J. Hazard. Mater. 2011, 191, 103–109. [Google Scholar] [CrossRef]
  37. Yang, S.F.; Lin, C.F.; Lin, A.Y.C.; Hong, P.K.A. Sorption and biodegradation of sulfonamide antibiotics by activated sludge: Experimental assessment using batch data obtained under aerobic conditions. Water Res. 2011, 45, 3389–3397. [Google Scholar] [CrossRef]
  38. Sun, Y.; Yue, Q.; Gao, B.; Wang, B.; Li, Q.; Huang, L.; Xu, X. Comparison of activated carbons from Arundo donax Linn with H4P2O7 activation by conventional and microwave heating methods. Chem. Eng. J. 2012, 192, 308–314. [Google Scholar] [CrossRef]
  39. Sun, Y.; Yue, Q.; Gao, B.; Huang, L.; Xu, X.; Li, Q. Comparative study on characterization and adsorption properties of activated carbons with H3PO4 and H4P2O7 activation employing Cyperus alternifolius as precursor. Chem. Eng. J. 2012, 181–182, 790–797. [Google Scholar] [CrossRef]
  40. Doğan, M.; Alkan, M. Removal of methyl violet from aqueous solution by perlite. J. Colloid Interf. Sci. 2003, 267, 32–41. [Google Scholar] [CrossRef]
  41. Weber, W., Jr.; DiGiano, F. Process Dynamics in Environmental Systems; Wiley Publishers: New York, NY, USA, 1996; p. 943. [Google Scholar]
  42. Zhang, J.; Wu, C.; Jia, A.; Hu, B. Kinetics, equilibrium and thermodynamics of the sorption of p-nitrophenol on two variable charge soils of Southern China. Appl. Surf. Sci. 2014, 298, 95–101. [Google Scholar] [CrossRef]
  43. Xu, K.; Harper, W.F., Jr.; Zhao, D. 17α-Ethinylestradiol sorption to activated sludge biomass: Thermodynamic properties and reaction mechanisms. Water Res. 2008, 42, 3146–3152. [Google Scholar] [CrossRef] [PubMed]
  44. Azanu, D.; Styrishave, B.; Darko, G.; Weisser, J.J.; Abaidoo, R.C. Occurrence and risk assessment of antibiotics in water and lettuce in Ghana. Sci. Total Environ. 2018, 622–623, 293–305. [Google Scholar] [CrossRef] [PubMed]
  45. Wang, J.; Wang, S. Microbial degradation of sulfamethoxazole in the environment. Appl. Microbiol. Biotechnol. 2018, 102, 3573–3582. [Google Scholar] [CrossRef] [PubMed]
  46. Liu, Z.G.; Sun, P.Z.; Pavlostathis, S.G.; Zhou, X.F.; Zhang, Y.L. Inhibitory effects and biotransformation potential of ciprofloxacin under anoxic/anaerobic conditions. Bioresour. Technol. 2013, 150, 28–35. [Google Scholar] [CrossRef] [PubMed]
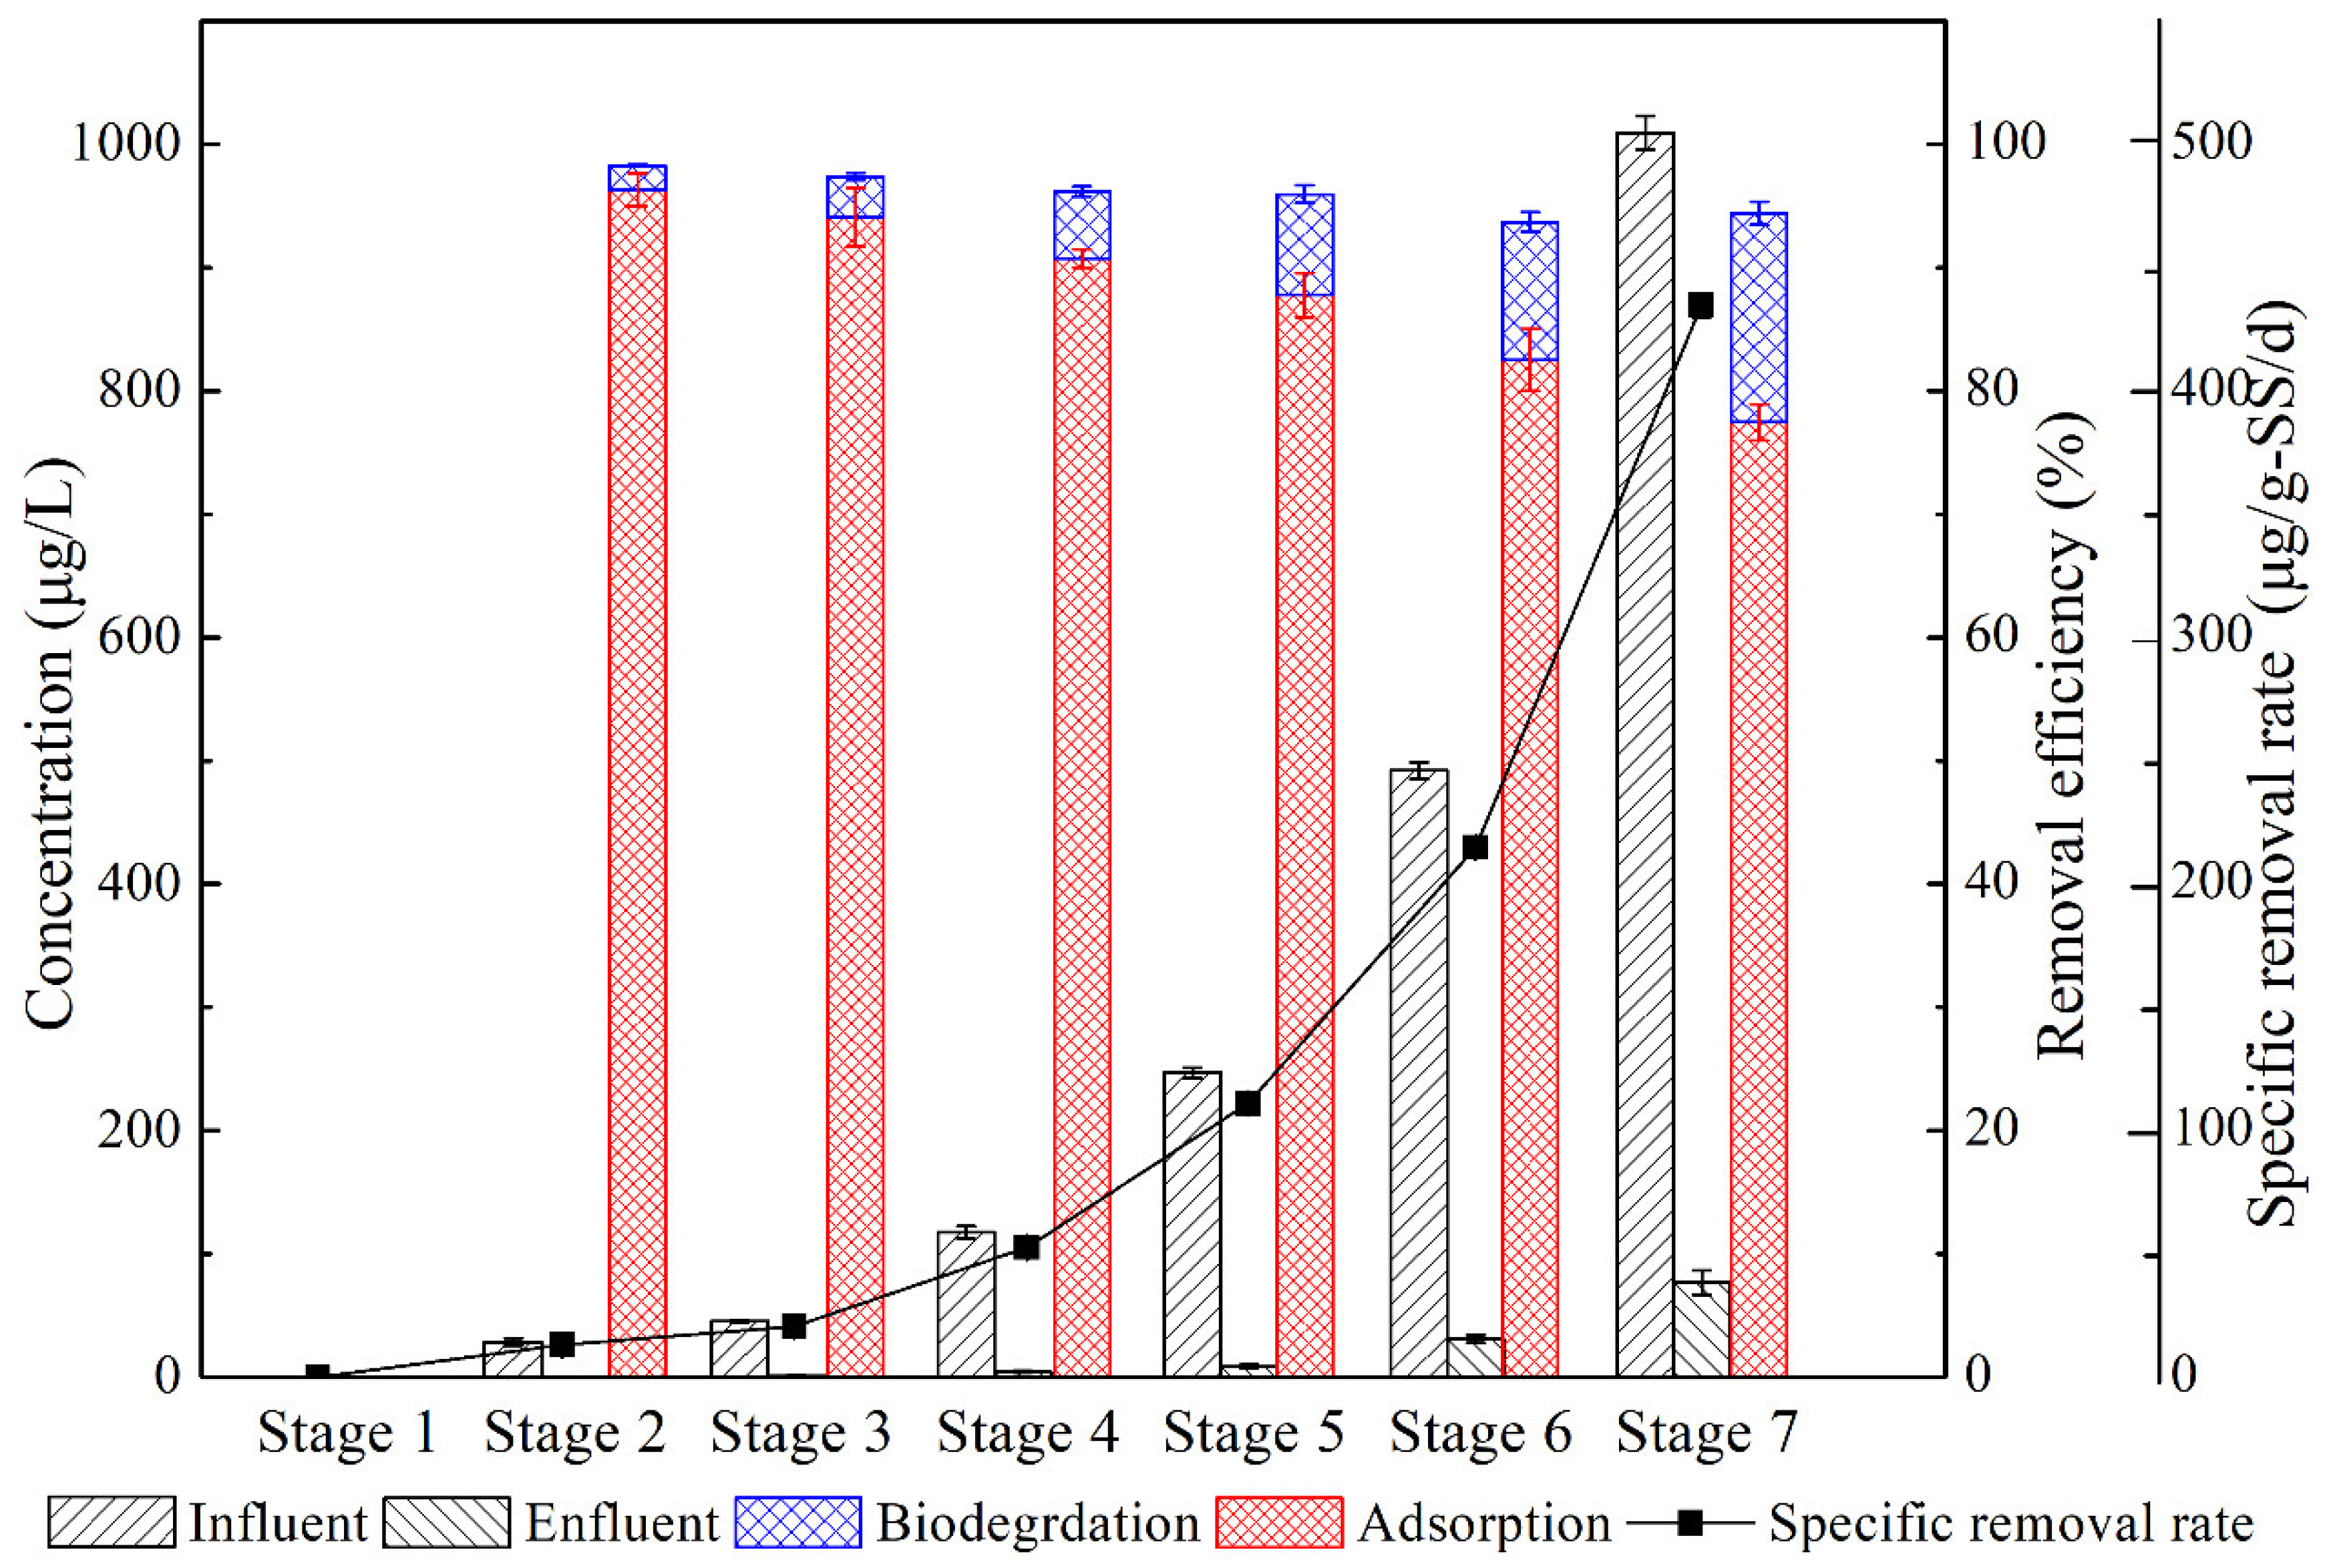
Figure 1. Fate of ENO in the SRUSB bioreactor: Stage 1 without ENO in influent (i.e., 0 μg/L ENO); ENO concentrations of 28.6 ± 2.9 μg/L in Stage 2; 45.6 ± 1.2 μg/L in Stage 3; 117.64 ± 5.0 μg/L in Stage 4; 247.1 ± 4.0 μg/L in Stage 5; 492.1 ± 6.7 μg/L in Stage 6; 1009.3 ± 13.4 μg/L in Stage 7.
Water 14 02896 g001
Figure 2. ENO adsorption by the sulfate-reducing sludge at different initial concentrations: 100 (A); 300 (B); 500 (C); 1000 (D); 3000 (E); 5000 μg/L (F).
Water 14 02896 g002
Figure 3. Pseudo-first-order and pseudo-second-order kinetic model fitting of ENO adsorption by the sulfate-reducing sludge (pseudo-first-order model, y1; pseudo-second-order model, y2): 100 (A); 300 (B); 500 (C); 1000 (D); 3000 (E); 5000 μg/L (F).
Water 14 02896 g003
Figure 4. Thermodynamic fitting curve of ENO adsorption by the sulfate-reducing sludge.
Water 14 02896 g004
Figure 5. ENO biodegradation in the sulfate-reducing sludge system at different initial concentrations: 100 (A); 300 (B); 500 (C); 1000 (D); 3000 (E); 5000 μg/L (F).
Water 14 02896 g005
Publisher’s Note: MDPI stays neutral with regard to jurisdictional claims in published maps and institutional affiliations.