Author Contributions
Conceptualization, X.D. and Y.L.; data curation, G.Q., Y.S. and D.L.; formal analysis, W.L. (Weile Li), J.R. and S.L.; methodology, W.L. (Wenxin Liu) and Y.W.; writing—original draft, W.L. (Wenxin Liu) and X.D.; writing—review & editing, W.L. (Wenxin Liu), X.D. and M.W. All authors have read and agreed to the published version of the manuscript.
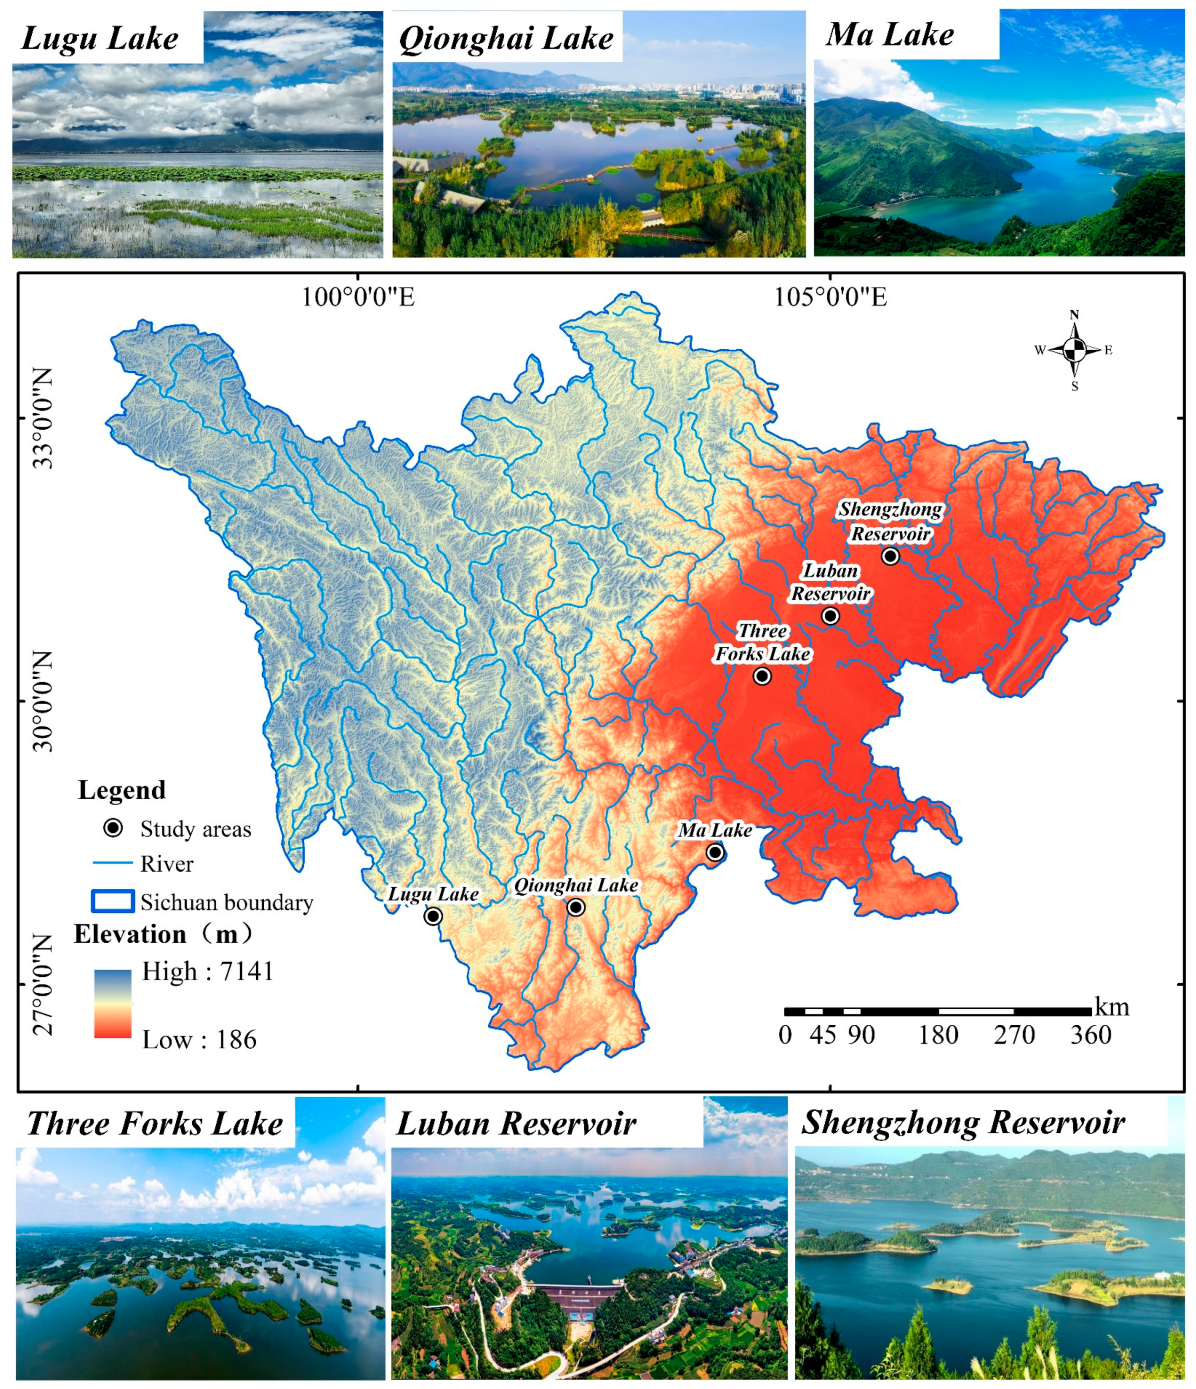
Figure 1.
Locations of the lakes in the study area.
Figure 1.
Locations of the lakes in the study area.
Figure 2.
The number of Landsat images used.
Figure 2.
The number of Landsat images used.
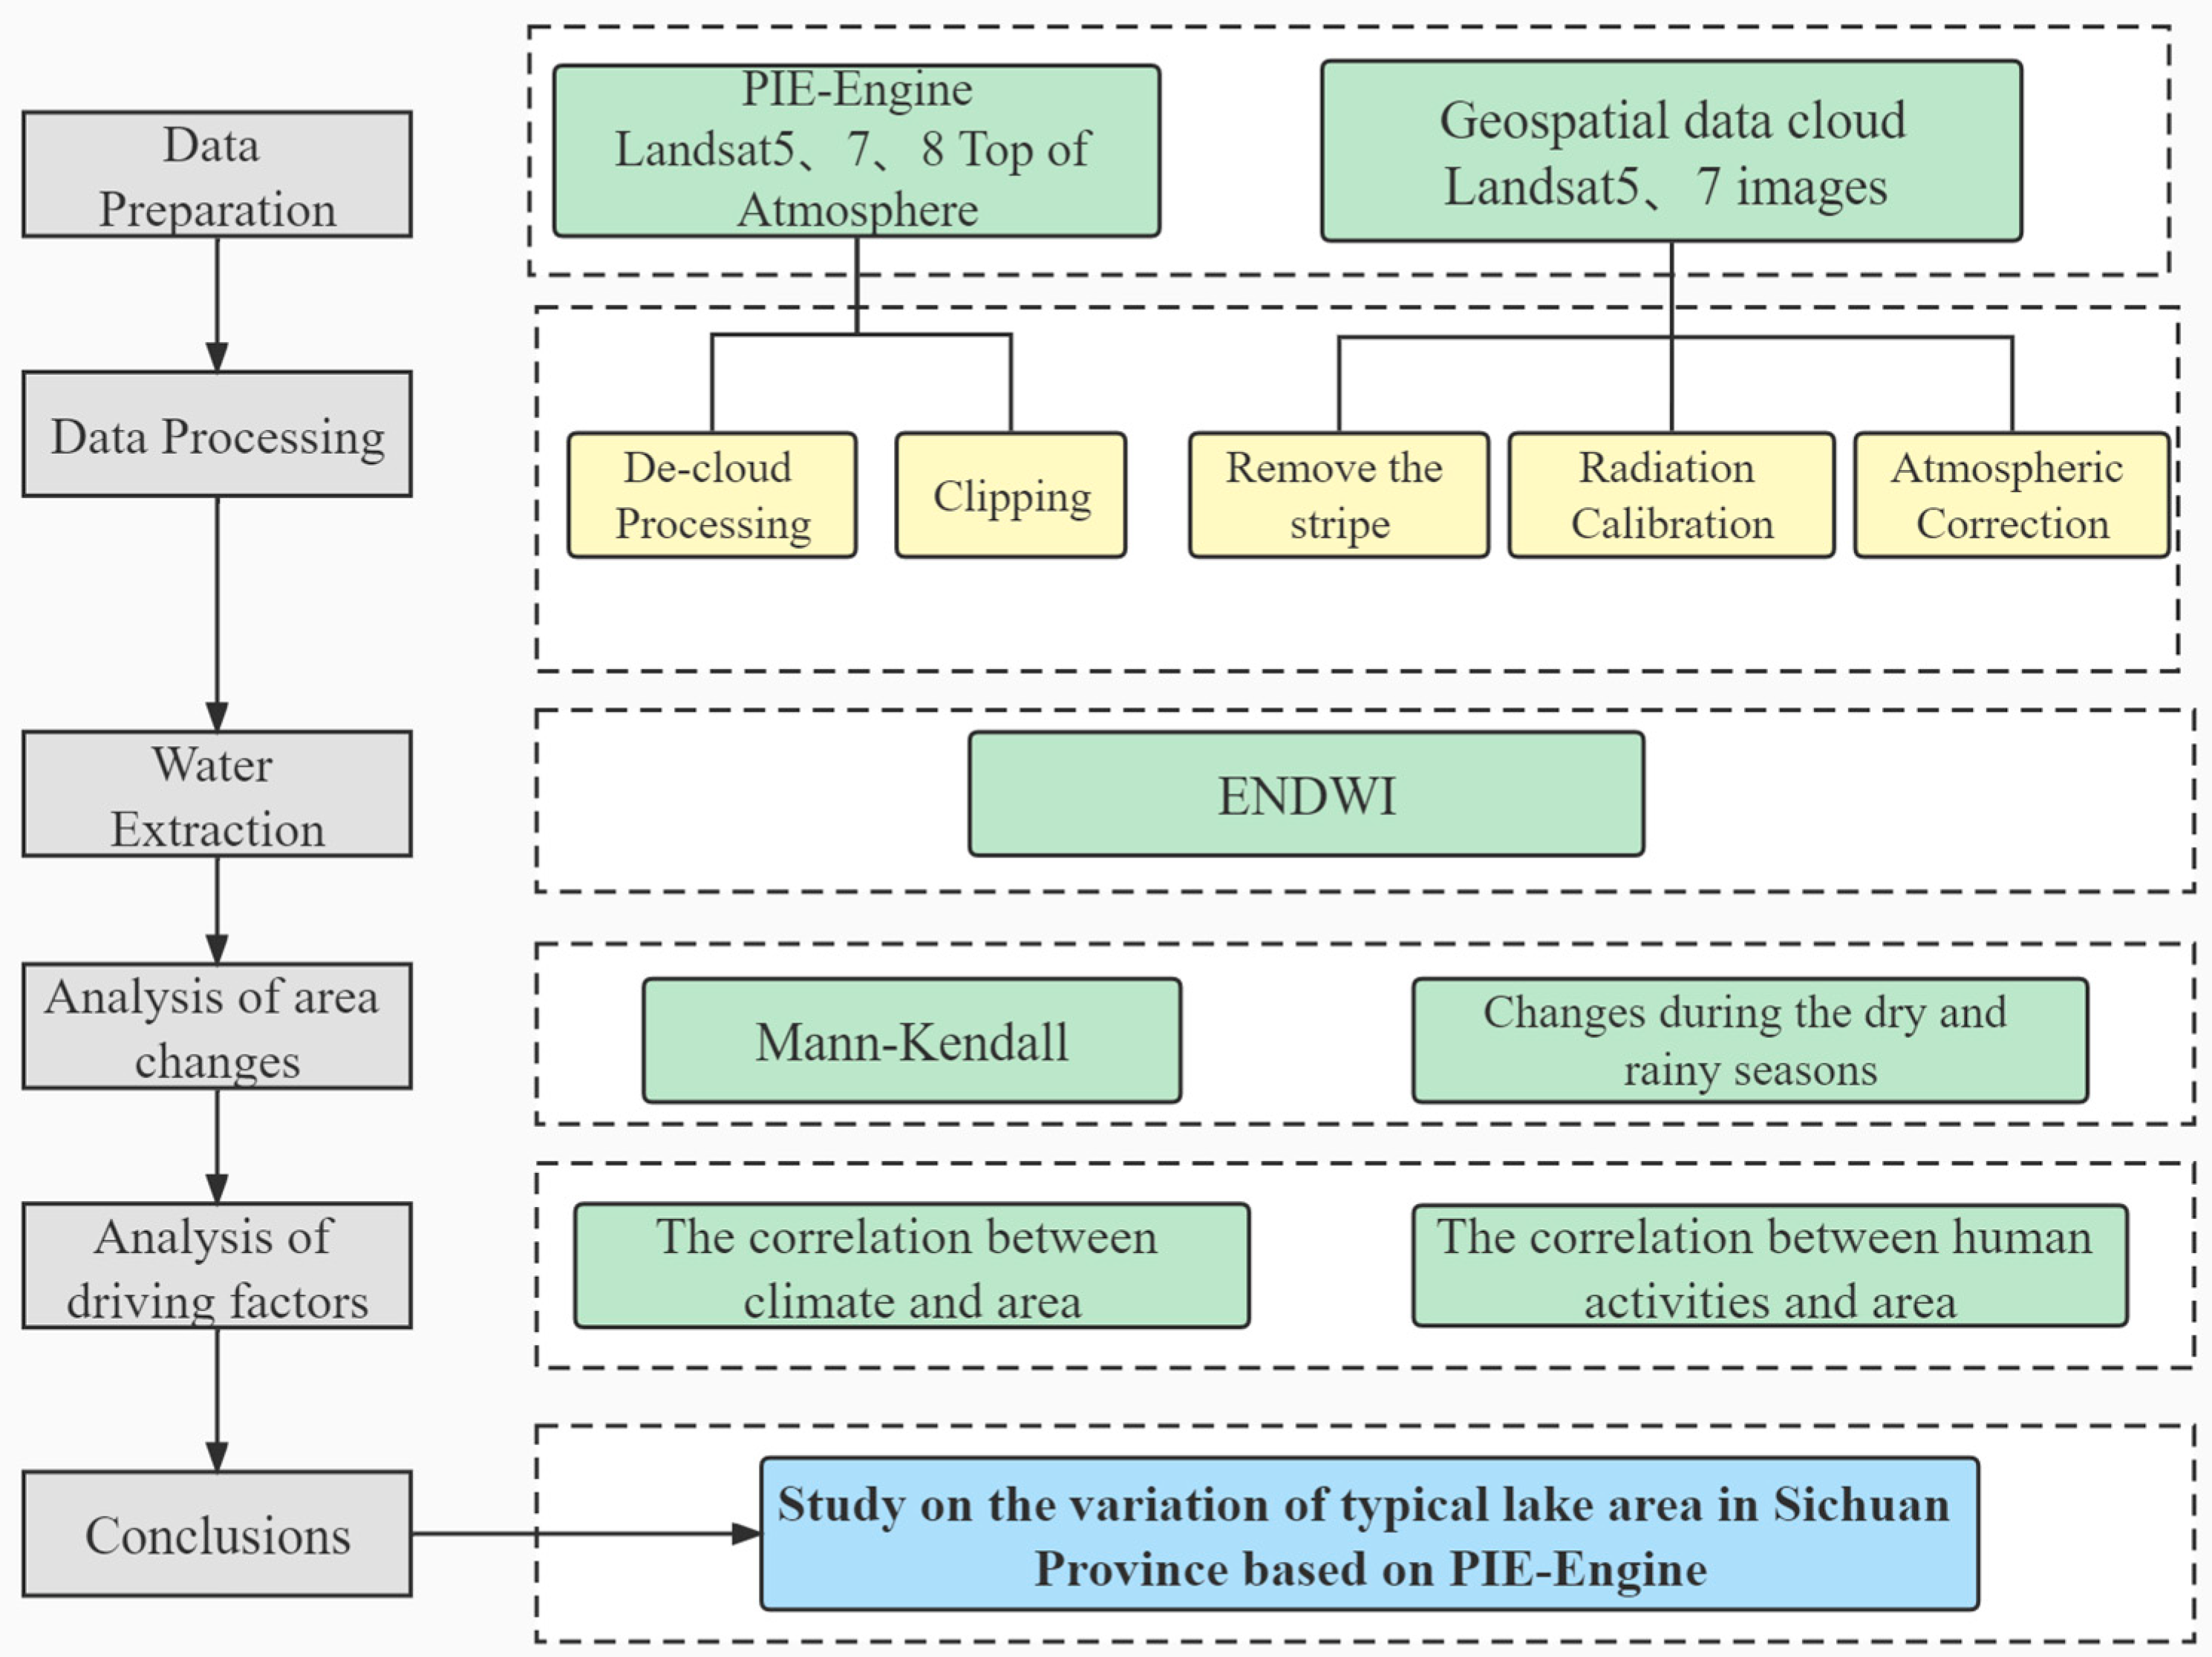
Figure 3.
Schematic diagram of the study.
Figure 3.
Schematic diagram of the study.
Figure 4.
The workflow of the water body area calculation.
Figure 4.
The workflow of the water body area calculation.
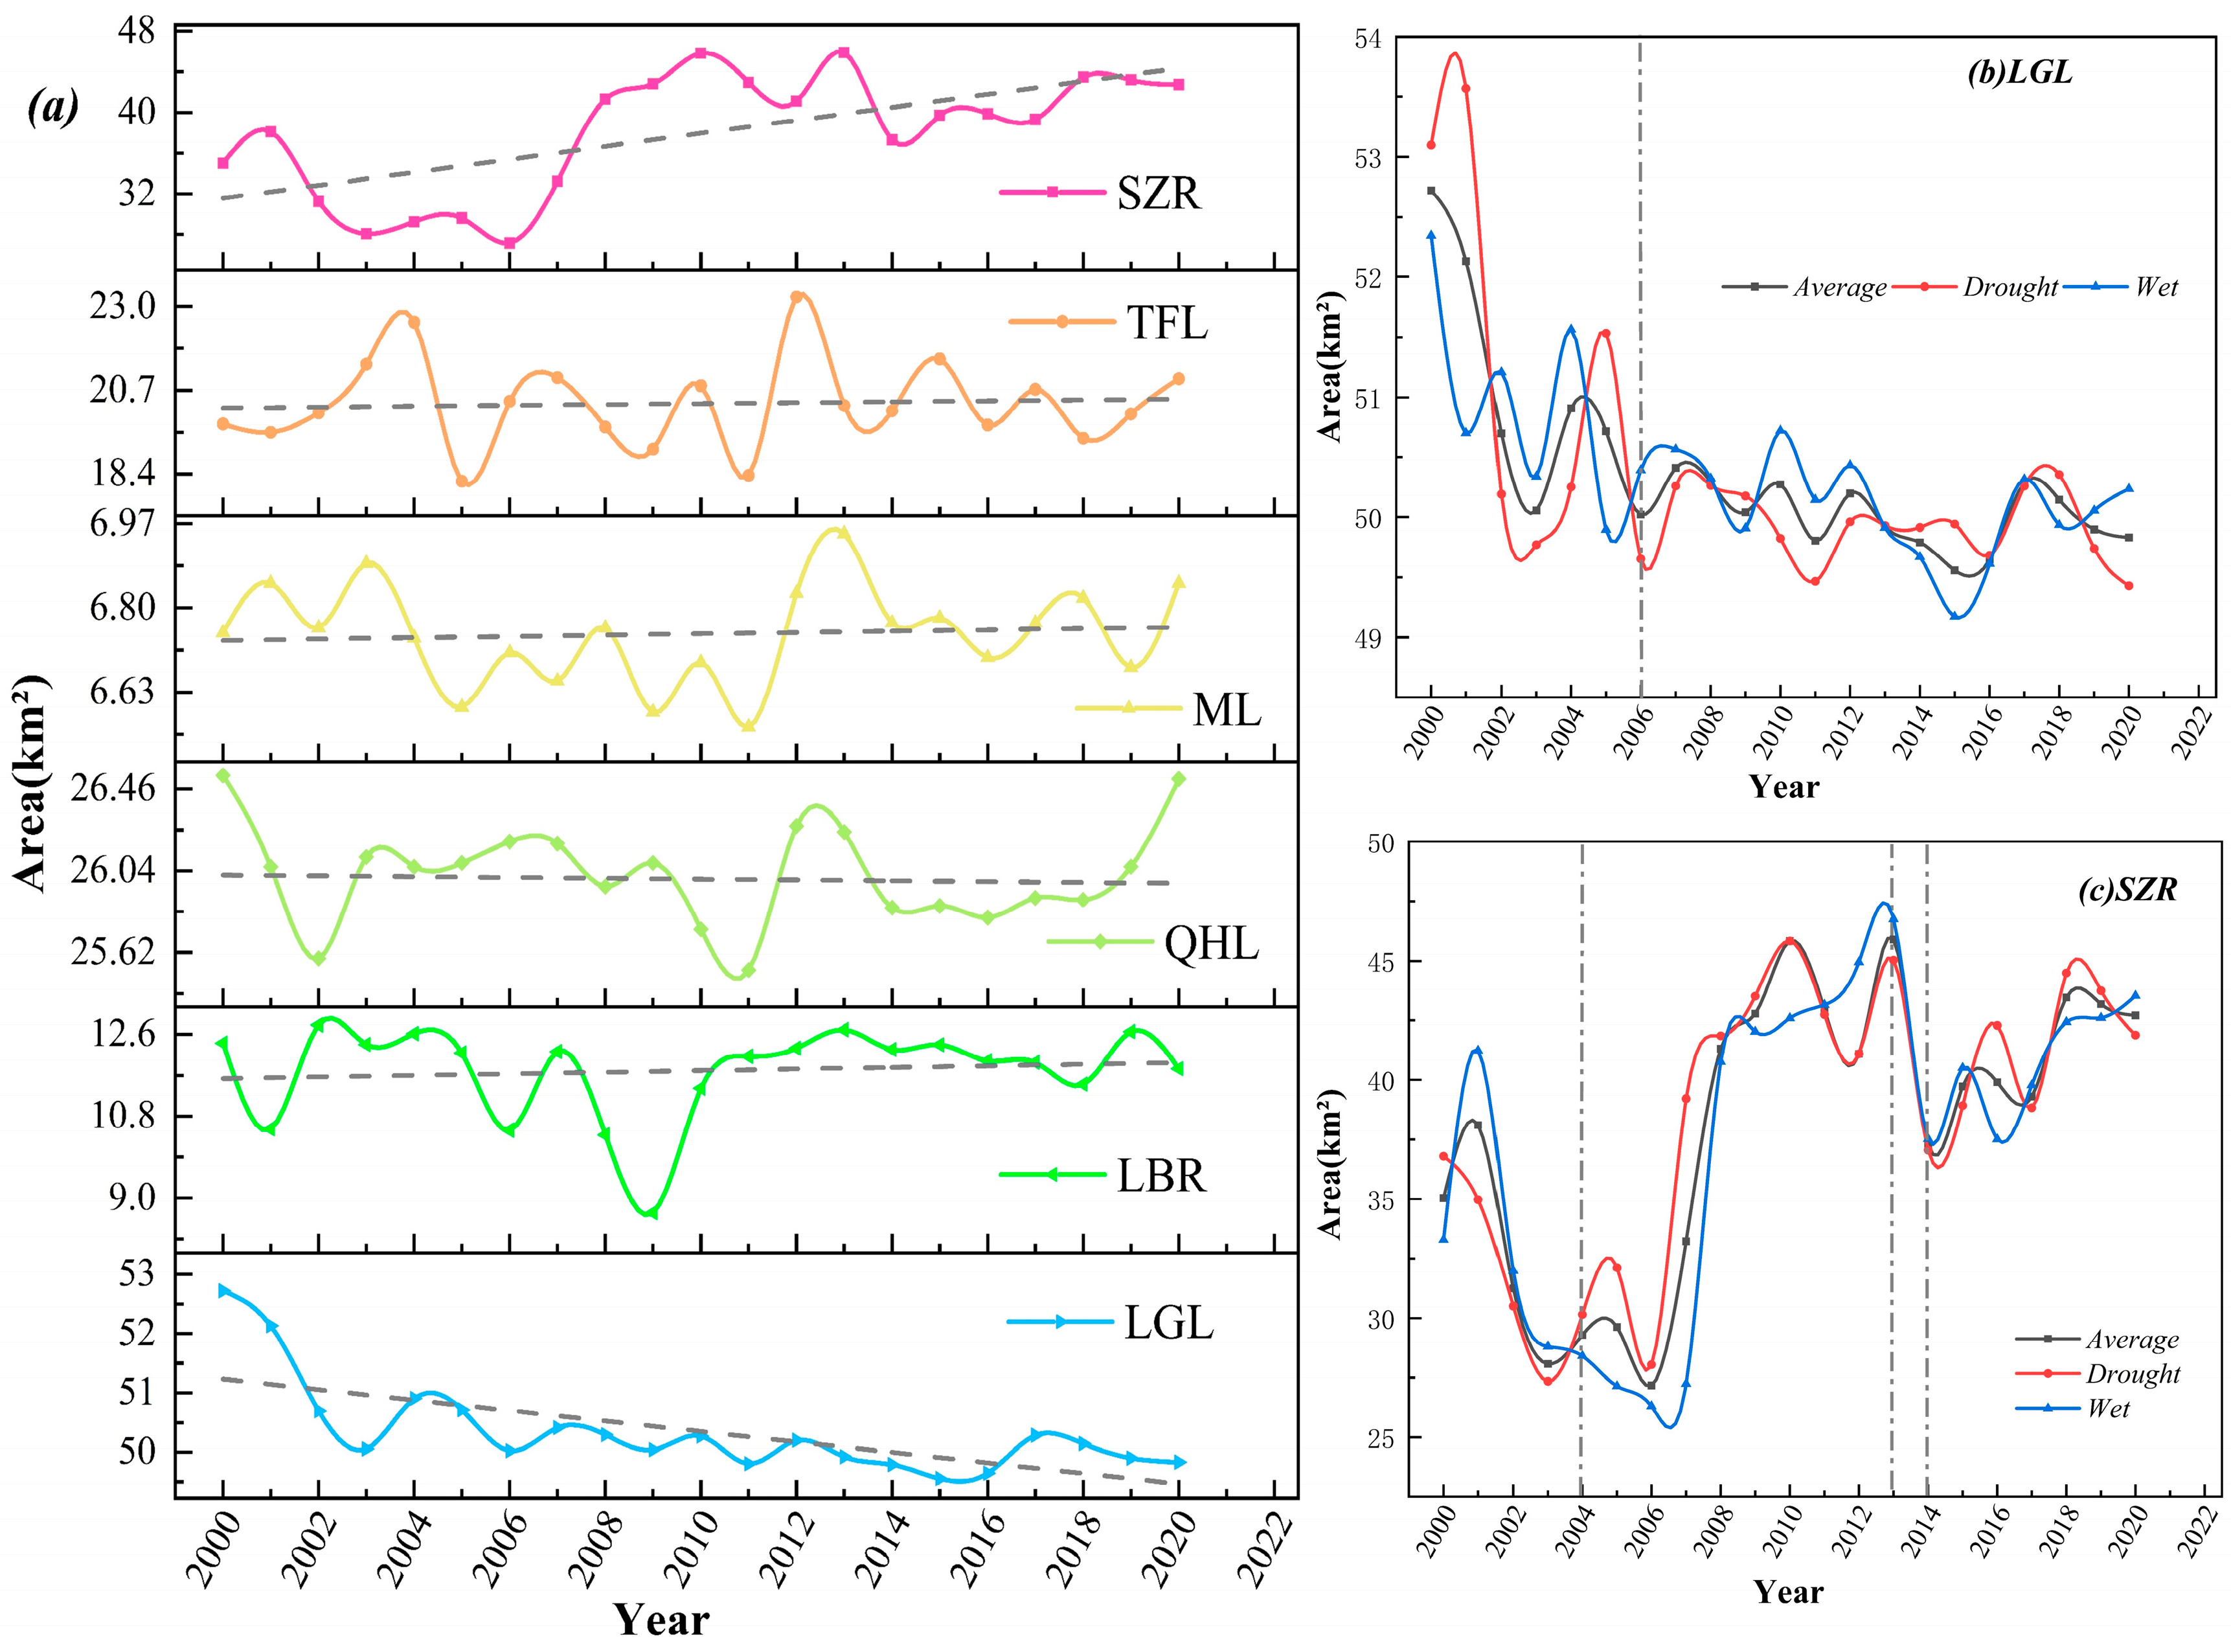
Figure 5.
Lake area. (a) Trends in the average annual area of the six lakes; (b) Annual average change in area of the Lugu Lake from drought to wet season; (c) Annual average change in area of the Shengzhong Reservoir from drought to wet season.
Figure 5.
Lake area. (a) Trends in the average annual area of the six lakes; (b) Annual average change in area of the Lugu Lake from drought to wet season; (c) Annual average change in area of the Shengzhong Reservoir from drought to wet season.
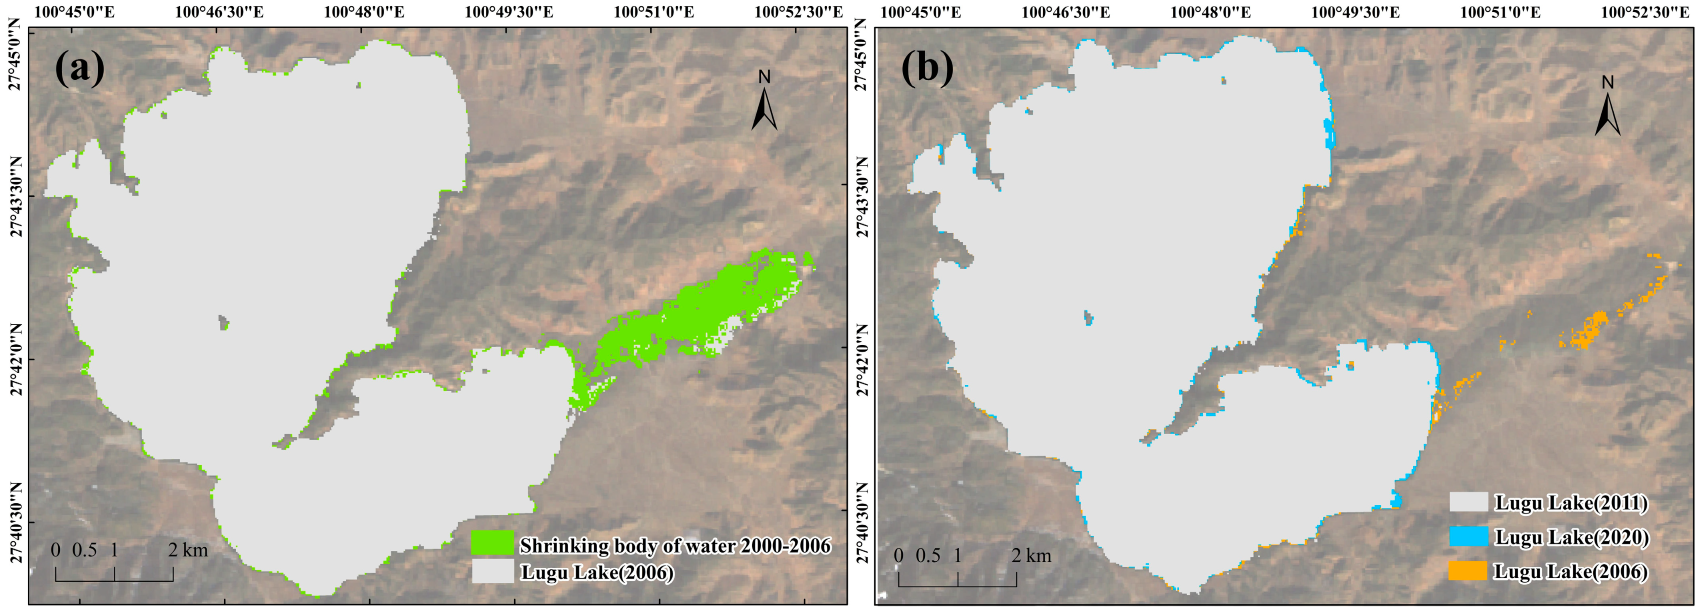
Figure 6.
Spatial changes in Lugu Lake. (a) The shrinking water bodies of Lugu Lake during 2000–2006; (b) After 2006, the Caohai part of Lugu Lake slowly disappeared.
Figure 6.
Spatial changes in Lugu Lake. (a) The shrinking water bodies of Lugu Lake during 2000–2006; (b) After 2006, the Caohai part of Lugu Lake slowly disappeared.
Figure 7.
Spatial changes in Shengzhong Reservoir. (a) The shrinking water bodies of Shengzhong Reservoir during 2000-2004; (b) The expansion of water bodies in Shengzhong Reservoir during the period 2004-2013; (c) The shrinking water bodies of Shengzhong Reservoir during 2013–2014; (d) The expansion of water bodies in Shengzhong Reservoir during the period 2014–2020.
Figure 8.
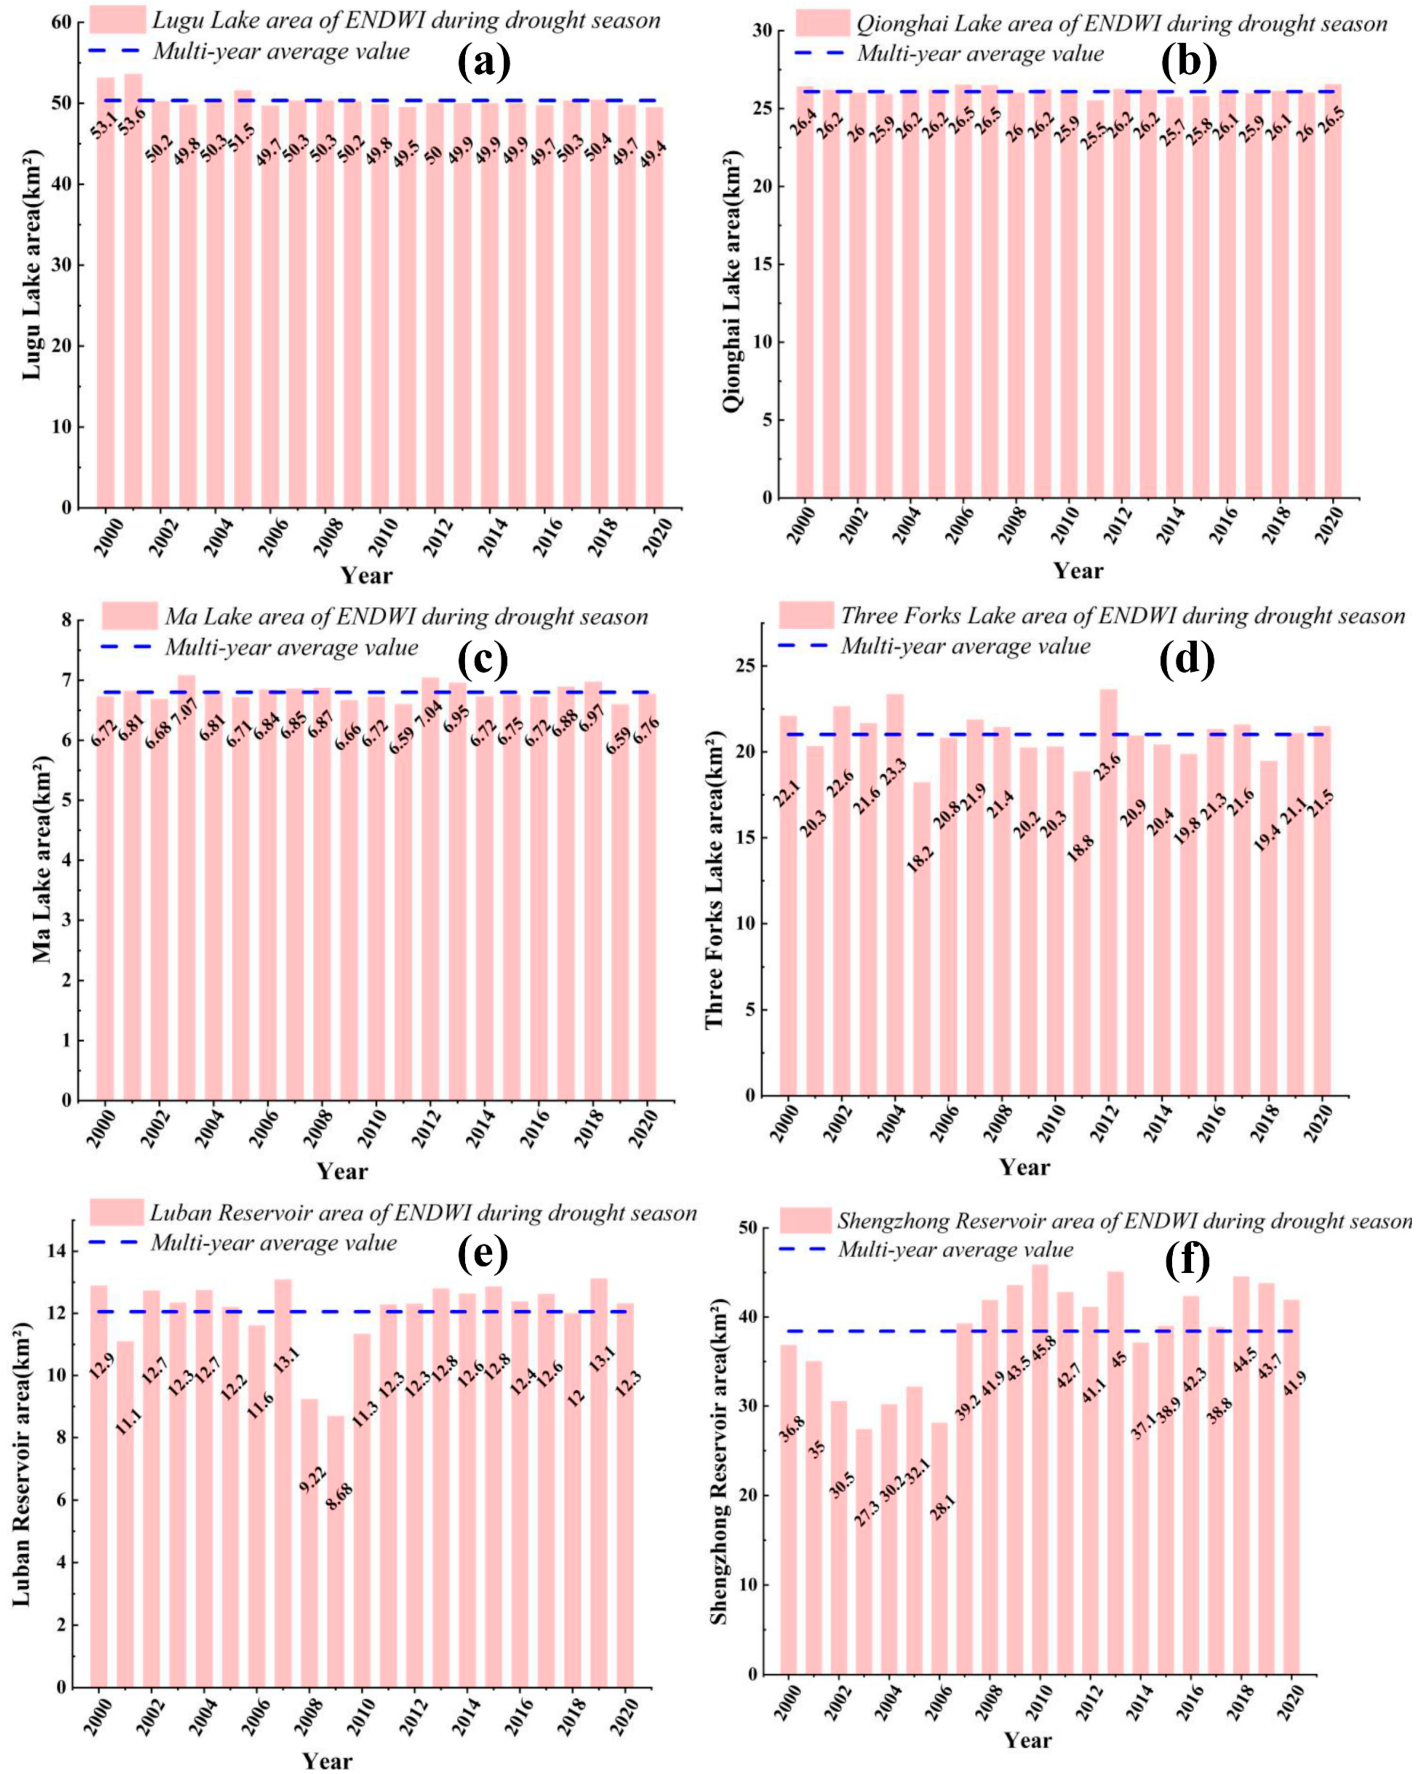
Change in dry season area of selected lakes from 2000 to 2020. (a) Lugu Lake; (b) Qionghai Lake; (c) Ma Lake; (d) Three Forks Lake; (e) Luban Reservoir; (f) Shengzhong Reservoir. Note, the dashed line indicates the multi-year average lake area during the dry season.
Figure 8.
Change in dry season area of selected lakes from 2000 to 2020. (a) Lugu Lake; (b) Qionghai Lake; (c) Ma Lake; (d) Three Forks Lake; (e) Luban Reservoir; (f) Shengzhong Reservoir. Note, the dashed line indicates the multi-year average lake area during the dry season.
Figure 9.
Change in wet season area of selected lakes from 2000 to 2020. (a) Lugu Lake; (b) Qionghai Lake; (c) Ma Lake; (d) Three Forks Lake; (e) Luban Reservoir; (f) Shengzhong Reservoir. Note, the dashed line indicates the multi-year average lake area during the wet season.
Figure 9.
Change in wet season area of selected lakes from 2000 to 2020. (a) Lugu Lake; (b) Qionghai Lake; (c) Ma Lake; (d) Three Forks Lake; (e) Luban Reservoir; (f) Shengzhong Reservoir. Note, the dashed line indicates the multi-year average lake area during the wet season.
Figure 10.
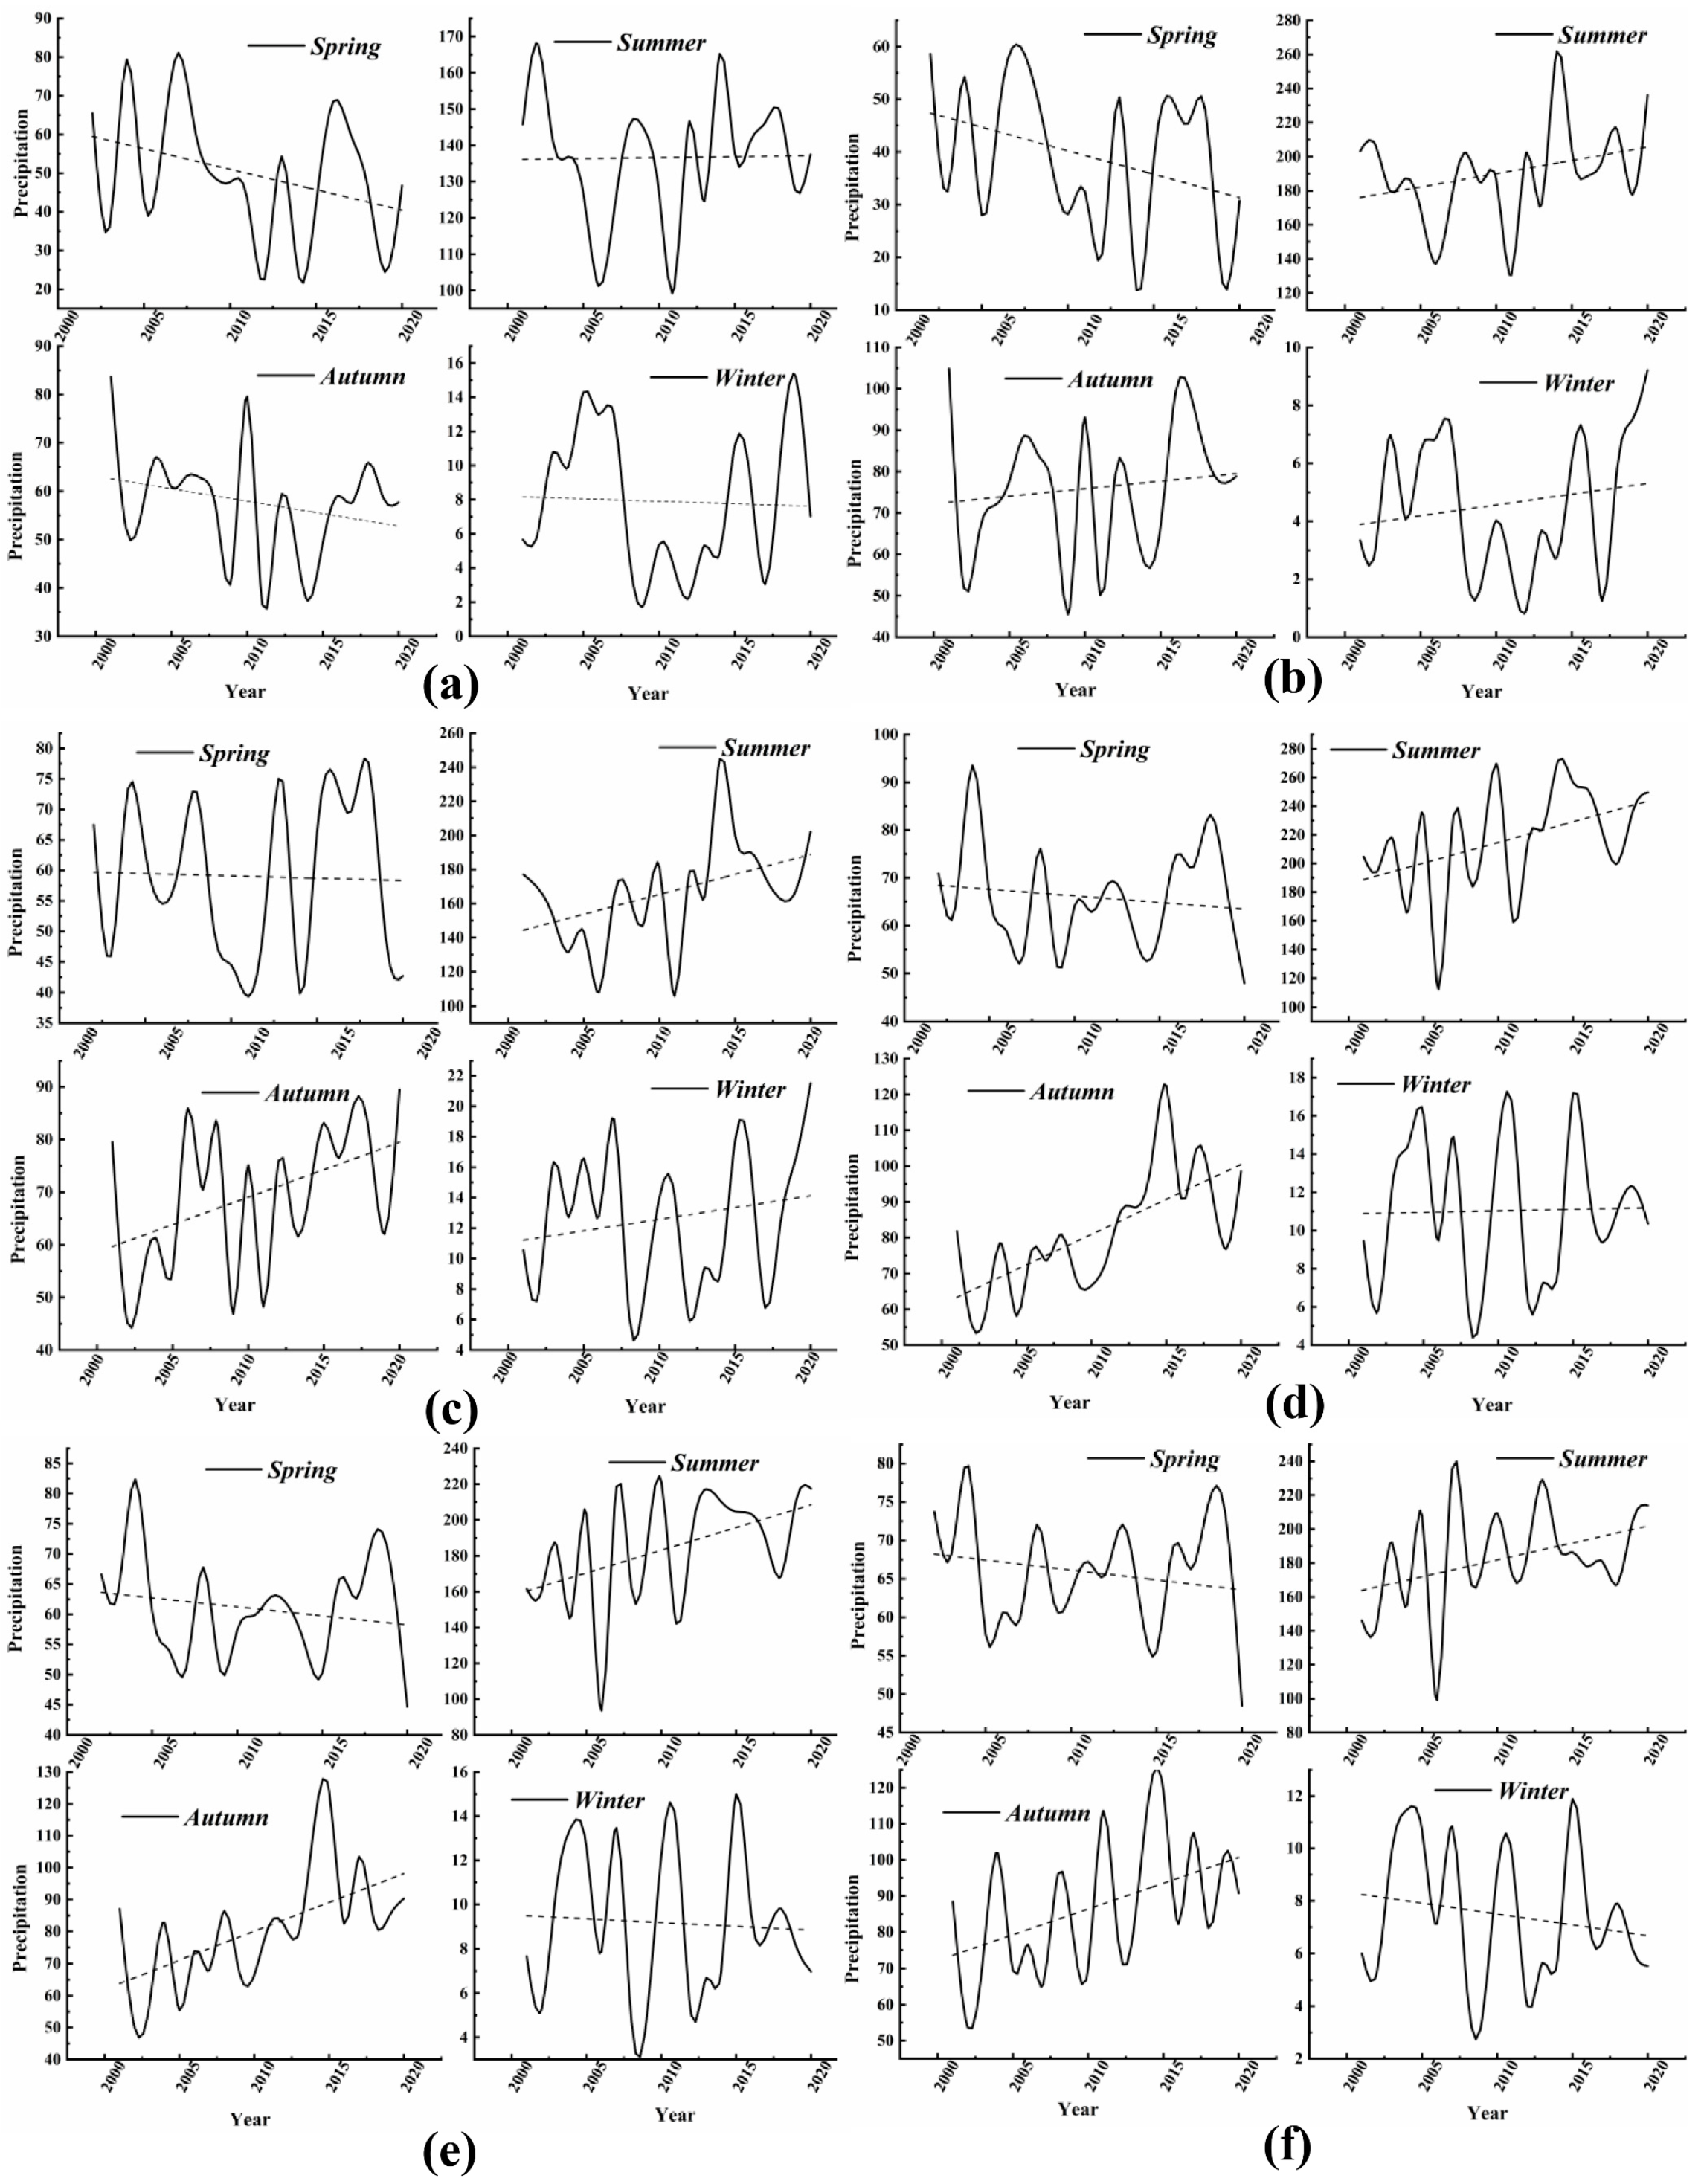
Seasonal characteristics of the precipitation variation in the study area (mm). (a) Lugu Lake; (b) Qionghai Lake; (c) Ma Lake; (d) Three Forks Lake; (e) Luban Reservoir; (f) Shengzhong Reservoir. Note, the direction of the dashed line indicates the trend of precipitation in spring, summer, autumn and winter.
Figure 11.
Characteristics of the drought and wet season variation in precipitation (mm). (a) Lugu Lake; (b) Qionghai Lake; (c) Ma Lake; (d) Three Forks Lake; (e) Luban Reservoir; (f) Shengzhong Reservoir. Note, the direction of the dashed line indicates the trend of precipitation in the drought and wet season.
Figure 12.
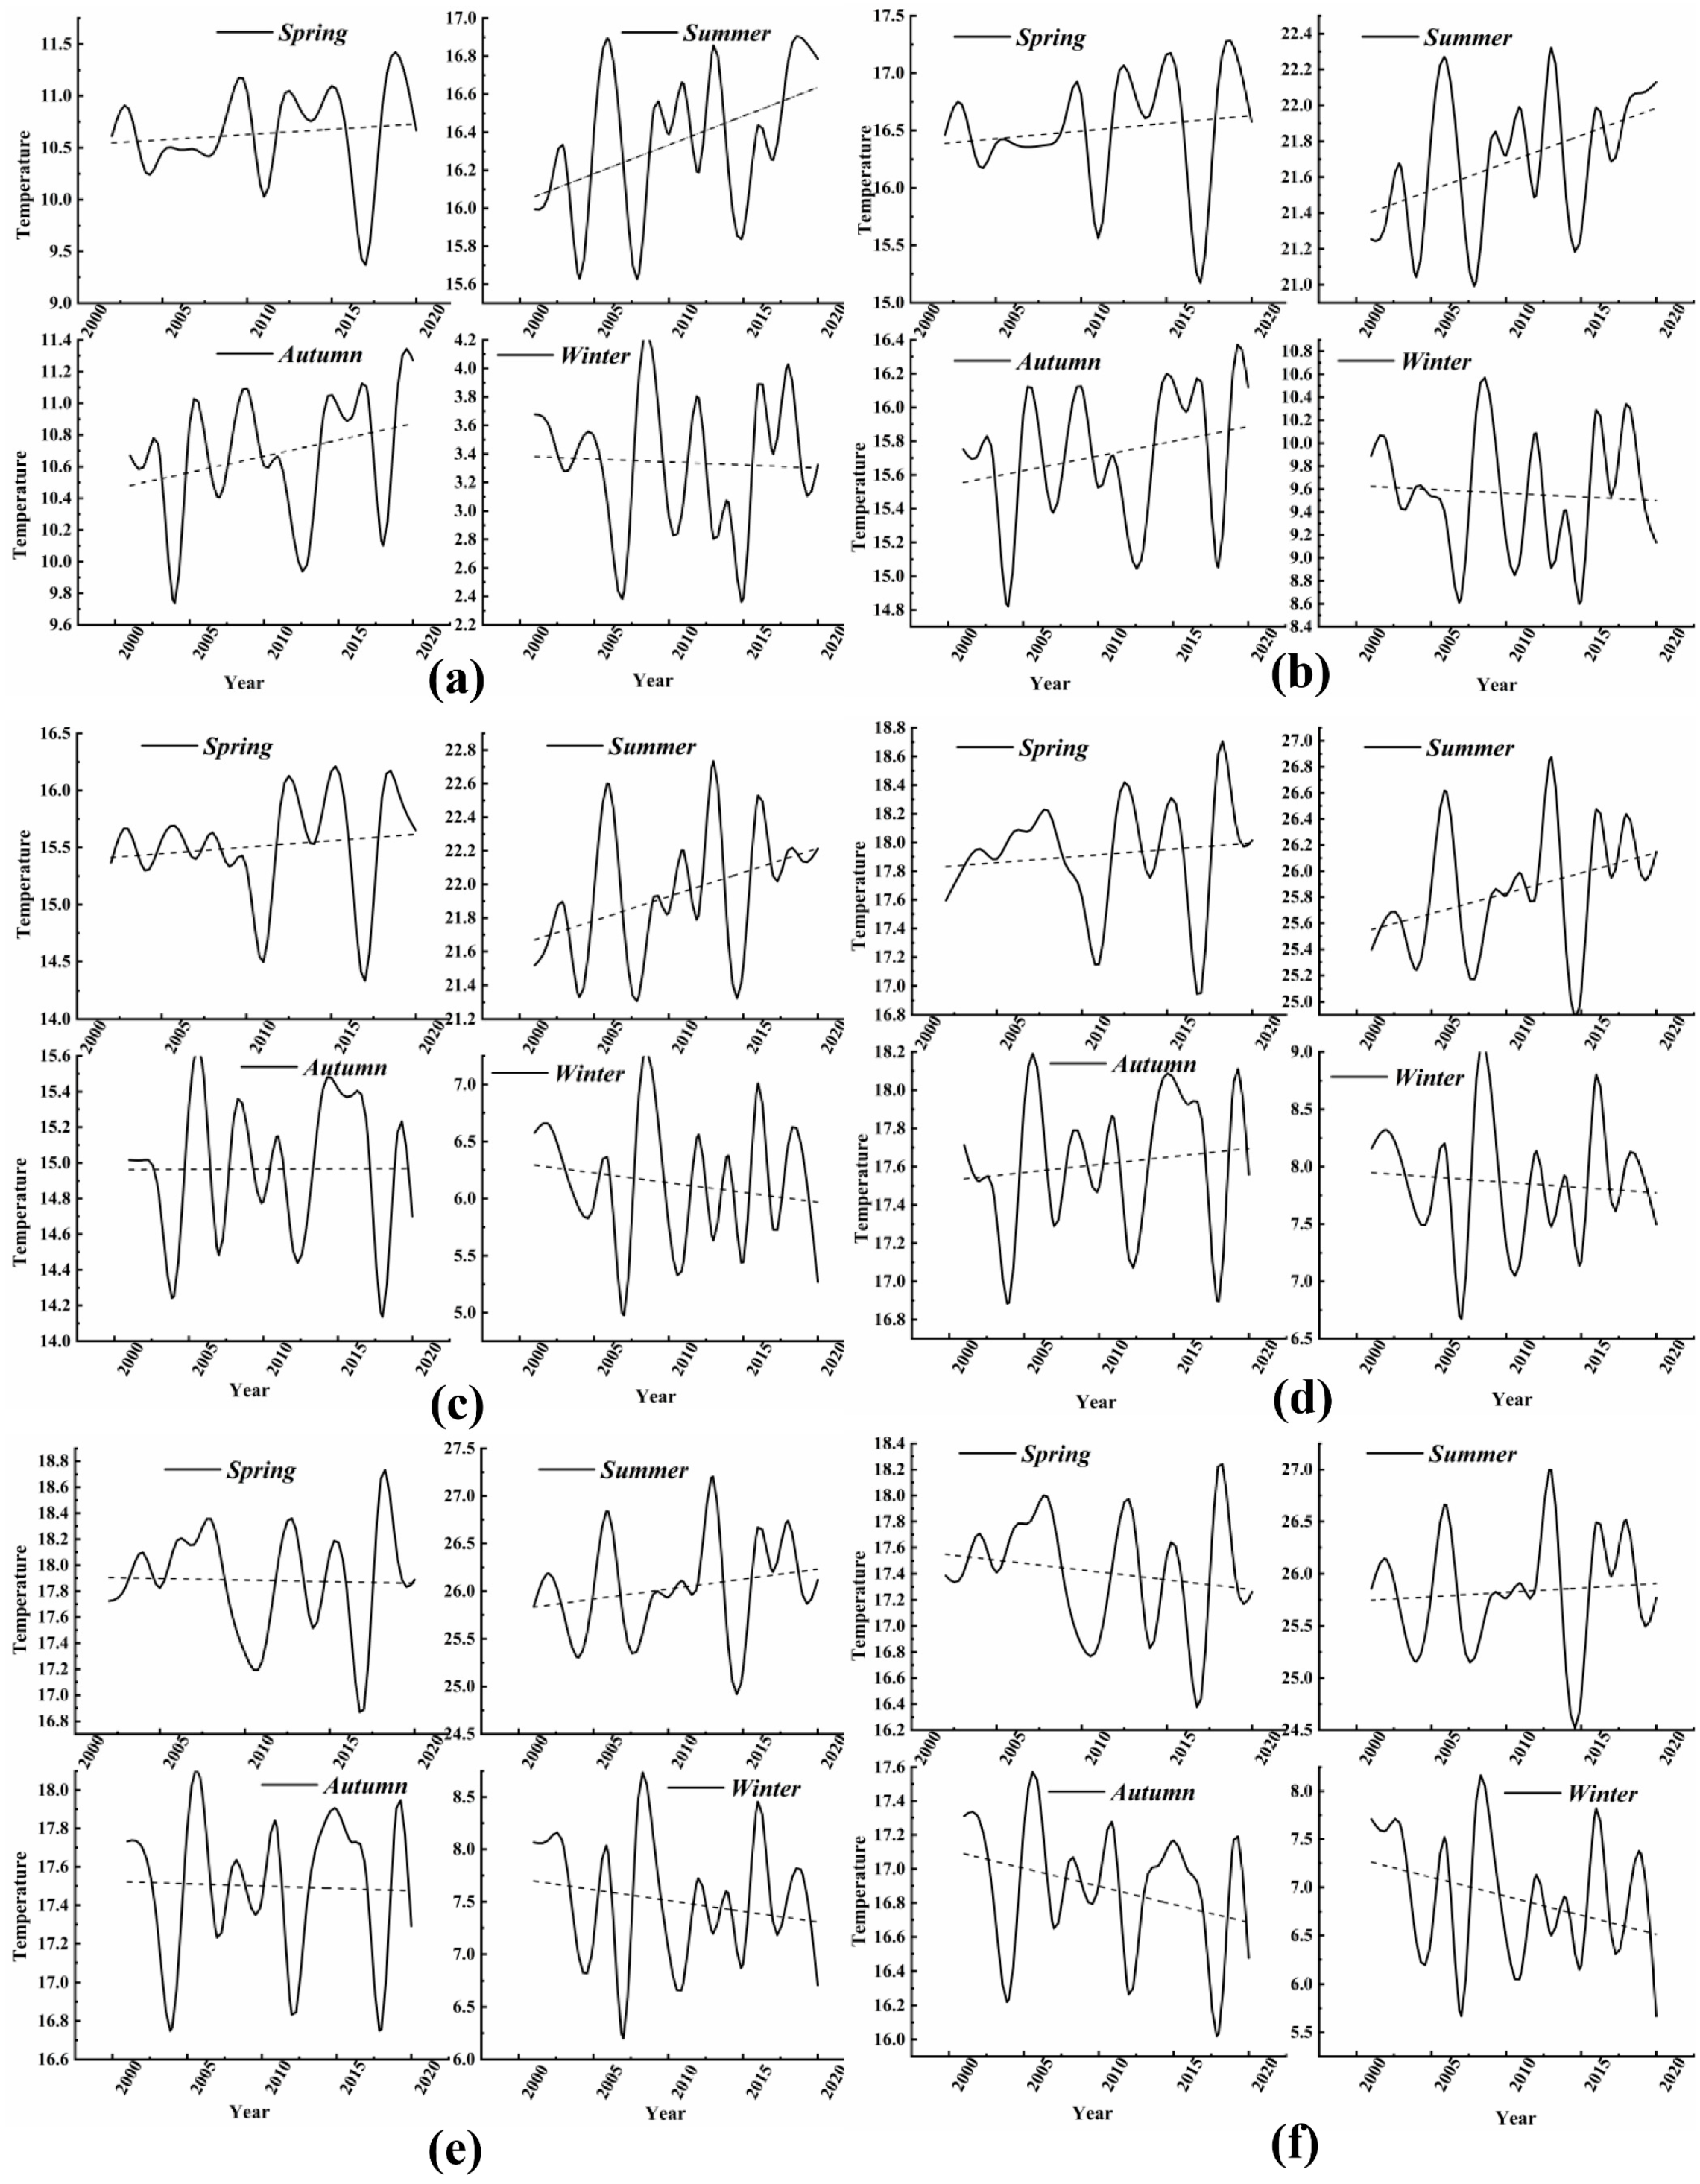
Seasonal characteristics of the temperature variation in the study area (℃). (a) Lugu Lake; (b) Qionghai Lake; (c) Ma Lake; (d) Three Forks Lake; (e) Luban Reservoir; (f) Shengzhong Reservoir. Note, the direction of the dashed line indicates the trend of temperature in spring, summer, autumn and winter.
Figure 13.
Characteristics of the drought and wet season variation in temperature (°C). (a) Lugu Lake; (b) Qionghai Lake; (c) Ma Lake; (d) Three Forks Lake; (e) Luban Reservoir; (f) Shengzhong Reservoir. Note, the direction of the dashed line indicates the trend of temperature in the drought and wet season.
Figure 14.
Land cover change of selected lakes from 2000 to 2019. (a) Lugu Lake; (b) Qionghai Lake; (c) Ma Lake; (d) Three Forks Lake; (e) Luban Reservoir; (f) Shengzhong Reservoir. Note, the types of land cover represented by the different colored lines is shown at the bottom of the figure.
Figure 14.
Land cover change of selected lakes from 2000 to 2019. (a) Lugu Lake; (b) Qionghai Lake; (c) Ma Lake; (d) Three Forks Lake; (e) Luban Reservoir; (f) Shengzhong Reservoir. Note, the types of land cover represented by the different colored lines is shown at the bottom of the figure.
Table 1.
Data sources.
| Dataset | Time Range | Satellites and Sensors | Resolution |
|---|
| Landsat 5 Collection 2 Top of Atmosphere | 2000–2011 | TM | 30 m |
| Landsat 7 Top of Atmosphere | 2000–2021 | ETM+ | 30 m |
| Landsat 8 Top of Atmosphere | 2013–2021 | OLI, TIRS | 30 m |
| JRC Global Surface Water Mapping Layers, v1.4 | 2020 | | 30 m |
| TPDC/China 1 km Precipitation (Monthly) | 2001–2019 | | 1 km |
| TPDC/China 1 km Avg Temperature (Monthly) | 2001–2019 | | 1 km |
| Annual China Land Cover Dataset | 2000–2019 | | 30 m |
Table 2.
Wavelength ranges of the band used in this study.
Table 2.
Wavelength ranges of the band used in this study.
| Satellite | Green/μm | NIR/μm | MIR/μm |
|---|
| Landsat-5 | 0.52–0.60 | 0.76–0.90 | 1.55–1.75 |
| Landsat-7 | 0.52–0.60 | 0.76–0.90 | 1.55–1.75 |
| Landsat-8 | 0.53–0.60 | 0.85–0.89 | 1.56–1.67 |
Table 3.
Results of validating water body extraction accuracy with the Global Surface Water dataset.
Table 3.
Results of validating water body extraction accuracy with the Global Surface Water dataset.
| | Lugu Lake | Qionghai Lake | Ma Lake | Three Forks Lake | Luban Reservoir | Shengzhong Reservoir |
|---|
| Overall Accuracy | 96.00% | 97.00% | 98.00% | 89.00% | 90.00% | 93.47% |
| Kappa Coefficient | 0.92 | 0.94 | 0.96 | 0.78 | 0.8 | 0.87 |
Table 4.
Comparison of the results of different extraction methods (km²).
Table 4.
Comparison of the results of different extraction methods (km²).
| Lakes | Year | ENDWI | AWEIsh/MNDWI/Supervised Classification 1 | Difference of Areas 2 |
|---|
| Lugu Lake | 2000 | 52.72 | 49.33 | 3.39 |
| 2005 | 50.72 | 49.51 | 1.21 |
| 2010 | 50.28 | 49.40 | 0.88 |
| 2015 | 49.56 | 49.50 | 0.06 |
| Ma Lake | 2005 | 6.60 | 6.98 | −0.38 |
| 2011 | 6.56 | 6.97 | −0.41 |
| 2017 | 6.77 | 6.86 | −0.09 |
| Qionghai Lake | 2004 | 26.06 | 27.29 | −1.23 |
| 2010 | 25.74 | 27.36 | −1.62 |
| 2013 | 26.24 | 26.85 | −0.61 |
| 2017 | 25.90 | 27.23 | −1.33 |
Table 5.
Mann-Kendall trend test for water area of typical lakes in Sichuan Province.
Table 5.
Mann-Kendall trend test for water area of typical lakes in Sichuan Province.
| Lakes | Time | Test | Trend |
|---|
| Sen’s Slope 1 | p 2 | Z 3 |
|---|
| LGL | Drought | −0.042 | 0.037 | −2.084 | Decreasing significantly |
| Wet | −0.060 | 0.005 | −2.808 | Decreasing significantly |
| Annual | −0.068 | 0.0003 | −3.654 | Decreasing significantly |
| QHL | Drought | −0.007 | 0.487 | −0.695 | Decreasing |
| Wet | −5.00 × 10⁻⁴ | 0.976 | −0.030 | Decreasing |
| Annual | −0.007 | 0.607 | −0.514 | Decreasing |
| ML | Drought | 0.00045455 | 0.832 | 0.212 | Increasing |
| Wet | 0.002 | 0.717 | 0.363 | Increasing |
| Annual | 0.001 | 0.739 | 0.333 | Increasing |
| TFL | Drought | −0.040 | 0.381 | −0.876 | Decreasing |
| Wet | 0.042 | 0.566 | 0.574 | Increasing |
| Annual | 0.010 | 0.880 | 0.151 | Increasing |
| LBR | Drought | 0.011 | 0.566 | 0.574 | Increasing |
| Wet | −0.013 | 0.740 | −0.332 | Decreasing |
| Annual | −0.009 | 0.740 | −0.332 | Decreasing |
| SZR | Drought | 0.563 | 0.010 | 2.567 | Increasing significantly |
| Wet | 0.653 | 0.020 | 2.325 | Increasing significantly |
| Annual | 0.668 | 0.007 | 2.688 | Increasing significantly |
Table 6.
Changes in the area of typical lakes in Sichuan Province from 2000 to 2020 (km²).
Table 6.
Changes in the area of typical lakes in Sichuan Province from 2000 to 2020 (km²).
| Name | Longitude | Latitude | Elevation | Lake Areas (km²) | Changes |
|---|
| (E) | (N) | (m) | 2000 | 2020 | (%) |
|---|
| Lugu Lake (LGL) | 100.78 | 27.71 | 2659 | 52.72 | 49.83 | −5.482 |
| Qionghai Lake (QHL) | 102.31 | 27.82 | 1475 | 26.53 | 26.51 | −0.075 |
| Ma Lake (ML) | 103.78 | 28.41 | 1079 | 6.75 | 6.85 | 1.481 |
| Three Forks Lake (TFL) | 104.28 | 30.28 | 420 | 19.78 | 21.02 | 6.269 |
| Luban Reservoir (LBR) | 105.01 | 30.91 | 424 | 12.41 | 11.85 | −4.512 |
| Shengzhong Reservoir (SZR) | 105.65 | 31.54 | 385 | 35.04 | 42.71 | 21.889 |
Table 7.
Mann–Kendall trend test for meteorological factors.
Table 7.
Mann–Kendall trend test for meteorological factors.
| Lake | Time | Precipitation | Trend | Temperature | Trend |
|---|
| Slope | Z | p | Slope | Z | p |
|---|
| Lugu Lake | Drought | −0.80 | −1.72 | 0.09 | Decreasing | −0.01 | −0.62 | 0.54 | Decreasing |
| Wet | −0.15 | −0.62 | 0.54 | Decreasing | 0.02 | 1.91 | 0.06 | Increasing |
| Qionghai Lake | Drought | −0.58 | −1.91 | 0.06 | Decreasing | −0.01 | −0.49 | 0.63 | Decreasing |
| Wet | 1.26 | 1.78 | 0.07 | Increasing | 0.03 | 1.98 | 0.05 | Increasing significantly |
| Ma Lake | Drought | −0.38 | −0.75 | 0.46 | Decreasing | −0.01 | −0.23 | 0.82 | Decreasing |
| Wet | 1.75 | 1.98 | 0.05 | Increasing significantly | 0.02 | 1.20 | 0.23 | Increasing |
| Three Forks Lake | Drought | −0.39 | −0.75 | 0.46 | Decreasing | −0.01 | −1.07 | 0.28 | Decreasing |
| Wet | 2.37 | 2.89 | 0.00 | Increasing significantly | 0.02 | 1.85 | 0.06 | Increasing |
| Luban Reservoir | Drought | −0.42 | −1.07 | 0.28 | Decreasing | −0.01 | −1.07 | 0.28 | Decreasing |
| Wet | 2.26 | 3.15 | 0.00 | Increasing significantly | 0.01 | 0.62 | 0.54 | Increasing |
| Shengzhong Reservoir | Drought | −0.25 | −0.94 | 0.35 | Decreasing | −0.03 | −1.72 | 0.09 | Decreasing |
| Wet | 1.43 | 2.30 | 0.02 | Increasing significantly | −0.01 | −0.49 | 0.63 | Decreasing |
Table 8.
Correlation of area with precipitation and temperature.
Table 8.
Correlation of area with precipitation and temperature.
| Lakes | Time | Precipitation | Temperature |
|---|
| R | p | Sig | R | p | Sig |
|---|
| Lugu Lake | wet | 0.31 | 0.18 | | −0.53 | 0.02 | *(1) |
| drought | 0.23 | 0.34 | | 0.27 | 0.24 | |
| Qionghai Lake | wet | 0.11 | 0.65 | | 0.15 | 0.52 | |
| drought | 0.15 | 0.53 | | −0.39 | 0.09 | |
| Ma Lake | wet | 0.55 | 0.01 | * | −0.07 | 0.78 | |
| drought | 0.29 | 0.22 | | 0.09 | 0.71 | |
| Three Forks Lake | wet | 0.32 | 0.17 | | −0.34 | 0.15 | |
| drought | −0.07 | 0.77 | | −0.04 | 0.86 | |
| Luban Reservoir | wet | 0.29 | 0.21 | | −0.32 | 0.17 | |
| drought | 0.15 | 0.53 | | −0.12 | 0.63 | |
| Shengzhong Reservoir | wet | 0.42 | 0.07 | | 0.01 | 0.96 | |
| drought | −0.20 | 0.39 | | −0.24 | 0.31 | |
Table 9.
Comparison of the area percentage of each lake in 2000 and 2020.
Table 9.
Comparison of the area percentage of each lake in 2000 and 2020.
| Lake | 2000 (km²) | 2020 (km²) | Proportion of Total
Area in 2000 | Proportion of Total
Area in 2020 |
|---|
| Lugu Lake | 52.72 | 49.83 | 34.4% | 31.4% |
| Qionghai Lake | 26.53 | 26.51 | 17.3% | 16.7% |
| Ma Lake | 6.75 | 6.85 | 4.4% | 4.3% |
| Three Forks Lake | 19.78 | 21.02 | 12.9% | 13.2% |
| Luban Reservoir | 12.41 | 11.85 | 8.1% | 7.5% |
| Shengzhong Reservoir | 35.04 | 42.71 | 22.9% | 26.9% |
| Total | 153.23 | 158.77 | 100% | 100% |
