Article

Salinity and Temperature Variations near the Freshwater-Saltwater Interface in Coastal Aquifers Induced by Ocean Tides and Changes in Recharge

by
Angela M. Blanco-Coronas
1,*,
Maria L. Calvache
1,2,
Manuel López-Chicano
1,2,
Crisanto Martín-Montañés
3,
Jorge Jiménez-Sánchez
3 and
Carlos Duque
1,4
1
Departamento de Geodinámica, Universidad de Granada, Avenida Fuente Nueva s/n, 18071 Granada, Spain
2
Instituto del Agua, Universidad de Granada, Calle Ramón y Cajal 4, Edificio Fray Luis, 18003 Granada, Spain
3
CN-Instituto Geológico y Minero de España (IGME-CSIC), Unidad de Granada, Urb. Alcázar del Genil, 4 Edificio Zulema, Bajo, 18006 Granada, Spain
4
Department of Geosciences, University of Oslo, Sem Sælands vei 1, 0371 Oslo, Norway
*
Author to whom correspondence should be addressed.
Water 2022, 14(18), 2807; https://doi.org/10.3390/w14182807
Submission received: 13 July 2022 / Revised: 26 August 2022 / Accepted: 7 September 2022 / Published: 9 September 2022
(This article belongs to the Special Issue Modelling Contaminant Transport and Natural Groundwater Quality)

Abstract

:
The temperature distribution of shallow sectors of coastal aquifers are highly influenced by the atmospheric temperature and recharge. However, geothermal heat or vertical fluxes due to the presence of the saline wedge have more influence at deeper locations. In this study, using numerical models that account for variable density, periodic oscillations of temperature have been detected, and their origin has been attributed to the influence exerted by recharge and tides. The combined analysis of field data and numerical models showed that the alternation of dry and wet periods modifies heat distribution in deep zones (>100 m) of the aquifer. Oscillations with diurnal and semidiurnal frequencies have been detected for groundwater temperature, but they show differences in terms of amplitudes and delay with electrical conductivity (EC). The main driver of the temperature oscillations is the forward and backward displacement of the freshwater–saltwater interface, and the associated thermal plume generated by the upward flow from the aquifer basement. These oscillations are amplified at the interfaces between layers with different hydraulic conductivity, where thermal contours are affected by refraction.

1. Introduction

Coastal aquifers are characterized by the influence of tides that generate periodic changes in the groundwater table [1,2]. The study of tidal influences has allowed the authors to determine hydraulic properties [3,4] and identify tens of tidal constituents with different fluctuation frequencies and amplitudes [5]. Semidiurnal and diurnal frequencies, as well as fortnightly components, are the most important constituents in groundwater head time series measured in unconsolidated aquifers [6,7]. The amplitude of the fluctuation decreases exponentially with the distance from the shoreline [8,9], while the time-lag between the sea level and the water table increases [1,10].
The effect of tidal oscillations on the freshwater–saltwater interface (FSI) has been the subject of far fewer studies. Sea tides impact the width of the FSI and groundwater discharge [11,12,13]. Ataie-Ashtiani et al. [14] showed that tidal oscillations favor seawater intruding further inland and result in a wider FSI than what would occur from the tidal effect alone. La Licata et al. [15] compared the results of solute transport in the transition zone with and without tidal effects, concluding that contaminant and salinity concentration are more mixed under the influence of tidal variations. Using numerical simulations, Robinson et al. [16] demonstrated that inland (freshwater discharge) and oceanic (tidal) forces strongly affect mixing processes. Pool et al. [17] showed that the impact of the tides depends largely on tidal amplitude, tidal period, and hydraulic diffusivity. Levanon et al. [18] found a correlation between the time lags of the groundwater table and oscillations in salinity, indicating a simultaneous movement of the entire freshwater body. Yu et al. [19] identified high-frequency tidal constituents (M2, S2, K1, and N2) but also lower frequency signals, which affected the recirculation cell at beaches and at the saltwater wedge.
All the above studies used different methods to investigate the effect of tidal oscillations on the groundwater table and the FSI. However, the influence of tidal fluctuations on groundwater temperature has received considerably less attention. Most temperature studies are focused on the temperature variations in the first upper meters of the aquifer [20,21,22], which are caused by the interaction between temperature, infiltrated seawater, fresh groundwater, and vertical heat conduction from the surface. Geng and Boufadel [23] compared the response of pore water salinity and temperature to tidal signals in the intertidal zone of two beaches in Alaska. Nguyen et al. [24] studied the effect of temperature on the flow, salinity distribution, and circulating seawater flux through laboratory experiments and numerical simulations subjected to tides. There are a few studies dealing with groundwater thermal oscillations produced in areas different from the surficial zone of the aquifer, where the infiltrated seawater cannot generate temperature variations. Kim et al. [25,26] detected small variations in temperature, measured at depths of up to 120 m, which are produced by the force of tidal fluctuations, but they also found significant temperature changes coinciding with seasonal rainfall. Vallejos et al. [27] identified the response of electrical conductivity (EC) and temperature to tidal cycles at a depth of 65 m. The scarcity of research dealing with temperature oscillations in deep areas of the FSI is related to the difficulty of finding deep wells in coastal aquifers that are well equipped for conducting research, the lack of data available associated with it, and prohibitive drilling prices only for research purposes, as wells in saltwater do not have a practical purpose. Other reasons are the complexity of measuring equipment specifically for salty water and high pressure, as well as the need for multiple piezometers to measure at different depths. In this sense, there is only a theoretical model for the heat distribution of coastal aquifers, considering all possible sources of heat simultaneously [28].
The use of heat as a groundwater tracer is a useful tool in the estimation of groundwater fluxes [29], but in coastal aquifers, it can also be applied to gauge the state of advancement of seawater intrusion [30]. Taniguchi [31] monitored the dynamics of the FSI using vertical profiles of temperature. Fidelibus and Pulido-Bosch [32] demonstrated that the trend of the isotherms in a karstic aquifer indicated the position of the saltwater and hence reflected groundwater vulnerability to salinization. Blanco-Coronas et al. [28] showed that when groundwater systems are affected by geothermal warming, an ascending thermal plume is generated relative to the position of the FSI. However, only LeRoux et al. [33] connected the distribution of temperature in the aquifer with the tides. All these studies highlighted the applicability of heat as a natural tracer in coastal settings, the differences with noncoastal settings, and the usefulness of establishing thermal patterns in coastal aquifers.
Below the zone of surface temperature influence, groundwater temperature generally increases with depth due to the geothermal gradient [34], which is unaffected by seasonal variations [29], although thermal trends can be reversed due to surface warming induced by climate change [35]. In discharge areas, the geothermal gradient in groundwater can be disturbed by the groundwater flow pattern [36,37,38,39]. The temperature distribution in coastal aquifers is defined by the interaction between different heat sources, such as sea water intrusion and surface water recharge [40,41], but also by geothermal heating, especially when aquifers reach depths of over 100 m. The groundwater flow near the submarine freshwater discharge zone produces a warm thermal upwelling (Figure 1). This phenomenon occurs when freshwater heated at the bottom of the aquifer is forced to ascend towards the sea due to the presence of the saline wedge. This rising of heated freshwater causes a thermal plume that is dependent on the position and shape of the FSI [28]. Simultaneously, the difference in temperature between the top and the bottom of the aquifer produces changes in the width of the FSI and the position of its toe.
The goal of this work was to study the processes that occur in coastal aquifers at depths greater than 100 m by (1) determining how temperature oscillations are induced by tidal oscillations, (2) identifying the role played by aquifer recharge variation due to seasonal changes, and (3) comparing temperature and salinity oscillations. For this purpose, EC and temperature oscillations measured in a 250 m deep well near the coastline in the Motril-Salobreña aquifer (Spain) were compared to sea level and hydraulic head fluctuations. Since field data were limited to one single point, a numerical model was constructed in order to study other factors that might have affected temperature and EC.

2. Study Area and Hydrogeological Setting
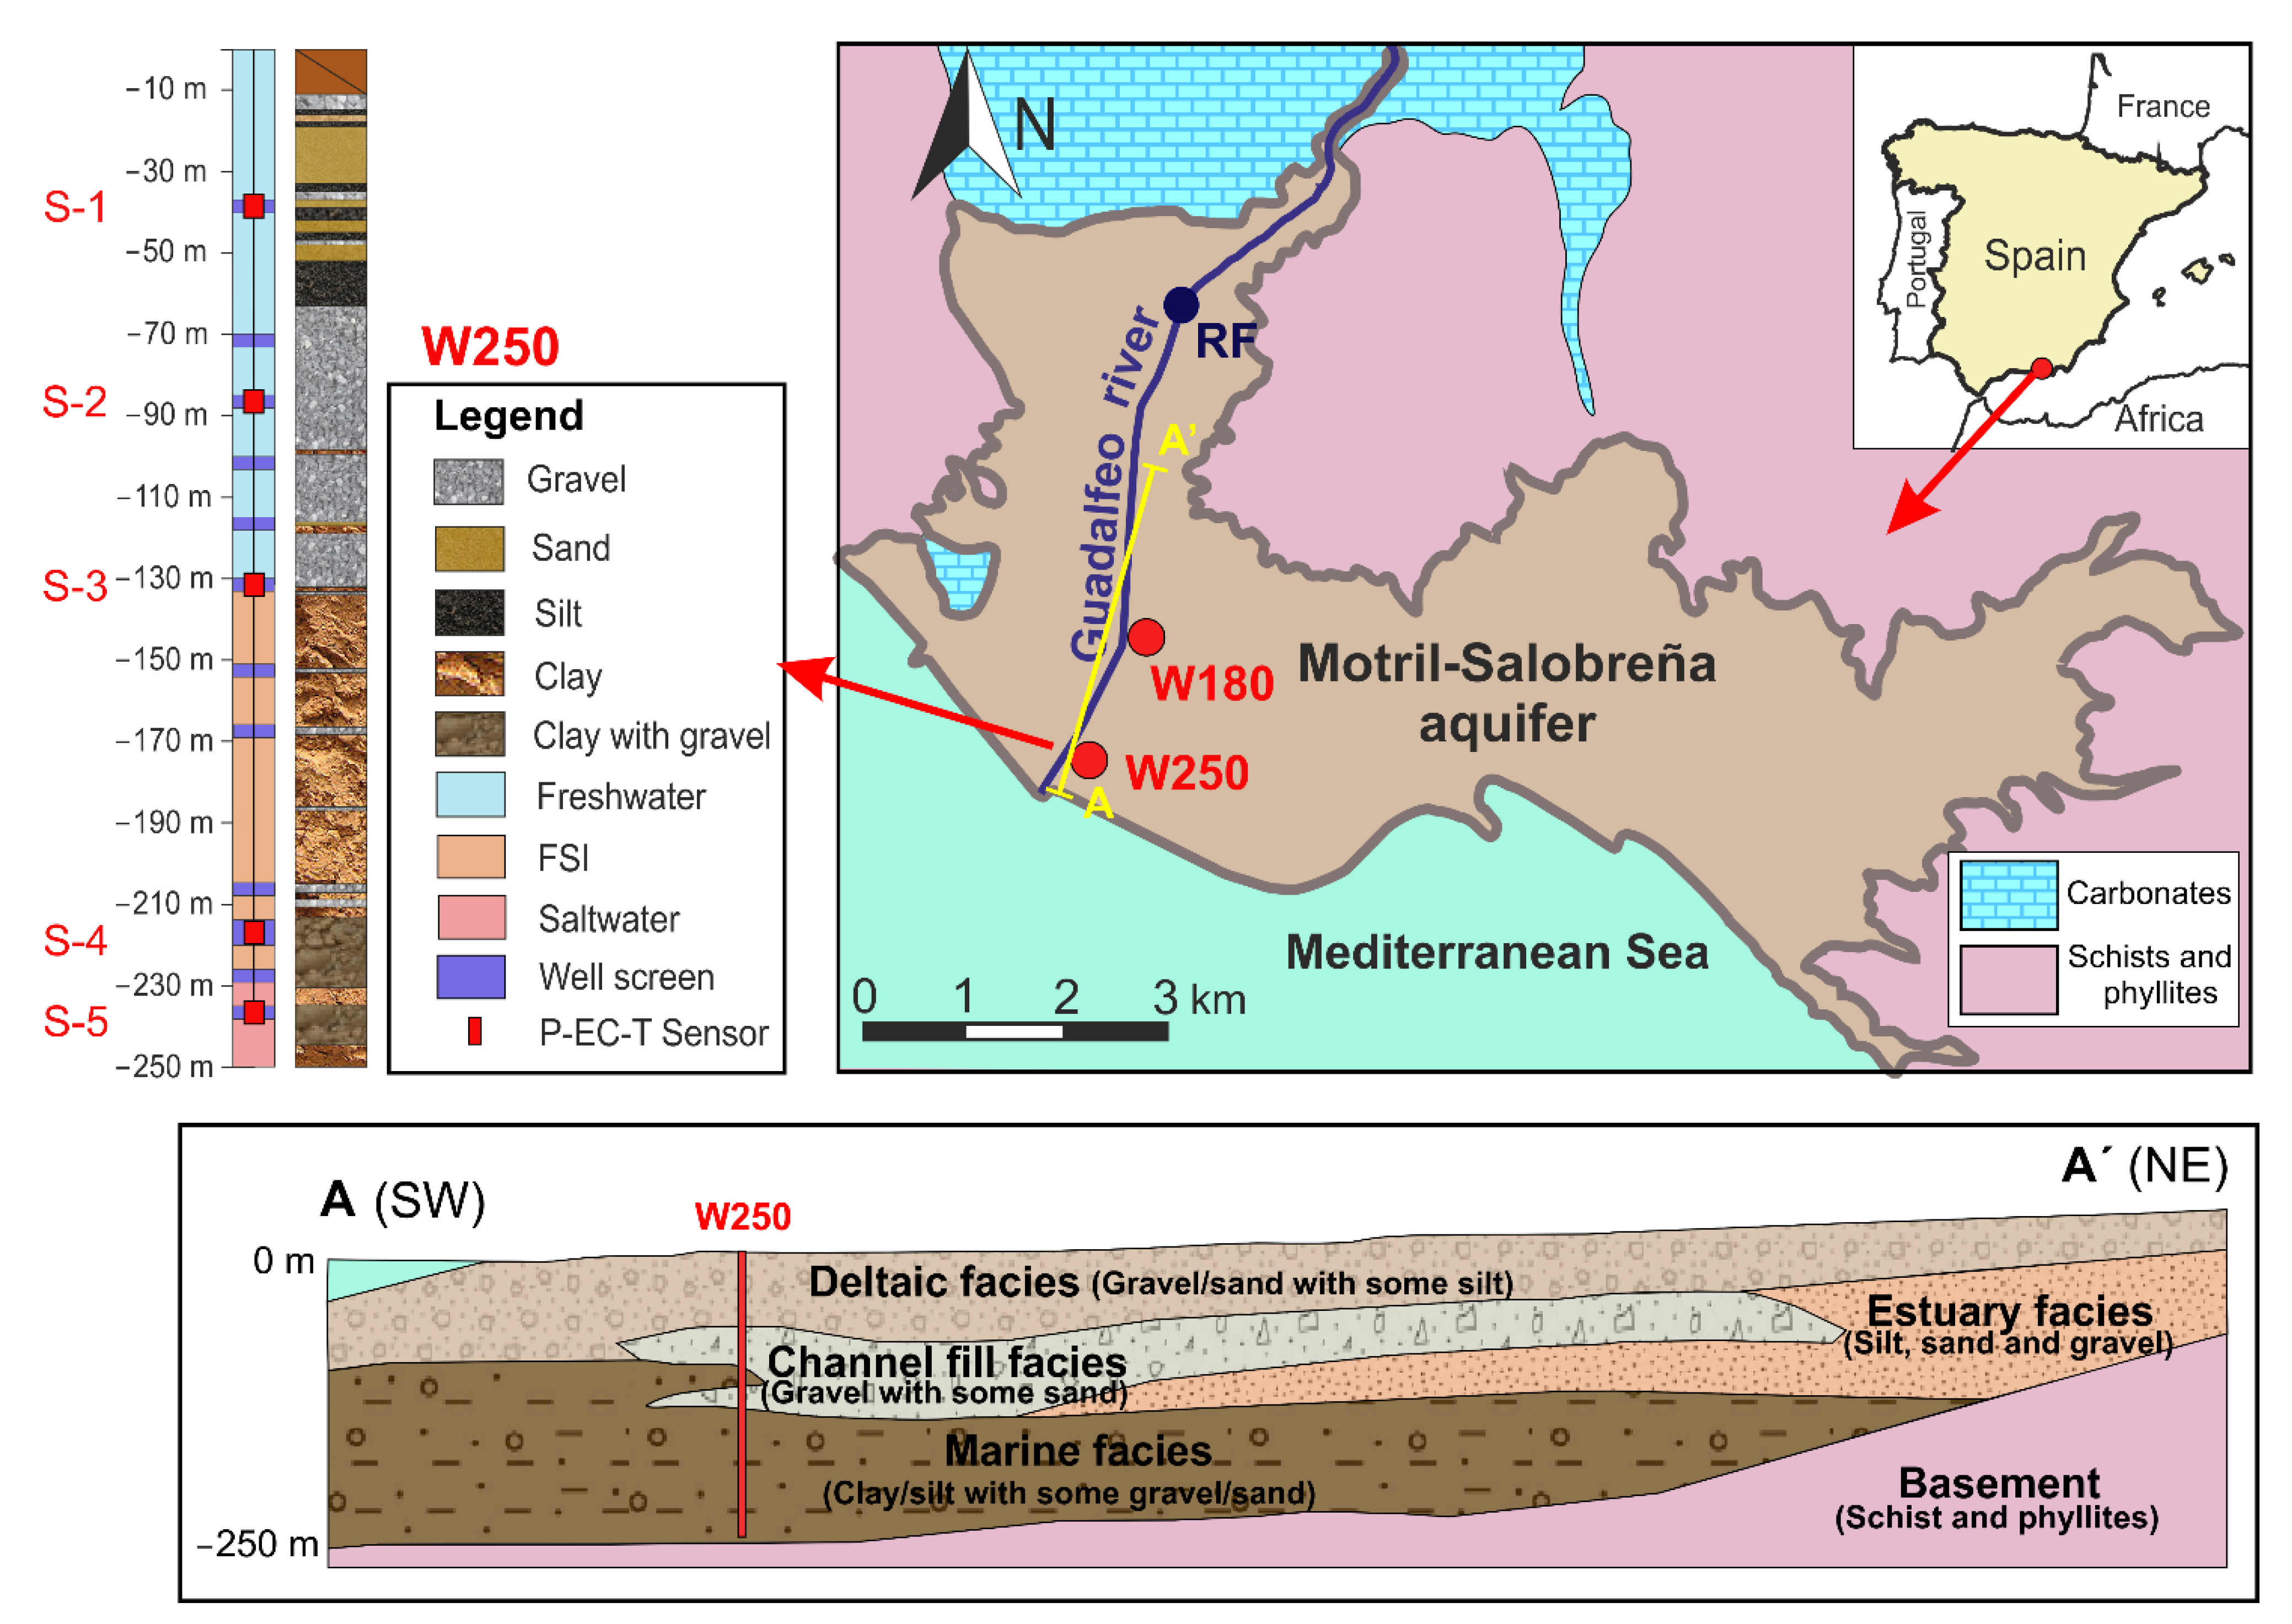
The Motril-Salobreña aquifer is located along the coast of the Mediterranean Sea in southeastern Spain (Figure 2). It extends over 42 km2, and its thickness varies from 30 to 50 m in the northernmost sector to more than 250 m in the southern sector [42]. The aquifer is composed of Quaternary detrital sediments with highly variable grain sizes (gravels, sands, and silts), which lie over an impermeable basement of metapelitic materials (schists and phyllites). The hydraulic conductivity of the materials is highly variable, ranging from 1 to 300 m/d [43,44], due to their fluvio-deltaic depositional environment.
The general flow direction in the aquifer is from north to south toward the Mediterranean Sea. The horizontal hydraulic gradients range between 1.6 × 10⁻³ and 7 × 10⁻³ [45,46].
The main recharge of the aquifer is produced by irrigation return flows from agricultural activity, with water previously uptaken from the river, and direct infiltration along the Guadalfeo River course [43,47]. The Guadalfeo River is characterized by being influent in its upper sector, causing important fluctuations in the water table related to dry and wet periods and by being effluent in the sector near the coastline [45]. Other minor recharges occur at groundwater lateral inlets and are due to rainfall infiltration [43]. The main outlet of the aquifer is groundwater discharge from the aquifer to the sea [43].
Figure 2. Location of the Motril-Salobreña aquifer, research boreholes, and the measurement point of the river flow (RF). Cross section of the depositional environments at the study area (modified from Olsen [48]).
Water 14 02807 g002
The climate of the area is Mediterranean dry with mean air temperatures around 18 °C and average precipitation of 400 mm/year. The catchment of the Guadalfeo River extends itself over 1290 km2 and drains the southern slopes of the Sierra Nevada. The highest mountain peak reaches an elevation of 3482 m, and the average annual precipitation is more than 1000 mm in that area. The hydrologic regime of the Guadalfeo River is pluvio-nival with maximum flows reached from April to June. Upstream from the Motril-Salobreña aquifer (10 km), the Rules Dam interrupts the Guadalfeo River flow. The Motril-Salobreña aquifer has not shown any signs of marine intrusion yet, and the saline wedge does not penetrate more than 500 m [42,43]
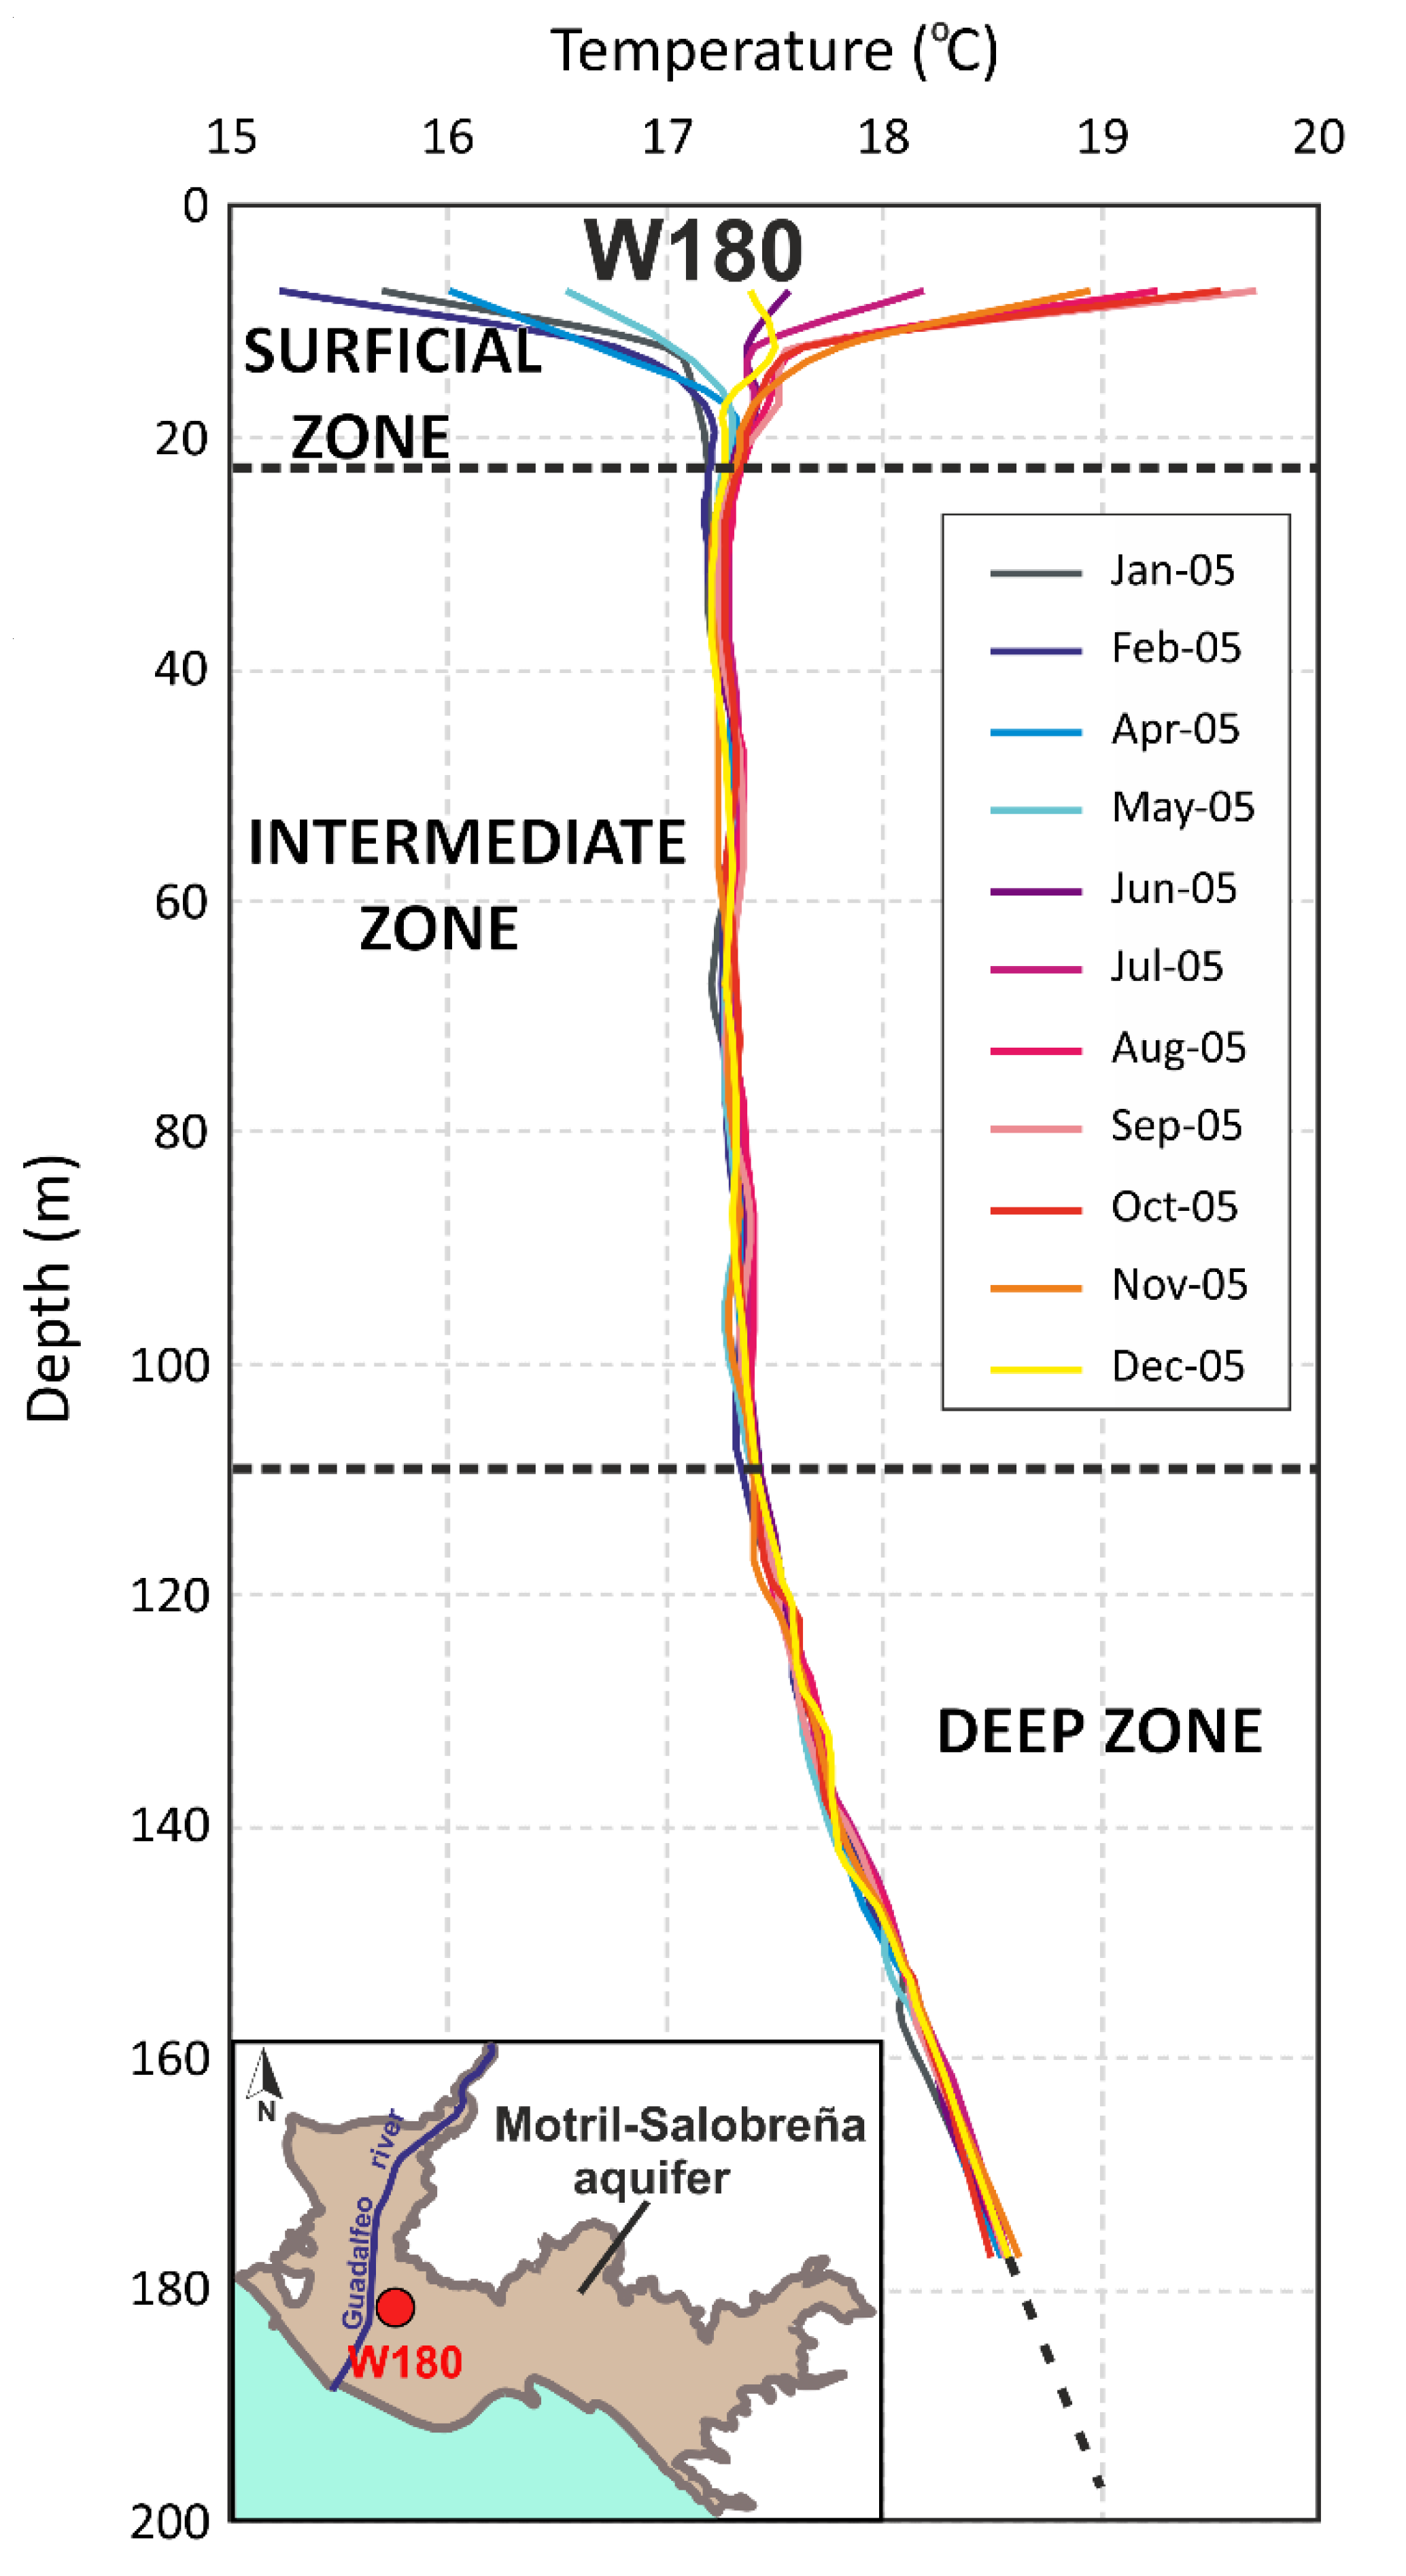
The groundwater temperature distribution in the aquifer shows three thermal zones [49] based on temperature profiles (Figure 3): (1) a surficial zone, where temperature changes due to surface water recharge and air temperature changes; (2) an intermediate zone with a relatively constant temperature of 17.2 °C; and (3) a deep zone characterized by a constant increase in temperature of 0.02 °C per meter due to geothermal heat. The research area was located in the southern part of the coastal aquifer, in the discharge zone towards the sea. A well 250 m deep (W250) was drilled 300 m from the coastline, which has 12 screens, between 3 to 6 m in length, at different depths (Figure 2). The well is artesian and had an average flow of 0.018 m3/s at the time of its opening, providing evidence of upward vertical flow in this area of the aquifer [50]. The well intersects the FSI and the three temperature zones described above. Previous studies showed fluctuations in groundwater head attributed to tidal forces [7,51].

3. Methodology

To study the factors that influence the distribution of temperature near the FSI, vertical logs of continuous hydraulic head, EC, and temperature data were collected at different depths of a multi-screened borehole over 1 year (W250) (Figure 2). A flowmeter was used to assess the direction and intensity of water circulation inside well W250. The hydraulic head and temperature values at different depths were compared with the Guadalfeo River flow and precipitation to determine their correlation with seasonal variations. Statistical analyses were applied to study temperature and EC changes related to the tidal cycle. A numerical model was constructed to test the information obtained from the field data and to simulate different scenarios to understand how changes in the water table and sea tides affect the groundwater temperature at depths of >100 m.

3.1. Field Monitoring

Hourly data of pressure, EC, and temperature were obtained with five Aqua TROLL 200 Data Loggers (In-situ, Inc. Fort Collins, CO, USA) during 2018. The EC sensor accuracy was ±0.5% of the reading, with a resolution of 0.1 µS/cm and the temperature sensor accuracy was ± 0.1 °C, with a resolution 0.01 °C. Two sensors were located within the freshwater domain (S-1 at −39 m and S-2 at −86 m) and three were within the freshwater–saltwater transition zone (S-3 at 132 m, S-4 at 217 m, and S-5 at −236 m) (Figure 2).
Vertical EC and temperature profiles in the aquifer were logged along the borehole length every 3 h, at W250, using a multiparameter probe KLL-Q-2 (Seba Hydrometrie. Kaufbeuren, Germany) during 1 day (30 September 2019). The EC sensor accuracy was ±1 µs/cm, with a resolution of 0.1 µs/cm and the T sensor accuracy was ±0.1 °C with a resolution of 0.01 °C. The measurement depths correspond to the 12 screens of W250. Because of the artesian nature of the borehole, the borehole pipe was extended 2 m above the height of the hydraulic head to avoid water outflow and the destabilization of the system.
The sea-tide dataset of the Mediterranean Sea was supplied by State Harbors (Spanish Ministry of Development) at a gauge station installed in Motril Harbor (300 m from the coastline). Tide measurements were monitored every five minutes and filtered to remove energy at high frequencies, noise, and instrument errors by applying a symmetric filter. Thereafter, the data were recalculated at hourly intervals. The sea tide was corrected in time to GMT+ 01 to allow an easier comparison with the obtained field data.
Precipitation data were obtained from the nearest hydrometeorological station (60. Motril) belonging to the Automatic Hydrological Information System (AHIS) of the Hidrosur Basin (Junta de Andalucía).
Downstream of the Rules Dam, the river flow was measured monthly throughout 2018 [46]. An electromagnetic water flow meter MF Pro (OTT HydroMet. Kempten, Germany) was used at the measurement point RF (Figure 2) to quantify the river flow. The accuracy of the velocity sensor was ±4% of the reading and the accuracy of the water level sensor was ±2% of the reading.
The vertical flow in well W250 was measured with a QL40-SFM Spinner Flowmeter probe (Mount Sopris Instruments. Denver, CO, USA). The probe used was magnetically coupled, and its quadrature sensing electronics detected flow direction changes instantaneously. Due to the artesian nature of W250, it was necessary to record the outflow with a portable gauging station H0.75 (Lynks Ingeniería. Cali, Colombia) and then to compare it with the fluid velocity at each depth of the borehole. Three series of tests were performed on well W250, logging down and logging up. Three different upload/download sensor speed values were kept constant for each series (2, 5, and 8 m/min) in order to generate a calibration curve. The obtained data were analyzed with the WellCAD v5.5 software, and the extreme peaks produced by measurement errors were eliminated. The count rate of the impeller was related to the fluid velocity and converted into fluid flow rate using a calibration curve. The sign of the fluid flow rate indicates the flow direction within the borehole: negative for ascendant flow and positive for descendant flow.

3.2. Time Series Analysis

Statistical methods were completed with commercial software (IBM SPSS software version 24.0) to analyze the tidal influence on temperature, hydraulic head, and EC time series and their correlations obtained at different depths of well W250.
To determine the influence of the seasonal variations (wet–dry periods) on the parameters (hydraulic head, EC, and temperature), the precipitation and river flow were compared with the borehole data. The data obtained during 1 year were normalized to the moving average (MA) (Equation (1)) to eliminate short-period oscillations (with periods less than 5 days) and to produce an easier contrast for the major trends:
M A = k = t n i x k n
where i is the total number of observations, n is the number of periods to be averaged, and x k is the single observed value in period k .
To detect the main tidal constituents in the sea level and temperature, harmonic analysis was conducted using the S_TIDE MATLAB 1.23 toolbox [52]. One month (February 2018) was selected for the analysis because during this period, the groundwater temperature was stable. Furthermore, the spectral energy distribution of the tidal constituents was estimated by a periodogram P ( j n ) , obtained from the decomposition of the time series into its harmonic components a j and b j [53]:
P ( j n ) = a j 2 + b j 2
The coefficients a j and b j represent the correlation of the field data with the model sinusoidal signal oscillating at j cycles in n time points.
  a j = 2 n t = 1 n x t cos ( 2 π t j n )
b j = 2 n t = 1 n x t sin ( 2 π t j n )
The causal and non-causal relationships between sea level and temperature were evaluated with a cross-correlation analysis. The correlation and the time lag between sea level, hydraulic head, EC (as an input time series), and temperature (as an output time series) were studied. The most important tidal constituent detected in the datasets (‘Principal lunar semidiurnal’ constituent M2) was chosen to obtain the delay between the input and the output signals, so that the time series were noise-filtered to eliminate measurement errors and other unidentified non-tidal factors at high frequencies and hence to improve tidal detection.
The cross-correlation function   r x y ( k ) was used to establish the link between the input time series x t (sea level, hydraulic head, and EC) and the output time series y t (temperature), solving the following equation [54]:
r x y ( k ) = C x y ( k ) σ x σ y      
C x y ( k ) = 1 n t = 1 n k ( x t x ¯ ) ( y t + k y ¯ )
where C x y ( k ) is the cross-correlogram, σ x and σ y are the standard deviations of the time series. k is the time lag, n is the length of the time series, and x ¯ and y ¯ are the mean of the input and output time series, respectively.
If r x y ( k ) > 0 for k > 0 , the input influences the output; while if  r x y ( k ) > 0 for k < 0 , the output influences the input [54,55].

3.3. Numerical Modeling

SEAWAT v.4 [56] was used to simulate simultaneous multispecies solute and heat transport. This software couples MODFLOW [57] and MT3DMS [58] and solves the following form of the variable-density groundwater flow and its adaptation to simulate heat transport. A fully saturated porous media was assumed with changes in the boundary conditions to replicate tidal oscillations to simplify the system. The model represented the effect of fluid density variations, which are caused by temperature and solute concentration variations [59,60]. In a similar manner, fluid viscosity was considered using an equation of state that relates viscosity to concentration and temperature [56].
Thermal diffusivity ( D m T ) , thermal distribution coefficient ( K d ) , and bulk thermal conductivity ( k T b u l k ) were calculated following the approach described by Langevin et al. [57].
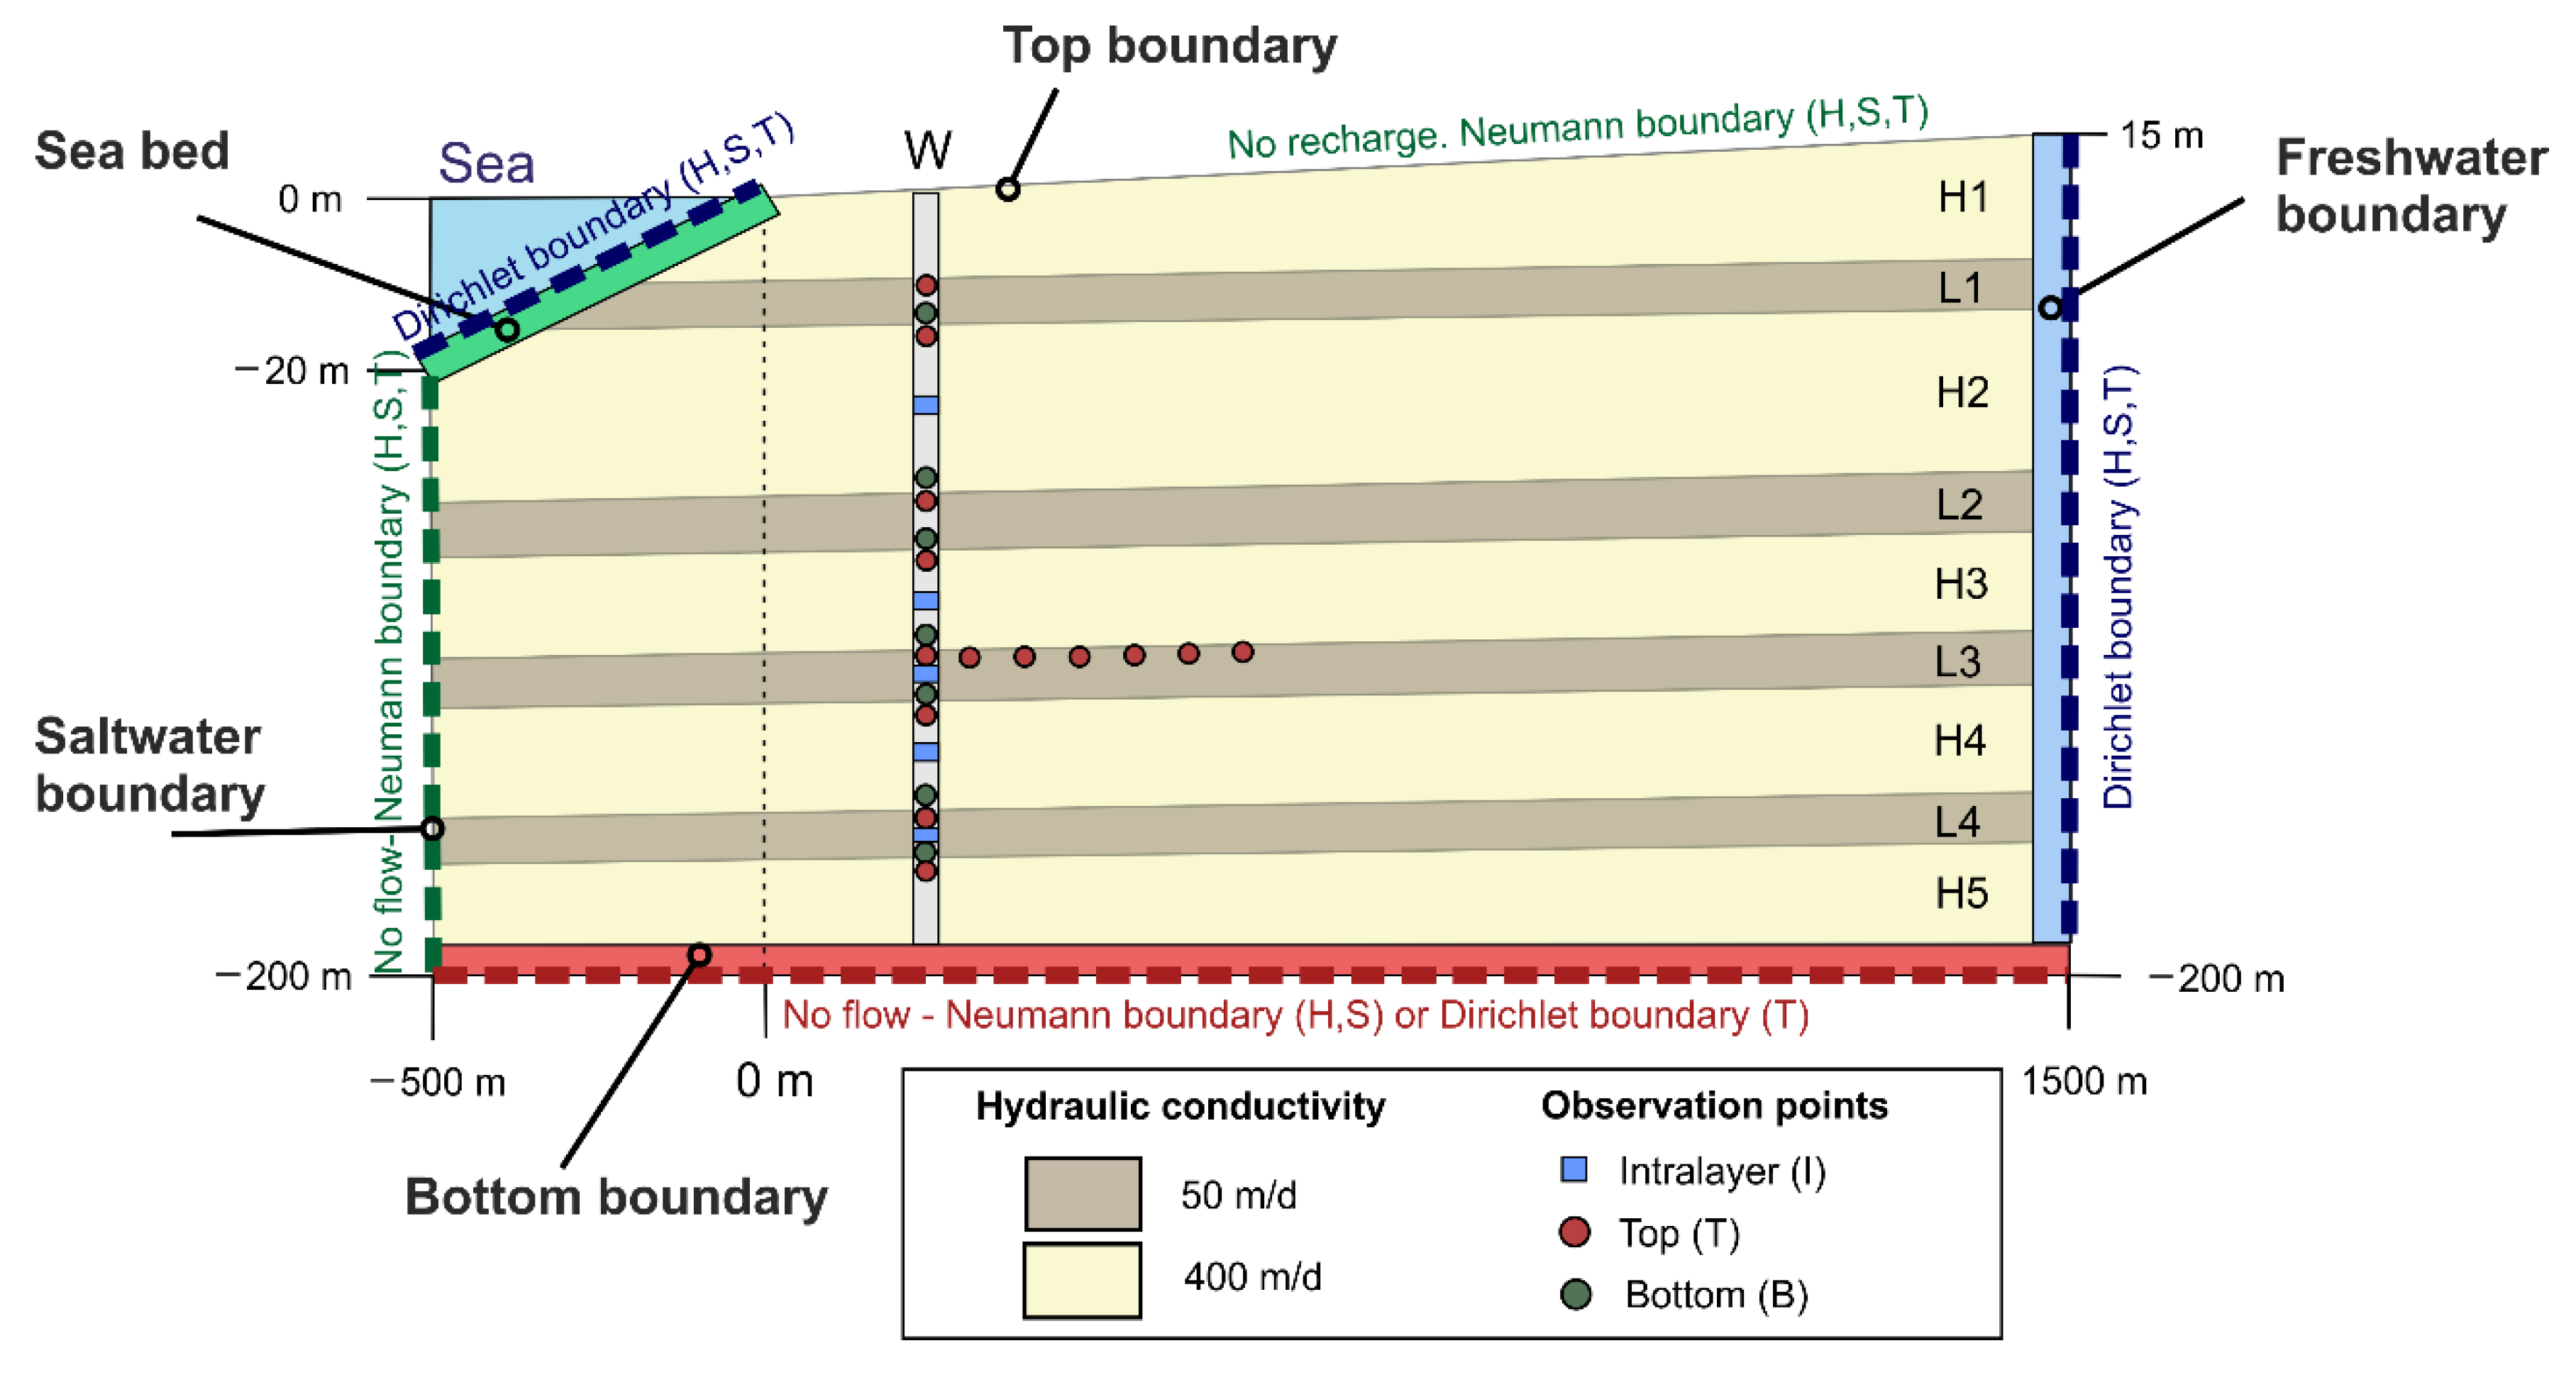
The model represents a 2 km cross-section (x-axis), of which 1.5 km extends on land and 0.5 km on the sea (Figure 4), with 180–215 m depth (z-axis). The slope of the aquifer and seabed were 1% and 4%, respectively. The grid was defined based on a mesh with 203 rows and 114 layers, with cells of 5.2 m × 20 m. After verifying the location of the FSI with a test model, the grid was refined along the FSI area (5.2 × 5 m) and at a depth of over 70 m (5.2 × 0.1 m). Because this study is focused on the discharge zone of the aquifer to the sea, distant boundaries were imposed to minimize the influence of the boundary specifications on the flow in the interest area of the aquifer.
The model is based on the characteristics of the Motril-Salobreña aquifer in terms of dimensions, lithology, and boundary conditions. However, as most of the data for the analysis corresponded with one single well, it was not intended to exactly reproduce the functioning of the aquifer even if the results could be considered an approximation to the real case.

3.3.1. Models

Three different numerical models with increasing complexity in hydrogeological characteristics and boundary conditions (specified in Figure 4 and Table 1) were tested to determine the impact of sea and water table oscillations on the distribution of temperature in the aquifer.
-
Model A (Homogeneous model): the hydraulic conductivity was homogeneous (100 m/d).
-
Model B (Heterogeneous layered model): nine layers with different hydraulic conductivity (50 and 400 m/d) were included to modify model A. The thickness of the layers was 15 m for the layers with lower hydraulic conductivity (L1, L2, L3 and L4) and 20–45 m for the layers with higher hydraulic conductivity (H1, H2, H3 and H4) (Figure 4). The alternation of layers with the two values of hydraulic conductivity represented the vertical heterogeneity often found in alluvial coastal aquifers.
-
Model C (Changes in recharge conditions): the model parameters were the same as those of model B, but the recharge effect was simulated, modifying the boundary conditions to reproduce a gradually increasing hydraulic gradient, justified by fluctuations of the water table in the upper sector of the aquifer (up to 5 m from summer to winter), and by the lack of recharge of the river near the coastline [45].
The rest of the parameters of the model were based on standard values presented in the literature or estimated based on previous local studies (specified in Section 3.3.3. Parameters and time discretization).

3.3.2. Boundary Conditions

1. Freshwater boundary: this boundary is the main freshwater input to the aquifer. For models A and B, it had a constant head of 8 m above sea level; and for model C, the head was gradually raised from 8 m to 13 m over 40 days, which meant an increment of the hydraulic gradient from 0.0058 to 0.0087 (an increase of 41%) from the mean sea level (0 m). For the three models, the salinity was 350 mg/L, and the temperature was 17 °C (Dirichlet boundary condition) based on field measurements.
2. Sea bed boundary: a sinusoidal oscillation head boundary was imposed using the expression:
H = A sin ( 2 π P   t φ )
where H is the transient sea level at time t [L], A is the half of the tidal range [L], P is the period of tide oscillation [t], t is the time [t], and φ is the phase of the tide [rad]. Although different tidal constituents were detected in the field data, only the period of the most important one (‘Principal lunar semidiurnal’ M2) was considered. The semidiurnal tide fluctuation was adjusted with three amplitudes, taking into account microtidal, mesotidal, and macrotidal ranges (0.75 m, 1.5 m, and 2.5 m, respectively) for models A and B. For model C, a mesotidal condition was selected to represent an intermediate value of tidal amplitude. A salinity of 35,000 mg/L and a temperature of 13 °C were assigned, both based on field measurements.
3. Bottom boundary: the temperature imposed at the base of the model was 24 °C, based on the mean value of the geothermal gradient increment described in [29]. No flow boundary was applied for head and salinity.
4. Top boundary: no recharge. Neumann boundary condition (no flow) for temperature, salinity, and head.
5. Seawater boundary: Neumann boundary conditions for temperature, salinity, and head. The Dirichlet was not considered as preliminary analysis of the study indicated that a no flow boundary did not interfere with the salinity and temperature distribution of the FSI and freshwater domain where data was obtained.
Table 1. Values of hydraulic head (H), salinity (S) and temperature (T) given to each boundary of the models A, B and C.
ModelParameterFreshwaterSea BedSaltwaterTopBottom
Model AHDirichlet
8 m
Dirichlet
H = A sin ( 2 π P   t φ )
Neumann
No flow
Neumann
No flow
Neumann
No flow
SDirichlet
350 mg/L
Dirichlet
35,000 mg/L
Neumann
No flow
Neumann
No flow
Neuman
No flow
TDirichlet
17 °C
Dirichlet
13 °C
Neumann
No flow
Neumann
No flow
Dirichlet
24 °C
Model BHDirichlet
8 m
Dirichlet
H = A sin ( 2 π P   t φ )
Neumann
No flow
Neumann
No flow
Neumann
No flow
SDirichlet
350 mg/L
Dirichlet
35,000 mg/L
Neumann
No flow
Neumann
No flow
Neuman
No flow
TDirichlet
17 °C
Dirichlet
13 °C
Neumann
No flow
Neumann
No flow
Dirichlet
24 °C
Model CHDirichlet
8 to 13 m
Dirichlet
H = A sin ( 2 π P   t φ )
Neumann
No flow
Neumann
No flow
Neumann
No flow
SDirichlet
350 mg/L
Dirichlet
35,000 mg/L
Neumann
No flow
Neumann
No flow
Neuman
No flow
TDirichlet
17 °C
Dirichlet
13 °C
Neumann
No flow
Neumann
No flow
Dirichlet
24 °C

3.3.3. Parameters and Time Discretization

The model was run for a total of 500 days in order to stabilize the system, using as starting salinity and temperature distribution the steady-state solution of the model, with a constant head at the sea bed boundary, and without tidal oscillations (0 m). The results were used as initial conditions for models A and B, changing the boundary conditions (Table 1). For model C, the initial conditions were the results of model B.
The parameters used for the simulation were obtained from the literature and based on previous local studies (Table 2). The seawater and freshwater temperatures were assumed to be constant since they should not experience important seasonal variations due to the short period of simulation (40 days). The values of hydraulic conductivity differed between models (Section 3.3.1.), however, the rest of the input parameters did not change. The influence of K d t and D m T was found to be not as important as hydraulic conductivity [28] and thus homogeneous values were given to both parameters.
The results of the three models were compared with several sets of observation points located 217 m from the shoreline (Figure 4) because both the FSI and the thermal plume were intersected at that location. The observation points were positioned at the top, middle, and bottom of the layers (Table 3) in order to compare the differences in temperature distribution. They were named according to the designated layer and the situation inside the layer (top T, bottom B, or intralayer I). In model B, six observation points at the top of layer L3 were added (Figure 4) to study the differences in temperature with respect to the distance from the shoreline.

4. Results

4.1. Vertical Flow in the Borehole

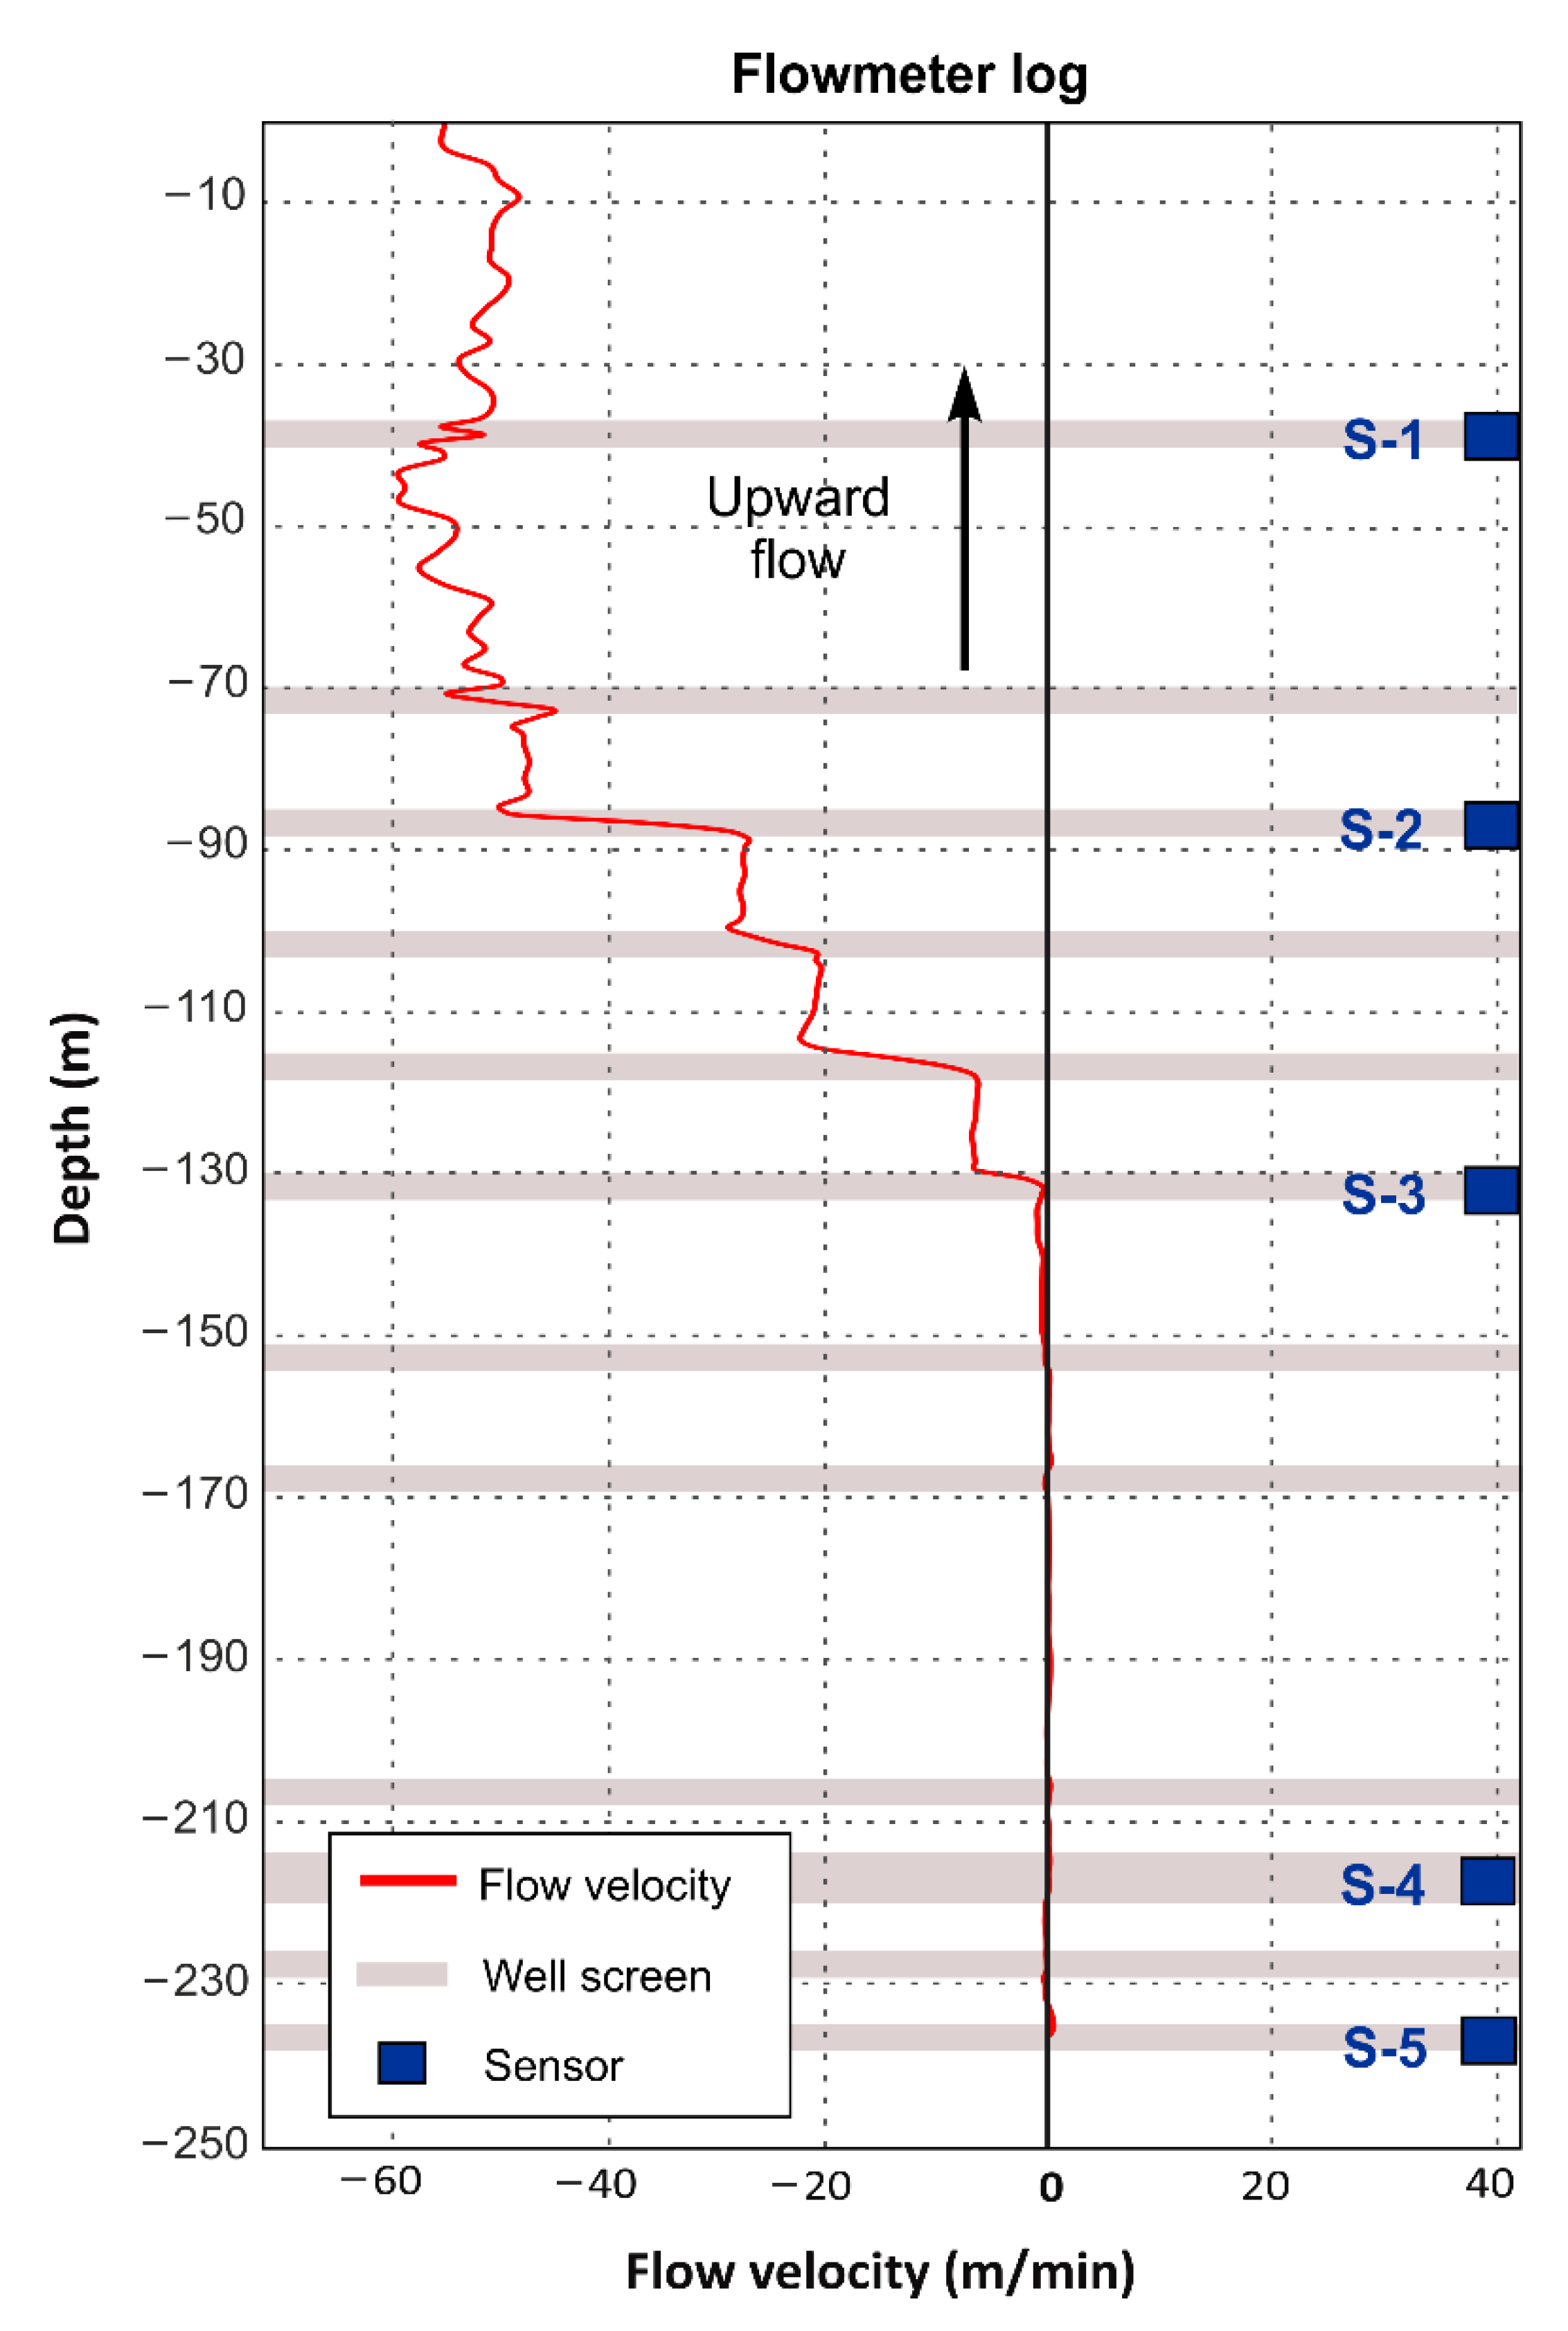
The flowmeter measurements allowed us to distinguish two flow mechanisms within the borehole. From ground surface to −130 m, the flow was upward with a maximum accumulated flow velocity of 60 m/min at a depth of −50 m (Figure 5). Within those 130 m, the first 84 m had a highly variable velocity, and from −84 m to −130 m, the vertical flow velocity increased throughout the screens (Figure 5). The maximum increase in velocity was produced between −84 m and −87 m. From −130 m to the bottom, the vertical flow was almost non-existent. There were no variations in the velocity values at the depths of the screens where the sensors S-3, S-4, and S-5 were installed. This indicates that the data obtained at 130 m and below were not induced by mixing processes inside the well casing, while data obtained from S-1 and S-2 would be highly influenced by internal mixing due to the dominance of vertical flow velocity over lateral flow velocity. Based on the flowmeter results, the datasets obtained in S-1 and S-2 were discarded, while the datasets obtained in S-3, S-4, and S-5 were considered representative of the aquifer conditions.

4.2. Water Table Variation Effect on Temperature Oscillation in the FSI

To determine whether there was an influence from the seasonal variations of the groundwater recharge on the fluctuations of head, temperature, and EC, the precipitation and river flow data were compared to the recorded data from January to December 2018, using sensors S-4 and S-5 (Figure 6). At the end of 2017 and during the first two months of 2018, rainfall was scarce, and the river flow was less than 1 m3/s. The lack of surface water prevented the recharge of the aquifer, and thus heads remained low in the aquifer. In March 2018, a period of continuous precipitation started. However, the peak river flow was not reached until May 2018 (7.5 m3/s) due to the snowmelt in the nearby mountains and the management of river flow by a dam. Since May, the hydraulic heads increased due to the river flow recharge. In July 2018, with the beginning of the summer, a new dry period without precipitation started, and ended in October–November 2018.
EC and temperature within the aquifer also responded to wet periods. From January to April (first dry period), EC was approximately 21000 µS/cm in S-4 and approximately 45,000 µS/cm in S-5. In May 2018, EC decreased to 17000 and 20000 µS/cm in S-4 and S-5, respectively. However, when the wet period ended, EC recovered its initial values in S-4, but, in the case of S-5, it took longer for EC to reach the initial values. The same process can be observed in November 2018.
In S-5, temperature variations showed the same pattern as EC. Temperature oscillated between 19.8 and 20 °C in the first period (from January to April), and then it was lower (19.4–19.7 °C) starting from May 2018. Until October 2018, the temperature did not recover the values of the first period. After the second wet period, the temperature reached similar values to the first wet period. In S-4, the process was inverted and delayed with respect to the temperature measured in S-5: when the temperature decreased in S-5, it increased in S-4 about 1 month later. Temperature started with values around 19 °C and then increased to 19.4–19.5 °C starting from May 2018. Subsequently, a decrease in temperature was produced in early November 2018, related to the end of the dry period (19 °C), and then at the end of November 2018, the temperature reached the same values as the first wet period (19.4–19.5 °C). The comparison of the results in S-4 and S-5 indicated irregular patterns in temperature that differed depending on the locations of the observation point, but it still showed the same inverse relationship between S-4 and S-5. This irregularity seemed to be induced by changes in the groundwater recharge. However, the cause–effect relationship at the root of this behavior was still unclear and thus it was further studied, as explained in the next sections.

4.3. Sea Tides Effect on Temperature and EC Oscillations in the FSI

4.3.1. Model Setup

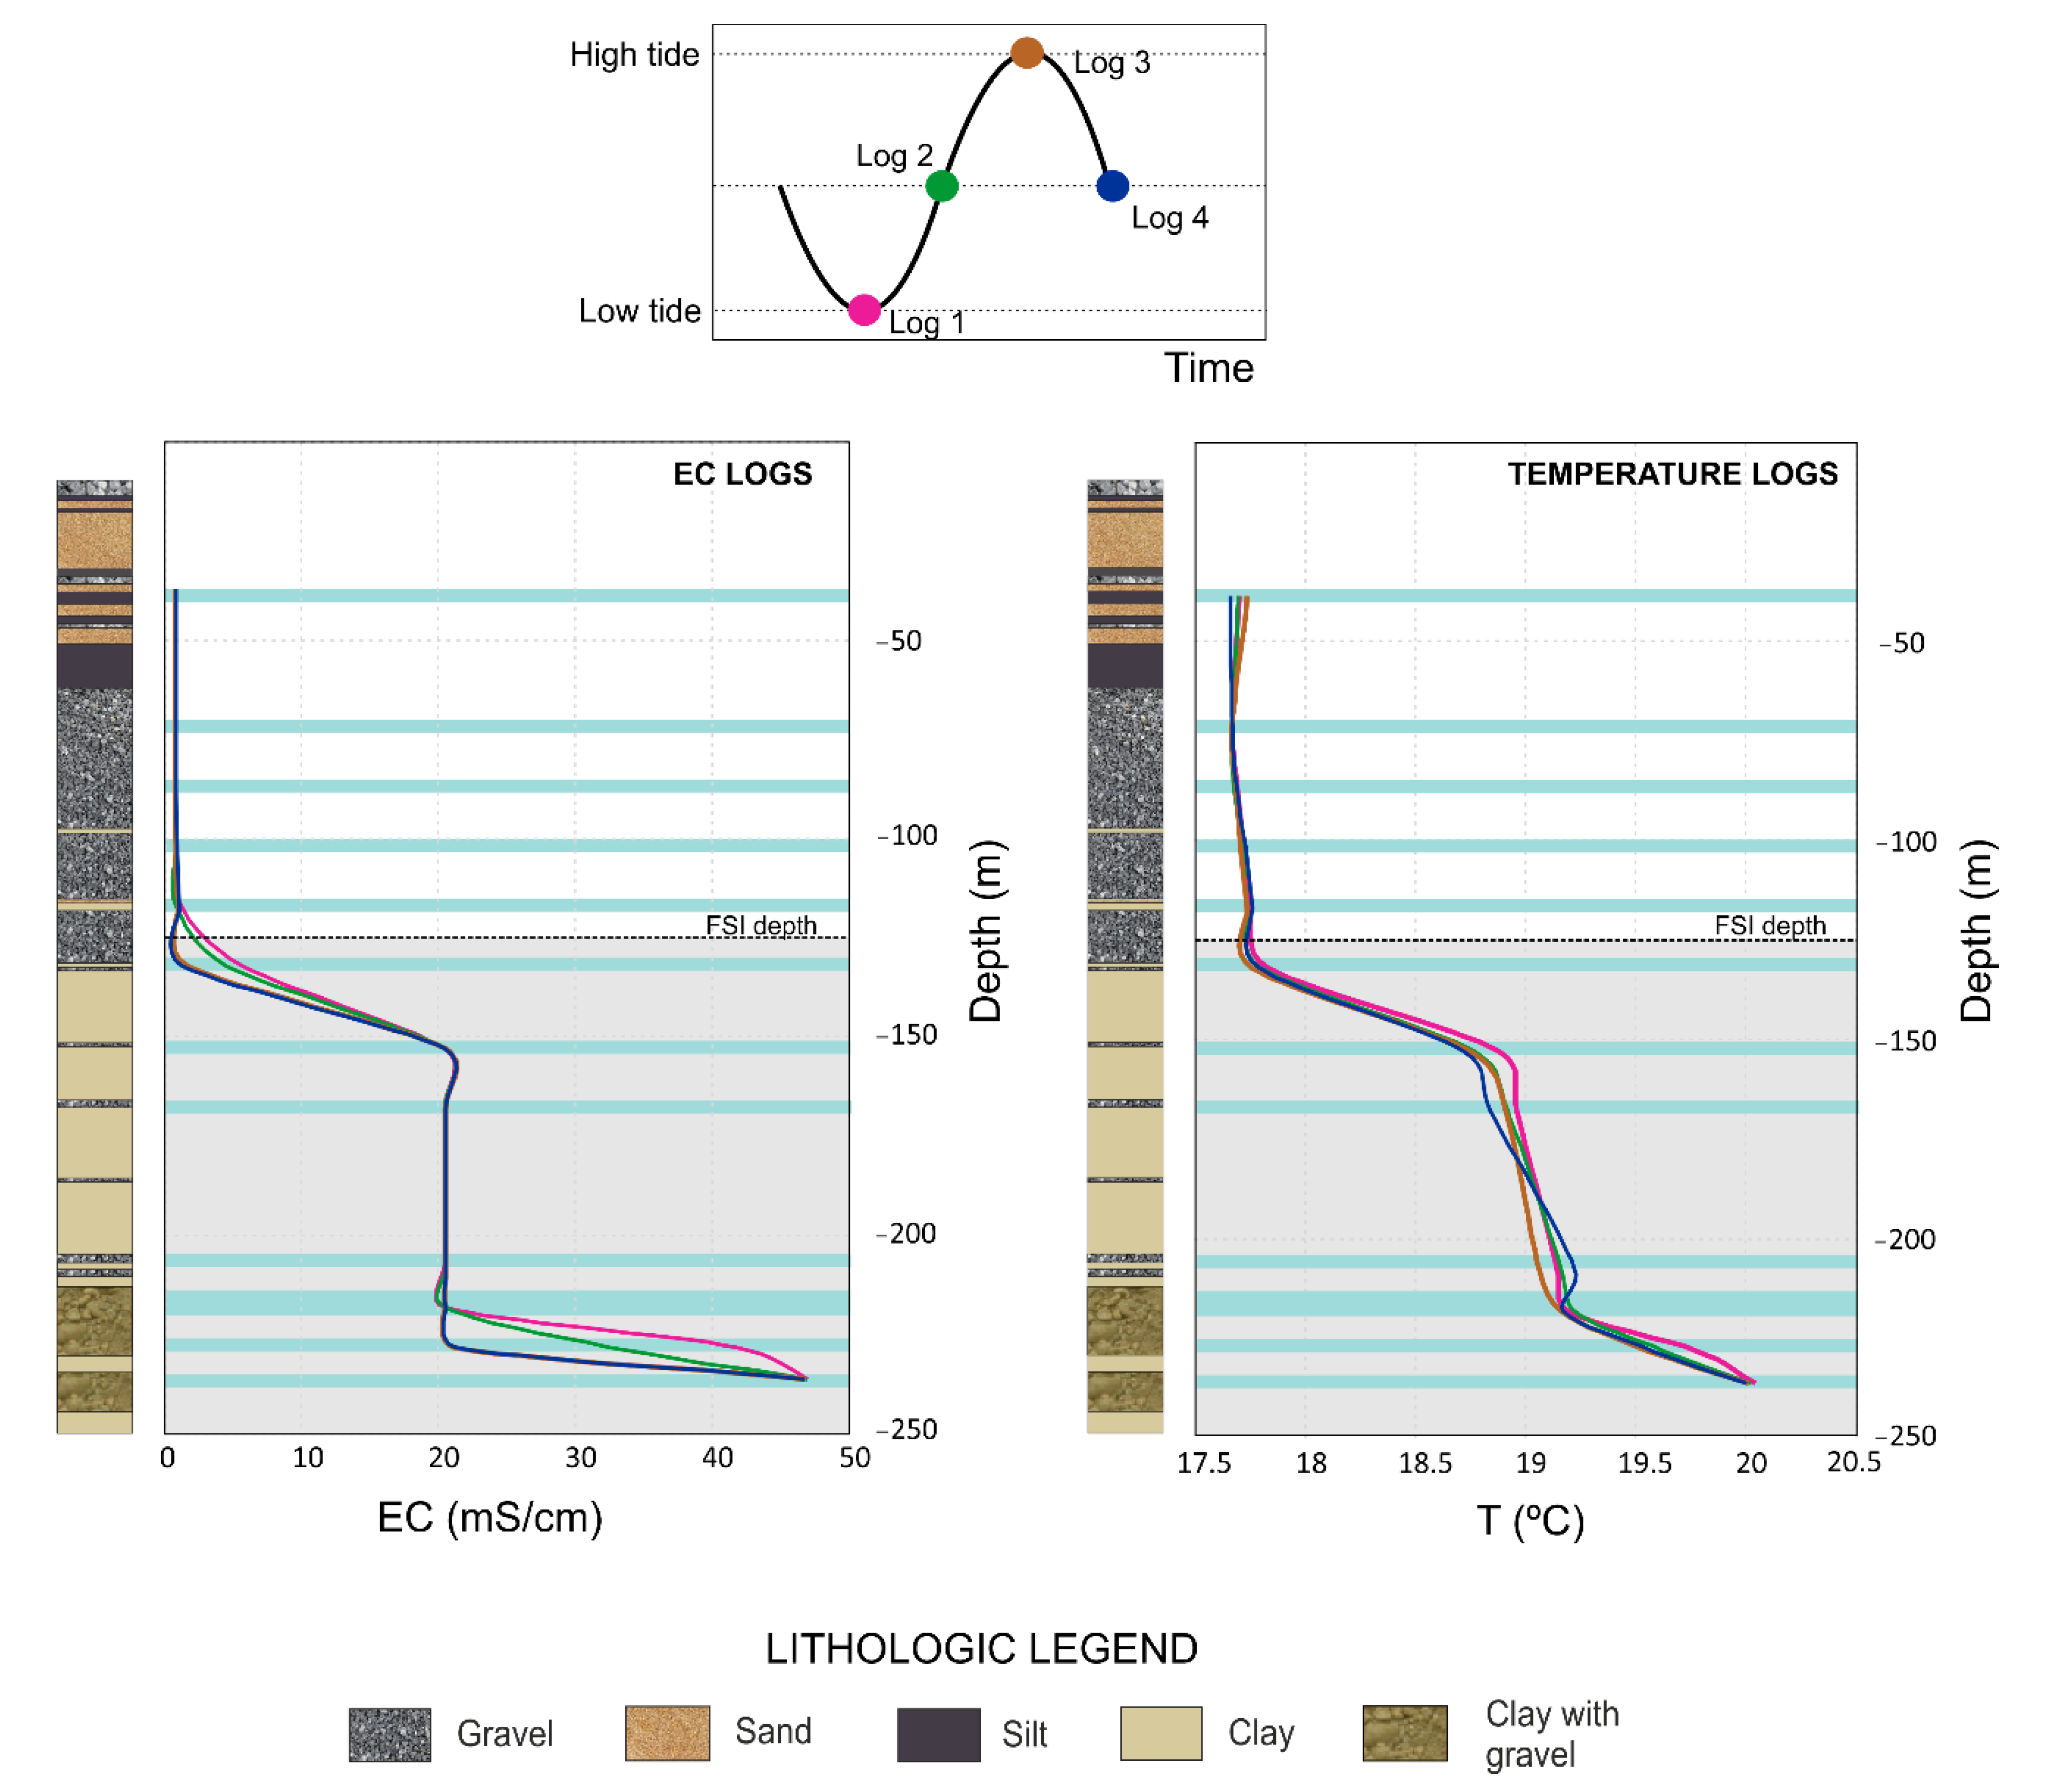
The vertical logs obtained in well W250 during one tidal cycle (Figure 7) showed no changes over the first 130 m, excluding the most surficial zone of the aquifer (first 50 m) that was probably influenced by air temperature. The beginning of the FSI was located at 130 m, from which EC and temperature increased sharply until reaching 160 m (first step increment). The beginning of the increment in EC reflected the start of the FSI. However, from 160 m to 220 m of depth, EC was constant and temperature increased slowly due to the geothermal gradient, which affects the groundwater temperature. From 220 m to the end of the well, the values of both parameters increased sharply again (a second step in the increment of their values).
The EC and temperature showed changes throughout the tidal cycle in the FSI domain. EC and temperature were highest during low tide (Log 1). At the mid-point of sea-level rise, EC and temperature decreased (Log 2). When high tide was reached (Log 3), EC and temperature generally decreased even more. At the mid-point of sea level fall (Log 4), EC had almost the same values as those of Log 3; however, temperature was slightly higher (by ~0.1 °C), which was more evident in the deepest part of the aquifer.

4.3.2. Continuous Temperature Data

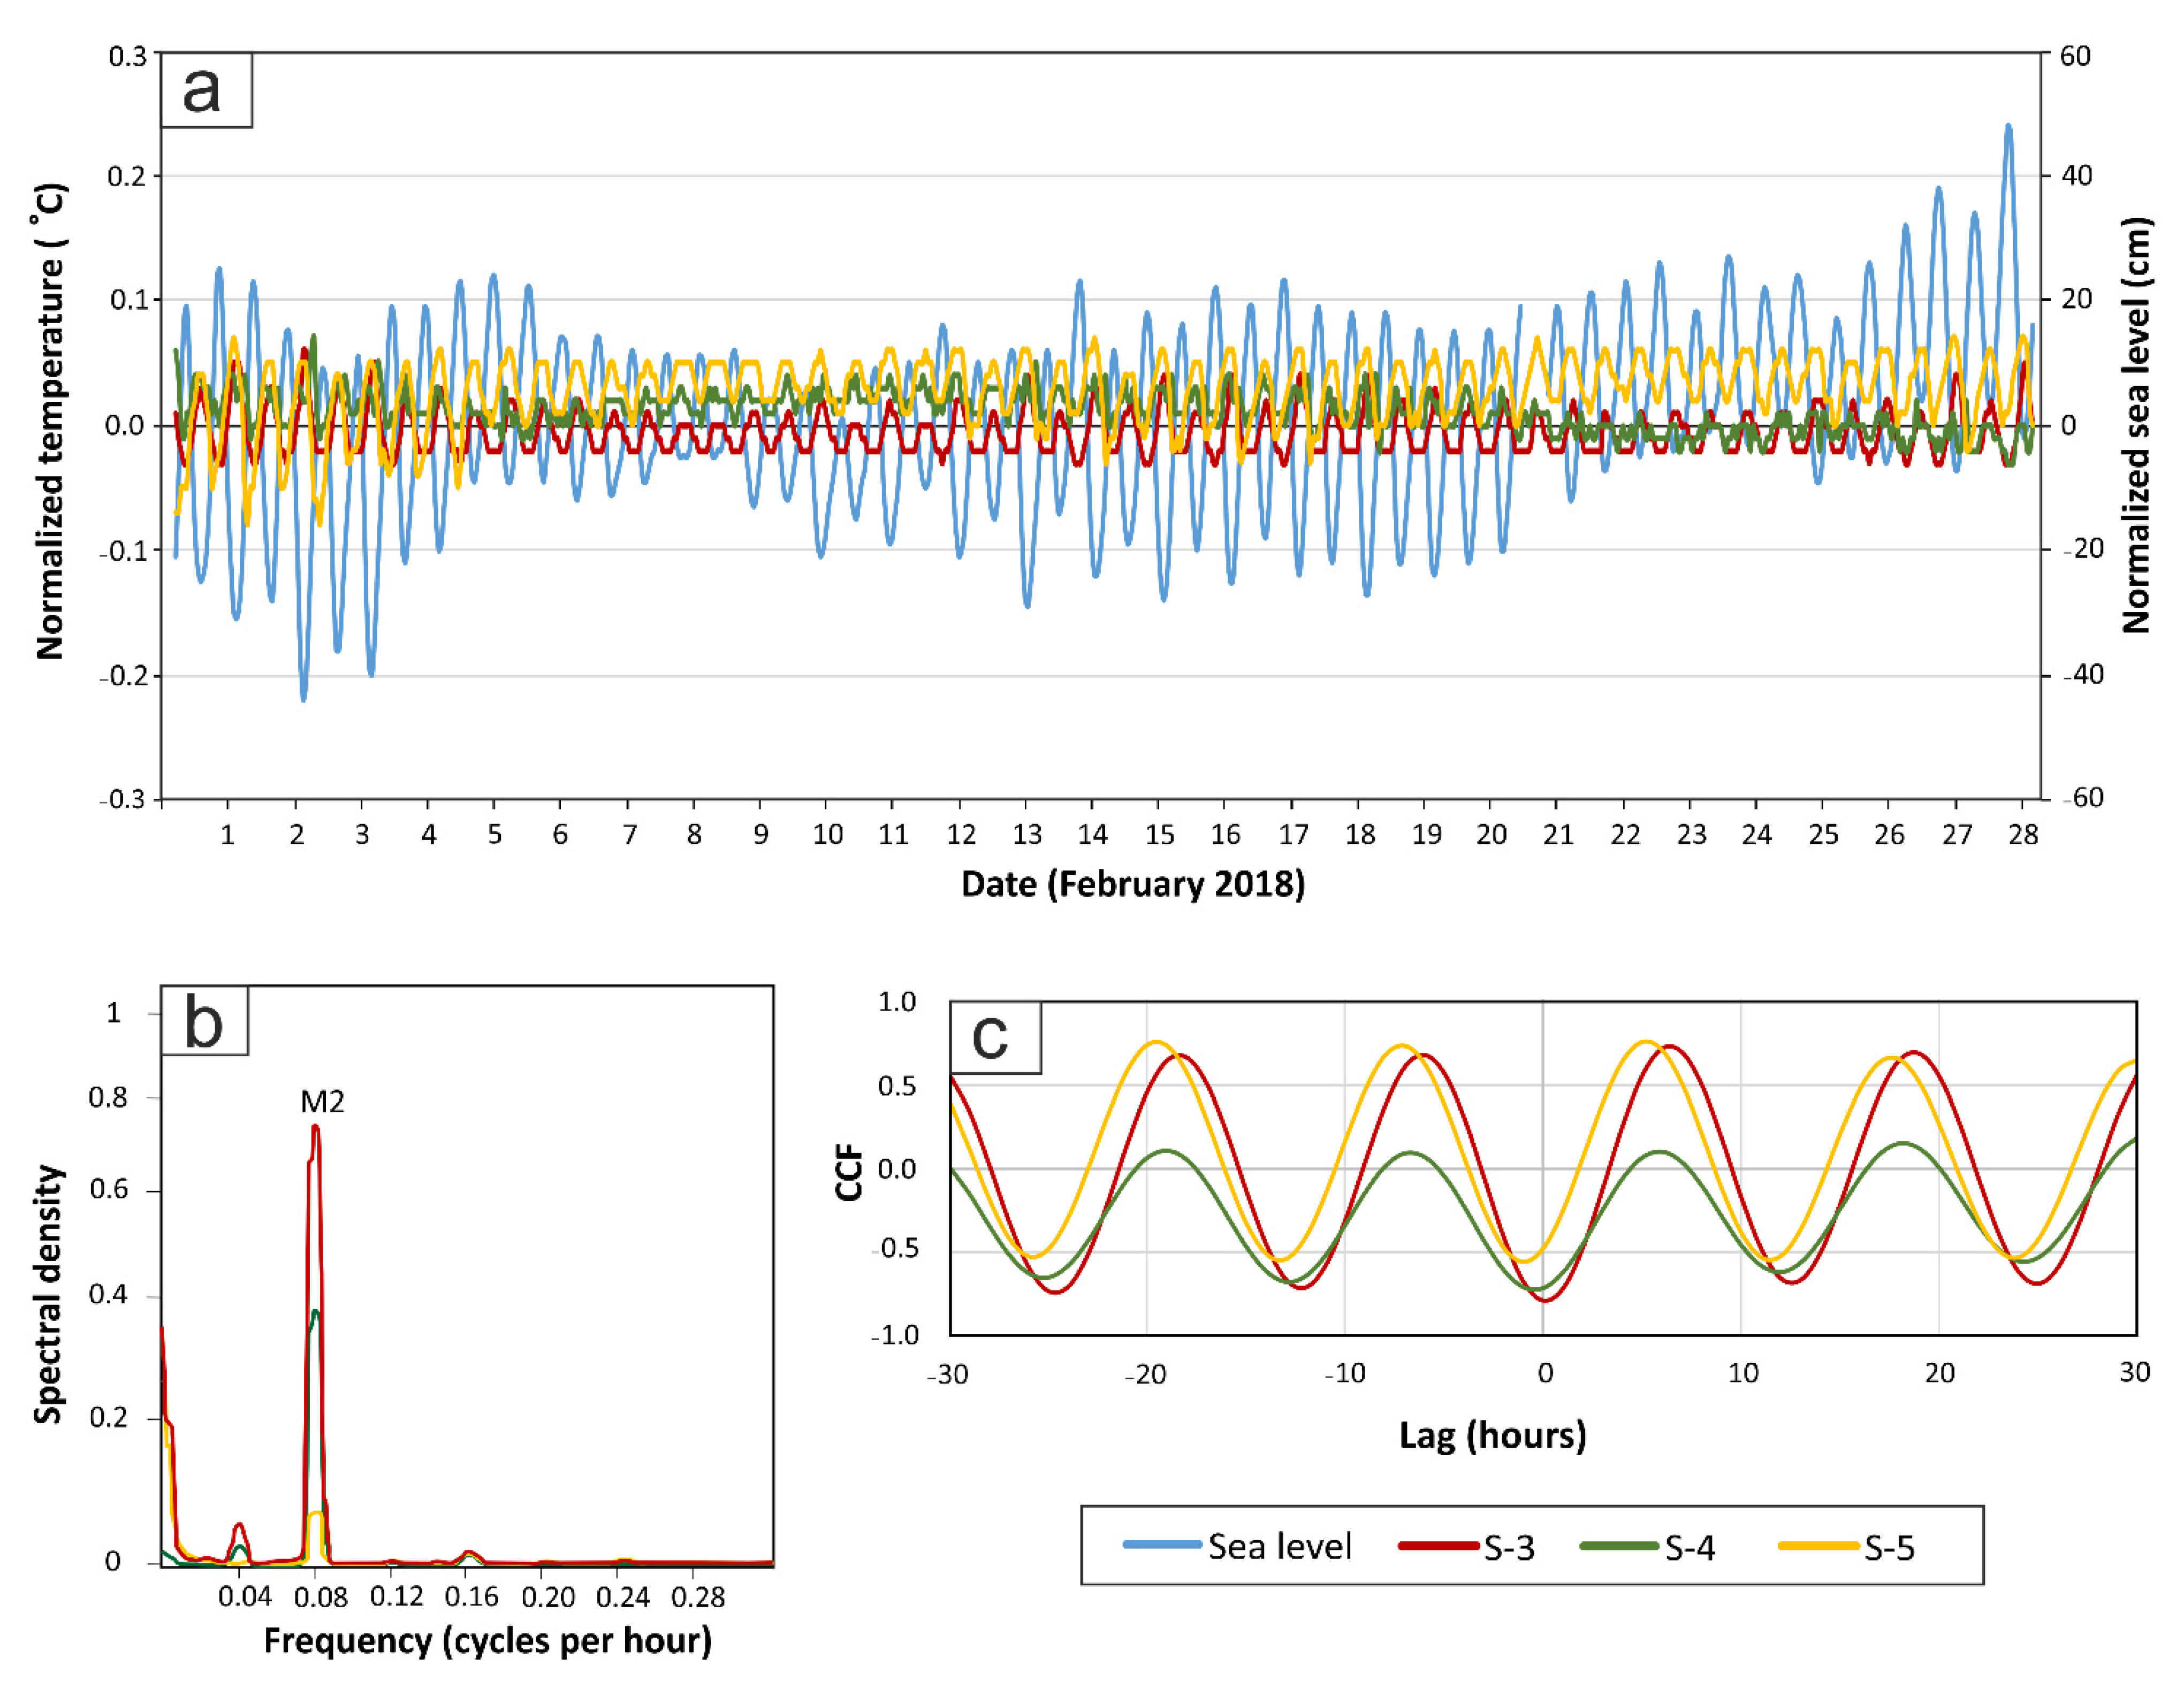
The effects of the sea tide on the groundwater temperature are visible in the time series of February 2018 (Figure 8a). The Mediterranean Sea has a mixed tidal phenomenon with two cycles of high and low tide per day [63], with a mean tidal amplitude of 0.54 m at the Motril coastline. The largest constituents obtained on the 1-month data of sea level were M2, S2, Msf, N2, K1, O1, M4, and OO1 (Table 4) and their average amplitudes ranged between 0.152 and 0.013 m. The magnitude of the temperature oscillations measured in the aquifer is highly dependent on the fortnightly spring–neap cycle. The temperature had a larger amplitude and perfectly sinusoidal pattern during the spring tides and smaller oscillations, with a squarer wave, during the neap tides.
The main constituents of the Mediterranean Sea were also detected in temperature (Table 4). The ‘Principal lunar semidiurnal’ constituent (M2) had the biggest amplitude at the depths of the sensor (S-3, S-4 and S-5). The spectral analysis (Figure 8b) detected that M2 also had the largest spectra energy, as calculated previously for the groundwater head time series [7].
Temperatures obtained in S-3, S-4, and S-5 change with a symmetrical lag following the sea level signal (Figure 8c). Temperature had a delay with respect to the tide ( t l a g T I D E T ) between 5.4–6.4 h (Table 5). The time-lags of temperature with respect to H ( t l a g H T ) were slightly smaller compared to the tide: between 5.3–6.1 h. The delay of temperature with respect to EC ( t l a g E C T ) was negative, indicating that temperature oscillated faster than EC. However, the phase shifts were small: −0.7 and −1.1 h.   t l a g E C T could not be calculated at the depth of 217 m (sensor S-4), due to the irregular oscillations of the EC dataset. The amplitude of the temperature oscillations ranged between 0.02 °C and 0.06 °C at the three depths in February.

4.4. Numerical Model Results

4.4.1. Model A

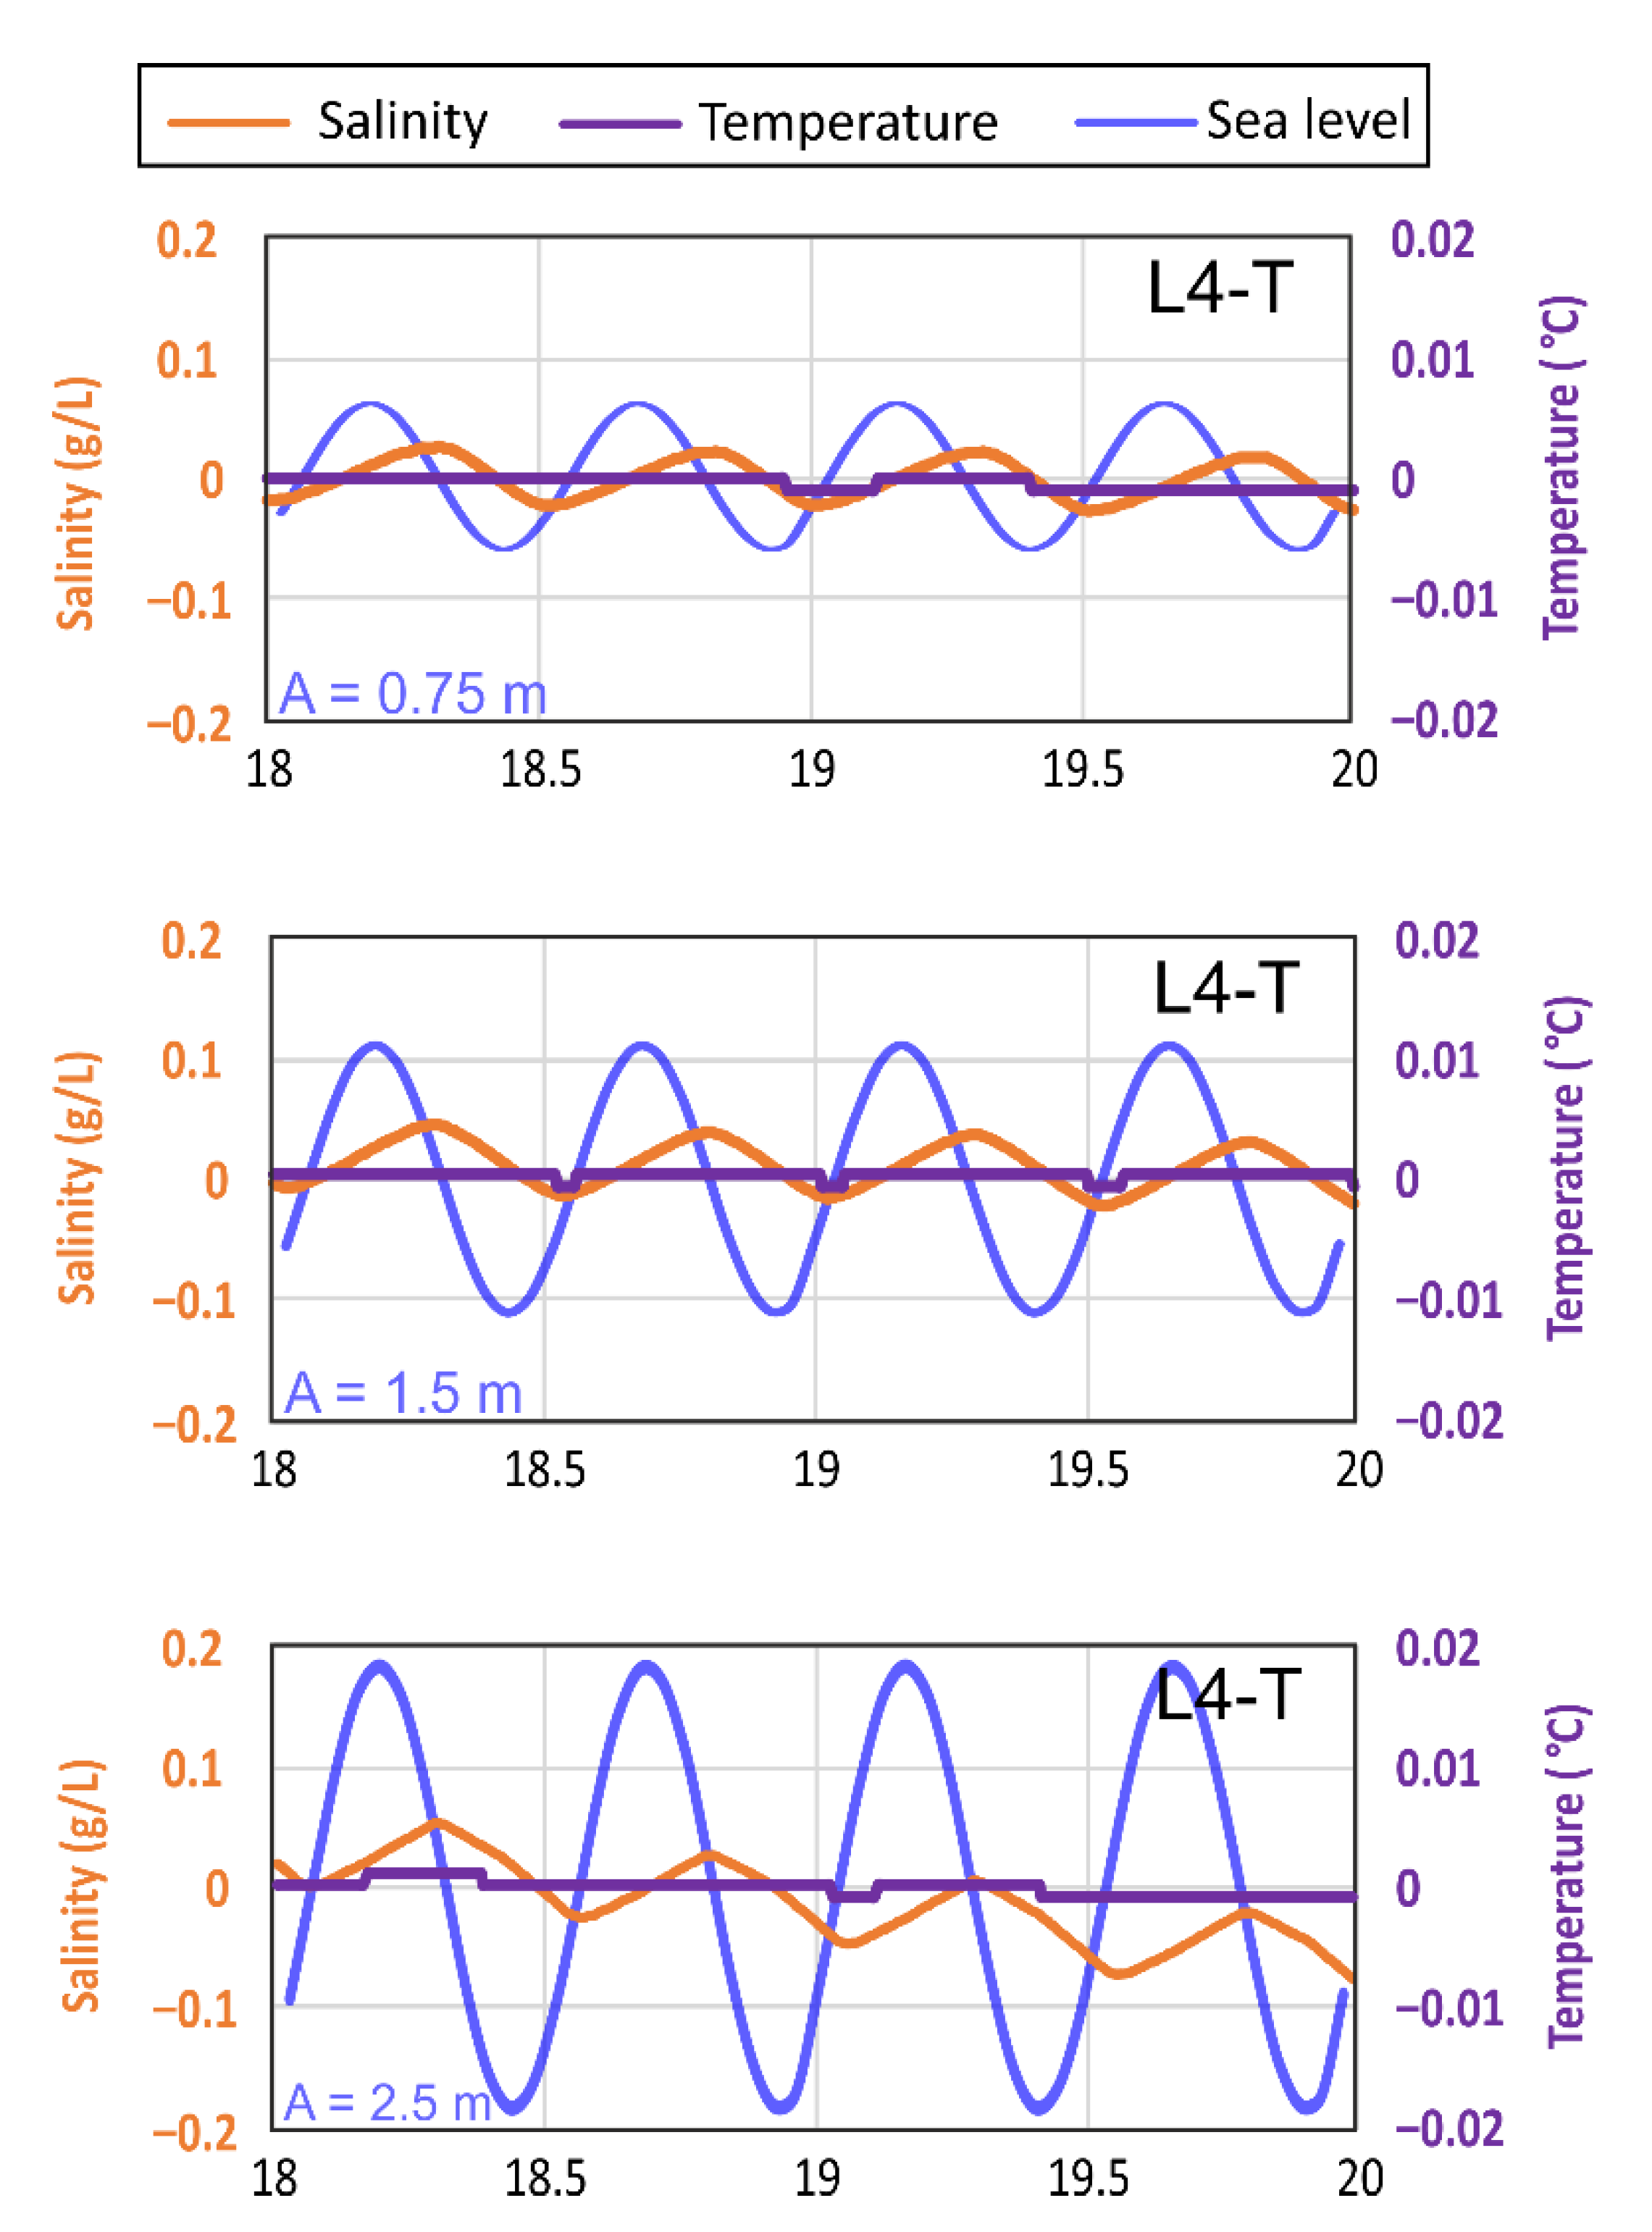
The addition of sea oscillations to the homogeneous model did not produce significant variations in temperature and salinity at the observation points for microtidal, mesotidal, or macrotidal conditions. The maximum changes in salinity and temperature were at the observation point L4-T (Figure 9). However, other observation points located in the model (Figure 4) did not show any changes in temperature. Salinity variations had an amplitude of less than 0.1 g/L for the three tidal conditions. The temperature showed irregular squared fluctuations related to the time discretization of the model, with amplitudes of 10−3 °C. Still, these small temperature variations must have been generated by the tidal oscillation since, in the case of the mesotidal conditions, the minimum values of temperature and salinity occurred simultaneously, as shown in Figure 9.

4.4.2. Model B

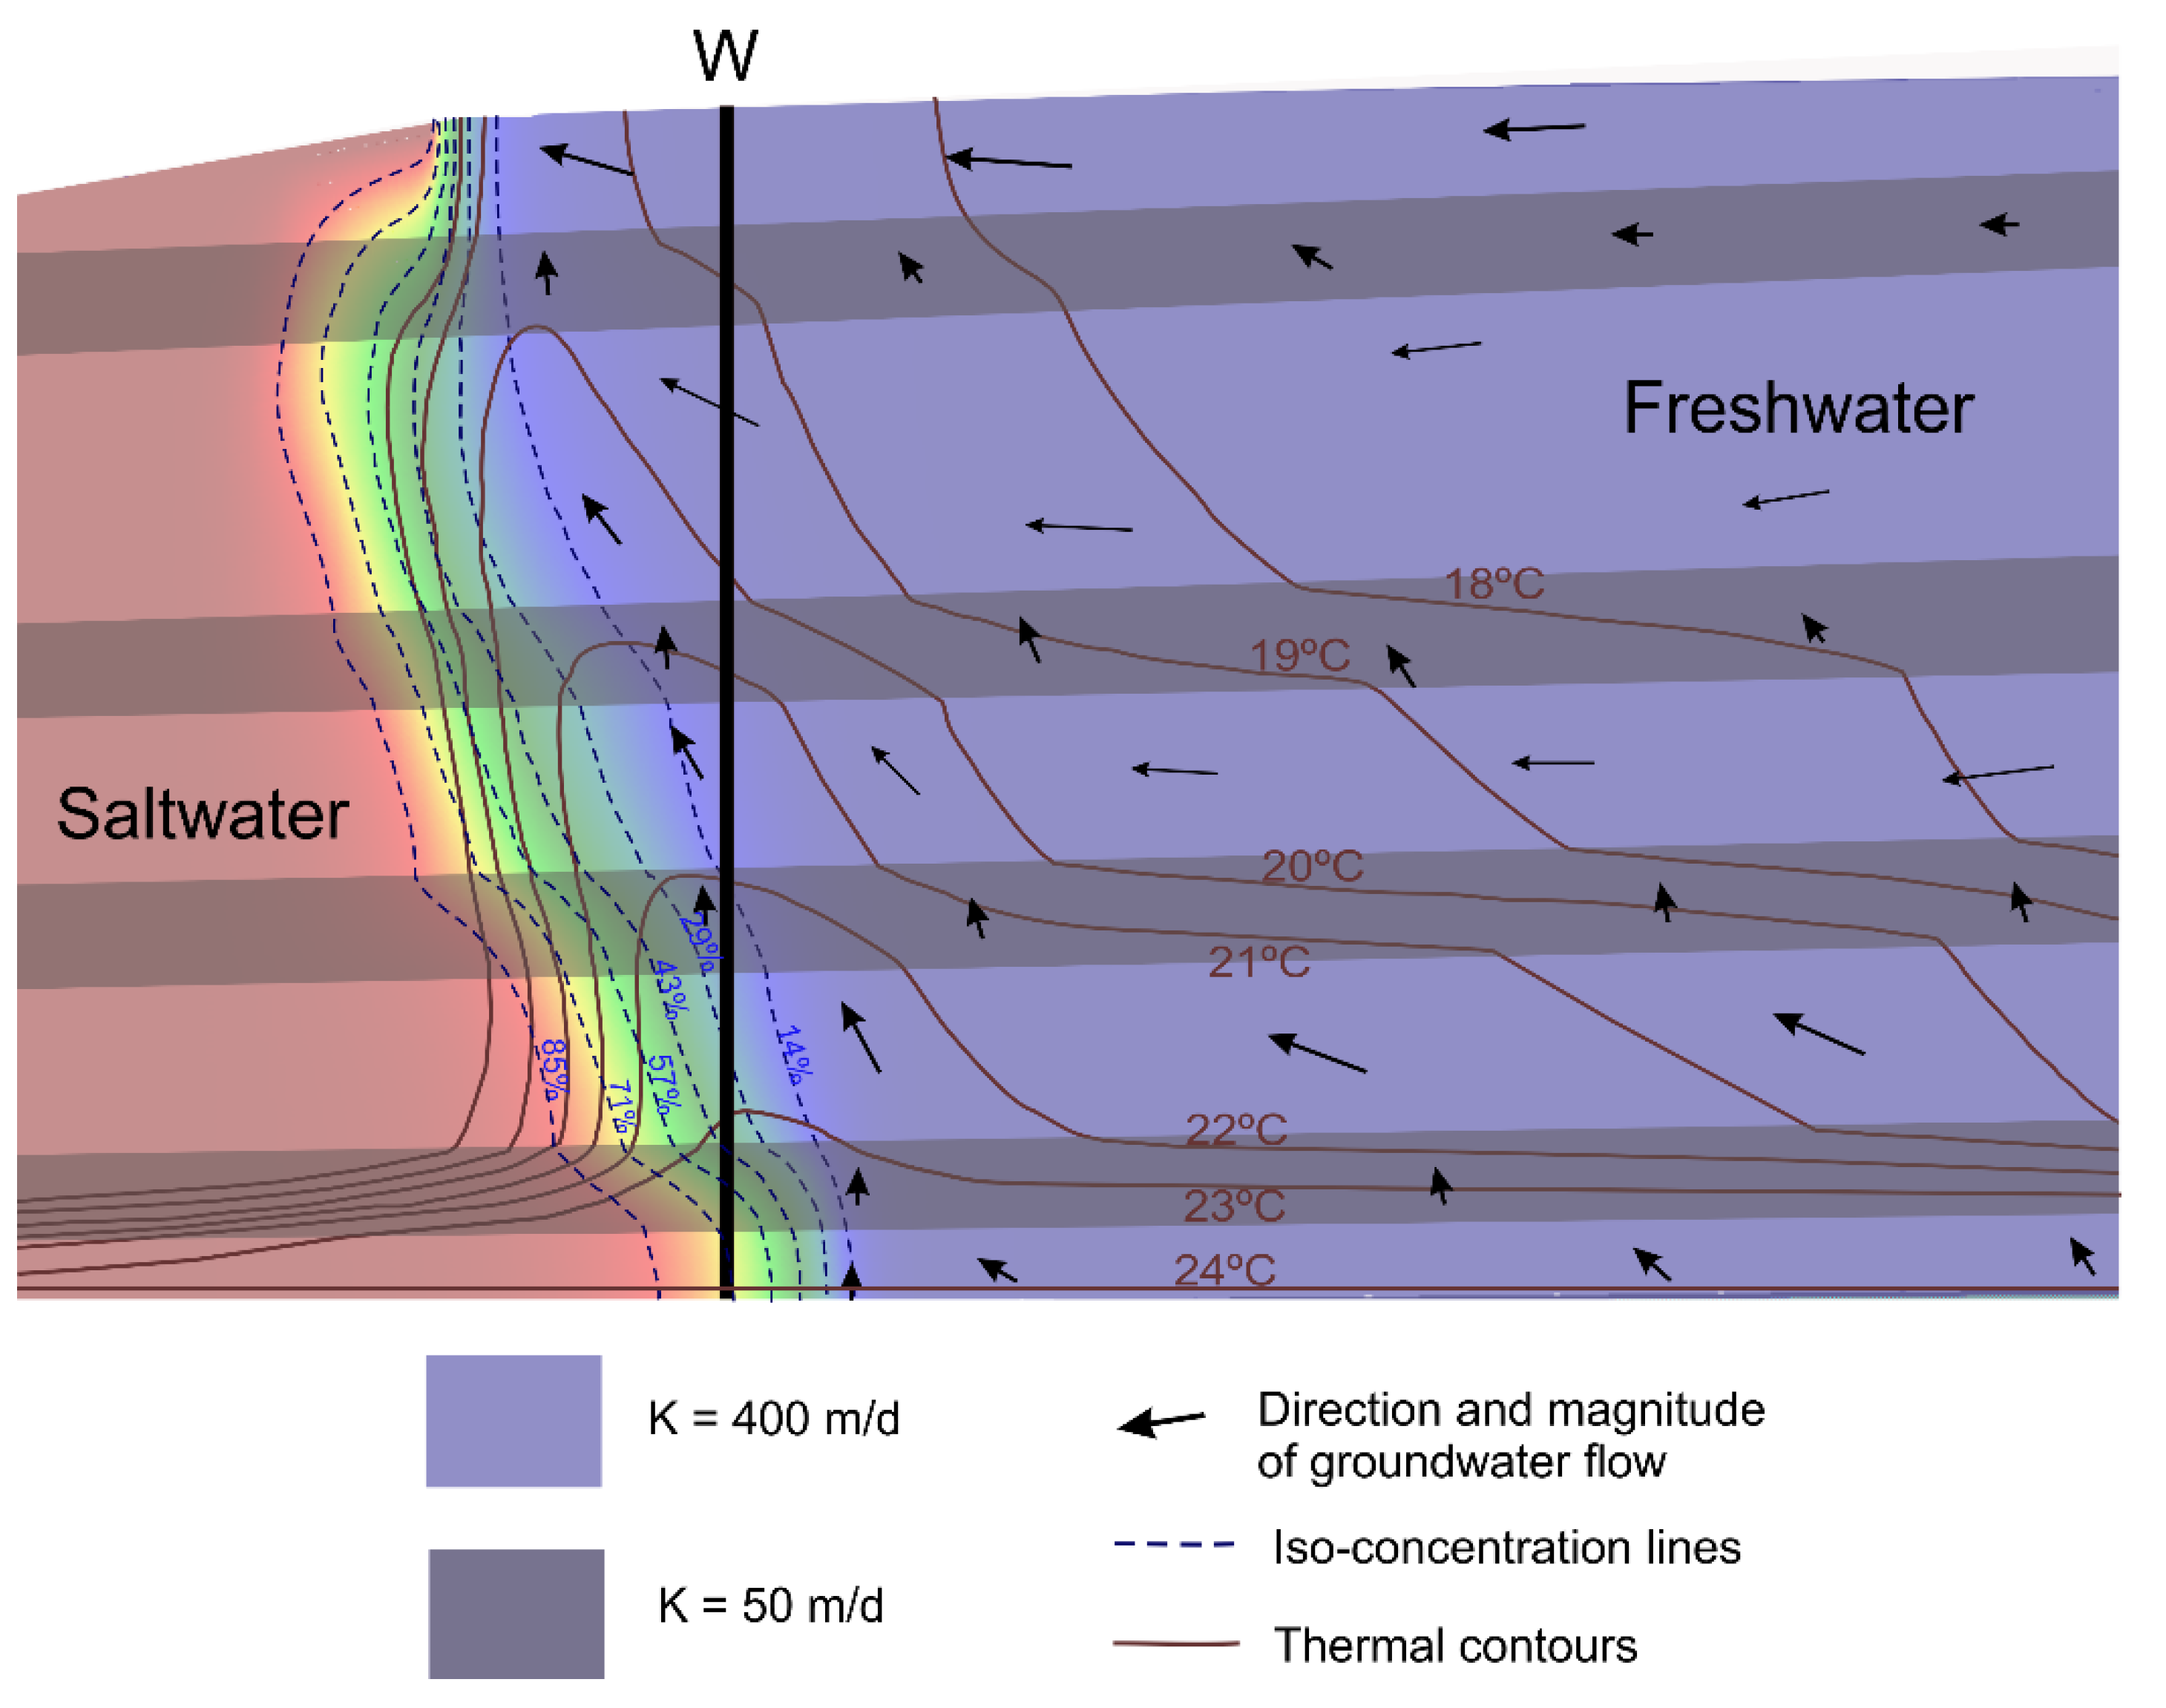
The inclusion of heterogeneity generated higher temperature oscillations in the numerical model. The thermal contours had a different pattern with respect to the iso-concentration lines because of the presence of an ascending thermal plume in the fresh groundwater domain, associated with the FSI, which increased sharply towards the surface (Figure 10). The alternation of layers with different hydraulic conductivity induced the bending of thermal contours, which were almost horizontal within the low hydraulic conductivity layers, and closer to vertical in the high hydraulic conductivity layers. The shape of the thermal plume was well defined near the surface, and then it gradually flattened towards the basement. This explains the presence of a horizontal thermal gradient in the nearest groundwater, and thus the horizontal thermal gradient of the nearest groundwater.
Temperature and salinity oscillations related to sea tides were registered at the boundaries between layers with different hydraulic conductivity. However, in the intralayer area, the temperature oscillations were irregular or even absent (Figure A1 in Appendix A). Therefore, intralayer results were selected to be analyzed.
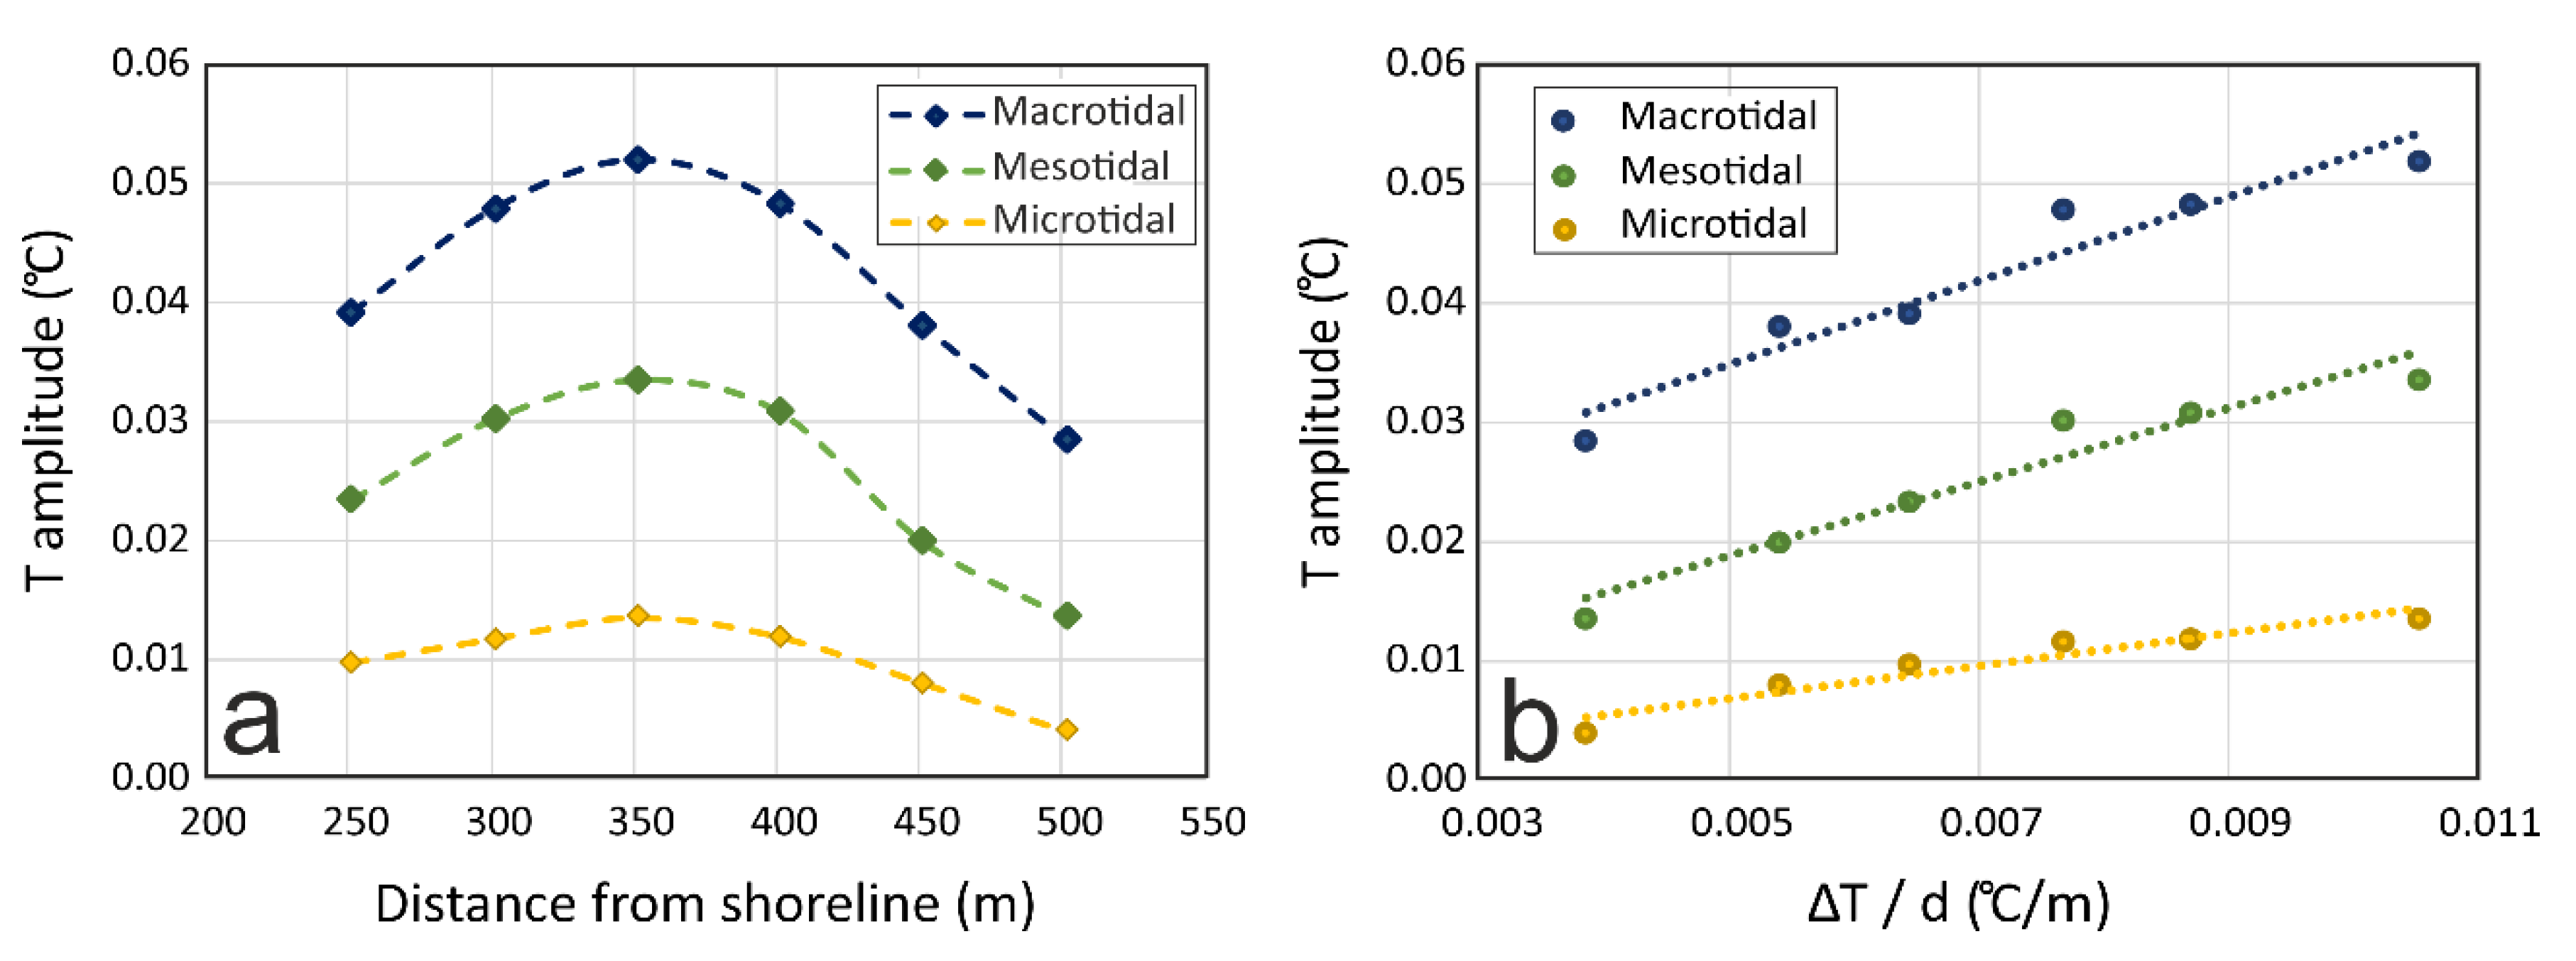
The amplitude of temperature oscillations varied according to the condition of the tide (Figure 11): from 0.015 °C to 0.004 °C for microtidal conditions, 0.033 °C to 0.014 °C for mesotidal conditions, and from 0.029 °C to 0.052 °C for macrotidal conditions. The amplitude was maximum at a distance of 350 m from the shoreline and at the top of layer L3 (Figure 11a). Thus, the model did not simulate a decreasing trend of the amplitude with distance from the shoreline or the FSI. However, the oscillation amplitude was related to the local horizontal thermal gradient (ΔT/d), where the observation points were located (Figure 11b). The maximum amplitude of temperature was registered at x = 350 m, where the thermal contours were the closest to each other; from that point on, the amplitude decreased landwards as the ΔT/d also decreased. The oscillations were produced by the horizontal displacements of the freshwater body due to sea tides and, consequently, the bigger the ΔT/d, the greater the amplitude of groundwater temperature oscillations.
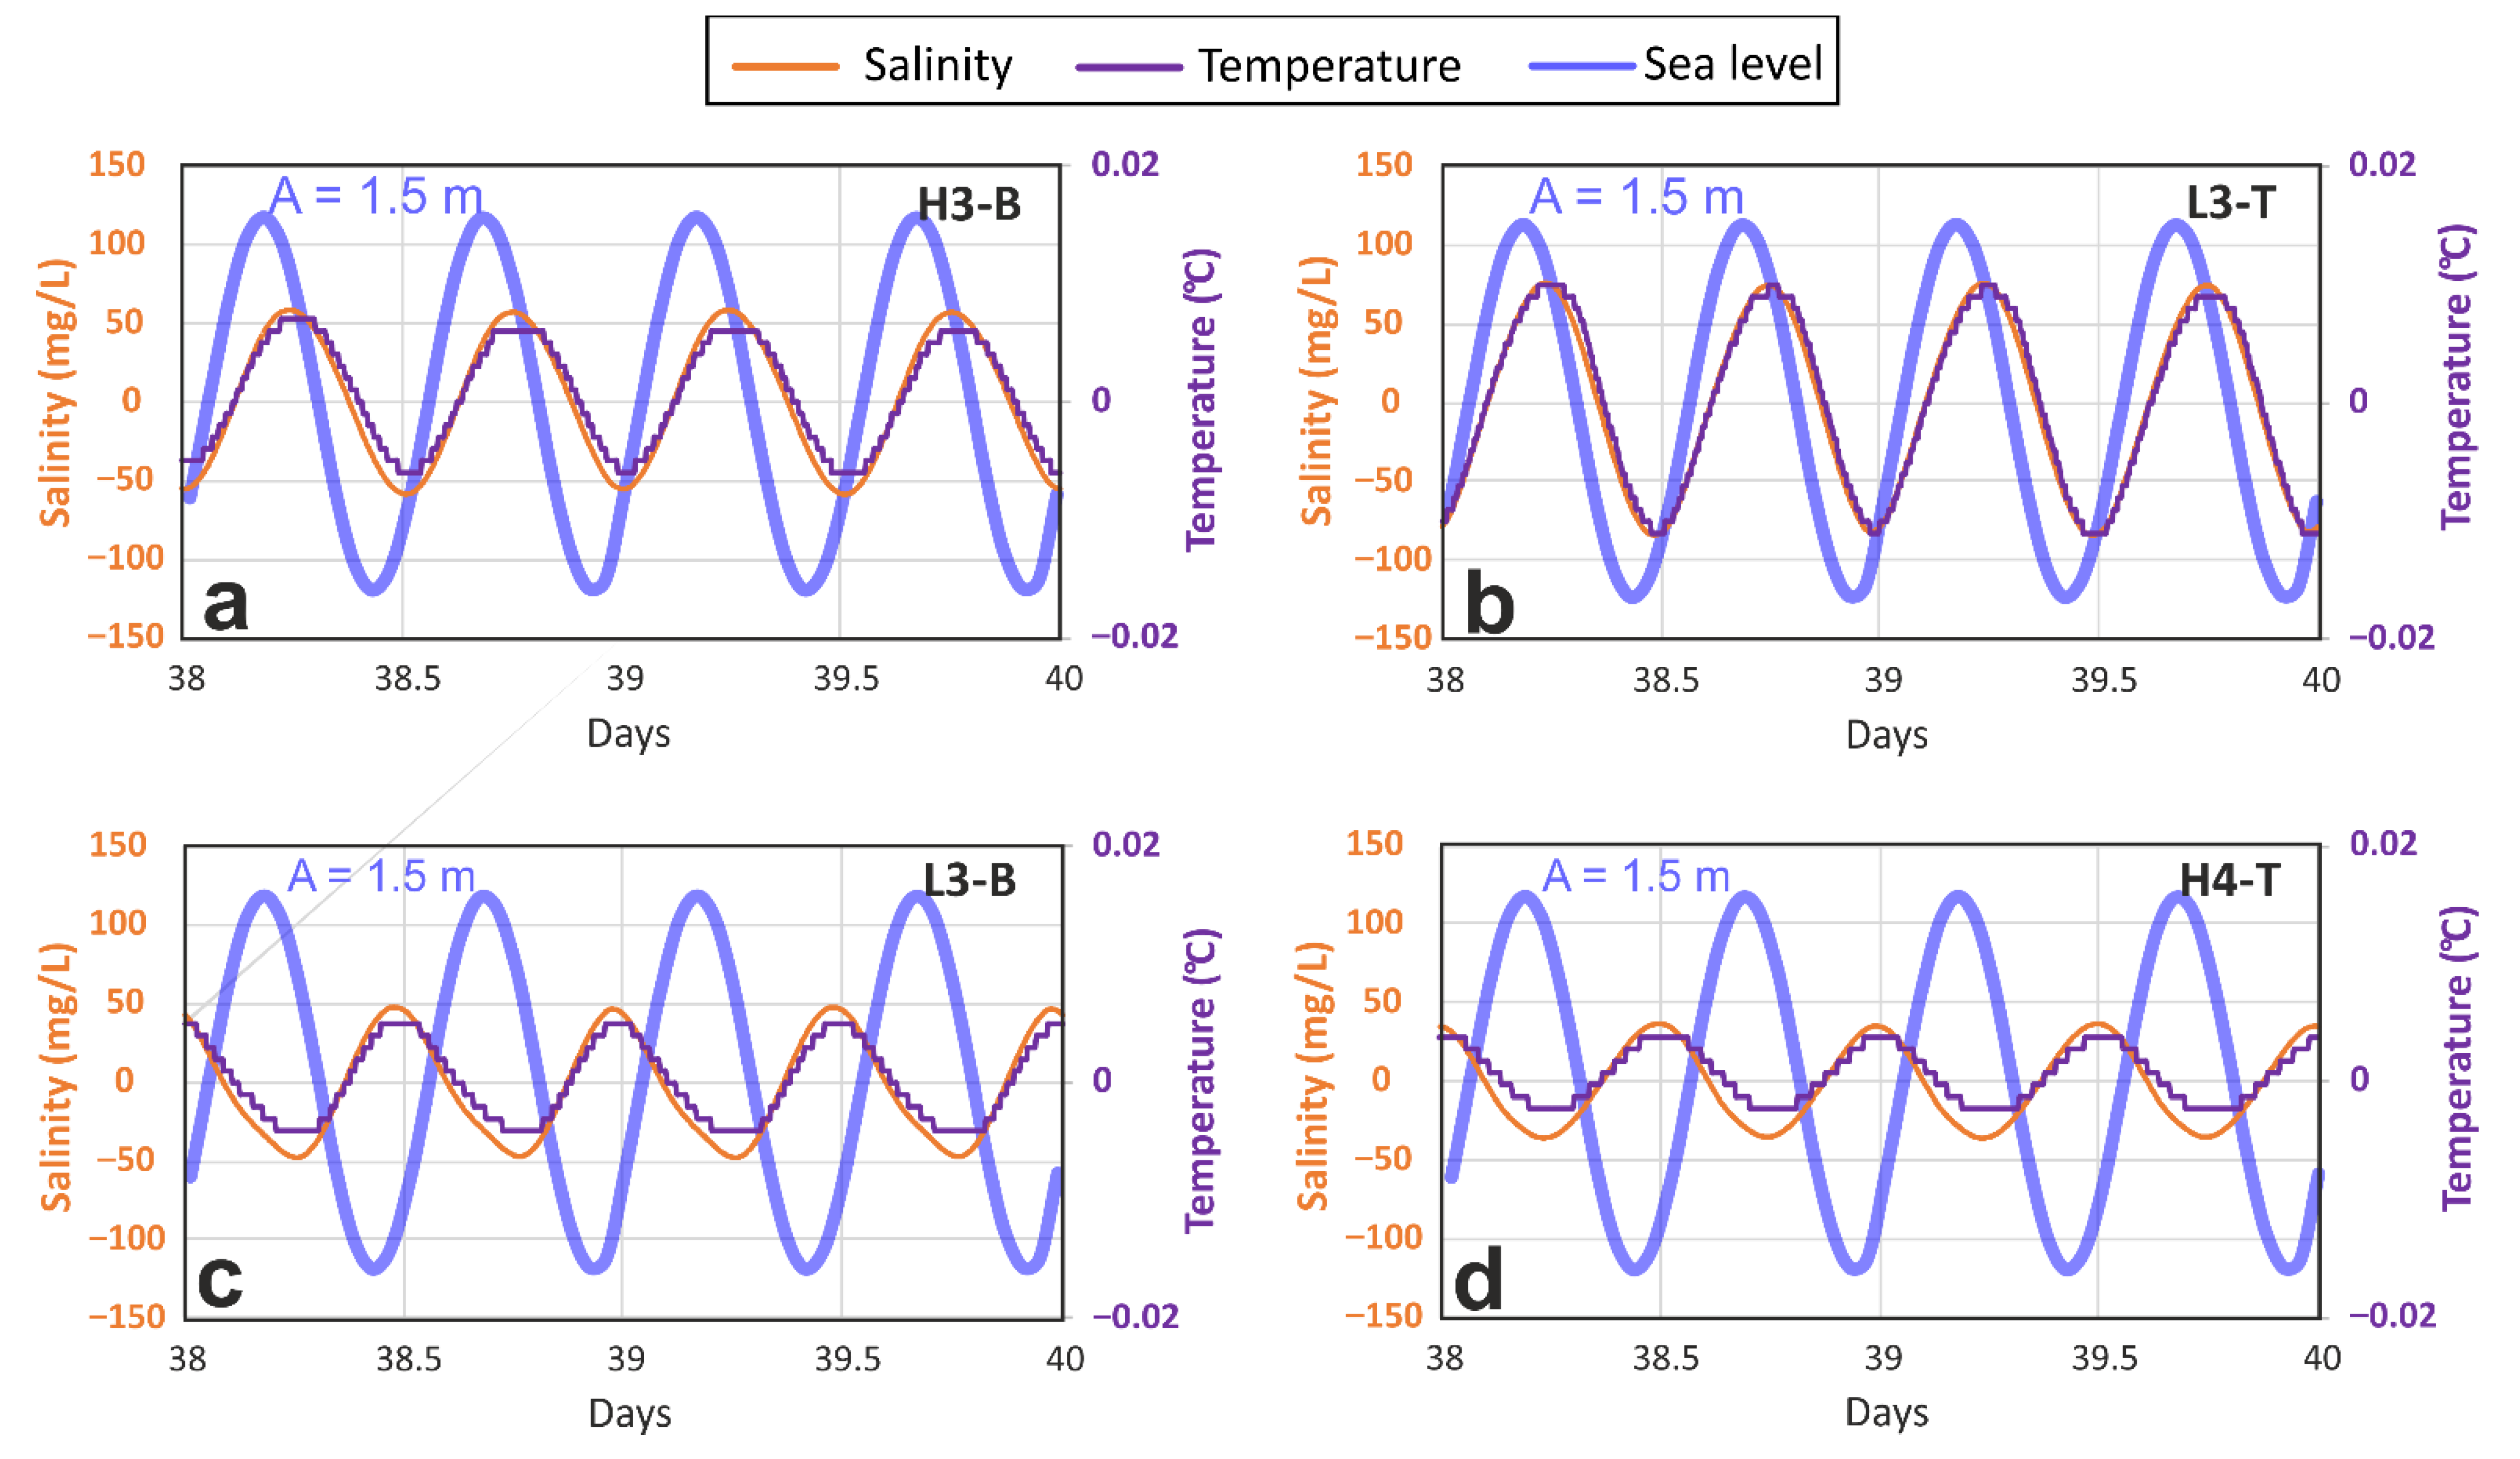
The salinity and temperature semidiurnal oscillations were analyzed for the mesotidal condition as an average value representative of other locations. Temperature and salinity almost oscillated together (Figure 12); the maximum and minimum peaks were reached at the same time for both parameters. However, comparing the top and the bottom of the same layer, they had an inverted evolution. For example, in layer L3, temperature and salinity reached their maximum values at the top of the layer (Figure 12b), just when they reached their minimum values at the bottom (Figure 12c). The maximum values of salinity and temperature had a lag of 2.5 h with respect to the sea tide, at the bottom of a layer with high hydraulic conductivity, and at the top of a layer with low hydraulic conductivity just below (Figure 12a and Figure 12b, respectively). However, the maximum value of salinity and temperature had a lag of 8.9 h with respect to the sea tide, as registered at the bottom of a layer with low hydraulic conductivity (L3-B) and at the top of a layer with high hydraulic conductivity just below (H4-T) (Figure 12c and Figure 12d, respectively). This means that the sequence of layers with different hydraulic conductivities determined the behavior of temperature and salinity with respect to the sea tides, as can be seen in many cases in the various layers presented in the model (Figure A1 in Appendix A).
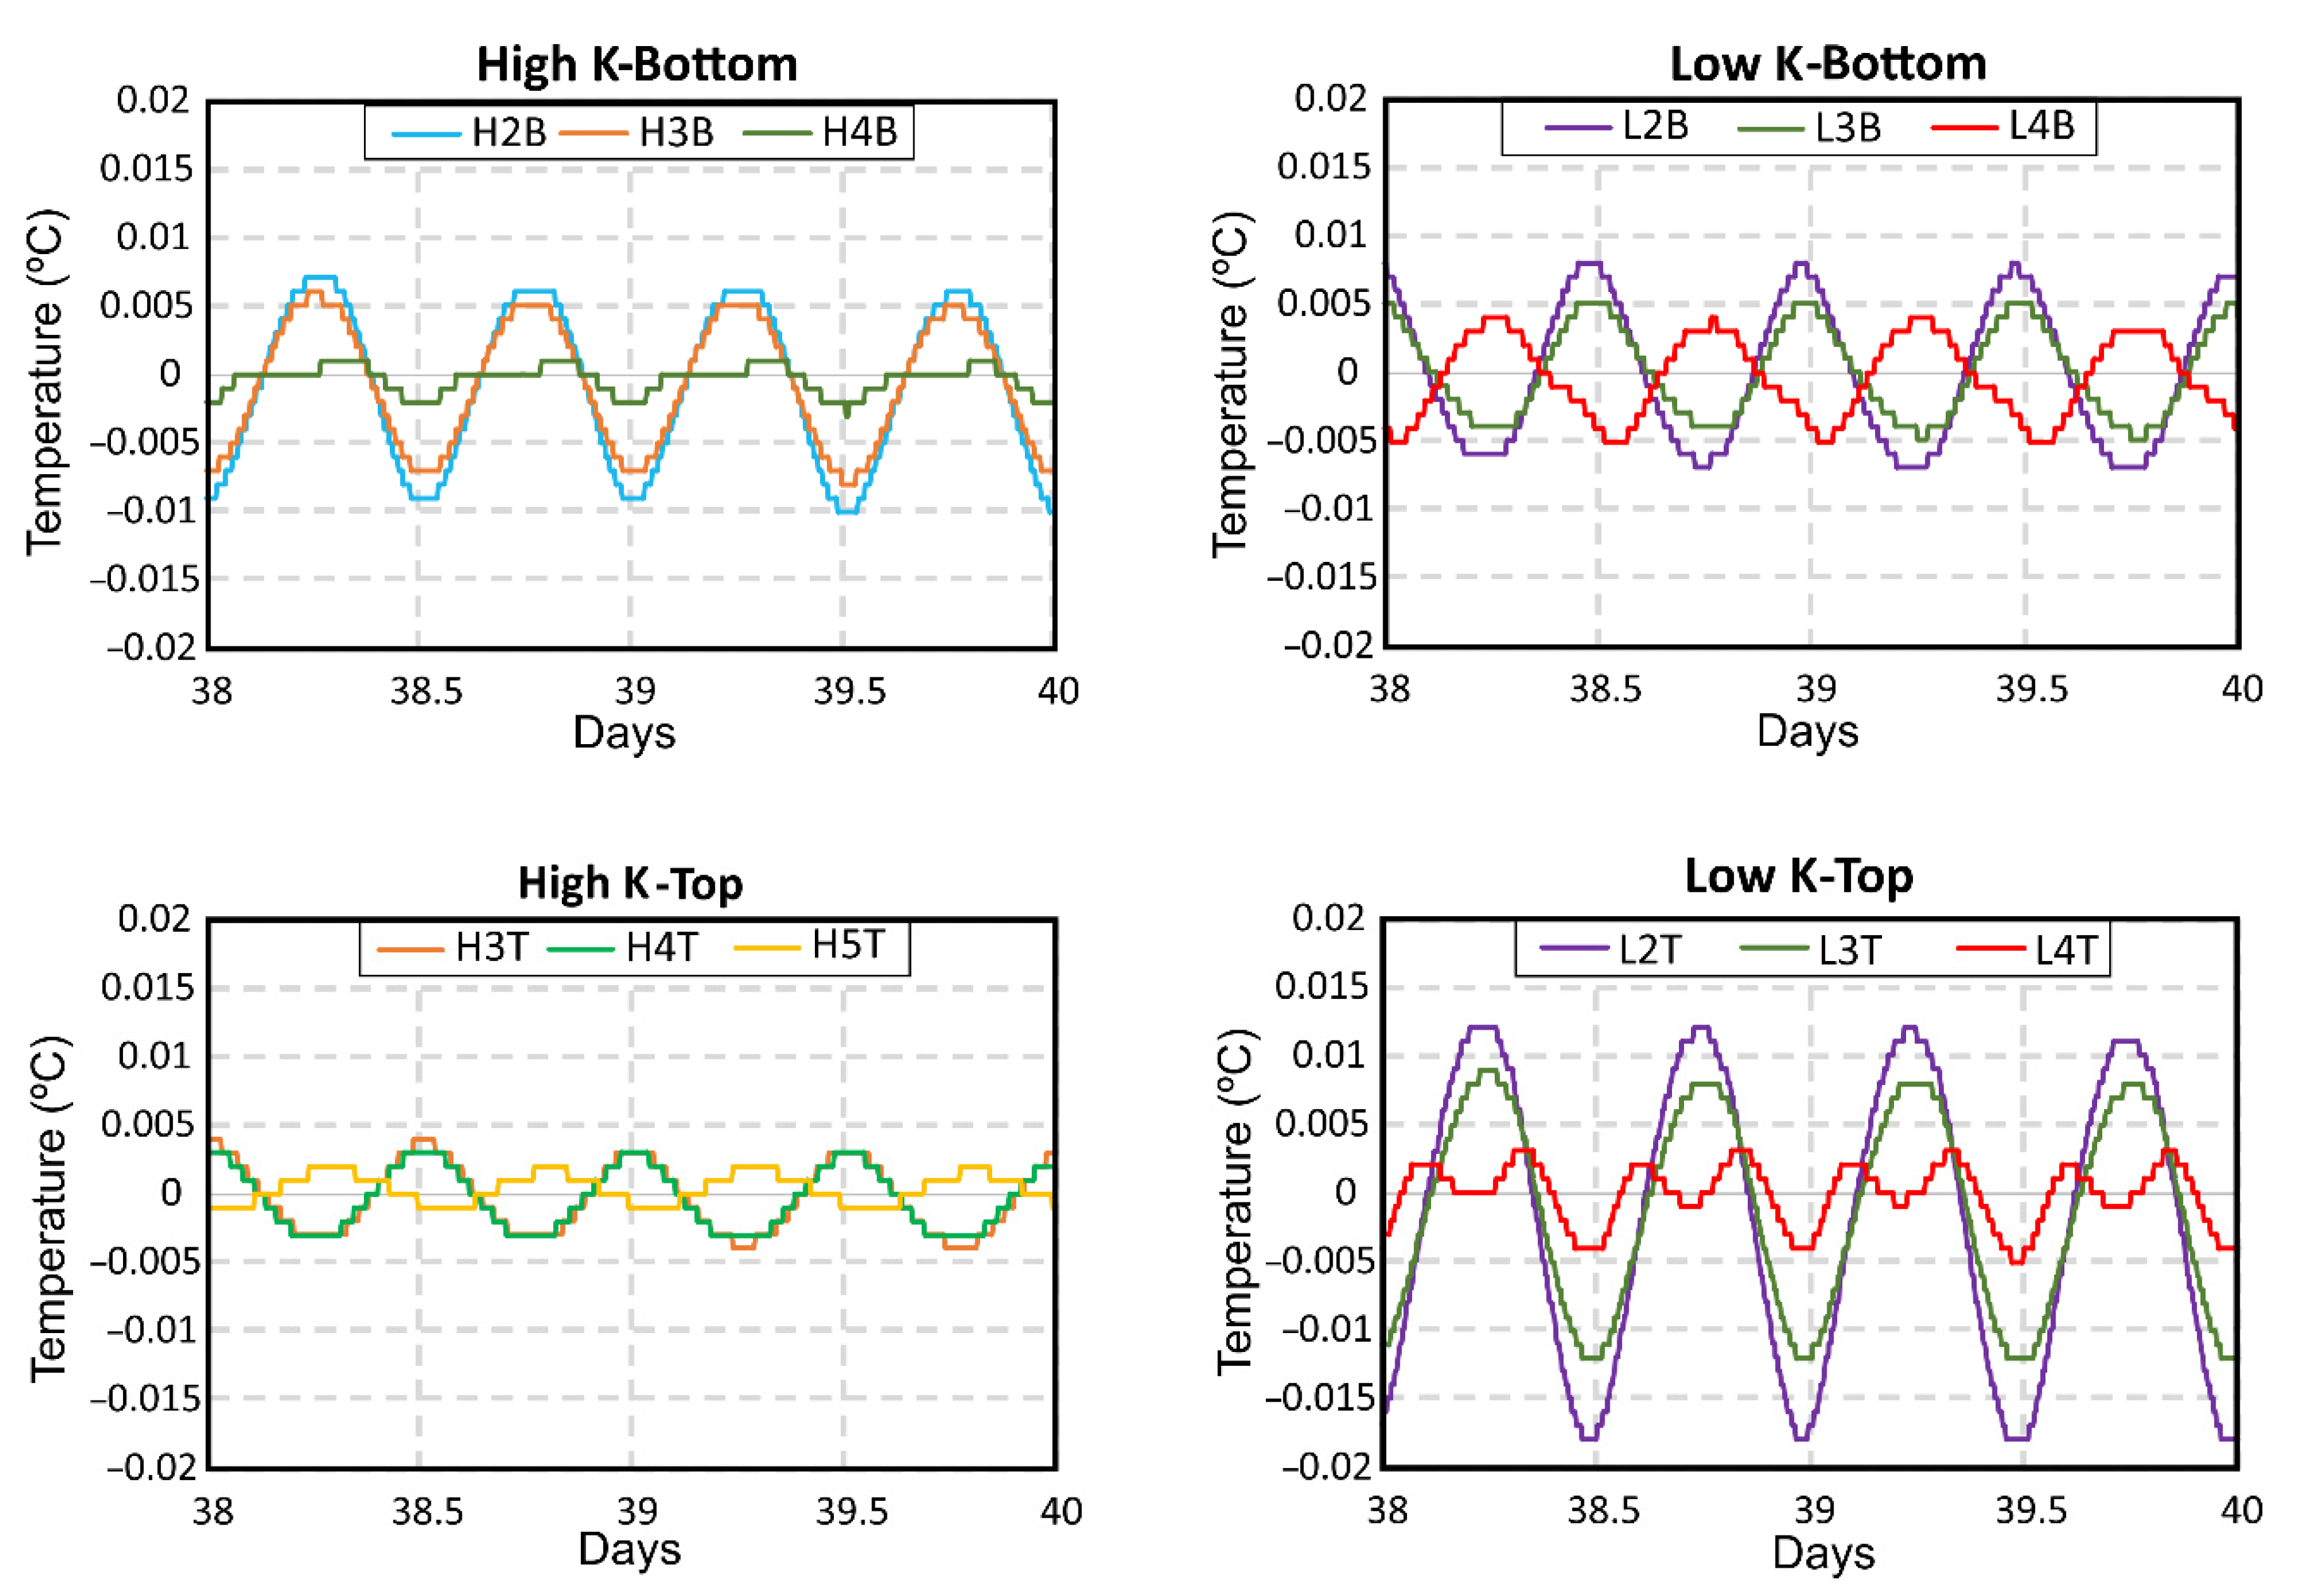
The results obtained at the tops and bottoms of low and high hydraulic conductivity layers were used to analyze the impact of depth and hydraulic conductivity on the amplitude of temperature and salinity oscillations. Only temperature results were plotted, as salinity had an almost synchronous evolution. The same conditions of hydraulic conductivity and location within the layer were considered to compare the results. In all cases, the amplitude of temperature oscillations decreased with depth. The flattening of the thermal plume towards deeper areas of the aquifer caused the reduction in ΔT / d and, hence, the variations in temperature with horizontal movements due to the pushing of the FSI associated with sea tides were smaller. The oscillations of temperature and salinity were larger in low hydraulic conductivity layers, compared with those obtained in layers with high hydraulic conductivity.
Temperature fluctuations were synchronized in all four cases (Figure 13), except for L4-B and H5-T, in which oscillations were delayed with respect to the other results. The desynchronization of the maximum-maximum peaks may be due to the position of the observation points on both sides of the thermal plume. The core of the thermal plume (the highest temperature area) moved landwards toward the observation points located on the right side of the thermal plume, and that is what made them register an increment in temperature. However, the observation points situated on the left side of the thermal plume registered a decrease in temperature due to the core of the plume moving away.

4.4.3. Model C

The increase in hydraulic gradient reflected how temperature and salinity changed during a gradual increase in groundwater recharge, until exceeding the initial value by 40%. The amplitude of the oscillation of both parameters became smaller over the simulation time due to the increase in recharge. However, the general trend of the time series had a different behavior: salinity and temperature decreased where a high hydraulic conductivity layer was above a low hydraulic conductivity layer (H3-B and L3-T, Figure 14a and Figure 14b, respectively), while salinity decreased and temperature increased where a low hydraulic conductivity layer was above a high hydraulic conductivity layer (L3-B and H4-T, Figure 14c and Figure 14d, respectively). Hence, the sequence of the layers with different hydraulic conductivity generated a different temperature behavior. This phenomenon was also modeled at the top and bottom of other layers and also at the intralayer areas where temperature decreased together with salinity (Figure A2 in Appendix B). These results confirmed that recharge variations did have an influence on salinity and temperature since the amplitude of the oscillations and the general trend of both parameters did not change in model B, where the hydraulic gradient remained constant over time.

5. Discussion

Temporal variations in temperature and EC distribution were identified by vertical logs and sensor monitoring in the Motril-Salobreña aquifer, near the FSI. The oscillations followed, in general terms, the tidal and recharge changes, but there were differences in the temperature and EC variations depending on the location of the measurement point. This relationship between observation point location and variations in temperature and EC required the use of numerical simulations in order to be properly analyzed and explained.
Time series analysis allowed us to detect the characteristics and relationships between temperature and EC measurements and sea level oscillations. Considering the ‘principal lunar semidiurnal’ constituent (M2), temperature and EC were synchronized with sea tides with a time lag that differs from what was reported by previous authors. The difference could be caused by a smaller well-to-shoreline distance, as [18] measured at a distance of 70 m from the shoreline (0.75–2 h) and [27] were located at 7 m from the shoreline (2.8 h and 4.3 h). In the present study, the amplitudes of temperature oscillations measured were in the range of 0.02 °C to 0.06 °C; values that are about one order of magnitude smaller than those measured by [27]: 0.2 °C.
Temperature fluctuations were neither synchronized nor had the same amplitude at every depth. This is related to the hydraulic characteristics of the aquifer and especially to the alternation of lithological layers. Time lags obtained from field data tended to decrease with depth, but the difference between shallow and deep measurements was so small that it could be considered negligible. The analysis of the results of the model did not point to any specific relationship between time lag and depth; however, it did show a link between the position of the observation point and the lithology contrast.
The effect of hydraulic conductivity changes on temperature distribution can be used to explain the measurements obtained in the wells. The heterogeneity of hydraulic conductivity induced the bending of the thermal contours as shown in Figure 10, especially at the boundaries between different layers. The thermal contours were less close to vertical in low hydraulic conductivity layers compared to those with high hydraulic conductivity. Moreover, [64,65,66] also associated the bending of the thermal contours with the refraction of the heat flow. They demonstrated that the variation of thermal conductivity within the aquifer materials produced the refraction. However, in the case of this study, the value of thermal conductivity was homogeneous across the three models. Therefore, the bending of thermal contours may be due to the different convective heat transport induced by the refraction of the flowlines at the interfaces between layers with different K values. This demonstrates the importance of the characterization of layering, hydraulic properties, and heterogeneity in studies focused on this topic.
Sea tides and recharge variations produced the displacement of the FSI and the associated thermal plume, inducing periodic oscillations of salinity and temperature. The oscillations of temperature measured at depths of over 100 m in the aquifer were related to the presence of the ascending thermal plume, which generated a local horizontal thermal gradient. Without the thermal plume, the thermal contours in the freshwater domain would be horizontal and, therefore, the landward-seaward movements of the FSI would produce salinity oscillations but not temperature oscillations.
The amplitude of the temperature oscillations did not decrease linearly landwards (Figure 11a), as other authors have described for hydraulic head oscillations [9,51,67,68]. Although the general trend showed decreasing amplitudes, an increment in amplitude was recorded from x = 250 m to x = 300 m, which shows a correlation between the oscillation amplitudes and the local horizontal thermal gradient produced by the thermal plume (Figure 11b). These results indicate that temperature oscillations generated by tides could not be identified in every portion of the aquifer but only in those where temperature differences in the horizontal dimension were large enough and were associated with the displacement of the FSI.
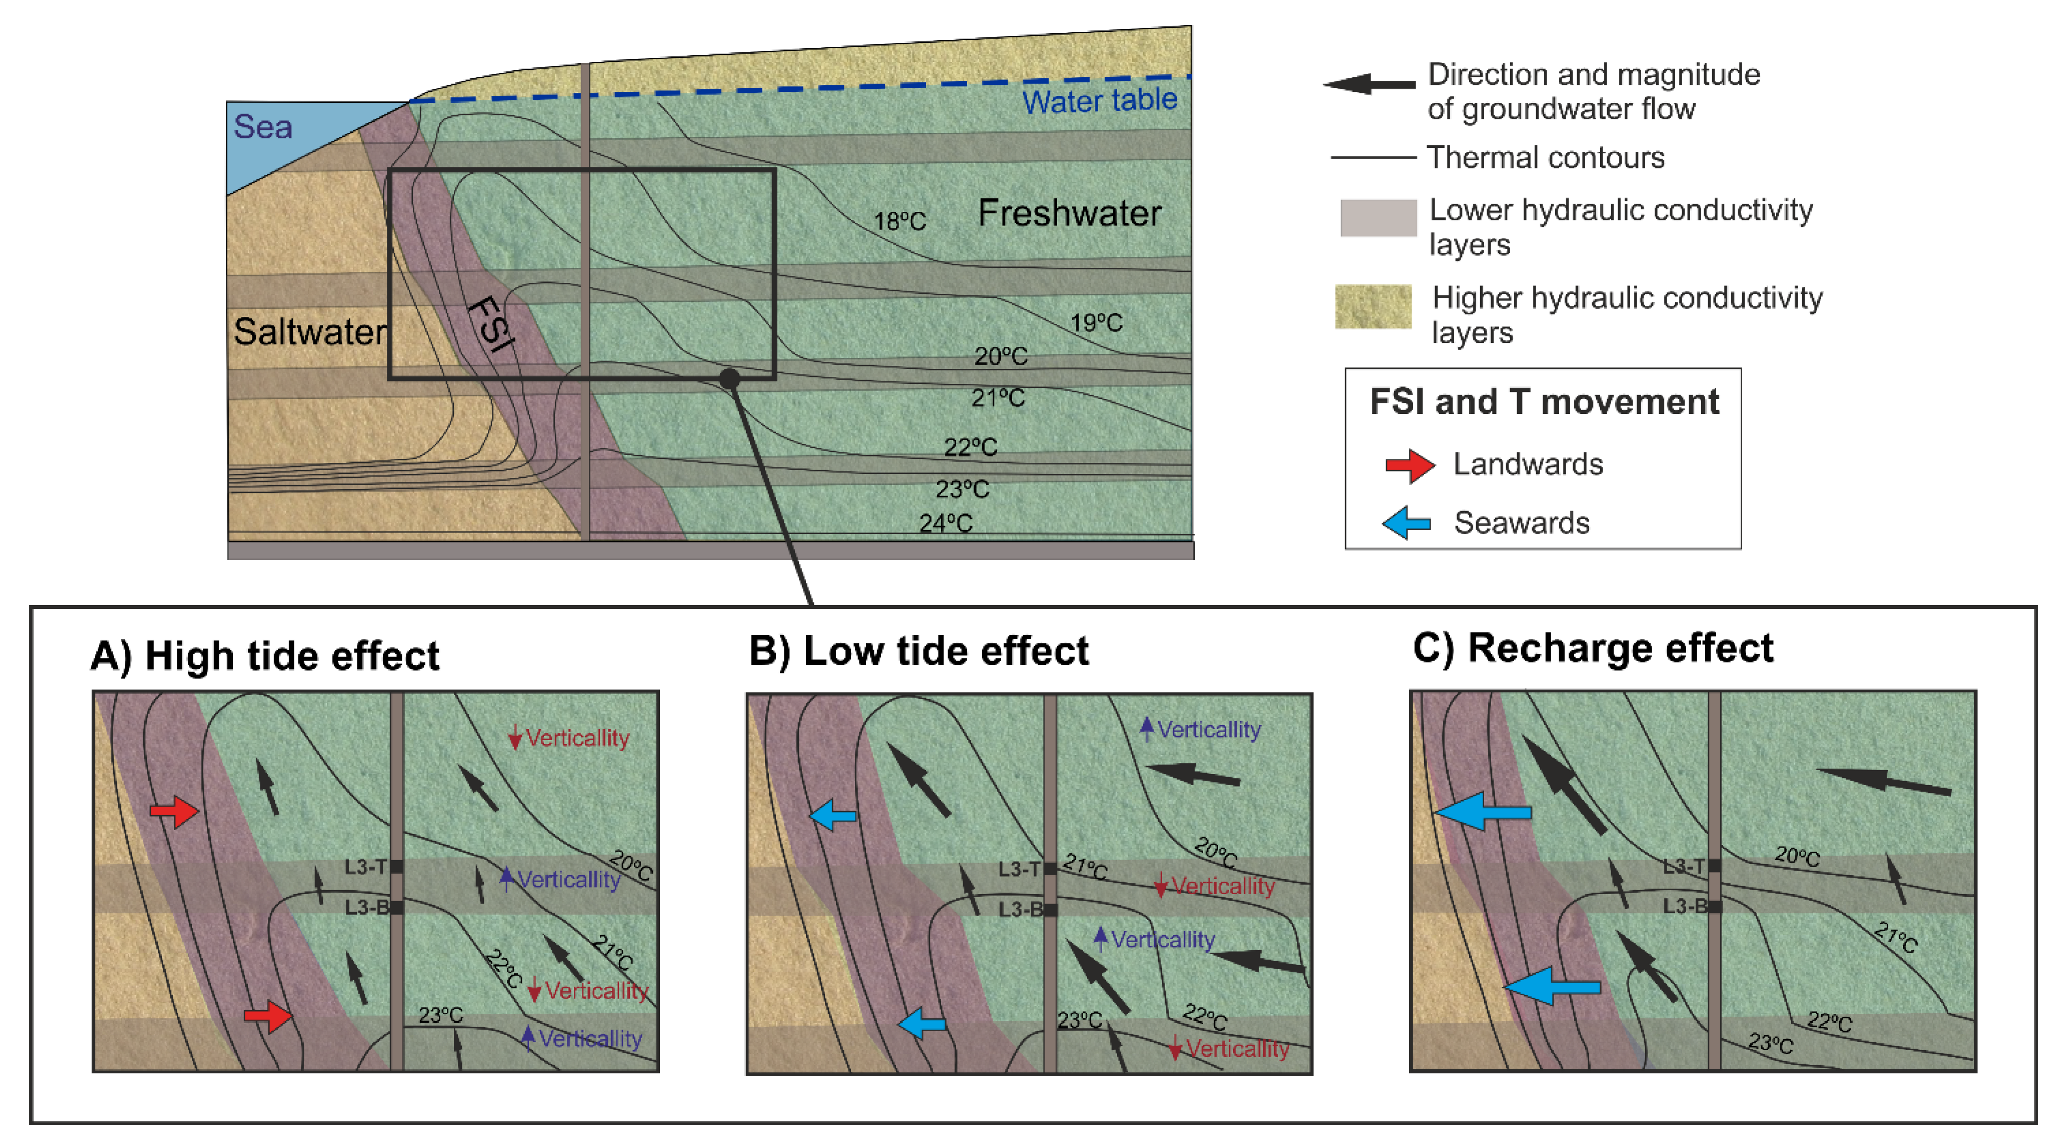
Temperature and EC fluctuated simultaneously at the semidiurnal frequency. The fluctuations, however, were inverted when comparing the results of observation points located at different layer boundaries (Figure 12), but no changes were detected in the intralayer zones. This is explained by the change in inclination (verticality) of the FSI during seaward/landward movements associated with sea tides within each layer. For example, during high tides, the FSI moved landwards and both the FSI and the thermal contours were less close to vertical in high K layers and closer to vertical in low K layers compared to their respective shapes during low tides (Figure 15). The orientation of the FSI produced differential movements within the same layer, resulting in an opposite oscillation between top and bottom. However, adjacent observation points located at different layers (top of high K and bottom low of K or bottom of high K and top of low K) had synchronized oscillations (Figure 12). The proposed mechanism could explain the opposite oscillations observed for EC and temperature when comparing the observation depths in other studies that did not incorporate such an explanation [27]. On the other hand, changes in the hydraulic gradient, related to a higher recharge, produced a decrease in salinity due to the displacement of the FSI seawards (Figure 15C). The heat plume followed the FSI and became narrower because of the increment in groundwater flow and the movement of the fresh groundwater seawards.
This study considered processes that are located at a depth where surface processes cannot have an immediate effect by direct transport (e.g., heat). The temperature variability was related to the changes in the position of the ascending thermal plume that accompanied the FSI position. Levanon et al. [18] associated the salinity fluctuations near the FSI with the movement of the entire freshwater body. However, in aquifers where there is a thermal plume, the same can also be displaced as a result of the movement of groundwater, thus enabling the identification of thermal oscillations that would not be registered if the thermal contours were horizontal. This is the reason why almost simultaneous fluctuations were observed in the temperature and EC datasets. Levanon et al. [67] showed that the hydraulic head in the FSI reacted faster than the EC, as EC fluctuations represent the actual movement of water, whereas hydraulic head fluctuations only represent pressure diffusion. Our study demonstrates that temperature fluctuations can originate from the same mechanisms that produce EC fluctuations. The close relationship between salinity and temperature distribution indicates that heat can be a useful tool to study coastal aquifers and that the use of temperature as a natural tracer could be applied to the monitoring of the FSI location.
These relatively small variations will become important in future scenarios. Extreme droughts or rising sea levels are expected to have a greater impact on groundwater resources. The reduction of rainfall can decrease groundwater recharge to the aquifer, resulting in reduced aquifer flow and seawater intrusion [69], and a disturbance of geothermally affected groundwater temperature. Moreover, human actions such as the construction of dams, which contribute to the modification of water regimes, can induce changes in the groundwater temperature distribution in deep zones. In the study, river water flow and discharge flow from the Rules dam confirmed that the management of surface water resources generated an impact on temperature distribution. The pattern of groundwater temperature changed when the recharge increased due to the larger volume of water discharged by the Rules dam (Figure 6).
The Motril-Salobreña aquifer is characterized by being one of the few coastal aquifers in the Mediterranean Sea that conserves exceptional water quality and quantity [49]. The recharge originating from the melting of snow in the Sierra Nevada prevents the aquifer from incurring saltwater encroachment and, consequently, salinity and temperature oscillations due to tidal effects are smaller than under low groundwater recharge. However, other coastal Mediterranean aquifers with more extreme climate conditions can be the subject of study to identify thermal plume oscillations since they would have more evident effects.

6. Conclusions

Groundwater recharge variability and sea tides induce temporal changes in the distribution of temperature in sectors of coastal aquifers not directly influenced by surficial recharge, i.e., at deep locations. Data collected near the freshwater–saltwater interface area in the Motril-Salobreña aquifer, combined with a set of variable density and heat transport models, were used to understand the conceptual mechanism that produces temperature oscillations, as it has been observed for hydraulic heads.
  • Seasonal variations of aquifer recharge and sea tides produced a displacement of the fresh groundwater and the FSI and, consequently, changes in EC and temperature distribution. EC fluctuations depended on the horizontal gradient of salinity in the proximity of the FSI. However, the oscillations of temperature depended on the presence of the thermal plume generated by the upwelling flow along the FSI, which was also displaced together with the FSI.
  • The amplitude of EC and temperature oscillations associated with sea tides decreased with depth and increased in the areas where hydraulic conductivity changed. The convective heat transport was refracted at the interface between layers with different hydraulic conductivity, inducing a bending with different degrees of inclination (verticality) of the thermal contours. The desynchronization of the oscillations registered at the bottom and at the top of the same layer was produced by the variations in verticality of the thermal plume and the FSI.
  • EC and temperature fluctuations were related to hydraulic gradient variations and, hence, to groundwater recharge. The presence of the thermal plume induced a different evolution of salinity and temperature. Salinity progressively decreased as the hydraulic gradient increased. However, the evolution of temperature depended on the position of the observation point with respect to the thermal plume.
  • The temperature distribution in coastal aquifers is highly sensitive to natural changes or those induced by humans. The position of the FSI and the thermal plume are dependent on groundwater recharge, which, in turn, depends on climate variability and/or water management. Groundwater recharge plays an important role in the amplitudes of temperature oscillations induced by the tides.

Author Contributions

Conceptualization: A.M.B.-C., M.L.C., M.L.-C., C.D.; Methodology: A.M.B.-C., M.L.C., M.L.-C., C.M.-M., J.J.-S. and C.D.; Software: A.M.B.-C.; Formal Analysis: A.M.B.-C., M.L.C., M.L.-C. and C.D.; Investigation: A.M.B.-C., M.L.C., M.L.-C. and C.D.; Resources: M.L.C., M.L.-C. and C.D.; Writing—original draft preparation: A.M.B.-C.; Writing—review and editing: A.M.B.-C., M.L.C., M.L.-C. and C.D.; Visualization: A.M.B.-C.; Supervision: M.L.C., M.L.-C. and C.D.; Project Administration: M.L.C. and M.L.-C.; Funding Acquisition: M.L.C. and M.L.-C. All authors have read and agreed to the published version of the manuscript.

Funding

This study was supported by grants CGL2016-77503-R, IGME 10-1E-1284 and IGME 15-CE-3391 from the Ministry of Economy and Competitiveness (MINECO), co-founded by the European Regional Development Fund (ERDF) of the European Union (EU), the RNM-369 research group of the regional government of Andalusia and by the Next-Generation EU funding: Programa María Zambrano Sénior (REF: MZSA03).

Data Availability Statement

All experimental data related to the analysis performed is available upon request.

Acknowledgments

The authors also thank the State Harbors (Ministry of Public Services, Government of Spain) for providing the sea-level dataset and the Hidrosur Basin from the General Directorate of Water Infrastructure (Junta de Andalucía) for providing the precipitation data.

Conflicts of Interest

The authors declare no conflict of interest.

Appendix A

Figure A1. Simulation results of model B at different depths of the well W for a mesotidal condition (semi-amplitude of 1.5 m).
Water 14 02807 g0a1

Appendix B

Figure A2. Simulation results of model C at different depths of the well W for a mesotidal condition (semi-amplitude of 1.5 m).
Water 14 02807 g0a2

References

  1. Nielsen, P. Tidal dynamics of the water table in beaches. Water Resour. Res. 1990, 26, 2127–2134. [Google Scholar] [CrossRef]
  2. Li, L.; Barry, D.A.; Stagnitti, F.; Parlange, J.Y.; Jeng, D.S. Beach water table fluctuations due to spring-neap tides: Moving boundary effects. Adv. Water Res. 2000, 23, 817–824. [Google Scholar] [CrossRef]
  3. Rotzoll, K.; Gingerich, S.B.; Jenson, J.W.; El-Kadi, A.I. Estimating hydraulic properties from tidal attenuation in the Northern Guam Lens Aquifer, territory of Guam, USA. Hydrogeol. J. 2013, 21, 643–654. [Google Scholar] [CrossRef]
  4. Xun, Z.; Chao, S.; Ting, L.; Ruige, C.; Huan, Z.; Jingbo, Z.; Qin, C. Estimation of aquifer parameters using tide-induced groundwater level measurements in a coastal confined aquifer. Environ. Earth Sci. 2015, 73, 2197–2204. [Google Scholar] [CrossRef]
  5. Pawlowicz, R.; Beardsley, B.; Lentz, S. Classical tidal harmonic analysis including error estimates in MATLAB using T_TIDE. Comput. Geoscien. 2002, 28, 929–937. [Google Scholar] [CrossRef]
  6. Levanon, E.; Yechieli, Y.; Shalev, E.; Friedman, V.; Gvirtzman, H. Reliable monitoring of the transition zone between fresh and saline waters in coastal aquifers. Groundw. Monitor. Remed. 2013, 33, 101–110. [Google Scholar] [CrossRef]
  7. Sánchez-Úbeda, J.P.; Calvache, M.L.; López-Chicano, M.; Duque, C. The Effects of Non-TIDAL Components, Depth of Measurement and the Use of Peak Delays in the Application of Tidal Response Methods. Water Res. Manag. 2018, 32, 481–495. [Google Scholar] [CrossRef]
  8. Carr, P.A.; Van der Kamp, G. Determining aquifer characteristics by the tidal methods. Water Resour. Res. 1969, 5, 1023–1031. [Google Scholar] [CrossRef]
  9. Erskine, A.D. The Effect of Tidal Fluctuation on a Coastal Aquifer in the UK. Groundwater 1991, 29, 556–562. [Google Scholar] [CrossRef]
  10. Raubenheimer, B.; Guza, R.T.; Elgar, S. Tidal Water Table Fluctuations in a Sandy Ocean Beach. Water Resour. Res. 1999, 35, 2313–2320. [Google Scholar] [CrossRef]
  11. Robinson, M.A.; Gallagher, D.; Reay, W. Field observations of tidal and seasonal variations in groundwater discharge to tidal estuarine surface water. Groundw. Monitor Remed. 1998, 18, 83–92. [Google Scholar] [CrossRef]
  12. Urish, D.W.; McKenna, T.E. Tidal Effects on Ground Water Discharge through a Sandy Marine Beach. Groundwater 2004, 42, 971–982. [Google Scholar] [CrossRef]
  13. Heiss, J.W.; Michael, H.A. Saltwater-freshwater mixing dynamics in a sandy beach aquifer over tidal, spring-neap, and seasonal cycles. Water Resour. Res. 2014, 50, 6747–6766. [Google Scholar] [CrossRef]
  14. Ataie-Ashtiani, B.; Volker, R.E.; Lockington, D.A. Tidal Effects on Sea Water Intrusion in Unconfined Aquifers. J. Hydrol. 1999, 216, 17–31. [Google Scholar] [CrossRef]
  15. La Licata, I.; Langevin, C.D.; Dausman, A.M.; Alberti, L. Effect of tidal fluctuations on transient dispersion of simulated contaminant concentrations in coastal aquifers. Hydrogeol. J. 2011, 19, 1313–1322. [Google Scholar] [CrossRef]
  16. Robinson, C.; Li, L.; Barry, D.A. Effect of Tidal Forcing on a Subterranean Estuary. Adv. Water Resour. 2007, 30, 851–865. [Google Scholar] [CrossRef]
  17. Pool, M.; Post, V.E.A.; Simmons, C.T. Effects of Tidal Fluctuations on Mixing and Spreading in Coastal Aquifers: Homogeneous Case. Water Resour. Res. 2014, 50, 6910–6926. [Google Scholar] [CrossRef]
  18. Levanon, E.; Yechieli, Y.; Gvirtzman, H.; Shalev, E. Tide-Induced Fluctuations of Salinity and Groundwater Level in Unconfined Aquifers—Field Measurements and Numerical Model. J. Hydrol. 2017, 551, 665–675. [Google Scholar] [CrossRef]
  19. Yu, X.; Xin, P.; Wang, S.S.J.; Shen, C.; Li, L. Effects of Multi-Constituent Tides on a Subterranean Estuary. Adv. Water Resour. 2019, 124, 53–67. [Google Scholar] [CrossRef]
  20. Pollock, L.W.; Hummon, W.D. Cyclic Changes in Interstitial Water Content, Atmospheric Exposure, and Temperature in a Marine Beach. Limnol. Oceanogr. 1971, 16, 522–535. [Google Scholar] [CrossRef]
  21. Li, L.; Horn, D.P.; Baird, A.J. Tide-induced variations in surface temperature and water-table depth in the intertidal zone of a sandy beach. J. Coast. Res. 2006, 22, 1370–1381. [Google Scholar] [CrossRef]
  22. Vandenbohede, A.; Lebbe, L. Heat transport in a coastal groundwater flow system near De Panne, Belgium. Hydrogeol. J. 2011, 19, 1225–1238. [Google Scholar] [CrossRef]
  23. Geng, X.; Boufadel, M. Spectral responses of gravel beaches to tidal signals. Sci. Rep. 2017, 7, 40770. [Google Scholar] [CrossRef] [PubMed]
  24. Nguyen, T.T.M.; Yu, X.; Pu, L.; Xin, P.; Zhang, C.; Barry, D.A.; Li, L. 2020. Effects of temperature on tidally influenced coastal unconfined aquifers. Water Resour. Res. 2020, 56, e2019WR026660. [Google Scholar] [CrossRef]
  25. Kim, K.Y.; Chon, C.M.; Park, K.H.; Park, Y.S.; Woo, N.C. Multi-Depth Monitoring of Electrical Conductivity and Temperature of Groundwater at a Multilayered Coastal Aquifer: Jeju Island, Korea. Hydrol. Process. 2008, 22, 3724–3733. [Google Scholar] [CrossRef]
  26. Kim, K.Y.; Park, Y.S.; Kim, G.P.; Park, K.H. Dynamic Freshwater-Saline Water Interaction in the Coastal Zone of Jeju Island, South Korea. Hydrogeol. J. 2009, 17, 617–629. [Google Scholar] [CrossRef]
  27. Vallejos, A.; Sola, F.; Pulido-Bosch, A. Processes Influencing Groundwater Level and the Freshwater-Saltwater Interface in a Coastal Aquifer. Water Res. Manag. 2015, 29, 679–697. [Google Scholar] [CrossRef]
  28. Blanco-Coronas, A.M.; Duque, C.; Calvache, M.L.; López-Chicano, M. Temperature Distribution in Coastal Aquifers: Insights from Groundwater Modeling and Field Data. J. Hydrol. 2021, 603, 126912. [Google Scholar] [CrossRef]
  29. Anderson, M.P. Heat as a ground water tracer. Groundwater 2005, 43, 951–968. [Google Scholar] [CrossRef]
  30. Del Val, L. Advancing in the Characterization of Coastal Aquifers: A Multimethodological Approach Based on Fiber Optics Distributed Temperature Sensing. Ph.D. Thesis, Polytechnic University of Catalonia, Barcelona, Spain, 2020. [Google Scholar]
  31. Taniguchi, M. Evaluations of the saltwater-groundwater interface from borehole temperature in a coastal region. Geophys. Res. Lett. 2000, 27, 713–716. [Google Scholar] [CrossRef]
  32. Fidelibus, M.D.; Pulido-Bosch, A. Groundwater temperature as an indicator of the vulnerability of Karst coastal aquifers. Geosciences 2019, 9, 23. [Google Scholar] [CrossRef]
  33. LeRoux, N.K.; Kurylyk, B.L.; Briggs, M.A.; Irvine, D.J.; Tamborski, J.J.; Bense, V.F. Using Heat to Trace Vertical Water Fluxes in Sediment Experiencing Concurrent Tidal Pumping and Groundwater Discharge. Water Resour. Res. 2021, 57, e2020WR027904. [Google Scholar] [CrossRef]
  34. Parsons, M.L. Groundwater thermal regime in a glacial complex. Water Resour. Res. 1970, 6, 1701–2172. [Google Scholar] [CrossRef]
  35. Kurylyk, B.L.; Irvine, D.J.; Bense, V.F. Theory, tools, and multidisciplinary applications for tracing groundwater fluxes from temperature profiles. Wires Water 2019, 6, e1329. [Google Scholar] [CrossRef]
  36. Tóth, J. A theory of groundwater motion in small basins in central Alberta. Canada. J. Geophys. Res. 1962, 67, 4375–43787. [Google Scholar] [CrossRef]
  37. Domenico, P.A.; Palciauskas, V.V. Theoretical analysis of forced convective heat transfer in regional groundwater flow. GSA Bull. 1973, 84, 3803–3814. [Google Scholar] [CrossRef]
  38. An, R.; Jiang, X.W.; Wang, J.Z.; Wan, L.; Wang, X.S.; Li, H. A theoretical analysis of basin-scale groundwater temperature distribution. Hydrogeol. J. 2015, 23, 397–404. [Google Scholar] [CrossRef]
  39. Szijártó, M.; Galsa, A.; Tóth, Á.; Mádl-Szőnyi, J. Numerical investigation of the combined effect of forced and free thermal convection in synthetic groundwater basins. J. Hydrol. 2019, 572, 364–379. [Google Scholar] [CrossRef]
  40. Befus, K.M.; Cardenas, M.B.; Erler, D.V.; Santos, I.R.; Eyre, B.D. Heat transport dynamics at a sandy intertidal zone. Water Resour. Res. 2013, 49, 3770–3786. [Google Scholar] [CrossRef]
  41. Tirado-Conde, J.; Engesgaard, P.; Karan, S.; Müller, S.; Duque, C. Evaluation of temperature profiling and seepage meter methods for quantifying submarine groundwater discharge to coastal lagoons: Impacts of saltwater intrusion and the associated thermal regime. Water 2019, 11, 1648. [Google Scholar] [CrossRef] [Green Version]
  42. Duque, C.; Calvache, M.L.; Pedrera, A.; Martín-Rosales, W.; López-Chicano, M. Combined time domain electromagnetic soundings and gravimetry to determine marine intrusion in a detrital coastal aquifer (Southern Spain). J. Hydrol. 2008, 349, 536–547. [Google Scholar] [CrossRef]
  43. Calvache, M.L.; Ibáñez, S.; Duque, C.; Martín-Rosales, W.; López-Chicano, M.; Rubio, J.C.; González, A.; Viseras, C. Numerical modelling of the potential effects of a dam on a coastal aquifer in S. Spain. Hydrol. Process. 2009, 23, 1268–1281. [Google Scholar] [CrossRef]
  44. Duque, C. Influencia Antrópica Sobre la Hidrogeología del Acuífero Motril-Salobreña. Ph.D. Thesis, University of Granada, Granada, Spain, 2009. [Google Scholar]
  45. Duque, C.; Calvache, M.L.; Engesgaard, P. Investigating river-aquifer relations using water temperature in an anthropized environment (Motril-Salobreña aquifer). J. Hydrol. 2010, 381, 121–133. [Google Scholar] [CrossRef]
  46. Blanco-Coronas, A.M.; López-Chicano, M.; Acosta-Rodriguez, R.; Calvache, M.L. Groundwater recharge-discharge estimation with differential flow gaugings in the final stretch of the Guadalfeo river (Granada). Geogaceta 2021, 69, 91–94. [Google Scholar]
  47. Duque, C.; López-Chicano, M.; Calvache, M.L.; Martín-Rosales, W.; Gómez-Fontalva, J.M.; Crespo, F. Recharge sources and hydrogeological effects of irrigation and an influent river identified by stable isotopes in the Motril-Salobreña aquifer (Southern Spain). Hydrol. Process. 2011, 25, 2261–2274. [Google Scholar] [CrossRef]
  48. Olsen, J.T. Modeling the Evolution of Salinity in the Motril-Salobreña Aquifer Using a Paleo-Hydrogeological Model. Master’s Thesis, University of Oslo, Oslo, Norway, 2016. [Google Scholar]
  49. Calvache, M.L.; Duque, C.; Gómez-Fontalva, J.M.; Crespo, F. Processes affecting groundwater temperature patterns in a coastal aquifer. Int. J. Environ. Sci. Technol. 2011, 8, 223–236. [Google Scholar] [CrossRef]
  50. Calvache, M.L.; Sánchez-Úbeda, J.P.; Duque, C.; López-Chicano, M.; De La Torre, B. Evaluation of analytical methods to study aquifer properties with pumping tests in coastal aquifers with numerical modelling (Motril-Salobreña aquifer). Water Resour. Manag. 2015, 30, 559–575. [Google Scholar] [CrossRef]
  51. Sánchez-Úbeda, J.P.; Calvache, M.L.; Duque, C.; López-Chicano, M. Filtering methods in tidal-affected groundwater head measurements: Application of harmonic analysis and continuous wavelet transform. Adv. Water Res. 2016, 97, 52–72. [Google Scholar] [CrossRef]
  52. Pan, H.; Lv, X.; Wang, Y.; Matte, P.; Chen, H.; Jin, G. Exploration of Tidal-Fluvial Interaction in the Columbia River Estuary Using S_TIDE. J. Geophys. Res. Ocean. 2018, 123, 6598–6619. [Google Scholar] [CrossRef]
  53. Shumway, H.S.; Stoffer, D.S. Time Series Analysis and its Applications: With R Examples, 2nd ed.; Springer Science + Business Media, LLC.: New York, NY, USA, 2006; 575p. [Google Scholar]
  54. Larocque, M.; Mangin, A.; Razack, M.; Banton, O. Contribution of correlation and spectral analyses to the regional study of a large karst aquifer (Charente, France). J. Hydrol. 1998, 205, 217–231. [Google Scholar] [CrossRef]
  55. Padilla, A.; Pulido-Bosch, A. Study of hydrographs of karstic aquifers by means of correlation and cross-spectral analysis. J. Hydrol. 1995, 168, 73–89. [Google Scholar] [CrossRef]
  56. Langevin, C.D.; Thorne, D.T.; Dausman, A.M.; Sukop, M.C.; Guo, W. SEAWAT Version 4: A Computer Program for Simulation of Multi-Species Solute and Heat Transport; U.S. Geological Survey Techniques and Methods; Geological Survey (U.S.): Reston, VA, USA, 2008; Chapter A22.
  57. Harbaugh, A.W.; Banta, E.R.; Hill, M.C.; Mcdonald, M.G. MODFLOW-2000, The U.S. Geological Survey Modular Ground-Water Model User Guide to Modularization Concepts and the Ground-Water Flow Process, Geological Survey; CO McDonald Morrissey Associates: Concord, NH, USA, 2000. [Google Scholar]
  58. Zheng, C.; Wang, P.P. MT3DMS—A Modular Three-Dimensional Multispecies Transport Model for Simulation of Advection, Dispersion and Chemical Reactions of Contaminants in Groundwater Systems: Documentation and User’s Guide; U.S. Army Corps of Engineers: Washington, DC, USA, 1999.
  59. Yang, X.; Shaoa, Q.; Hoteit, H.; Carrera, J.; Younes, A.; Fahs, M. Three-dimensional natural convection, entropy generation and mixing in heterogeneous porous medium. Adv. Water Resour. 2021, 115, 103992. [Google Scholar] [CrossRef]
  60. Tabrizinejadas, S.; Fahs, M.; Ataie-Ashtiani, B.; Simmons, C.T.; di Chiara Roupert, R.; Younes, A. A Fourier series solution for transient three-dimensional thermohaline convection in porous enclosures. Water Resour. Res. 2020, 56, e2020WR028111. [Google Scholar] [CrossRef]
  61. Stauffer, F.; Bayer, P.; Blum, P.; Giraldo, N.; Kinzelbach, W. Thermal Use of Shallow Groundwater; CRC Press: Boca Raton, FL, USA, 2014. [Google Scholar] [CrossRef]
  62. Xiaoqing, S.; Ming, J.; Peiwen, X. Analysis Of The Thermophysical Properties And Influencing Factors Of Various Rock Types From The Guizhou Province. EDP Sciences. E3S Web Conf. 2018, 53, 03059. [Google Scholar] [CrossRef]
  63. Pugh, D.T. Tides, Purges and Mean Sea Level; John Wiley & Sons Ltd.: Chichester, UK, 1996. [Google Scholar]
  64. Saar, M.O. Review: Geothermal heat as a tracer of large-scale groundwater flow and as a means to determine permeability fields. Hydrogeol. J. 2011, 19, 31–52. [Google Scholar] [CrossRef]
  65. Wang, Z.; Gao, P.; Jiang, G.; Wang, Y.; Hu, S. Heat Flow Correction for the High-Permeability Formation: A Case Study for Xiong’an New Area. Lithosphere 2021, 5, 9171191. [Google Scholar] [CrossRef]
  66. Ma, J.; Zhou, Z. Origin of the low-medium temperature hot springs around Nanjing, China. Open Geosci. 2021, 13, 820–834. [Google Scholar] [CrossRef]
  67. Levanon, E.; Shalev, E.; Yechieli, Y.; Gvirtzman, H. Advances in Water Resources Fluctuations of fresh-saline water interface and of water table induced by sea tides in unconfined aquifers. Adv. Water Resour. 2016, 96, 34–42. [Google Scholar] [CrossRef]
  68. Mao, X.; Enot, P.; Barry, D.A.; Li, L.; Binley, A.; Jeng, D.S. Tidal influence on behaviour of a coastal aquifer adjacent to a low-relief estuary. J. Hydrol. 2006, 327, 110–127. [Google Scholar] [CrossRef]
  69. Costall, A.R.; Harris, B.D.; Teo, B.; Schaa, R.; Wagner, F.M.; Pigois, J.P. Groundwater Throughflow and Seawater Intrusion in High Quality Coastal Aquifers. Sci. Rep. 2020, 10, 9866. [Google Scholar] [CrossRef]
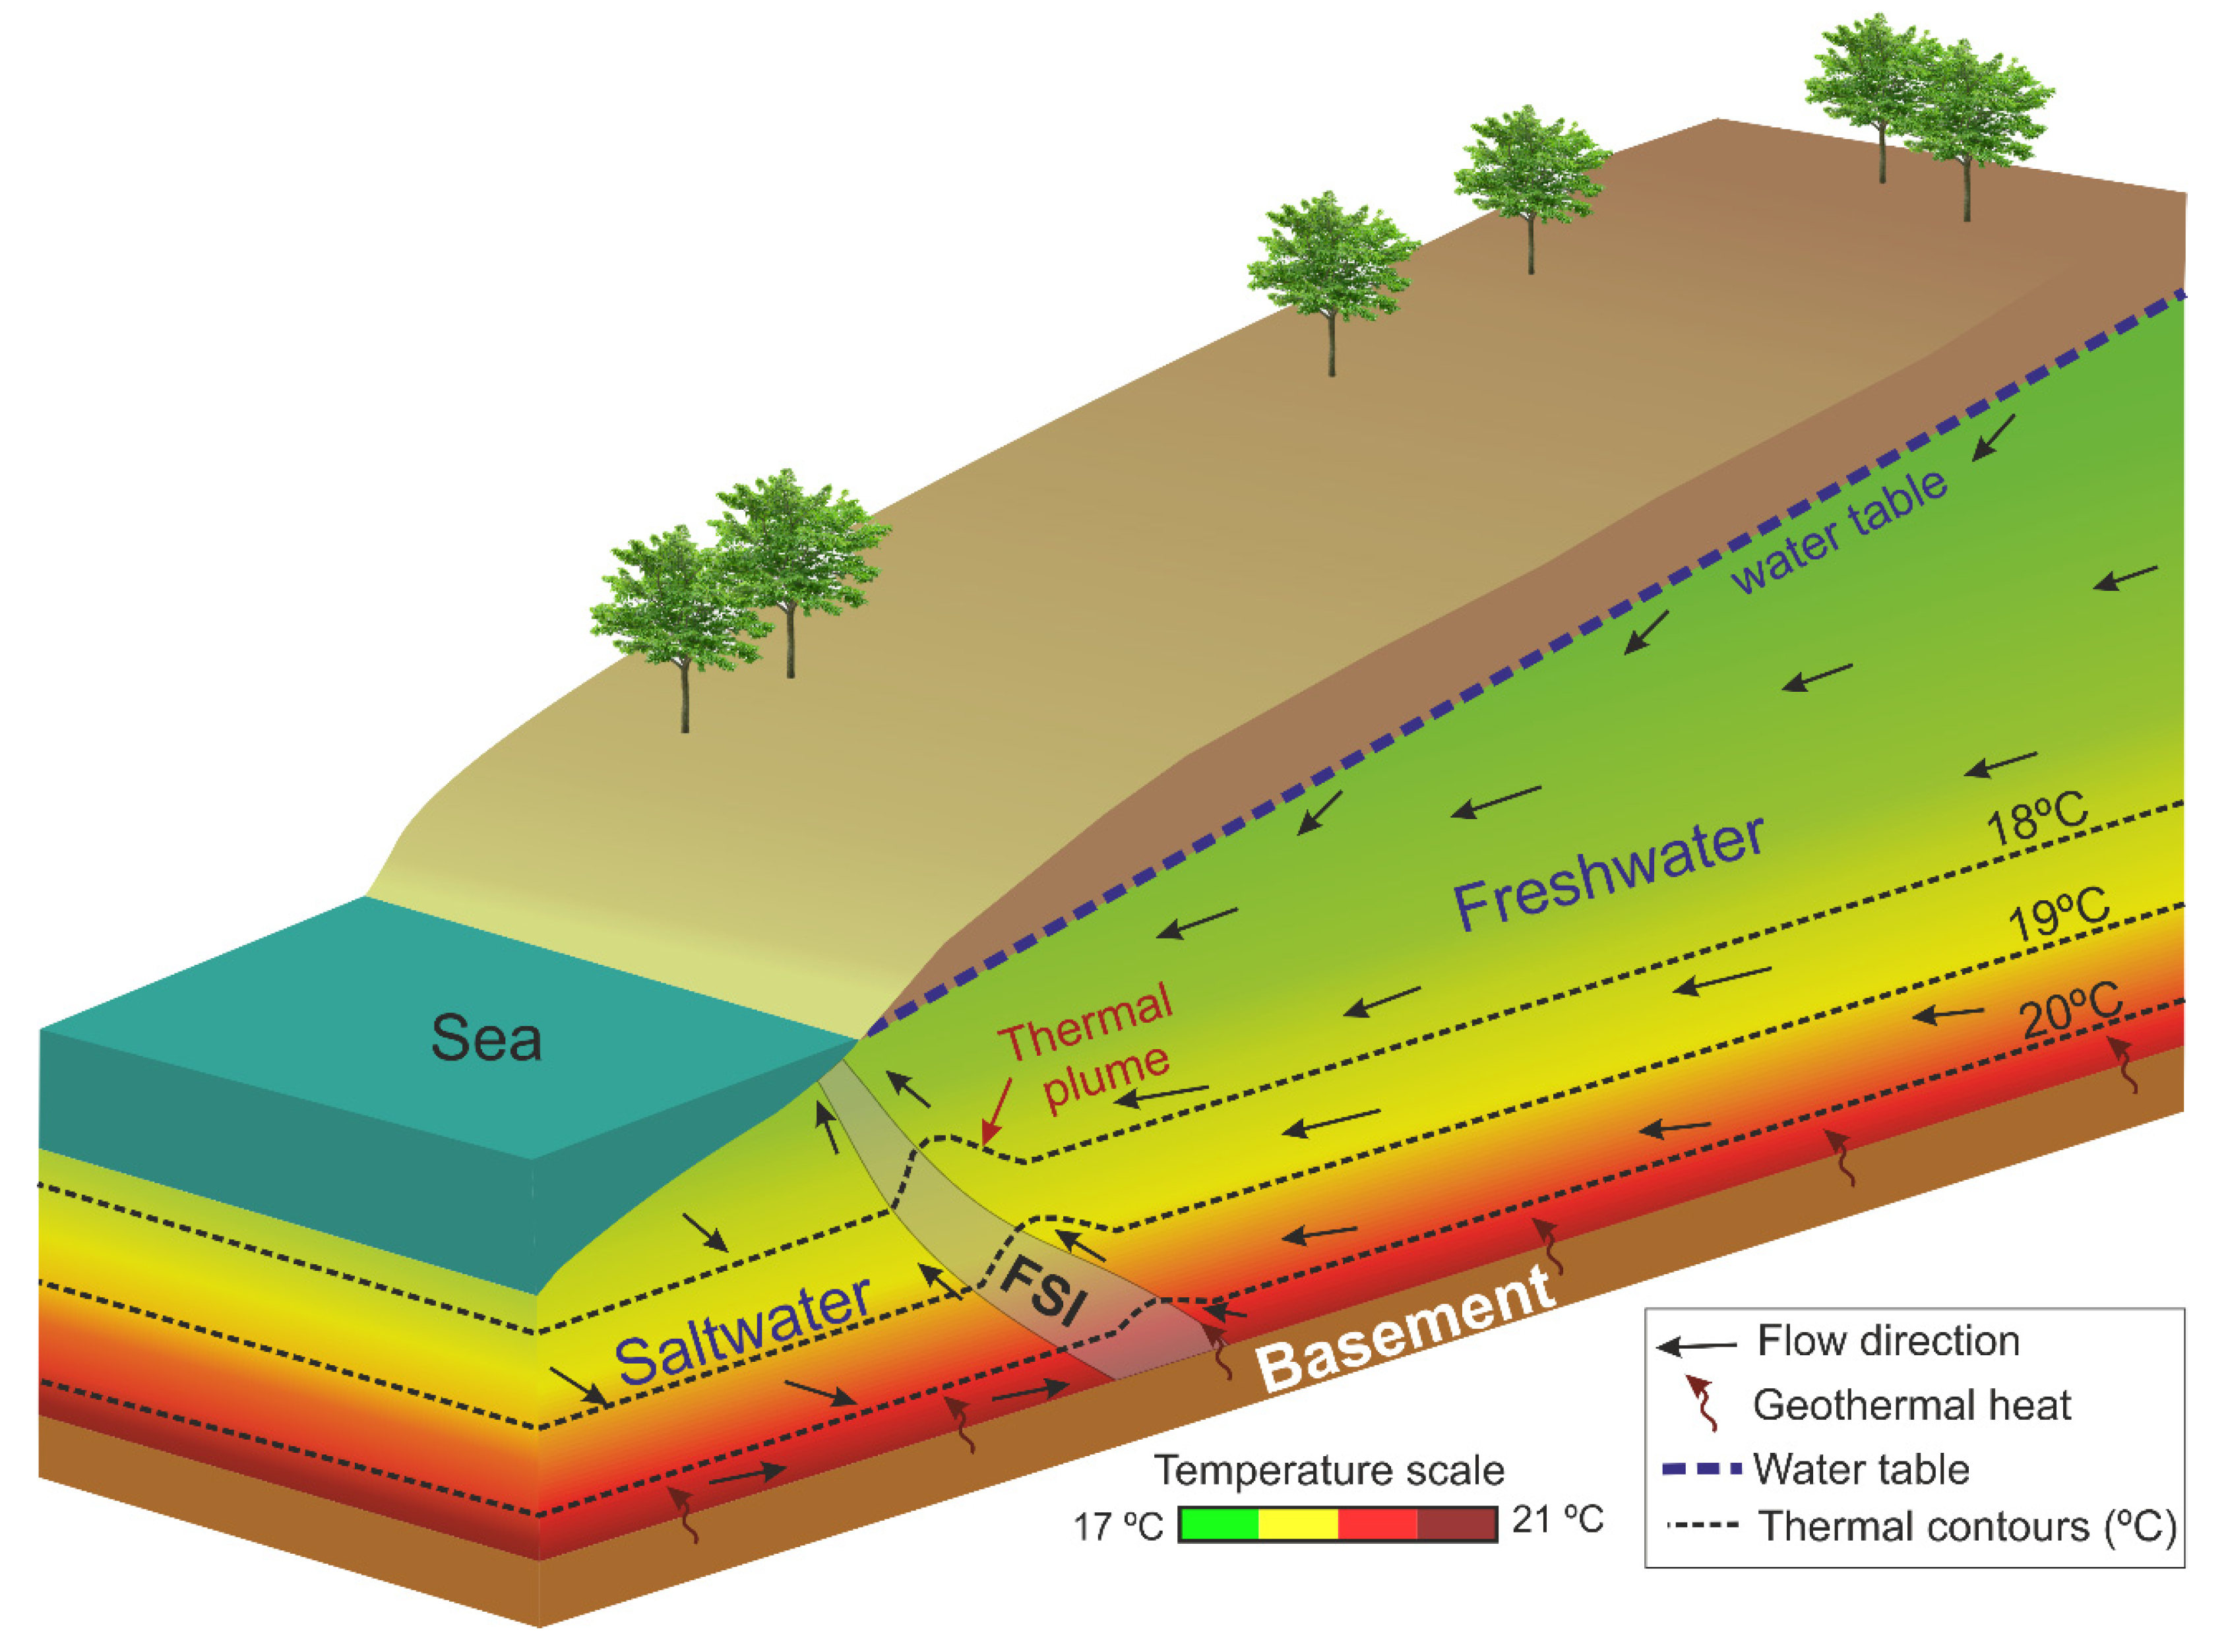
Figure 1. Simplified schematic diagram of temperature distribution of a coastal aquifer affected by the geothermal gradient.
Water 14 02807 g001
Figure 3. Vertical temperature profiles measured in the Motril-Salobreña aquifer, obtained from the observation well W180 located in Figure 2.
Water 14 02807 g003
Figure 4. Boundary conditions of the numerical model. The specified hydraulic conductivity values were considered for models B and C; however, in model A, the unique value considered was 100 m/d. H: hydraulic head, S: salinity, T: temperature.
Water 14 02807 g004
Figure 5. Vertical flow velocity estimated from flowmeter logs in well W250.
Water 14 02807 g005
Figure 6. Data during 2018: Monthly measurements of river water flow (red line) and moving average (MA) of hourly measurements of H obtained from S-4 and S-5 in purple (same values for both sensors), and EC and T obtained from S-4 (green lines) and S-5 (yellow lines). Wet periods are delimited by the grey areas coinciding with the increment of river flow.
Water 14 02807 g006
Figure 7. Vertical logs of EC and T in well W250 during a tidal cycle and the position of the FSI (grey area) and location of the screens (grey bars) where the measurements were obtained (30 September 2019). Log 1 (pink line) during low tide, Log 2 (green line) during tidal rise, Log 3 (brown line) during high tide and Log 4 (blue line) during tidal fall.
Water 14 02807 g007
Figure 8. (a): Continuous measurements of sea level and temperature were obtained from S-3, S-4, and S-5 during February 2018. (b): Density spectra (energy versus frequency) of the temperature data obtained during February 2018. (c): Cross-correlation functions of sea level as input and temperature measured in S-3, S-4 and S-5 as output for February 2018.
Water 14 02807 g008
Figure 9. Simulation results of the homogeneous model (Model A) for microtidal, mesotidal, and macrotidal conditions (semi-amplitudes of 0.75 m, 1.5 m, and 2.5 m, respectively) measured at the observation point L4-T.
Water 14 02807 g009
Figure 10. Salinity and temperature distribution resulting from the multilayered model (model B).
Water 14 02807 g010
Figure 11. Simulation results of model B for microtidal, mesotidal, and macrotidal conditions measured at the top of layer L3. (a): Temperature (T) amplitude measured at different distances from the shoreline. (b): T amplitude vs. local horizontal thermal gradient at each observation point ΔT/d.
Water 14 02807 g011
Figure 12. Simulation results of model B at four depths of the well W for a mesotidal condition (semi-amplitude of 1.5 m). (a): At the observation point H3-B (−122 m) (b): At the observation point L3-T (−123 m) (c): At the observation point L3-B (−138 m) (d): At the observation point H4-T (−140 m).
Water 14 02807 g012
Figure 13. Comparison of the simulation results depending of the location of the observation points (top and bottom of high and low hydraulic conductivity layers).
Water 14 02807 g013
Figure 14. Simulation results of model C at four depths of the well W for a mesotidal condition (semi-amplitude of 1.5 m). (a): At the observation point H3-B (−122 m) (b): At the observation point L3-T (−123 m) (c): At the observation point L3-B (−138 m) (d): At the observation point H4-T (−140 m).
Water 14 02807 g014
Figure 15. Representation of the effect of sea tides (A,B) and the increase of recharge (C) on the FSI and groundwater temperature distribution obtained from models B and C. The movement and verticality of the thermal contours and the FSI were exaggerated to improve the visualization.
Water 14 02807 g015
Table 2. Input values of the parameters for the model.
Input ParametersValueSource
Specific storage1 × 10−5 m−1Calvache et al. [50]
Specific yield0.25Similar value to Calvache et al. [50]
Porosity   θ 0.3Duque et al. [42]
Longitudinal dispersivity20 mStauffer et al. [61]
Vertical transverse dispersivity10 mStauffer et al. [61]
Molecular   diffusion   coefficient   D m s 1 × 10⁻¹⁰ m2/dLangevin et al. [56]
Thermal   conductivity   of   water   k T f l u i d 0.58 W/m °CLangevin et al. [56]
Thermal   conductivity   of   sediments   k T s o l i d 2.9 W/m °CApproximate value for gravel [62]
Specific   heat   of   water   C P f l u i d 4186 J/kg °CLangevin et al. [56]
Specific   heat   of   sediments   C P s o l i d 830 J/kg °CApproximate value for gravel [62]
Thermal   diffusivity   D m T 0.15 m2/dLangevin et al. [56]
Bulk   thermal   conductivity   k T b u l k 1.8 W/m °CLangevin et al. [56]
Thermal   distribution   factor   K d t 2 × 10⁻⁷ L/mgLangevin et al. [56]
Density change with concentration0.7Langevin et al. [56]
Density change with temperature−0.375 kg/(m3 °C)Langevin et al. [56]
Density vs pressure head slope0.00446 kg/m4Langevin et al. [56]
Bulk   density   ρ b 1800 kg/m3 Calculated   with   ρ b = ρ s ( 1 θ )
Reference temperature25 °CLangevin et al. [56]
Viscosity vs concentration slope1.923 × 10−6 m4/dLangevin et al. [56]
Reference viscosity86.4 kg/ m dLangevin et al. [56]
Table 3. Observation points of the model (nomenclature and depths) located at a distance of 217 m from the shoreline.
L1-TL1-BH2-TH2-IH2-BL2-TL2-BH3-TH3-IH3-B
−20 m−31 m−34 m−70 m−79 m−88 m−96 m−97 m−110 m−122 m
L3-TL3-IL3-BH4-TH4-IH4-BL4-TL4-IL4-BH5-T
−124 m−131 m−139 m−140 m−155 m−168 m−169 m−175 m−182 m−183 m
Table 4. Main tidal constituents of the Mediterranean Sea and the temperature measured in S-3, S-4, and S-5, obtained with S_TIDE toolbox.
Harmonic ConstituentSymbolAmplitude (m)Amplitude (°C)
Sea LevelS-3S-4S-5
Lunisolar synodic fortnightlyMsf0.0460.0030.0070.012
Principal lunar diurnalO10.0220.0040.0010.005
Luni-solar diurnalK10.0290.0040.0010.006
Lunar diurnalOO10.0130.0010.0020.001
Larger lunar elliptic semidiurnalN20.0310.0040.0020.006
Principal lunar semidiurnalM20.1570.0210.0090.027
Principal solar semidiurnalS20.0640.0080.0030.011
Shallow water overtides of principal lunar constituentM40.0160.00100
Table 5. Time-lags obtained from the cross-correlation analysis, average amplitudes of the temperature oscillations, and temperature ranges of the dataset for February 2018. t l a g T I D E T is the delay between tide and temperature, t l a g H T is the delay between hydraulic head and temperature, t l a g E C T is the delay between electrical conductivity and temperature.
Depth t l a g T I D E T   ( h ) t l a g H T   ( h ) t l a g E C T   ( h ) Amplitude (°C)Range (°C)
132 m6.4 6.1−1.10.0417.7–17.8
217 m5.65.6-0.0218.9–19.0
236 m5.45.3−0.70.0619.9–20.0
Publisher’s Note: MDPI stays neutral with regard to jurisdictional claims in published maps and institutional affiliations.