Article

Analysis of the Flow Energy Loss and Q-H Stability in Reversible Pump Turbine as Pump with Different Guide Vane Opening Angles

1
ANDRITZ (China) Ltd., Beijing 100004, China
2
College of Engineering, China Agricultural University, Beijing 100083, China
3
College of Water Resources and Civil Engineering, China Agricultural University, Beijing 100083, China
4
Beijing Engineering Research Center of Safety and Energy Saving Technology for Water Supply Network System, China Agricultural University, Beijing 100083, China
5
State Key Laboratory of Hydroscience and Engineering, Tsinghua University, Beijing 100084, China
6
Department of Energy and Power Engineering, Tsinghua University, Beijing 100084, China
*
Author to whom correspondence should be addressed.
Water 2022, 14(16), 2526; https://doi.org/10.3390/w14162526
Submission received: 5 July 2022 / Revised: 9 August 2022 / Accepted: 11 August 2022 / Published: 17 August 2022
(This article belongs to the Special Issue Advancement in the Fluid Dynamics Research of Reversible Pump-Turbine)

Abstract

:
The internal flow problem of a reversible pump turbine restricts its safe and stable operation. Among them, the influence of the guide vane on the internal flow field is very crucial. The flow–head relationship is of great significance in the performance stability of the unit. In this study, the performance and flow field characteristics under different flow rates were analyzed for different guide vane opening angles. By comparing the results of the model test and computational fluid dynamics simulation, it was found that the simulation can well predict the energy characteristics and flow field distribution. There is an optimal efficiency range under each guide vane opening angle. The increase or decrease in flow will reduce the efficiency. For the head, it will decrease significantly with a decrease in the flow rate, especially when it deviates seriously from the optimal efficiency region. From the contour of the flow energy loss and the vector of velocity, it can be seen that the head drop is closely related to the flow blockage caused by the difference between the runner incoming flow direction and the installation direction of the guide vane. This study deeply revealed the valley and peak of head variation under different guide vane opening conditions. It can provide technical support for improving the wide range operation stability of a pump turbine.

1. Introduction

In order to achieve sustainable development, China has proposed the goal of carbon peaking and carbon neutralization, built a modern energy system and enhanced the stability, security and sustainability of the energy supply [1,2]. Pumped storage technology is the most mature, economical and large-scale energy storage technique [3]. It has the functions of peak-load regulation, valley-load filling and phase regulation [4]. It is an important part of realizing the flexible regulation of the power system. A reversible pump turbine is the key component of a pumped storage power station [5]. According to the regulation requirements of the power station, a pump turbine usually switches frequently under multiple working conditions [6]. Therefore, the weighted average flow rate of a pump turbine under multiple working conditions is very important. It determines the speed of the pumping process or power generation process and represents the energy charging and discharging performance of the pumped storage power station.
During the operation of a pump turbine, the weighted average flow rate is strongly related to the opening angle of the guide vane under a certain head, and the opening of the guide vane is greatly affected by the matching of the rotor and stator [7]. For a specific guide vane opening angle, its adaptive optimal flow rate is generally within a specific range, and exceeding this range will cause performance degradation [8]. The flow–head instability problem of a pump turbine with a small flow and high head under a pump condition matches, to some extent, the problem of a runner incoming flow and guide vane opening angle [9,10]. Many scholars have carried out extensive and in-depth research on the flow–head instability and dynamic and static interference of pump turbines. Li et al. [11,12] studied the flow–head instability characteristics of pump turbines by combining an experiment and numerical simulation. The results show that, when entering the unstable area, several vortices are distributed in the guide vane channel and evenly distributed along the circumferential direction. The intensity and range of the vortex change with the flow rate, and the vortex increases the hydraulic loss. Xiao et al. [13] found that the formation of the flow–head unstable area is related to the huge hydraulic loss inside the draft tube, runner and guide vane. There are secondary flow, reflux and even vortex in the unstable area. Lu et al. [14] used a combination of a numerical simulation and experiment to compare the influence of the guide vane profile on the internal flow field of the pump turbine, and found that the guide vane profile has a significant influence on the flow field characteristics, especially the flow energy loss of adjacent components. Song et al. [15] studied the matching between the guide vane opening and the runner and found that, with an increase in the guide vane opening, the magnitude and pulsation amplitude of the runner radial force also increased. Through a pressure pulsation test of the pump turbine, Zhang et al. [16] found that, under a partial load, the rotor–stator interaction between the runner and guide vane will cause the pressure pulsation in the vaneless area.
In the flow–head instability area, the internal flow of the pump turbine is complex [17]. Improving the head-drop margin and increasing the distance between the unstable point and the high efficiency area can improve the operation stability and safety of the unit under pump conditions [18,19]. However, in some cases with a large guide vane opening and low head, if the head rises and the guide vane is not adjusted to the appropriate angle, a flow–head instability phenomenon will also occur [20]. Overcoming this phenomenon, can be realized by adjusting the opening angle of the guide vane, but this method will affect the weighted average flow rate of the pump turbine unit and the economy of the power station operation. In fact, CFD technology and the analysis of the second law of thermodynamics can be used in engineering to help to clarify the change law and reason of flow head characteristics. Many scholars have carried out corresponding research on the correlation analysis of turbomachinery. Zhao et al. [21] described the design and analysis method of a multistage vaneless reverse rotating turbine. The entropy increase in tip leakage is used to describe the cause and result of turbine loss, so as to investigate the performance of the turbine under off design conditions. Based on the concept of entropy, Vanzante et al. [22] introduced the concept of loss work to analyze the loss of the compressor. Sun et al. [23] conducted an unsteady three-dimensional numerical simulation of a transonic compressor. The compressor stage loss and its concentration area were obtained by using the loss work research method. Other scholars use the entropy production rate [24] to measure the energy dissipation in flow. Kluxen et al. [25] analyzed the local entropy production rate in an axial flow turbine and determined that the main factor of additional loss was the strength of the reflux zone. Soltanmohamadi et al. [26] used the entropy production analysis method to optimize the design of the turbine, reducing the energy loss by 26.02% in the full operating range. Zeinalpour et al. [27] also proposed an optimization method for turbine blades based on the entropy yield theory. Taking the entropy production rate as the quantitative index of loss, the optimal design of a multistage turbine cascade was successfully carried out. The above concepts and research methods have great reference value and enlightening significance for the quantitative analysis of the internal flow and energy loss of a pump turbine under pump conditions.
In order to clarify the unit performance degradation under different guide vane opening angles, this study analyzed the flow–head (Q-H) characteristics from a 10 degrees opening and 18 degrees opening for a pump turbine model unit in pump mode. The analysis of the flow field provides a basis for the mechanism of performance degradation, which can clarify the matching problem of a unit runner guide vane under different guide vane openings and provide technical support for pumped storage power stations. The innovation of this paper is to clarify the Q-H characteristics in depth by combining the experimental and simulation results. The comparative analysis of various working conditions is relatively rare in practical projects. This paper creatively analyzes the Q-H characteristics comprehensively, which is of great help to the stable operation of the unit in a wide range.

2. Research Objective

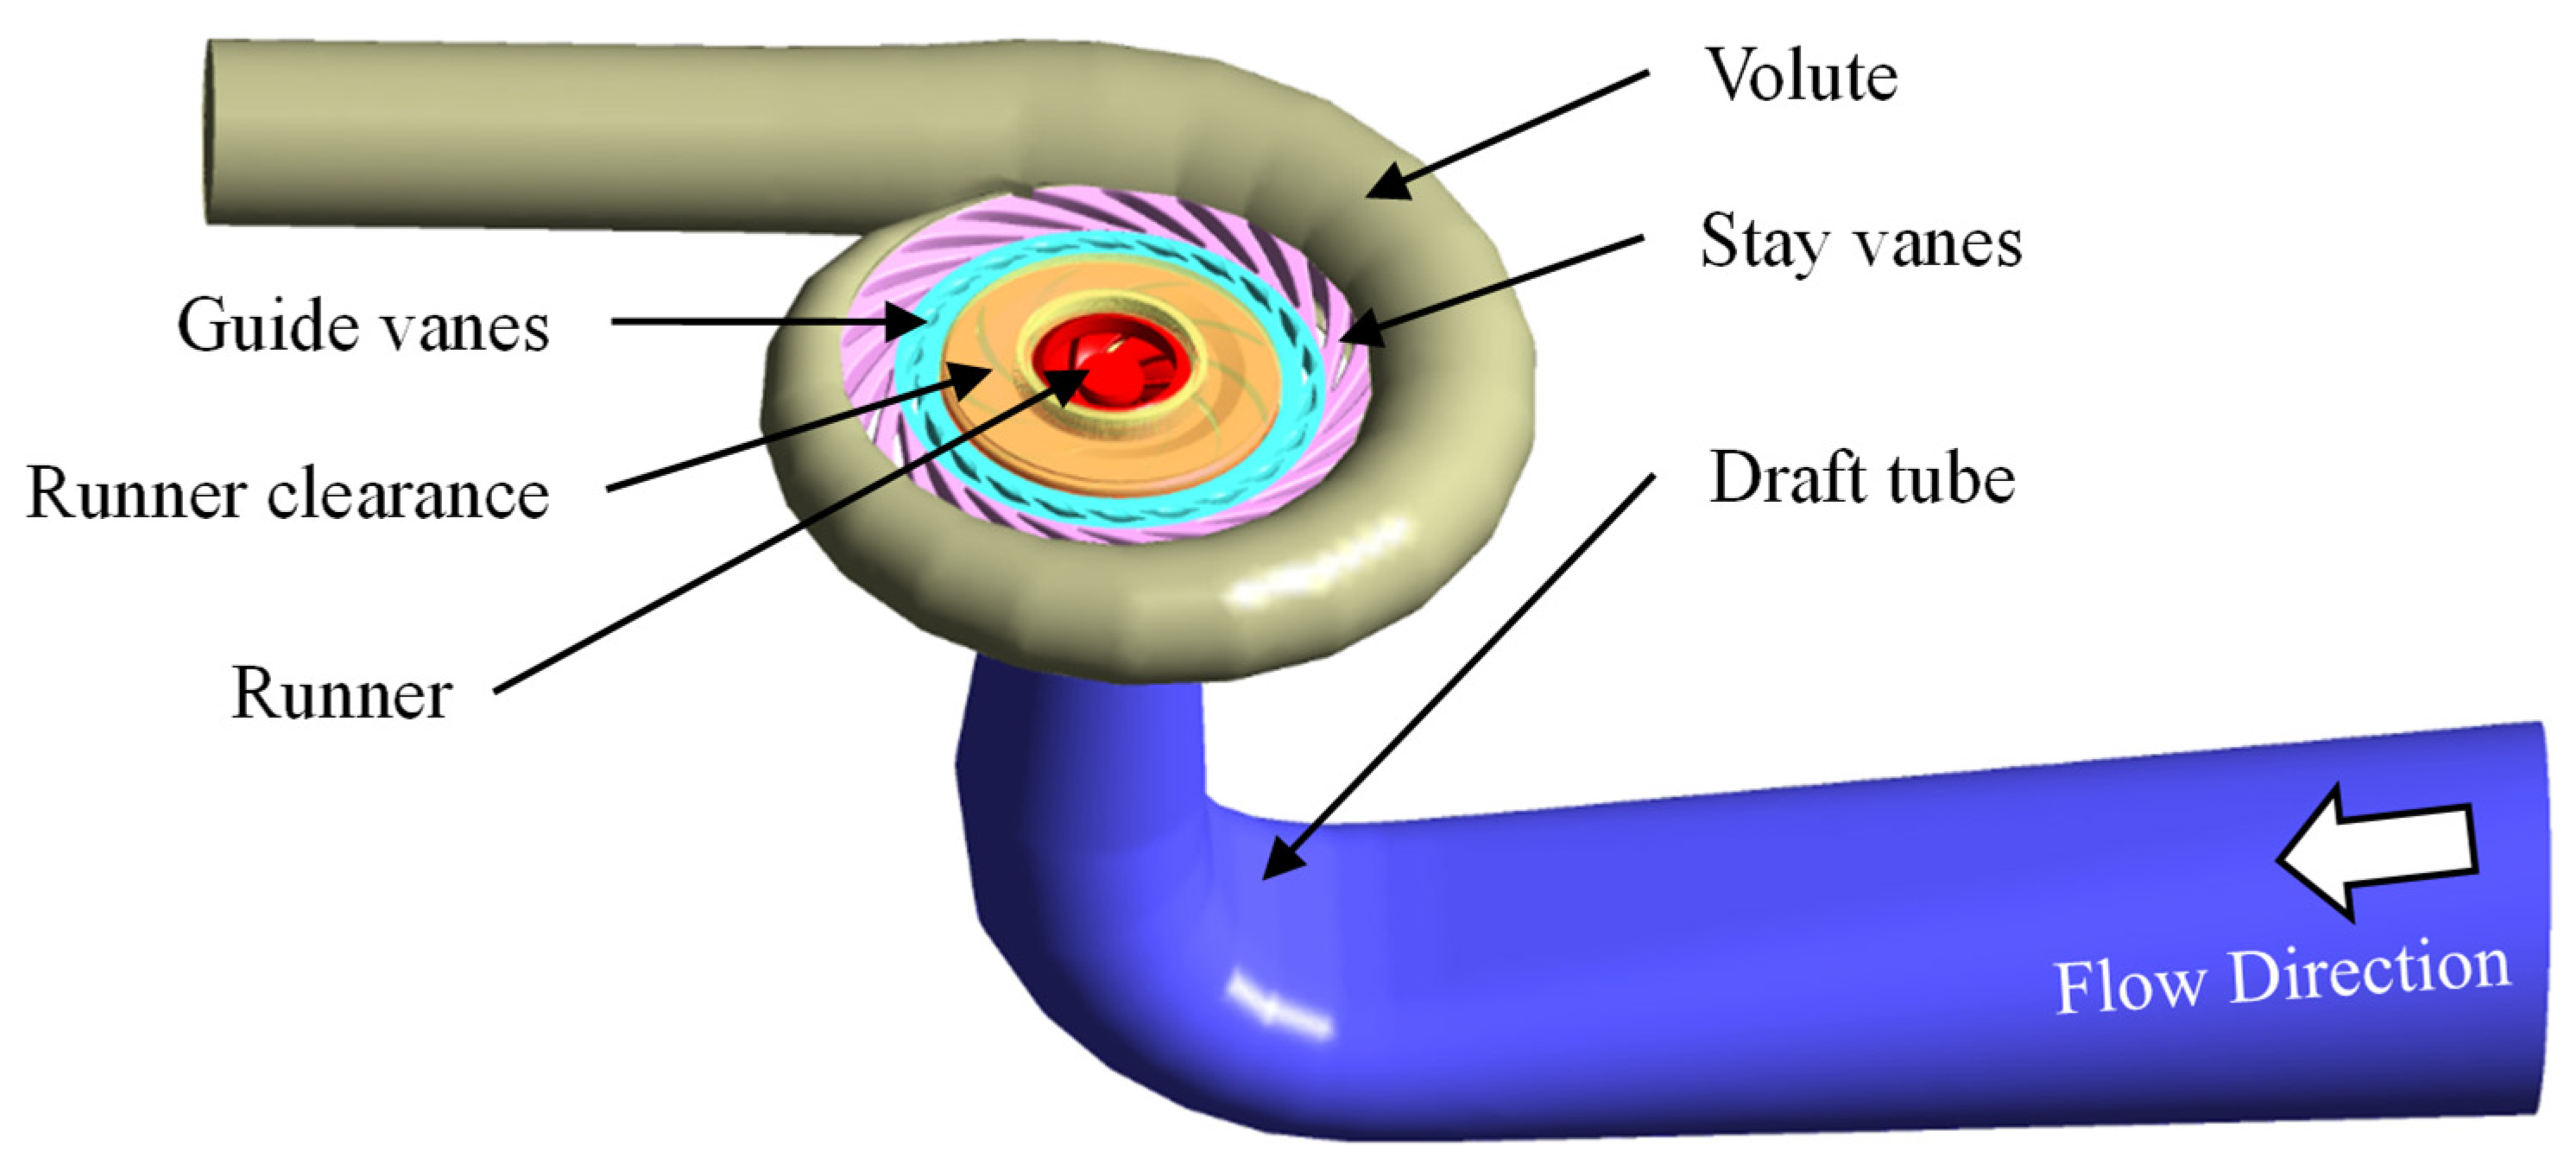
The research objective is to experimentally investigate a model scale of a pump turbine. It includes the volute, stay vanes, guide vanes, runner and draft tube as shown in Figure 1. The main parameters are shown in Table 1. The blade number of the runner is Zr = 9. Both the guide vane blade number Zg and stay vane blade number Zs are 22. The runner diameter (diameter at high pressure side) D1 is 554 mm. The design head Hd is 52.9 m, the maximum head Hmax is 58.0 m and the minimum head Hmin is 50.8 m. The rated rotational speed nd is 1100 rpm. The specific speed nq can be calculated by:
n q = n d Q d H d 3 / 4
In this study, nq is approximately 34.6.
Figure 1. The 3D model of the fluid domain of the reversible pump turbine’s hydraulic components.
Water 14 02526 g001
Table 1. Main parameter of reversible pump turbine unit.
ParameterSymbolValue
Runner blade numberZr9
Guide vane blade numberZg22
Stay vane blade numberZs22
Runner diameterD1554 [mm]
Design headHd52.9 [m]
Maximum headHmax58.0 [m]
Minimum headHmin50.8 [m]
Rated rotational speednd1100 [rpm]
Specific speednq34.6

3. Methodology

3.1. Governing Equations

In this study, computational fluid dynamics (CFD) was used to simulate the internal flow in pump turbine. The flow in the pump turbine can be regarded as three-dimensional incompressible turbulent flow, which is based on Reynolds-averaged Navier–Stokes (RANS) equation and total energy equation. The continuity equation, momentum equation and total energy equation are expressed as follows:
u i ¯ x i = 0
ρ u i ¯ t + ρ u j ¯ u i ¯ x j = x j ( p ¯ δ i j + 2 μ S i j ¯ ρ u i u j ¯ )
t ( ρ h t o t ) p t + x j ( ρ u j h t o t ) = x j ( λ t T x j u j h s t a ¯ ) + x j [ u j ( 2 μ S i j ¯ ρ u i u j ¯ ) ]
where u—velocity, t—time, ρ—density, T—temperature, x—coordinate component, δij—Kroneker delta, μ—dynamic viscosity, Sij—mean rate of strain tensor, hsta—static enthalpy, htot—total enthalpy, λt—thermal conductivity.
SST k-ω model was used as the turbulence model [28] to close the governing equation. The SST k-ω model is a regional mixed model that is suitable for the simulation of different flows in engineering. It is applicable to strong pressure gradient and strong shear near the wall. The flow in the pump turbine in this paper can be well simulated by saving calculation resources while ensuring calculation accuracy. Turbulent kinetic energy k equation and specific dissipation rate ω equation can be written as:
( ρ k ) t + ( ρ u i k ) x i = P ρ k 3 / 2 l k - ω + x i [ ( μ + σ k μ i ) k x i ]
( ρ ω ) t + ( ρ u i ω ) x i = C ω P β ρ ω 2 + x i [ ( μ + σ α μ i ) ω x i ] + 2 ( 1 F 1 ) ρ σ ω 2 ω k x i ω x i
where P—the production term in k and ω equations. F1—the blending function. σk, σω—constants of turbulence model. lk-ω—the turbulence scale. It can be expressed as:
l k - ω = k 1 / 2 β k ω
where βk—the model constant.
Based on RANS simulation, Herwig et al. [29] provided a way to quantitatively calculate the flow energy loss Spro with 4 main sub-terms. S p c ¯ and S p c are the sub-term of entropy production caused by loss term, S p d ¯ and S p d are the sub-term of entropy production caused by dissipation term. They can be calculated by:
S p c ¯ = λ t T 2 [ ( T ¯ x ) 2 + ( T ¯ y ) 2 + ( T ¯ z ) 2 ]
S p c = λ t T 2 [ ( T x ) 2 ¯ + ( T y ) 2 ¯ + ( T z ) 2 ¯ ]
S p d ¯ = μ T ¯ [ 2 ( u ¯ x ) 2 + 2 ( v ¯ y ) 2 + 2 ( w ¯ z ) 2 + ( u ¯ y + v ¯ x ) 2 + ( u ¯ z + w ¯ x ) 2 + ( v ¯ z + w ¯ y ) 2 ]
S p d = μ T ¯ [ 2 ( u x ) 2 ¯ + 2 ( v y ) 2 ¯ + 2 ( w z ) 2 ¯ + ( u y + v x ) 2 ¯ + ( u z + w x ) 2 ¯ + ( v z + w y ) 2 ¯ ]
where x, y, z—coordinate components. In the simulation of incompressible water flow in hydraulic turbomachineries, the sub-terms induced by velocity pulsation were dominant [30,31]. When using the SST k-ω model as turbulence model, the flow energy loss can be simplified to:
S p r o = β ρ ω k T
where β—the model constant of 0.09, k—the turbulent energy, ω—the turbulent eddy frequency, T—the temperature. With this method, the detail of flow energy loss inside pump turbine can be well visualized and analyzed based on CFD simulation results.

3.2. Computational Fluid Dynamics Setup

The numerical simulation was based on the commercial software ANSYS CFX. The flow passage of the pump turbine was from the draft tube inlet to the volute outlet as shown in Figure 2. The commercial software ICEMCFD was used to generate the grid. Tetrahedral and hexahedral grids were used in this study to ensure the computational quality and save computational cost. A grid independence check was conducted as shown in Figure 2a. The residual value of predicted head at the global best efficiency point under α = 14 degrees was chosen as the criterion and a residual less than 0.001 was accepted. The schematic diagram of the final grid is shown in Figure 2b. The grid number of each component is shown in Table 2. The total grid element number was 9,668,956.
A multi reference frame model was used in this study. The runner was set as the rotating domain, and the rest of the parts were stationary domains. The reference pressure was set to 1 Atm. The boundary conditions are given as follows. The inlet boundary was set at the inlet of draft tube with a given velocity. The outlet boundary was set at the volute outlet, and the given outlet static pressure was 0 Pa. The wall boundaries were no-slip wall type. The interfaces between rotor and stators were set as the stage type. The minimum number of iterations was set to 300, the maximum number of iterations was set to 1000 and the convergence criterion was RMS residual less than 1 × 10⁻⁵.

3.3. Model Test

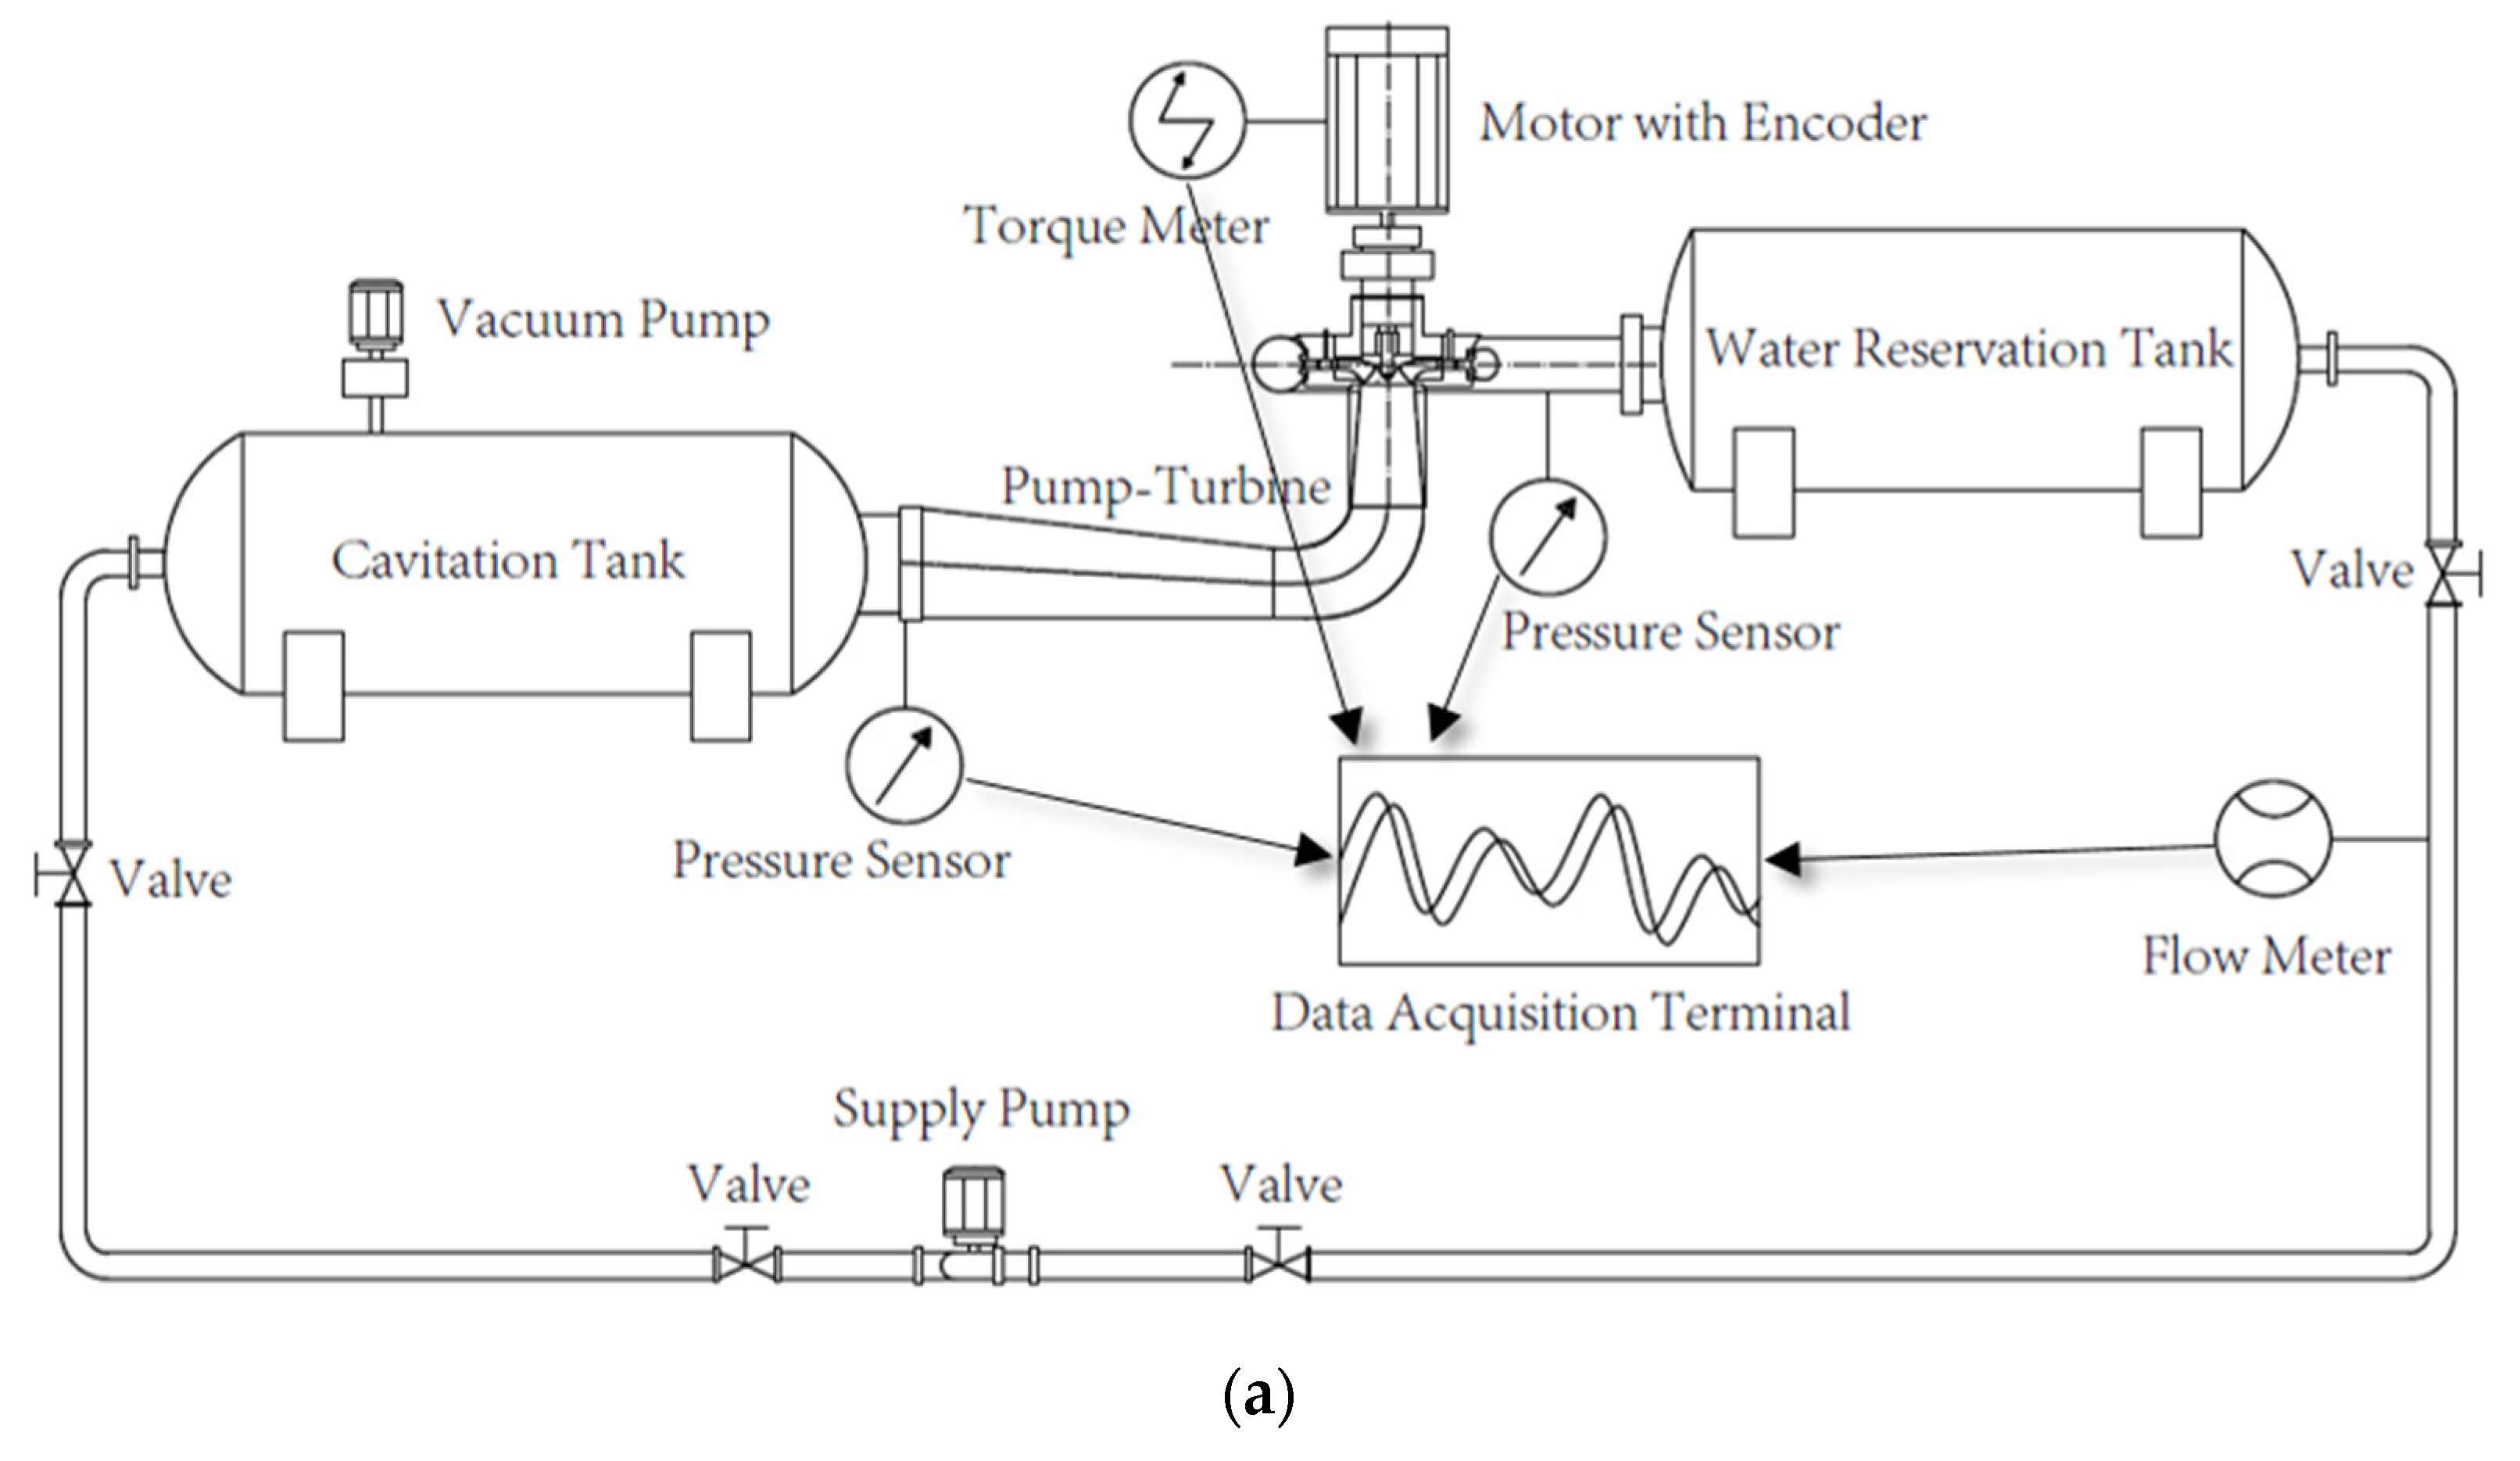
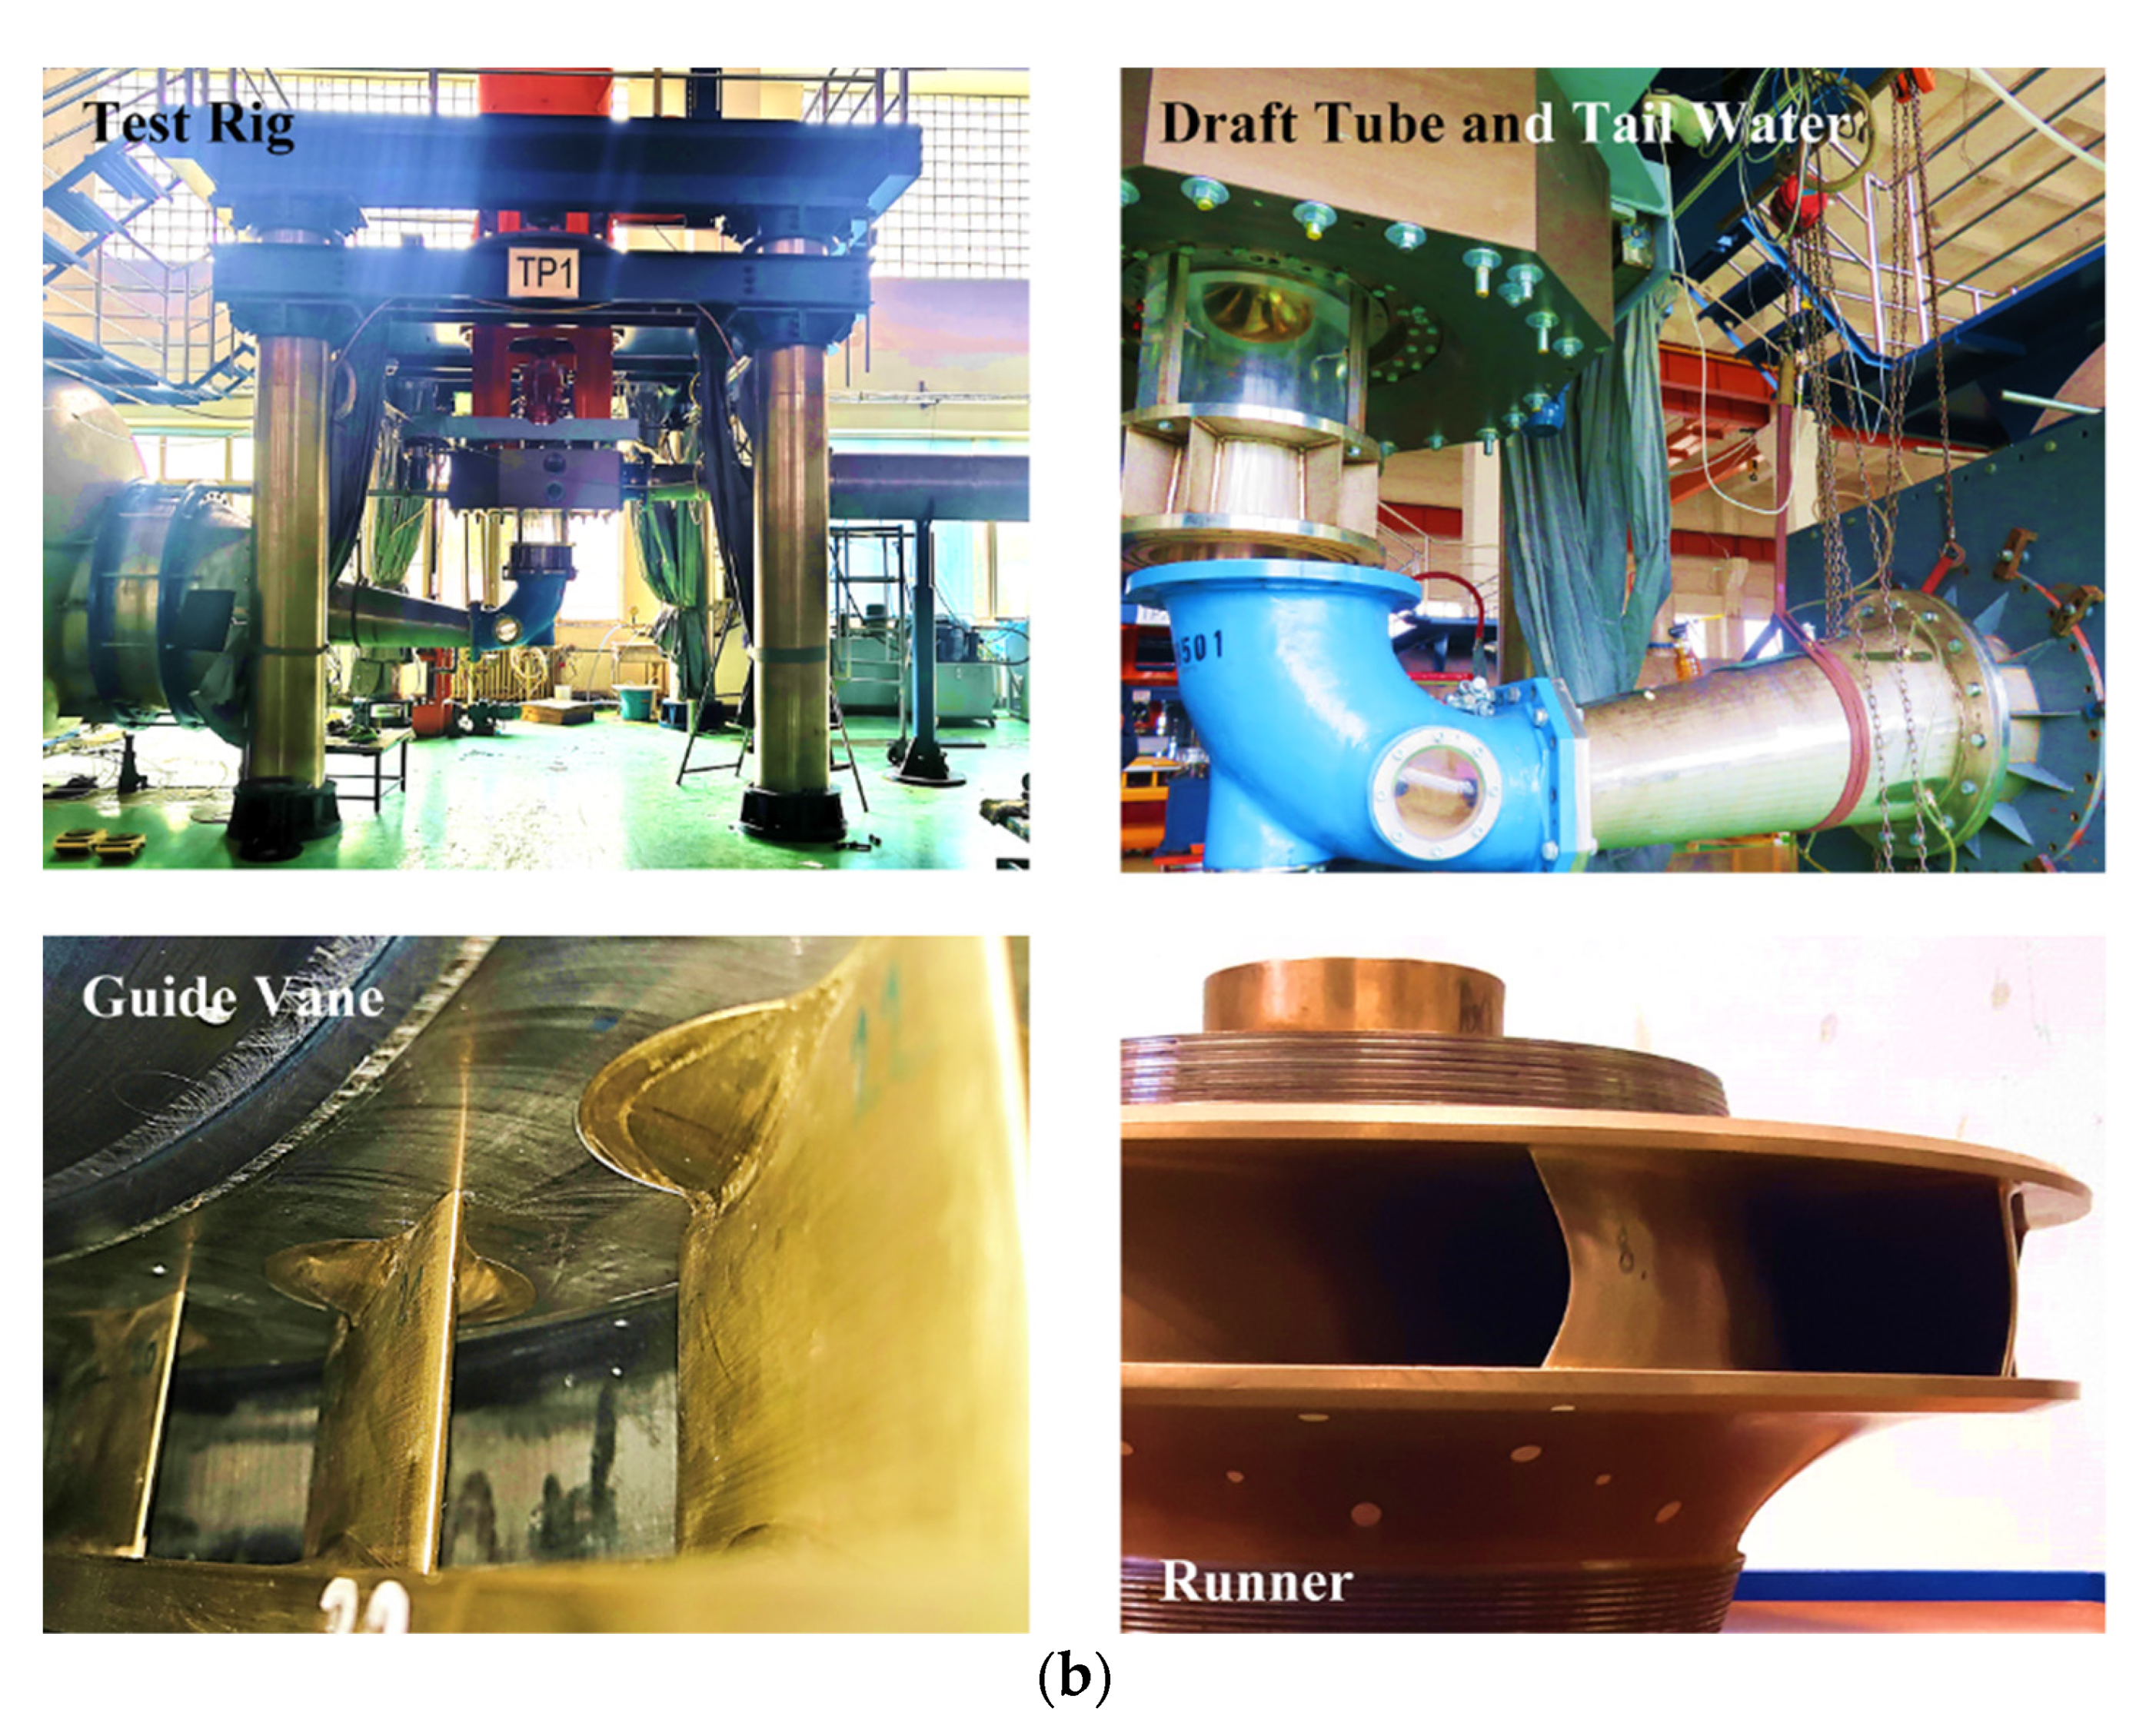
Model test is an important part of this study. As shown in Figure 3, the model scale pump turbine unit was installed in the test section. The upstream and downstream were storage tank and cavitation tank, respectively, which can play the role of water storage, rectification, joint regulation of cavitation with vacuum pump and so on. The supply pump was used to maintain the fluid circulation of the test system.
During the model test, the energy characteristics were measured at first. The parameters such as measured physical quantities and apparatus uncertainty are given in Table 3. Based on the constant speed test method, the working condition was changed by adjusting the valve and matching the guide vane opening angle, and the head H, flow rate Q, rotational speed n, shaft torque M and guide vane opening angle α were recorded. The values of power P and efficiency η can be calculated to determine the operating condition point of the unit. Among them, the head H was measured by the differential pressure sensor, and the static pressure ps and the pressure difference psd between inlet and outlet were measured. The calculation formula is as follows:
H = p s o p s i ρ g = p s d ρ g
where ρ is density and g is the acceleration of gravity. Flow rate Q was measured by electro-magnetic flow meter. The measurement of power P needs to consider torque M and rotational speed n, where n was measured by rotating speed encoder and M was measured by torque meter. Power P can be calculated by:
P = 2 π n 60 M
where the unit of n is [r/min]. The efficiency η can be calculated by:
η = ρ g Q H P
The guide vane opening α was measured by using the angular displacement sensor. The above test parameters were transmitted to the data acquisition terminal for analog-to-digital conversion and post-processing.

4. Comparison of Energy Performance

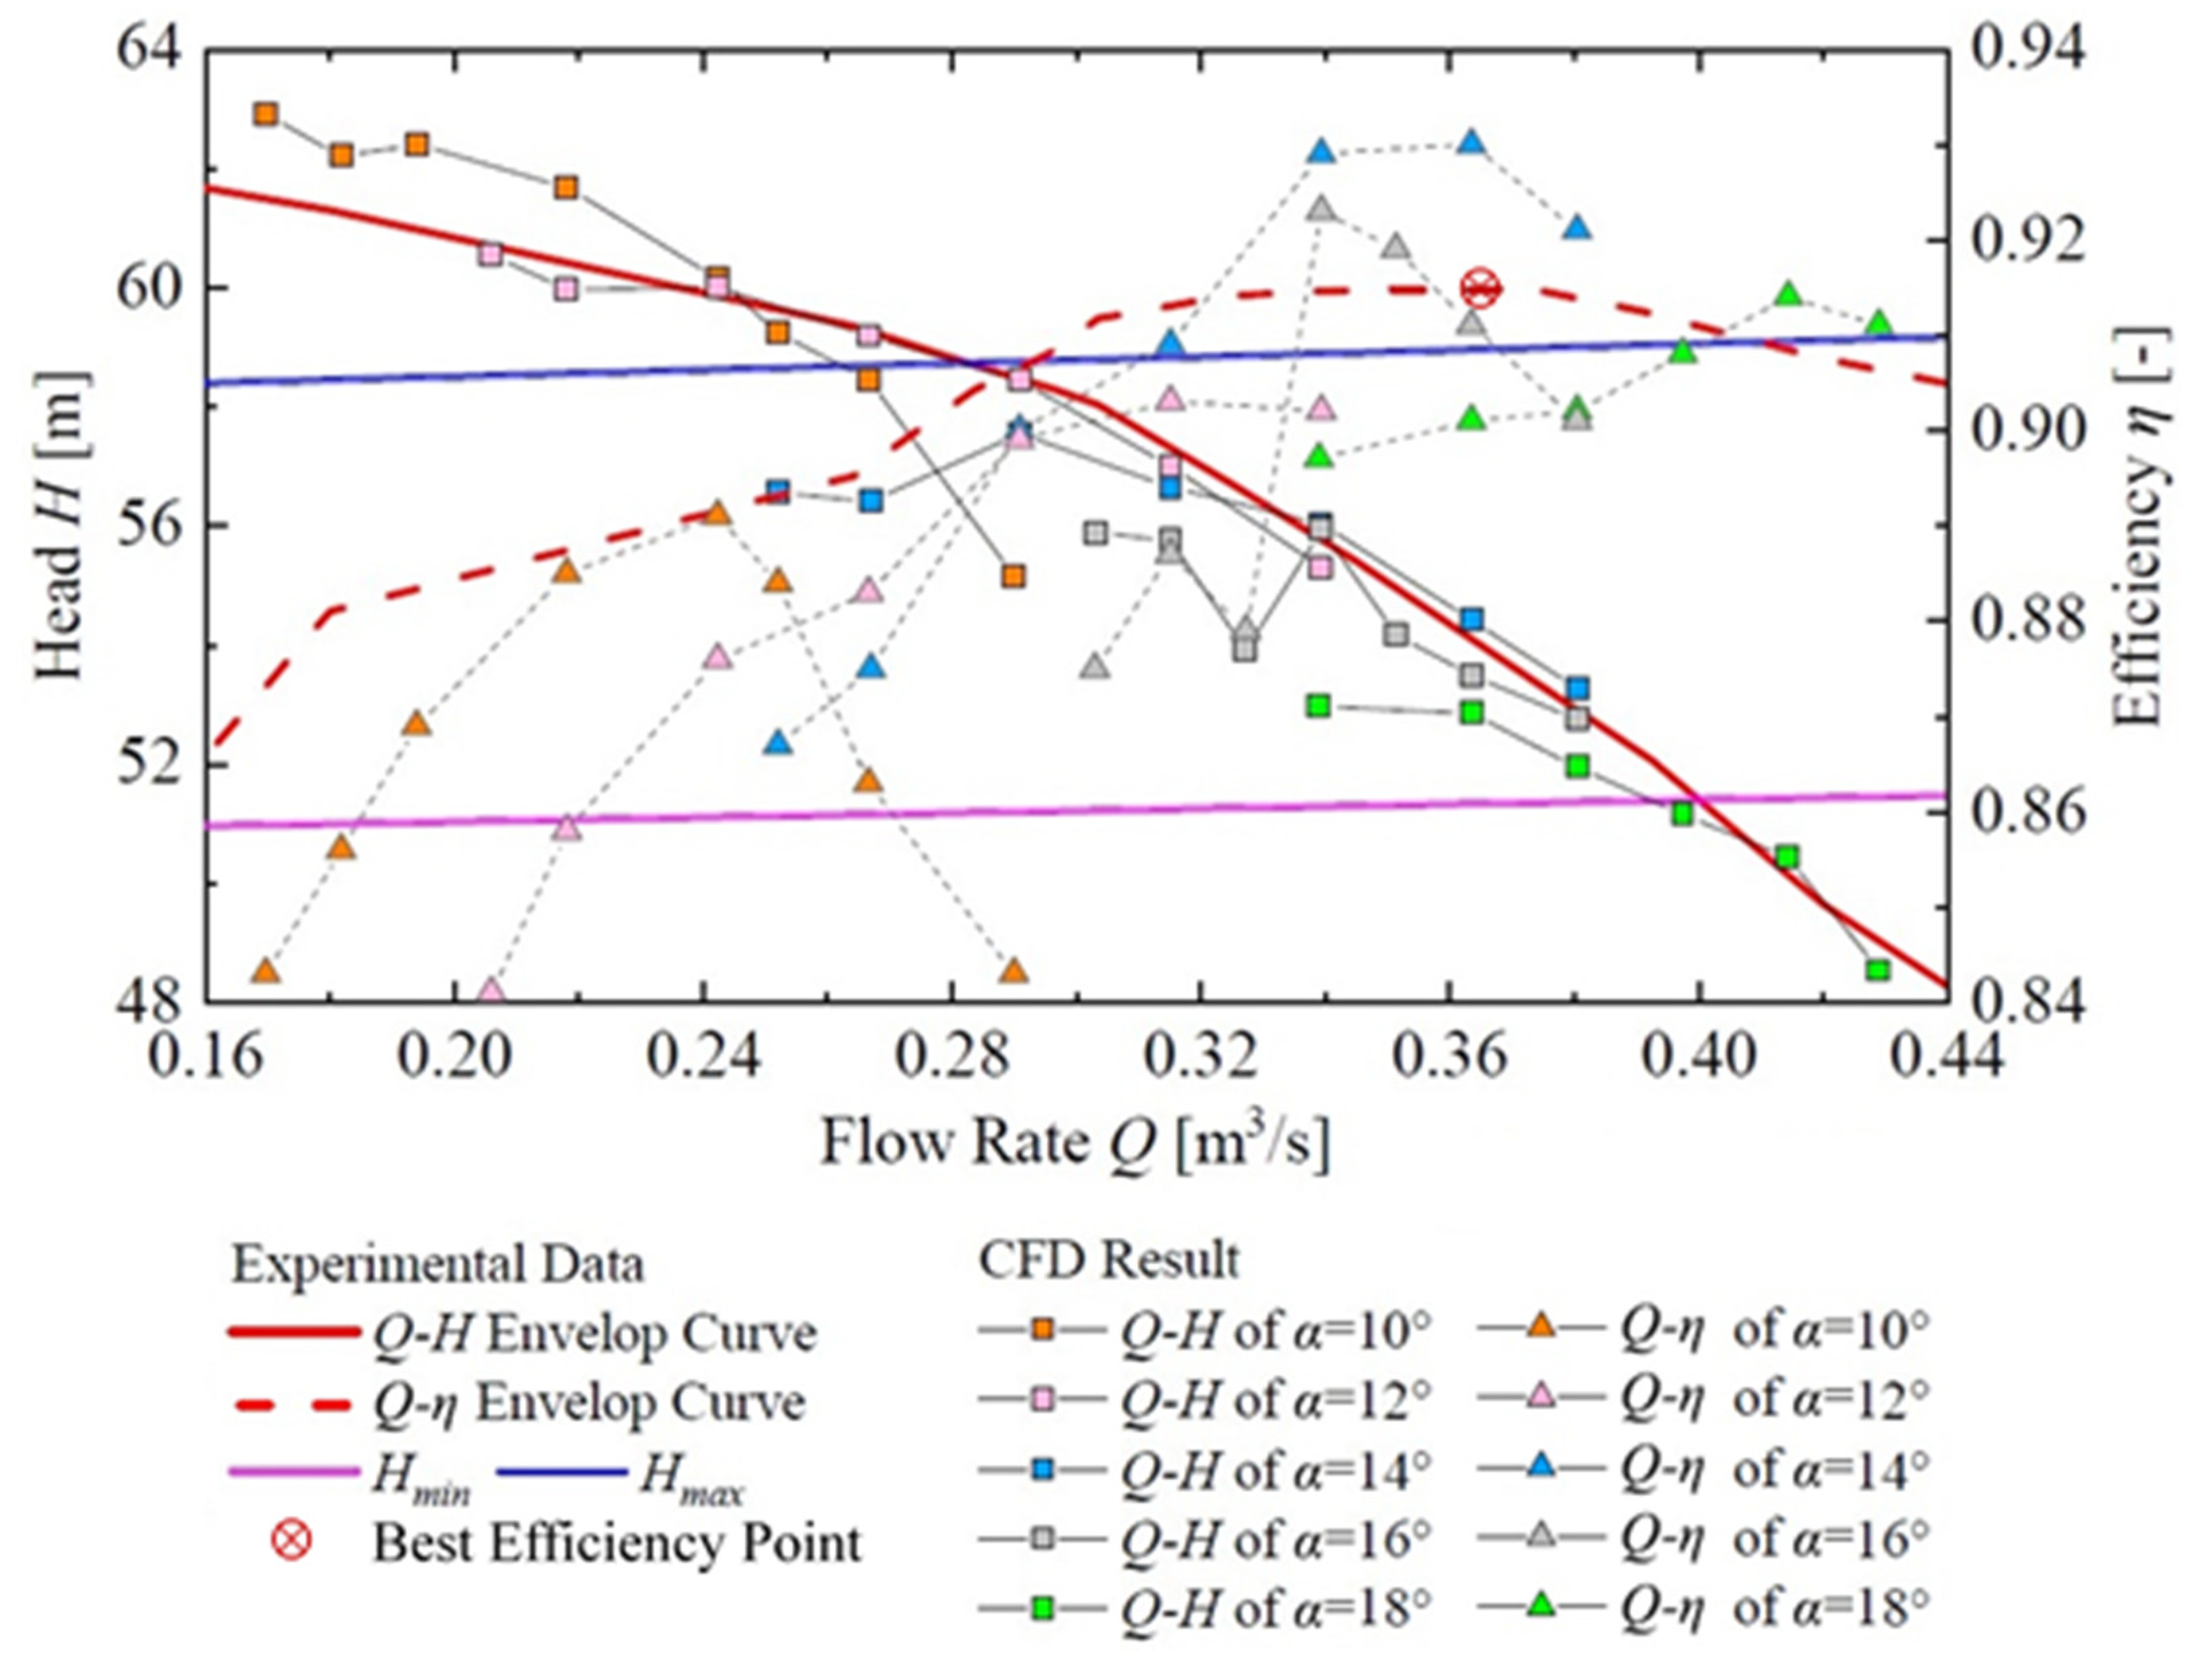
Figure 4 is the experimental–numerical comparison of the energy performance in pump mode. Five different guide vane opening angles were analyzed, including the head H and efficiency η. For the experimental data, the Q-H envelop curve and Q-η envelop curve are shown. The Q-η envelop curve is drawn based on the best efficiency point (QBEP) of each guide vane opening angle. The operation of the prototype pump turbine will follow this curve in order to have a higher efficiency. The head values H of these best efficiency points (QBEP) were recorded as the Q-H envelop curve. For each Q-H curve, its BEP point matches with the Q-η envelop curve and Q-H envelop curve. Generally, as shown by the Q-H envelop curve, H increases with a decrease in Q. The Q-η envelop curve has a peak (best efficiency point) as indicated in Figure 4. The global best efficiency point is under α = 14 degrees.
In the analysis of CFD prediction results, the guide vane opening angle α from 18 degrees to 10 degrees was analyzed. With the decrease in the guide vane opening angle α, the flow rate becomes smaller and smaller. This shows the good flow-adjusting ability of the guide vane. The individual Q-H curves match the Q-H envelop curve well. Head H increases with the decrease in flow rate Q with local variations. For Q-η curves, each individual curve has a local peak. This means that the efficiency increases and decreases with the decrease in the flow rate. Each guide vane opening angle has a best operation range. The efficiencies of the CFD-predicted results are higher than the experimental data. This is reasonable because of the ignorance of the mechanical efficiency in the experiment. The individual Q-η curves have different laws because of the different guide vane openings. Detailed analyses are given in the following sections. CFD prediction will help the internal flow field analysis for the understanding of the relationship between the flow pattern and guide vane opening angle.
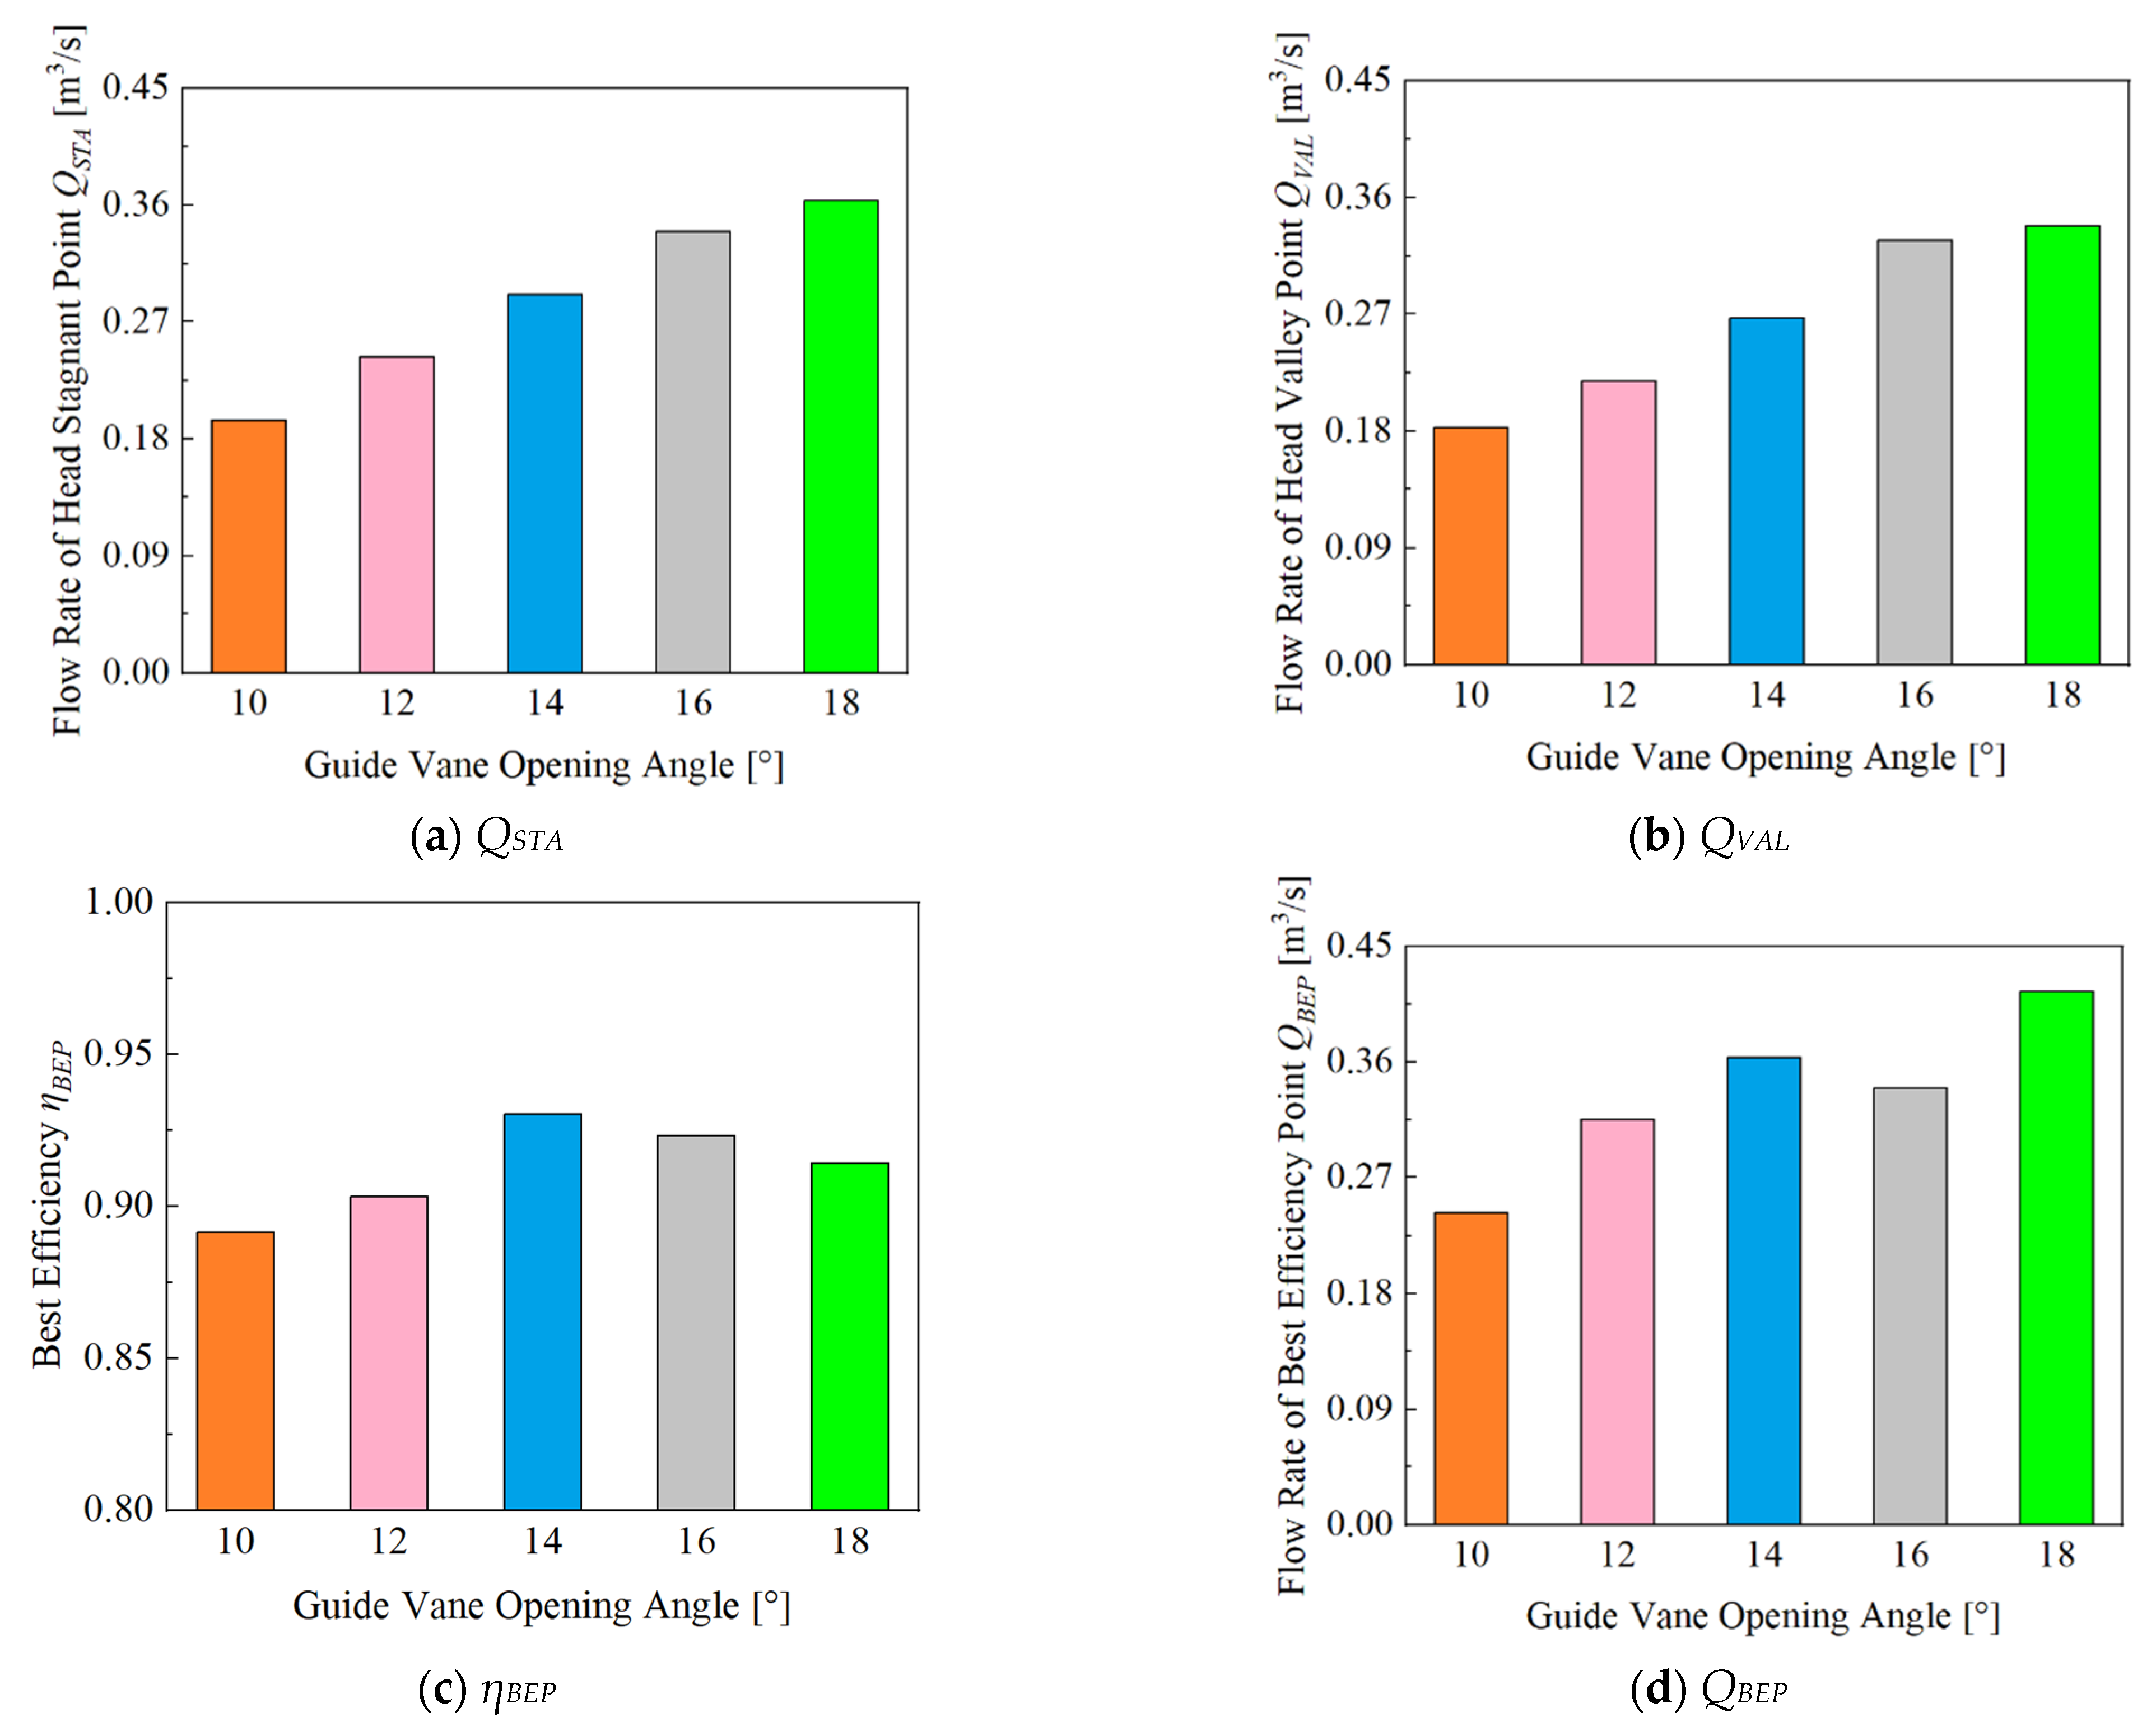
To have a better understanding of the drop in the head when the flow rate is relatively small, the head stagnation point and head valley point are defined for each α condition. For a Q-H curve, the slope is generally negative but one or multiple positive slope regions can be found. With a decrease in the flow rate, the point that H stops the increment is defined as the head stagnation point and the flow rate is denoted as QSTA. If the flow rate continually decreases, H will rise again, the valley point is defined as the head valley point and the flow rate is denoted as QVAL. The values of QSTA and QVAL are shown in Figure 5a,b. Both QSTA and QVAL decrease with a decrease in α. This means that the unstable flow rate of the guide vane decreases synchronously with the decrease in the guide vane opening angle. A detailed analysis of the best efficiency ηBEP and flow rate of best efficiency points QBEP is shown in Figure 5c,d. The value of ηBEP increases within α = 10~14 degrees and decreases within α = 14~18 degrees. The value of QBEP generally increases from α = 10 degrees to α = 18 degrees, with an exception at α = 16 degrees. This means that the optimal matching opening angle of the guide vane increases synchronously with the increase in the flow rate. Therefore, the optimal matching and undesirable matching of the guide vane and impeller need further analyses.

5. Analysis of Internal Flow

The analysis of the internal flow in the pump turbine includes five parts with five different guide vane opening angles. They are defined as the large guide vane opening angle (18 degrees), medium-large guide vane opening angle (16 degrees), medium guide vane opening angle (14 degrees), medium-small guide vane opening angle (12 degrees) and small guide vane opening angle (10 degrees), and are discussed in the following sections.

5.1. Large Guide Vane Opening Angle (18 Degrees)

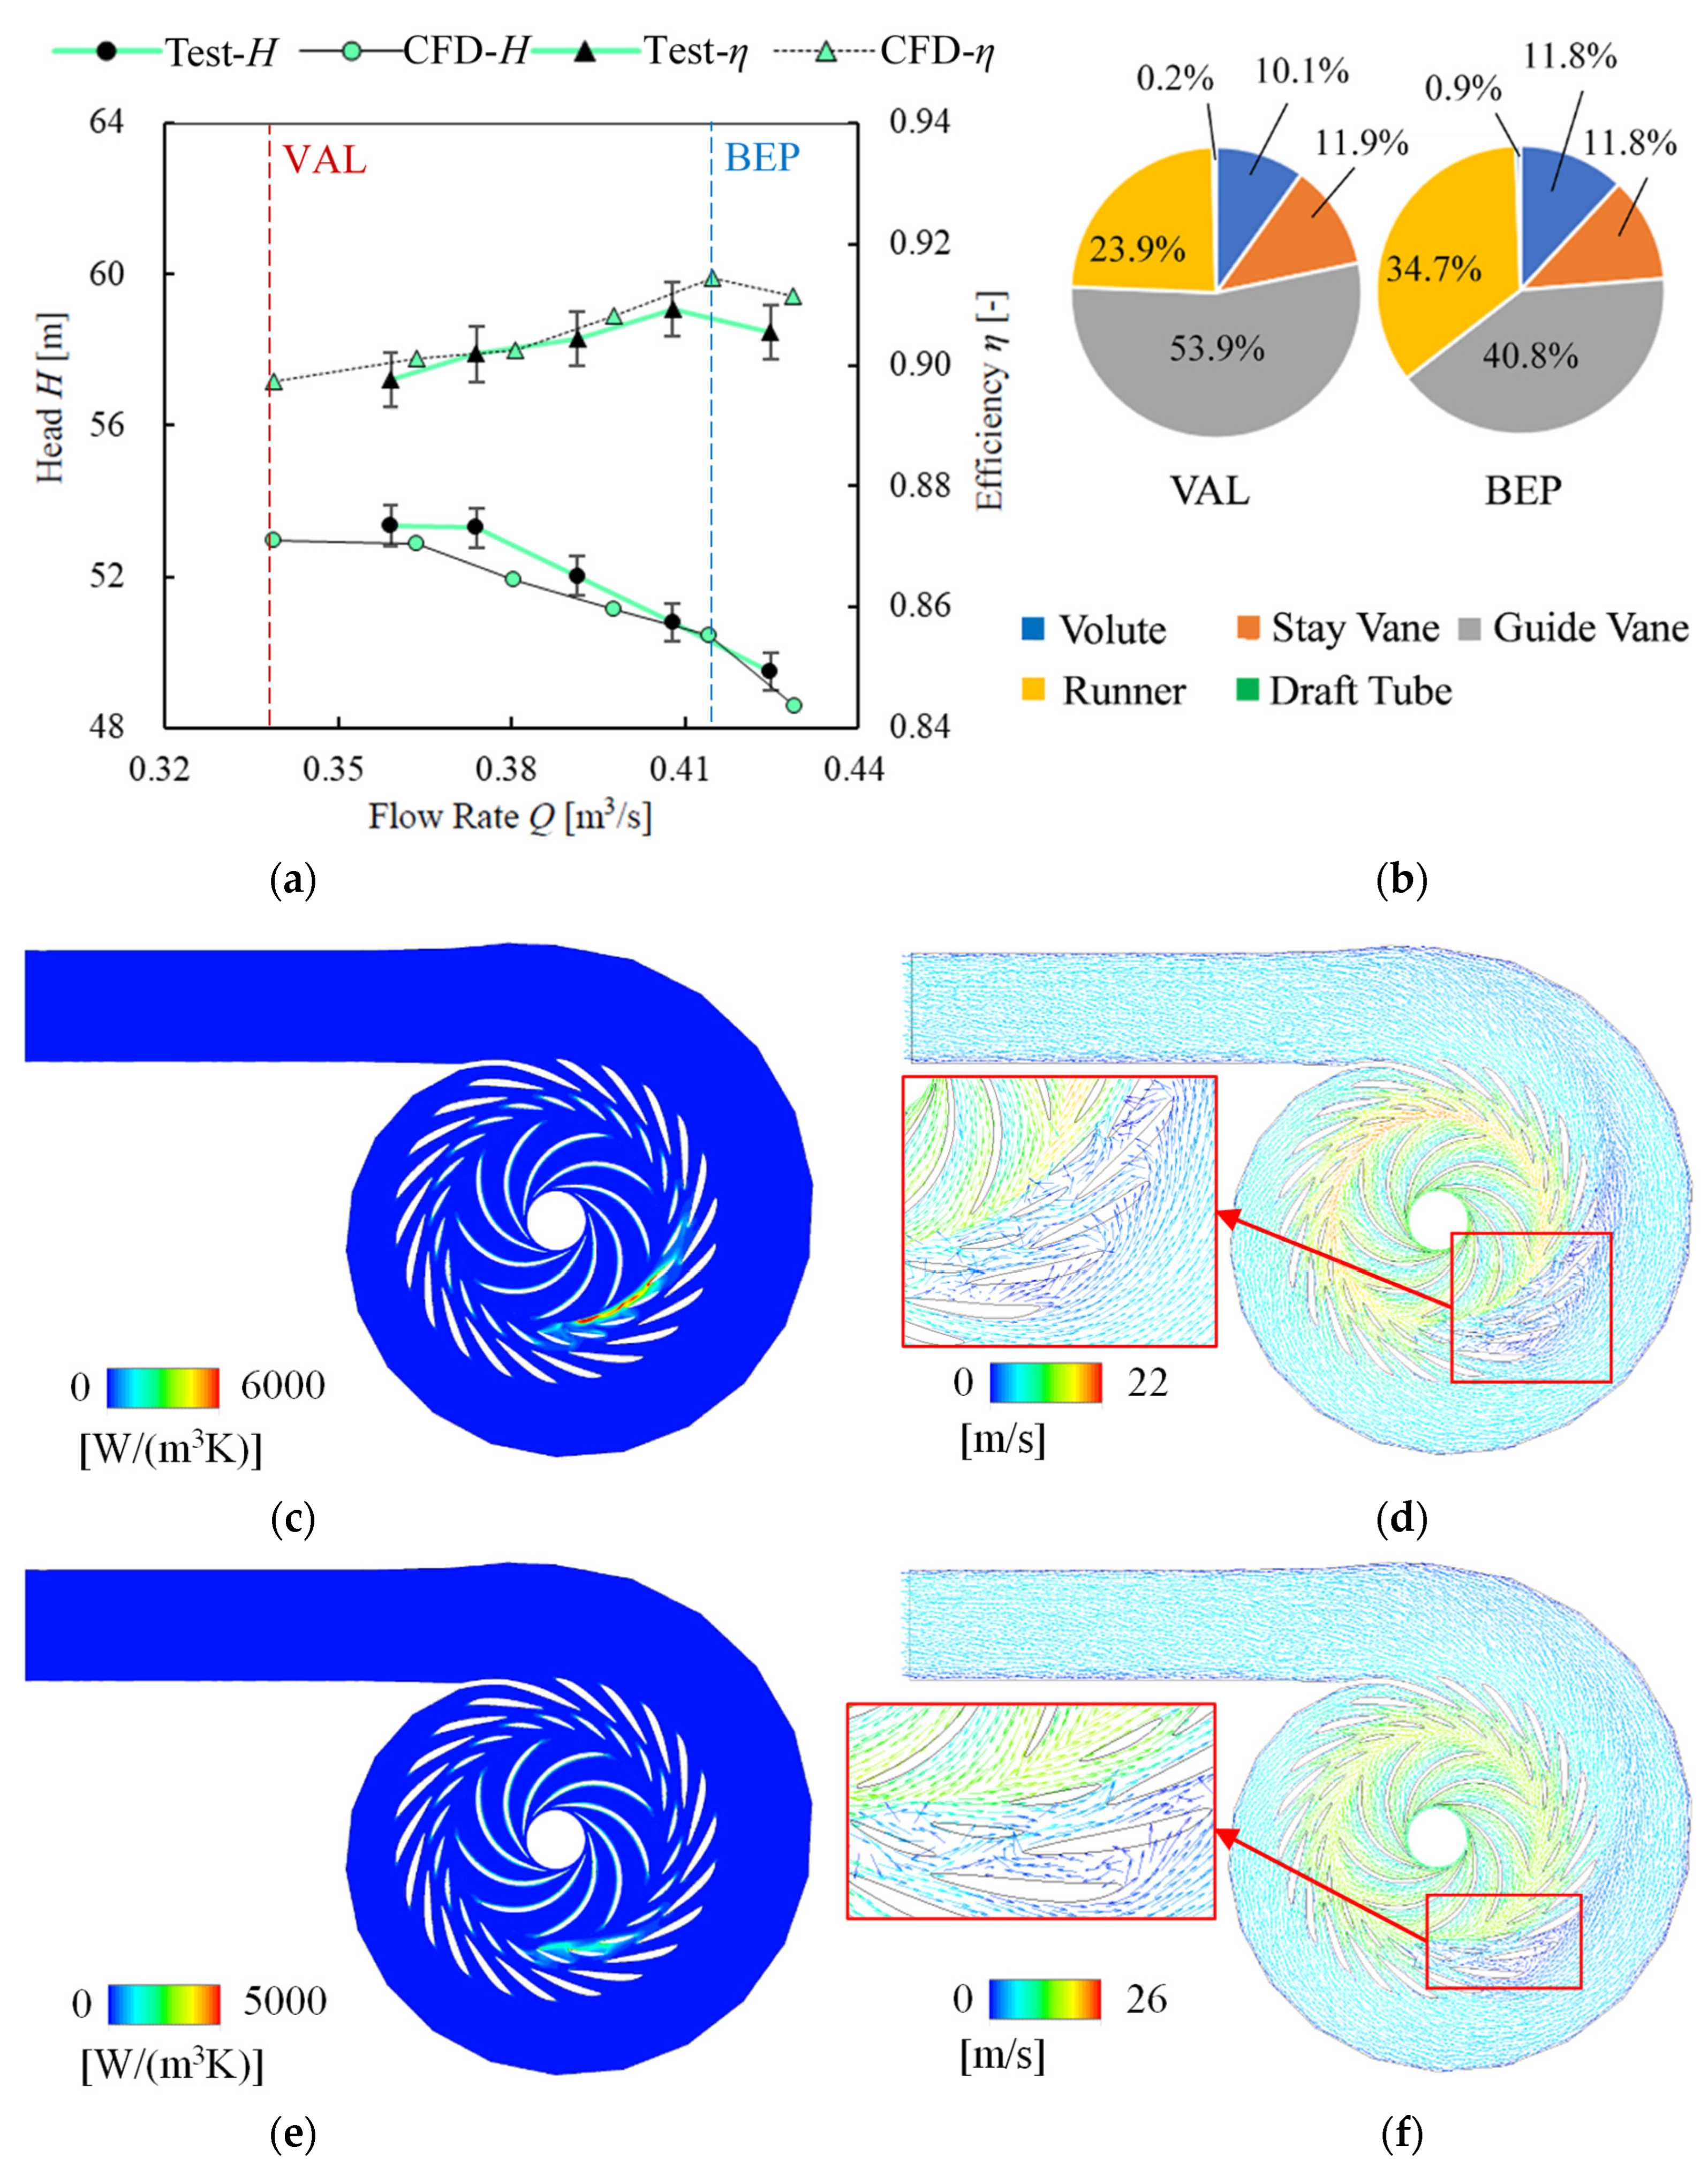
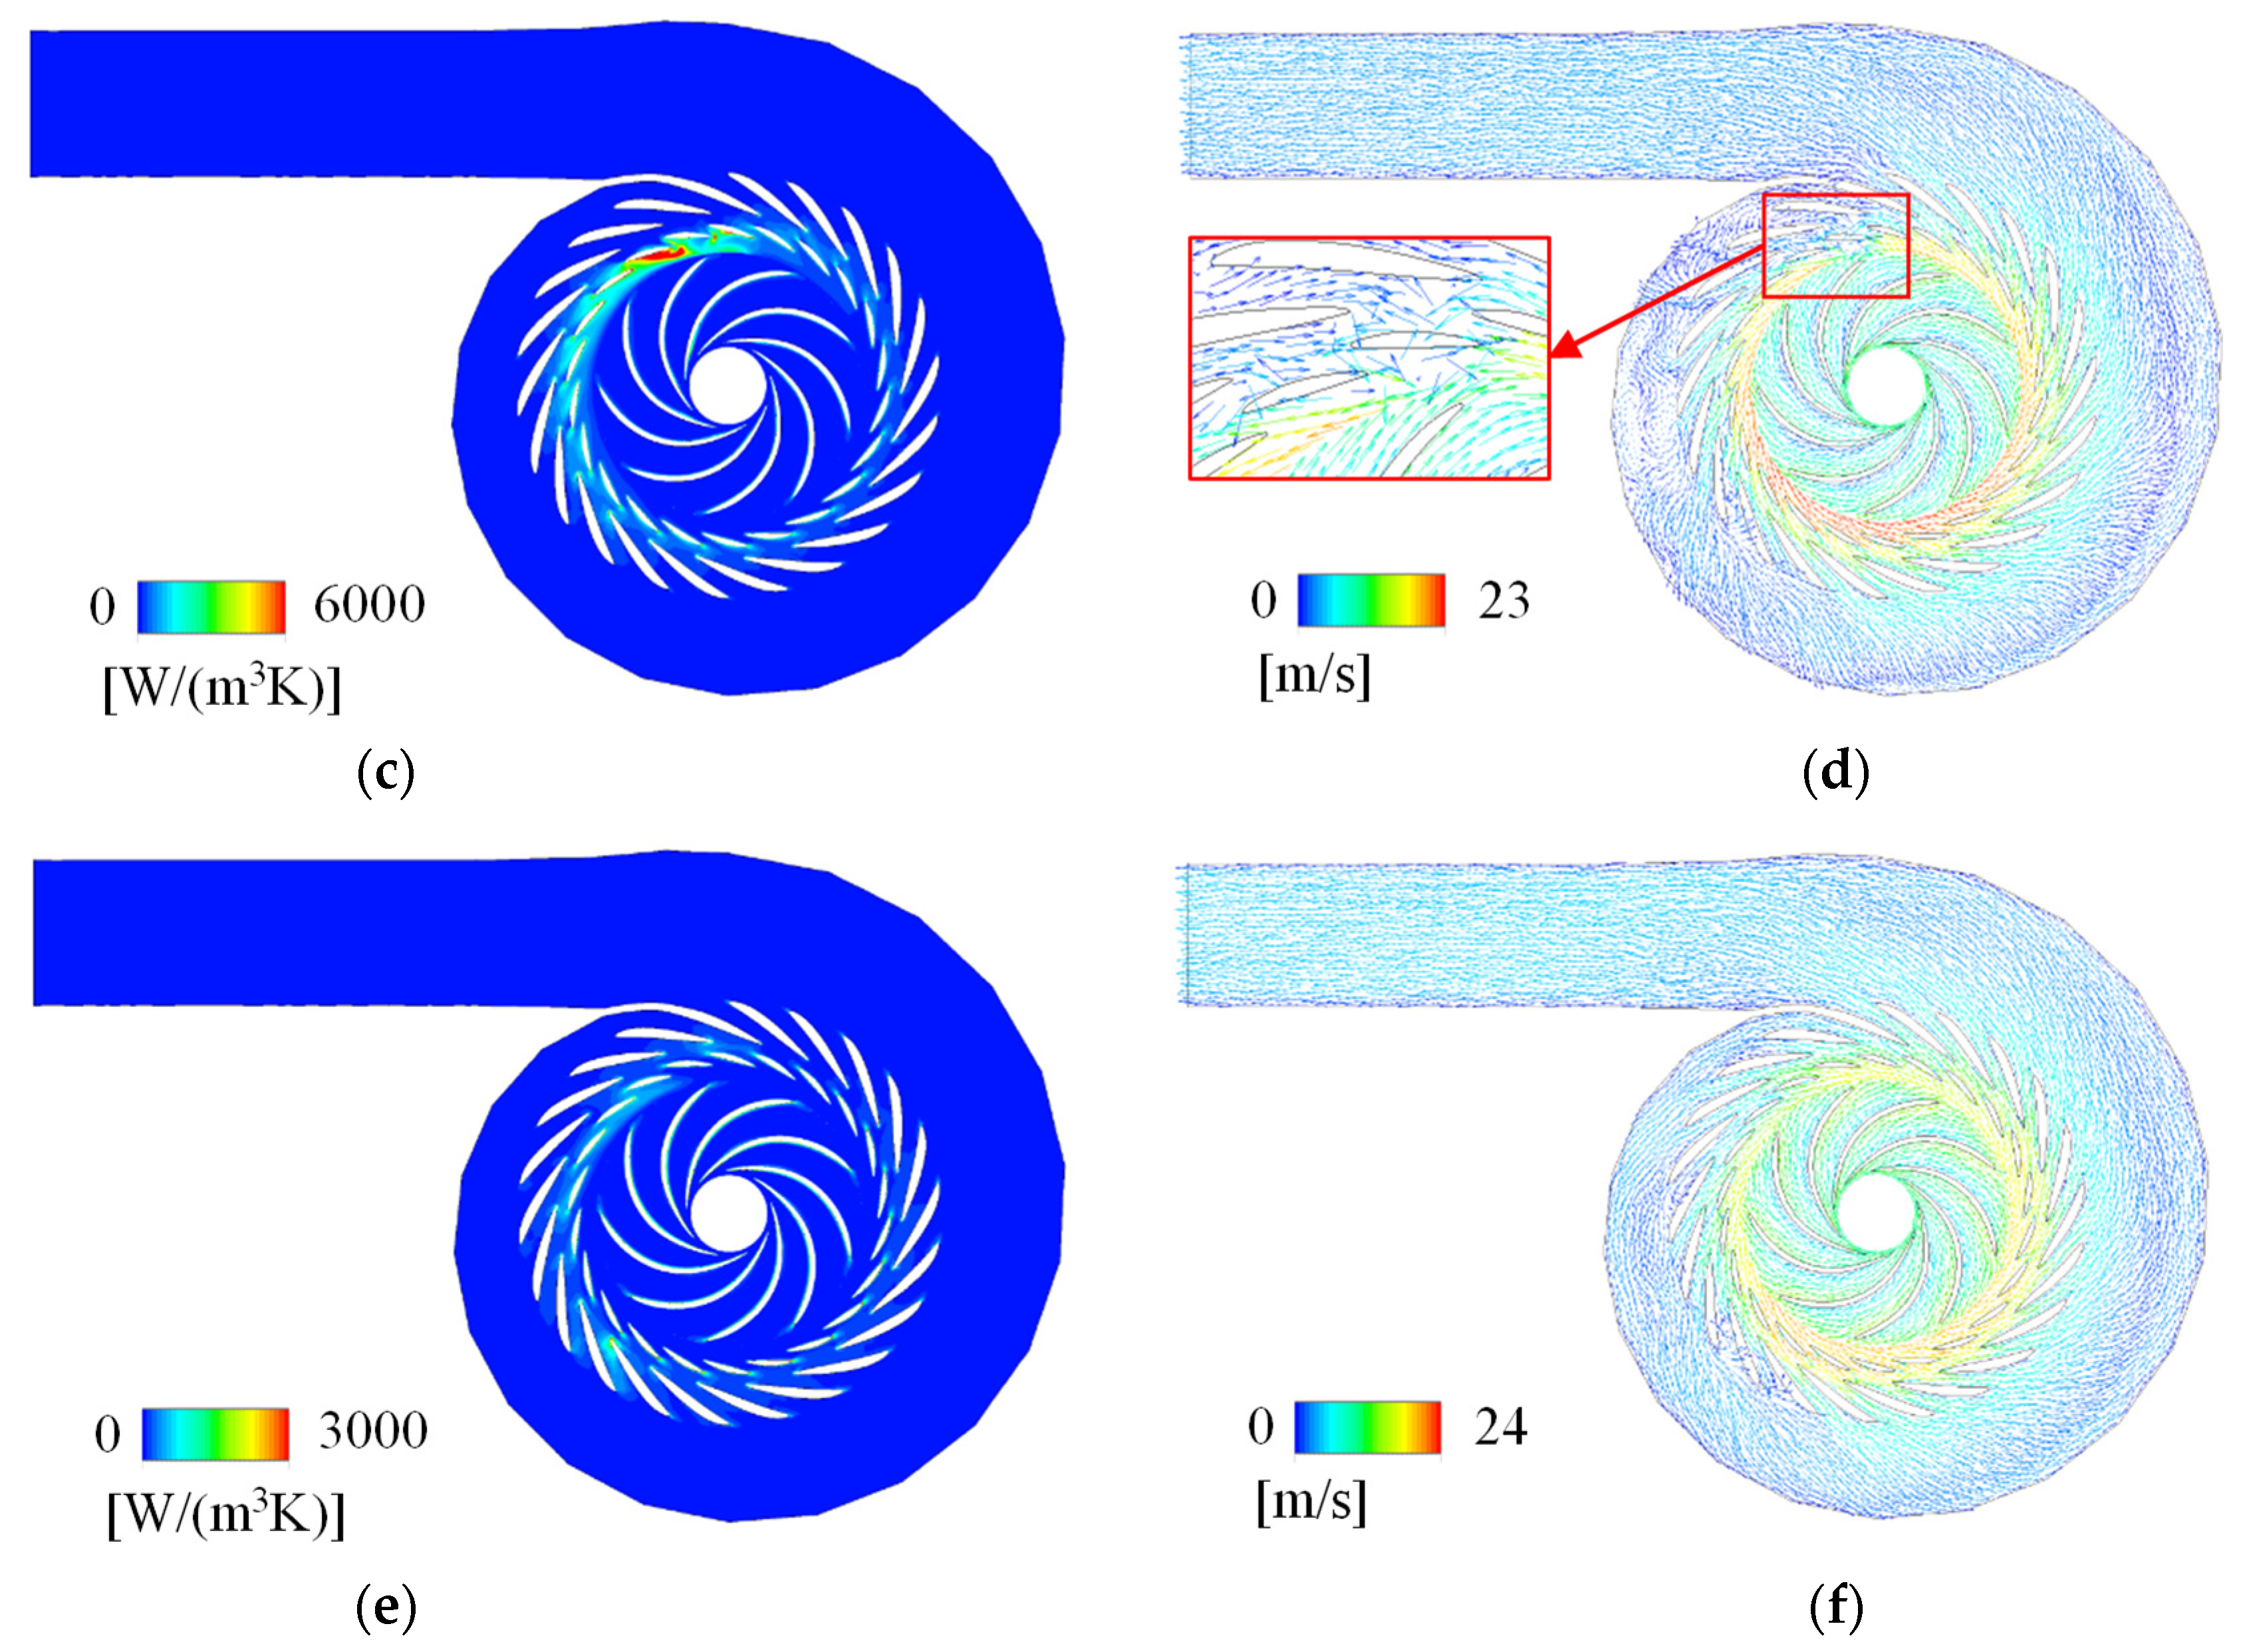
Figure 6 shows the situation of the guide opening angle α of 18 degrees. Figure 6a, respectively, shows the flow–head Q-H and flow–efficiency Q-η Curve, where QBEP is approximately 0.415 m3/s and QVAL is approximately 0.339 m3/s. Through the analysis of the flow energy loss proportion inside the volute, stay vane, guide vane, runner and draft tube as shown in Figure 6b, it is found that, when the flow rate is at the QBEP point, the loss proportion of the guide vane is approximately 40.8%. The loss proportion inside the runner is close to that inside the guide vane. The loss proportion of the stay vane and volute is relatively small. The loss in the draft tube is less than 1%, which is very small. When the flow rate decreased to QVAL, the loss proportion of guide vane increased significantly to 53.9%, which was higher than the sum of other components. It can be seen from the Spro contour and v vectors at the QBEP point that there is only a small amount of guide vane passages with an obvious loss increase, and that the intensity is not high. This is related to the local secondary flow structures. At the QVAL point, there are approximately seven channels of the guide vane with significant loss. The local intensity is very high, which is also related to the secondary flow in the guide vane channels, and it causes the flow blockage in the downstream components.

5.2. Medium-Large Guide Vane Opening Angle (16 Degrees)

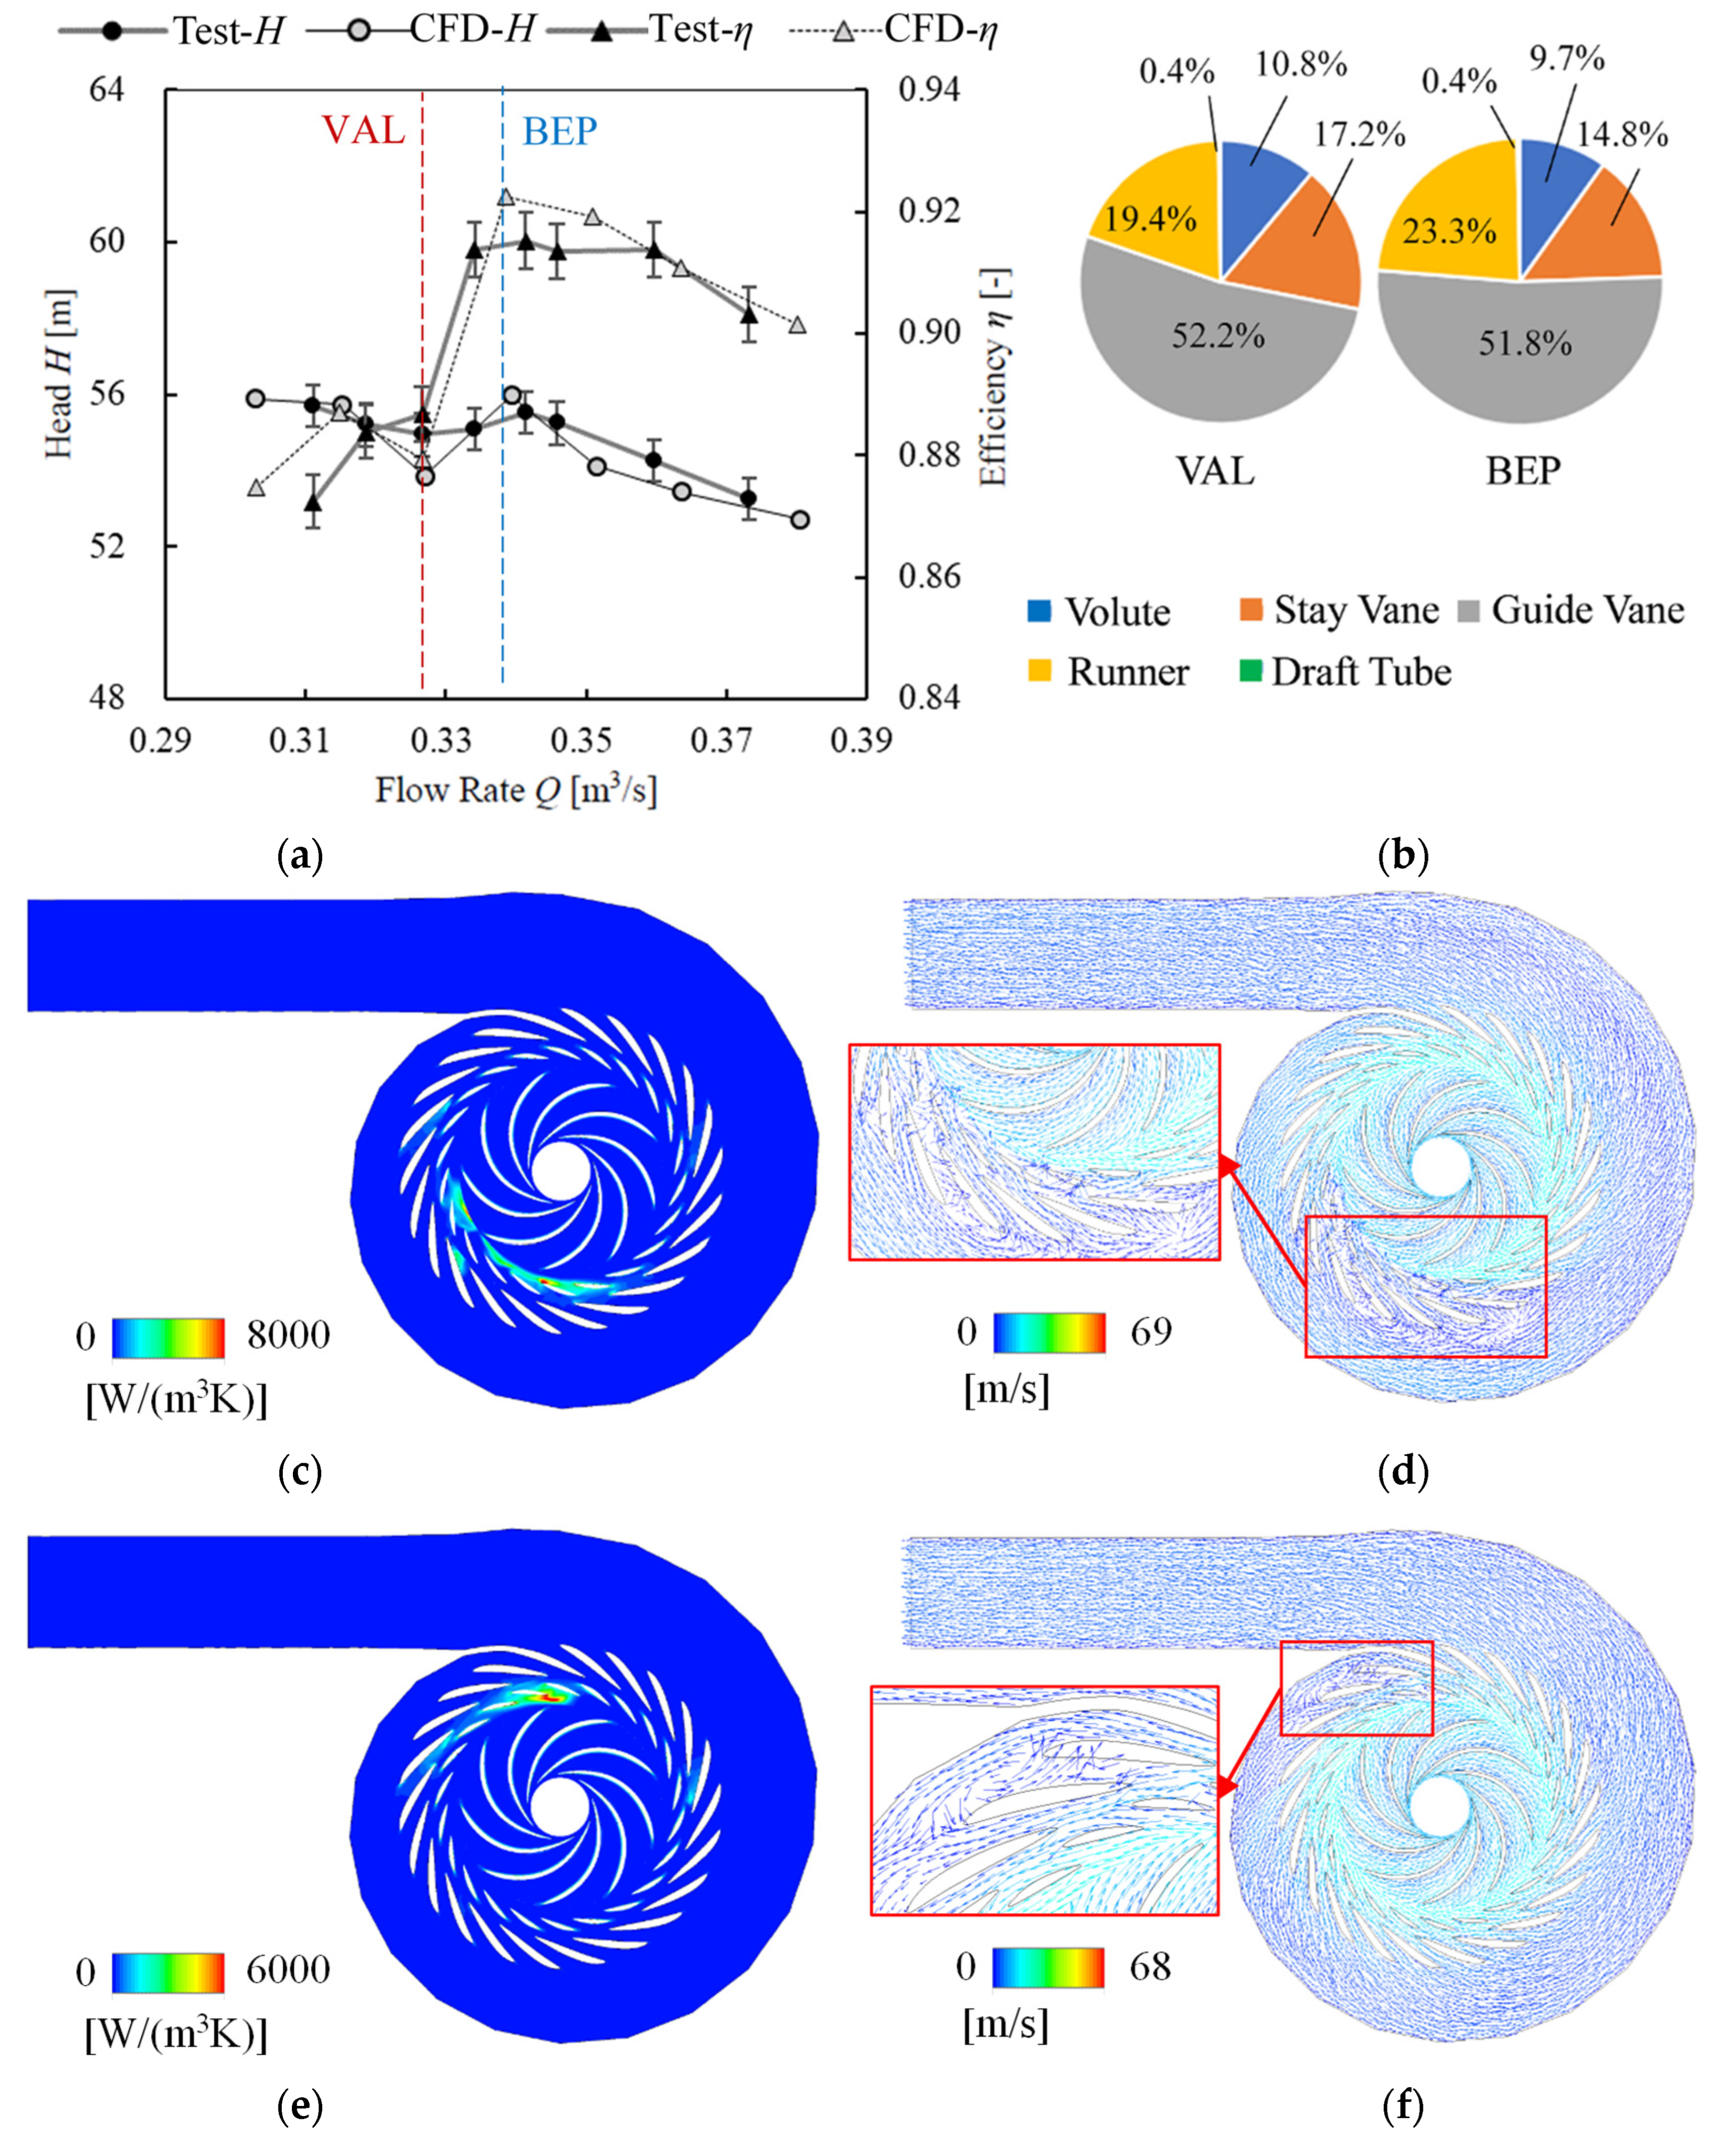
Figure 7 shows the situation of the guide opening angle α of 16 degrees. Figure 7a, respectively, shows the flow–head Q-H and flow–efficiency Q-η curve, where QBEP is approximately 0.339 m3/s and QVAL is approximately 0.327 m3/s. As shown in Figure 7b, it is found that, when the flow rate is at the QBEP point, the loss proportion of the guide vane is approximately 51.8%, which is the largest. The loss proportion inside the runner is the second largest. The loss proportion of the stay vane and volute is smaller. The loss in the draft tube is also less than 1%, which is very small. When the flow rate decreased to QVAL, the loss proportion of the guide vane became 52.2%, which was almost unchanged. It can be seen from the Spro contour and v vectors at the QBEP point and QVAL point that secondary flow structures are found in guide vane channels. Flow blockage in the downstream components can be also observed. Based on the comparison between the QBEP point and QVAL point, the intensity of the flow energy loss at the QVAL point is much stronger. This is why head H drops suddenly.

5.3. Medium Guide Vane Opening Angle (14 Degrees)

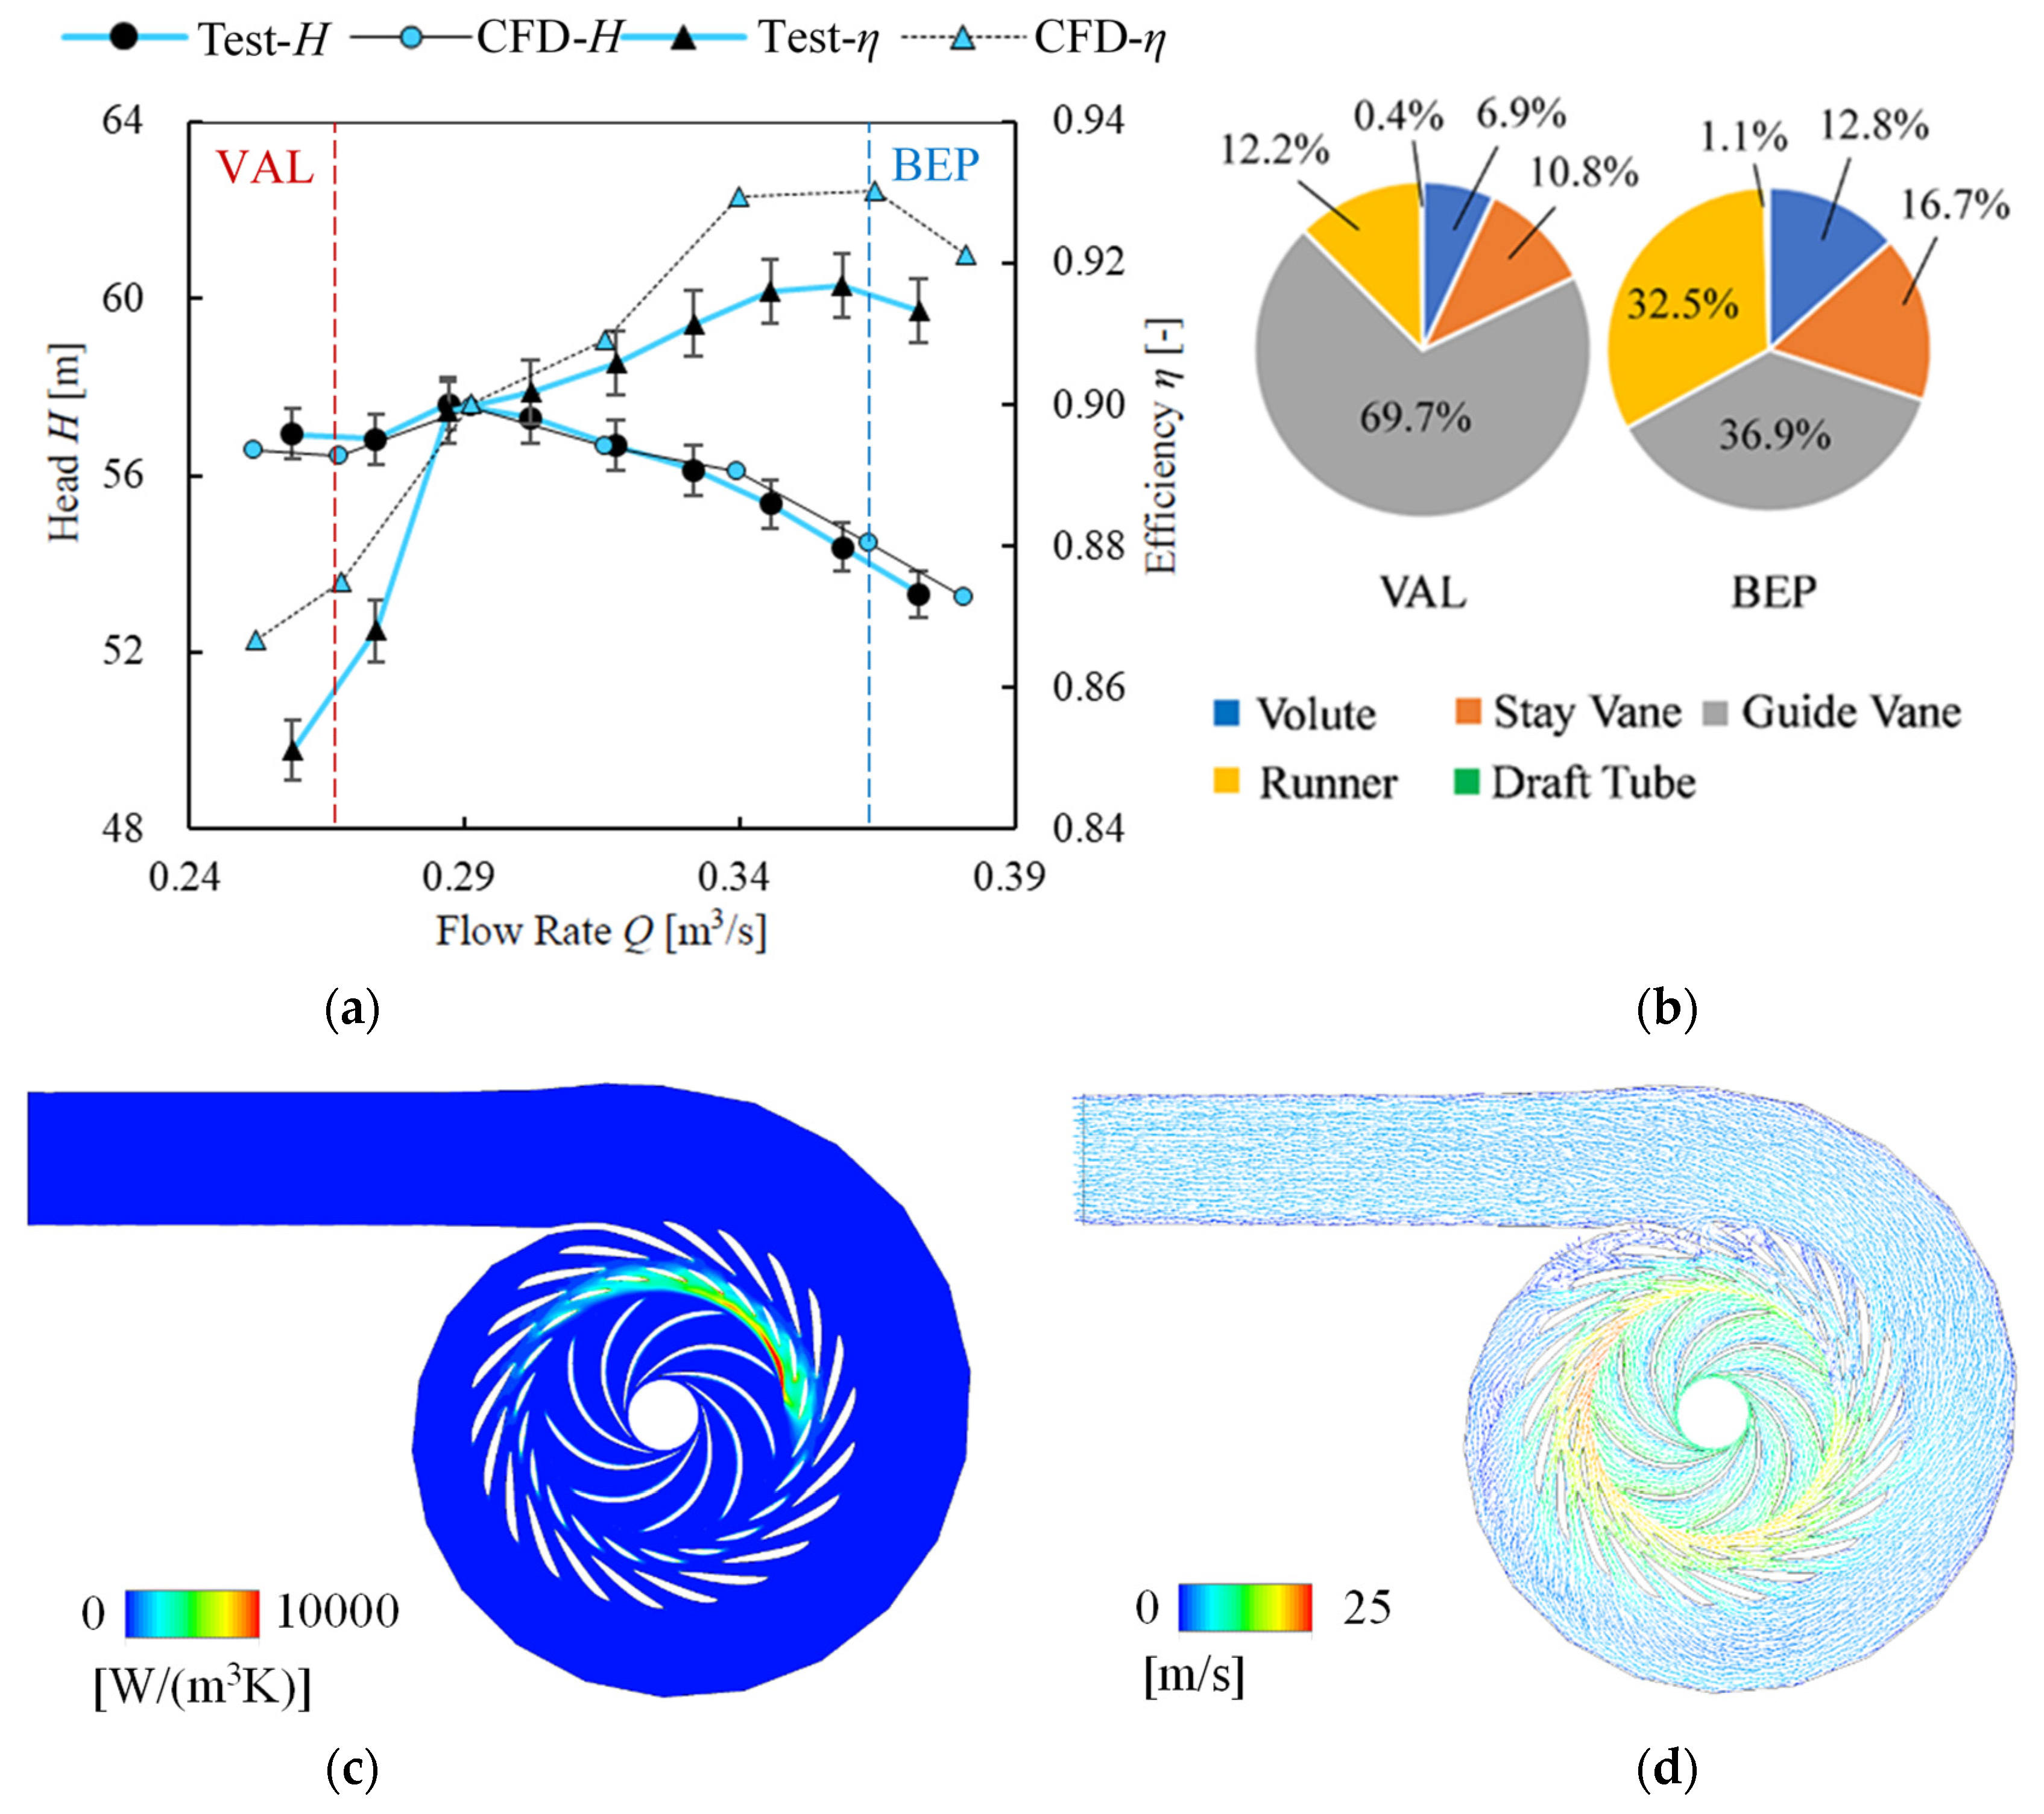
Figure 8 shows the situation of the guide opening angle α of 14 degrees. Figure 8a, respectively, shows the flow–head Q-H and flow–efficiency Q-η curve, where QBEP is approximately 0.363 m3/s and QVAL is approximately 0.267 m3/s. As shown in Figure 8b, it is found that when the flow rate is at the QBEP point, the loss proportion of the guide vane is approximately 36.9%. The loss proportion inside the runner is close to that inside the guide vane. The loss proportion of the stay vane and volute is smaller than that in the runner and guide vane. The loss in the draft tube is still much smaller. When the flow rate decreased to QVAL, the loss proportion of the guide vane increased significantly to 69.7%, which was higher than the sum of other components. The proportion of loss in the runner becomes lower. It can be seen from the Spro contour and v vectors at the QBEP point that only few guide vane passages have a relatively strong energy loss and that the intensity is not that high. At the QVAL point, there are approximately eight channels of the guide vane with a significant flow energy loss with very high intensity. The sudden increase in Spro also indicates the mismatching of the guide vane and runner incoming flow. The bad flow regime will cause flow blockage in the stay vane and volute.

5.4. Medium-Small Guide Vane Opening Angle (12 Degrees)

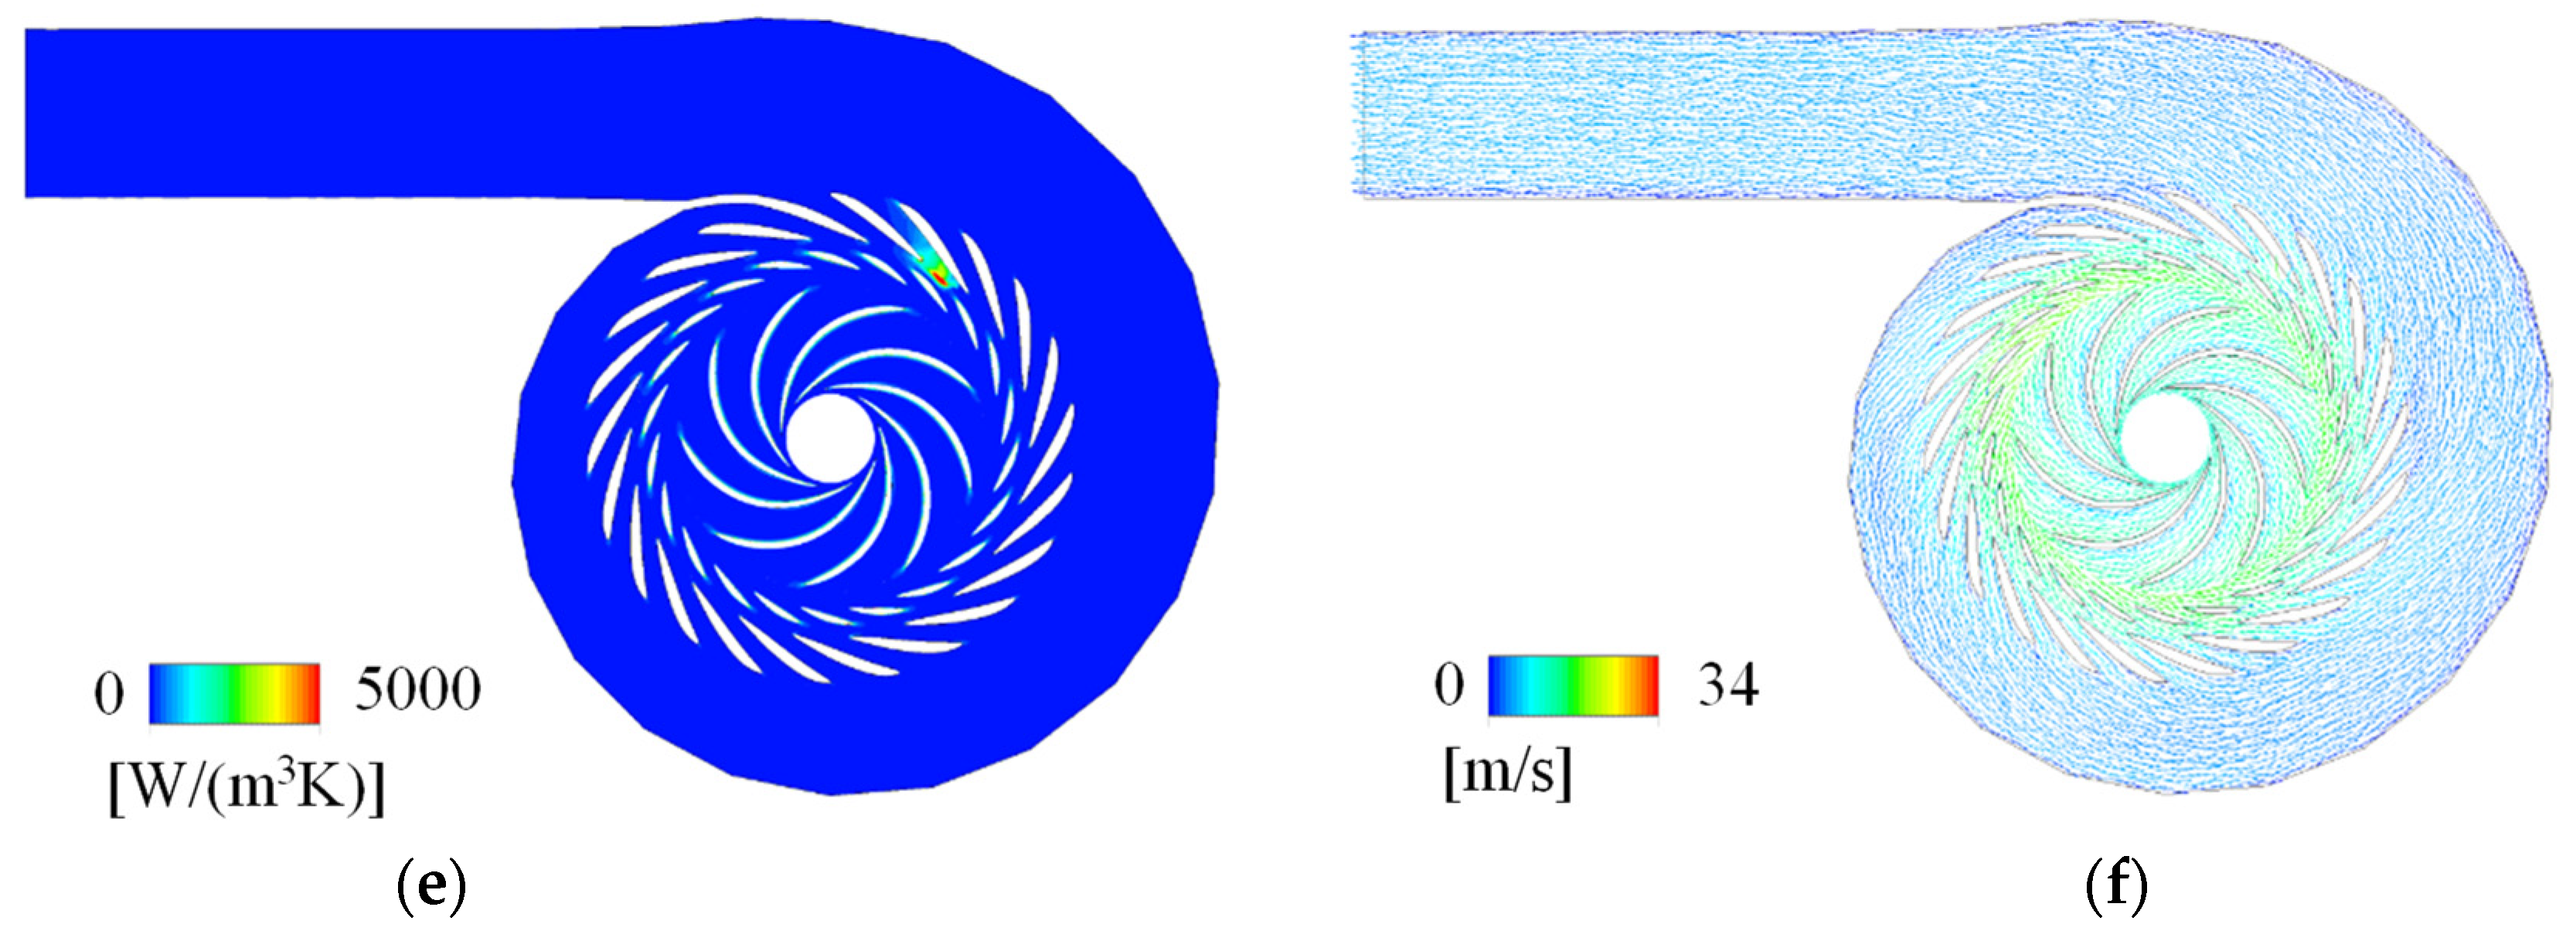
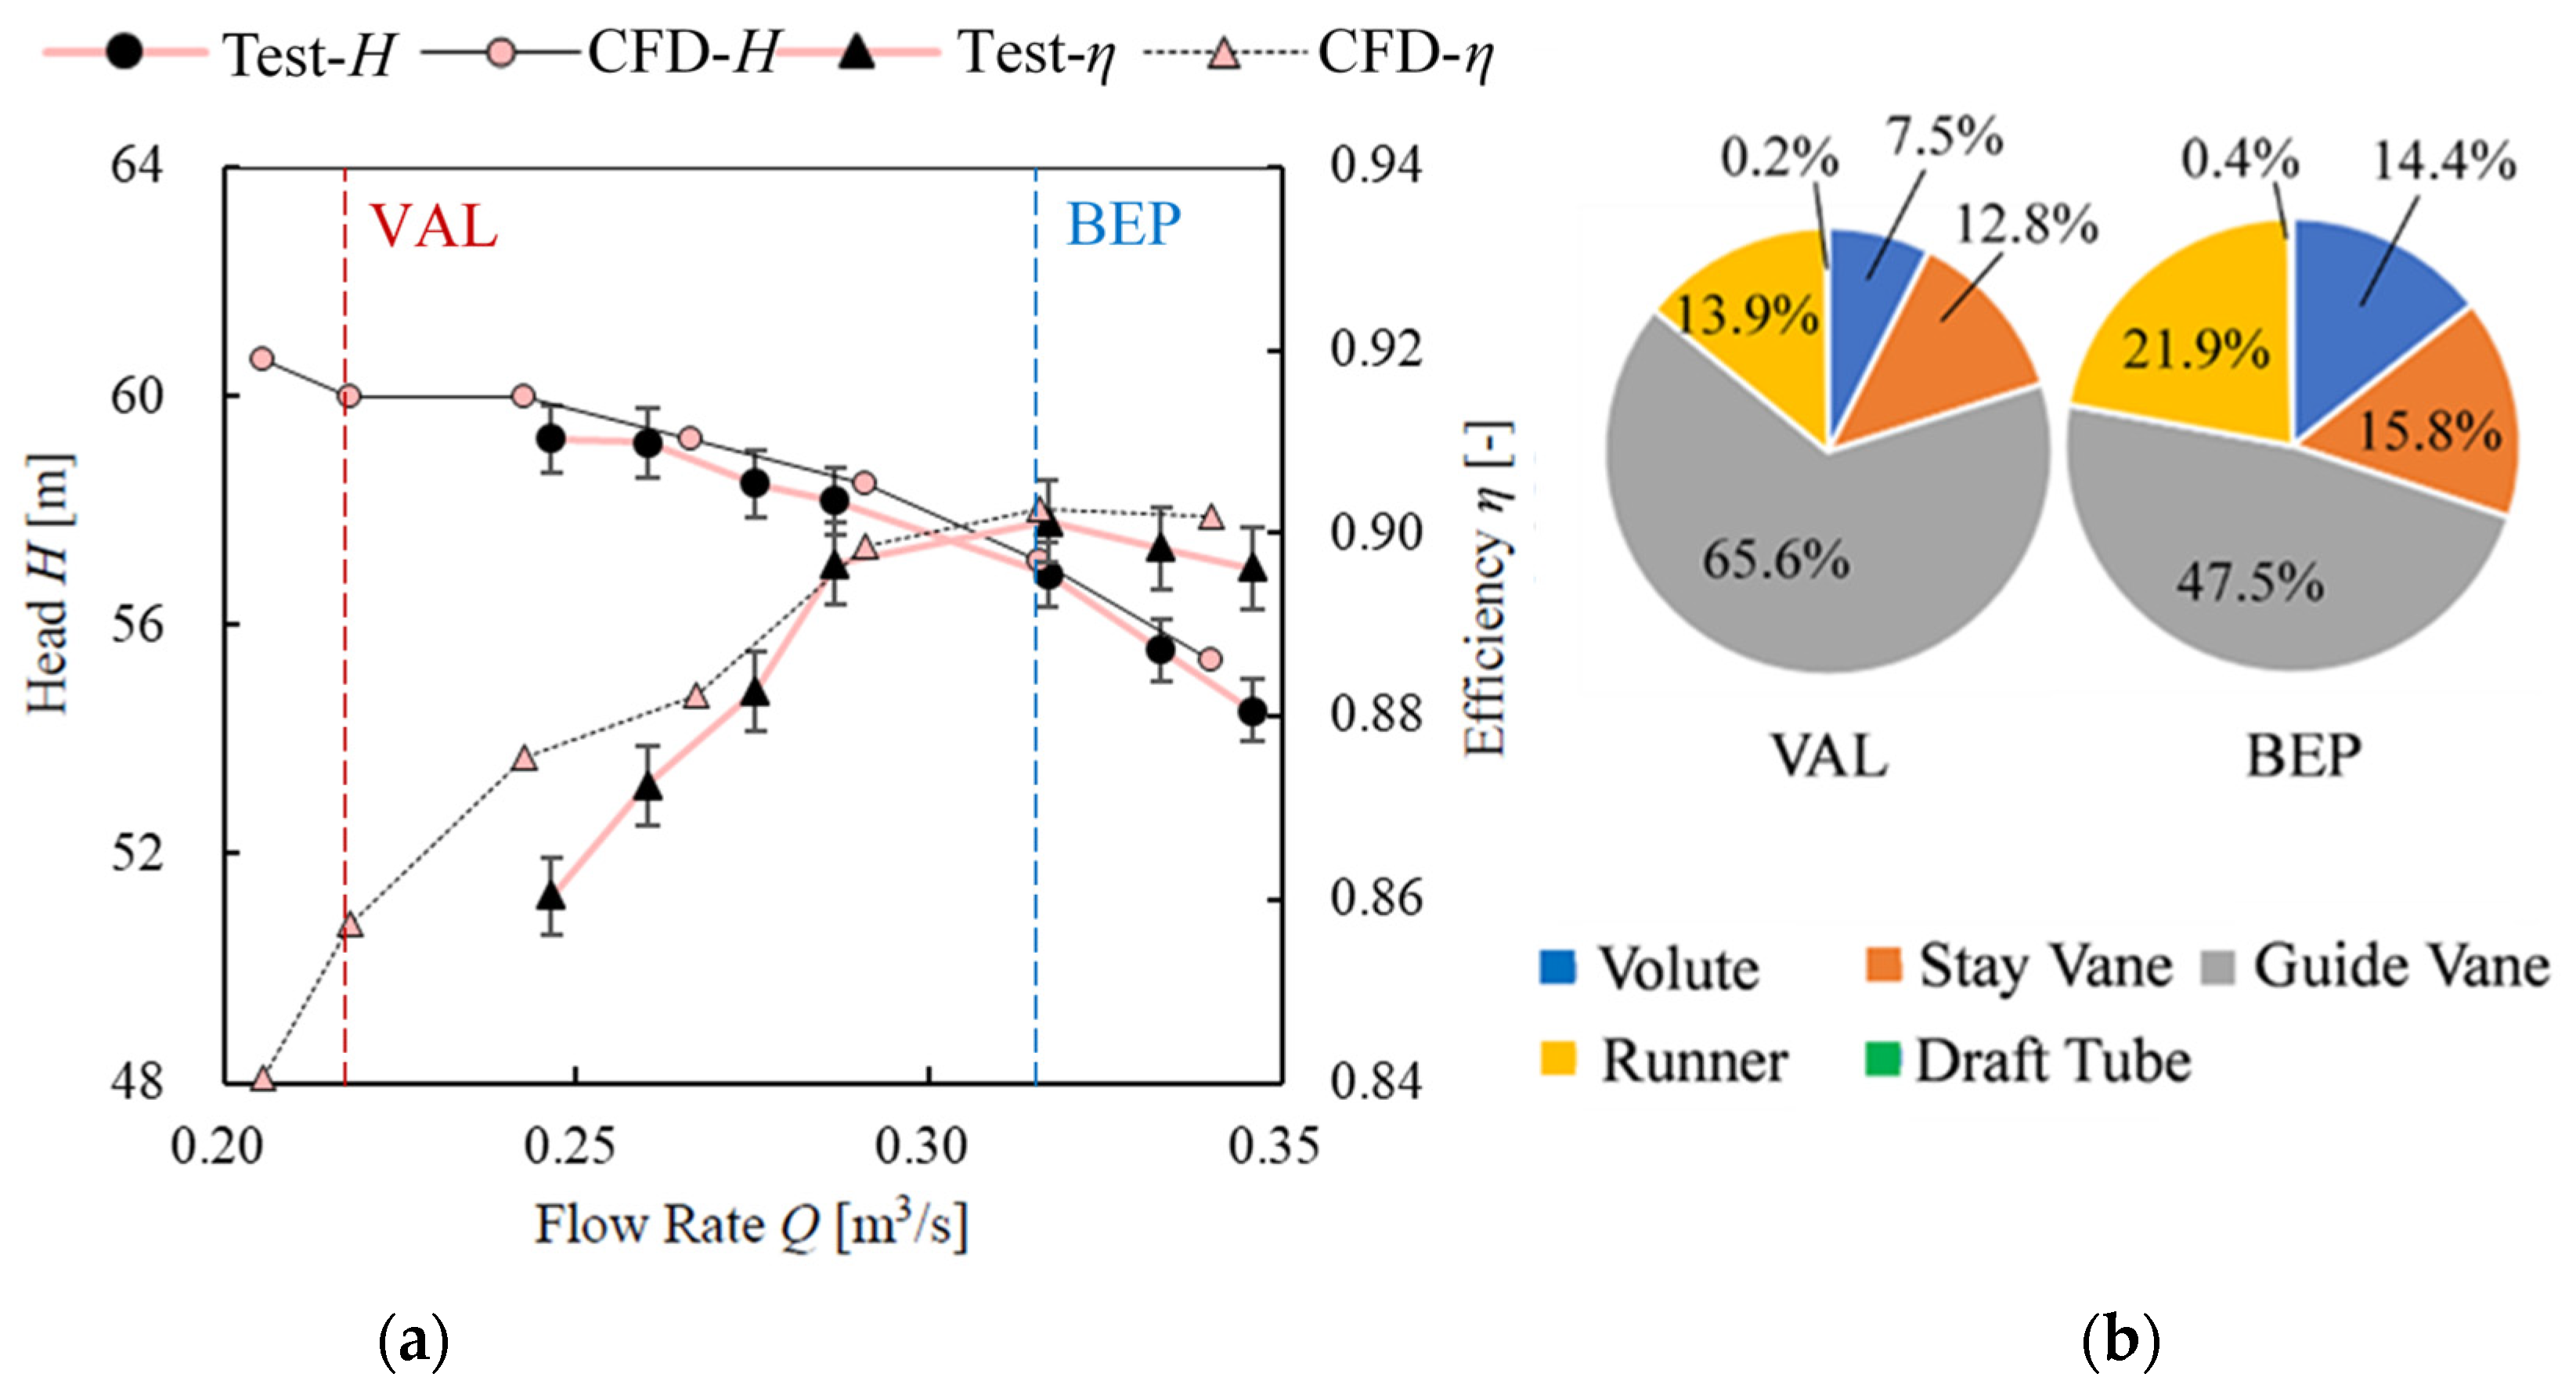
Figure 9 shows the situation of the guide opening angle α of 12 degrees. Figure 9a, respectively, shows the flow–head Q-H and flow–efficiency Q-η curve, where QBEP is approximately 0.315 m3/s and QVAL is approximately 0.219 m3/s. As shown in Figure 9b, it is found that, when the flow rate is at the QBEP point, the loss proportion of the guide vane is approximately 47.5%, which is the largest. The loss proportion inside the runner, stay vane and volute is similar. The loss in the draft tube is still less than 1%. When the flow rate decreased to QVAL, the loss proportion of the guide vane increased significantly to 65.6%, which was higher than the sum of other components. The proportion of loss in the volute becomes obviously lower. It can be seen from the Spro contour and v vectors at the QBEP point that the loss is relatively low and the flow regime is smooth in all of the guide vane channels. At the QVAL point, some guide vane channels have a high flow energy loss with a high intensity. This is related to the secondary flow in the guide vane, and the downstream components are influenced.

5.5. Small Guide Vane Opening Angle (10 Degrees)

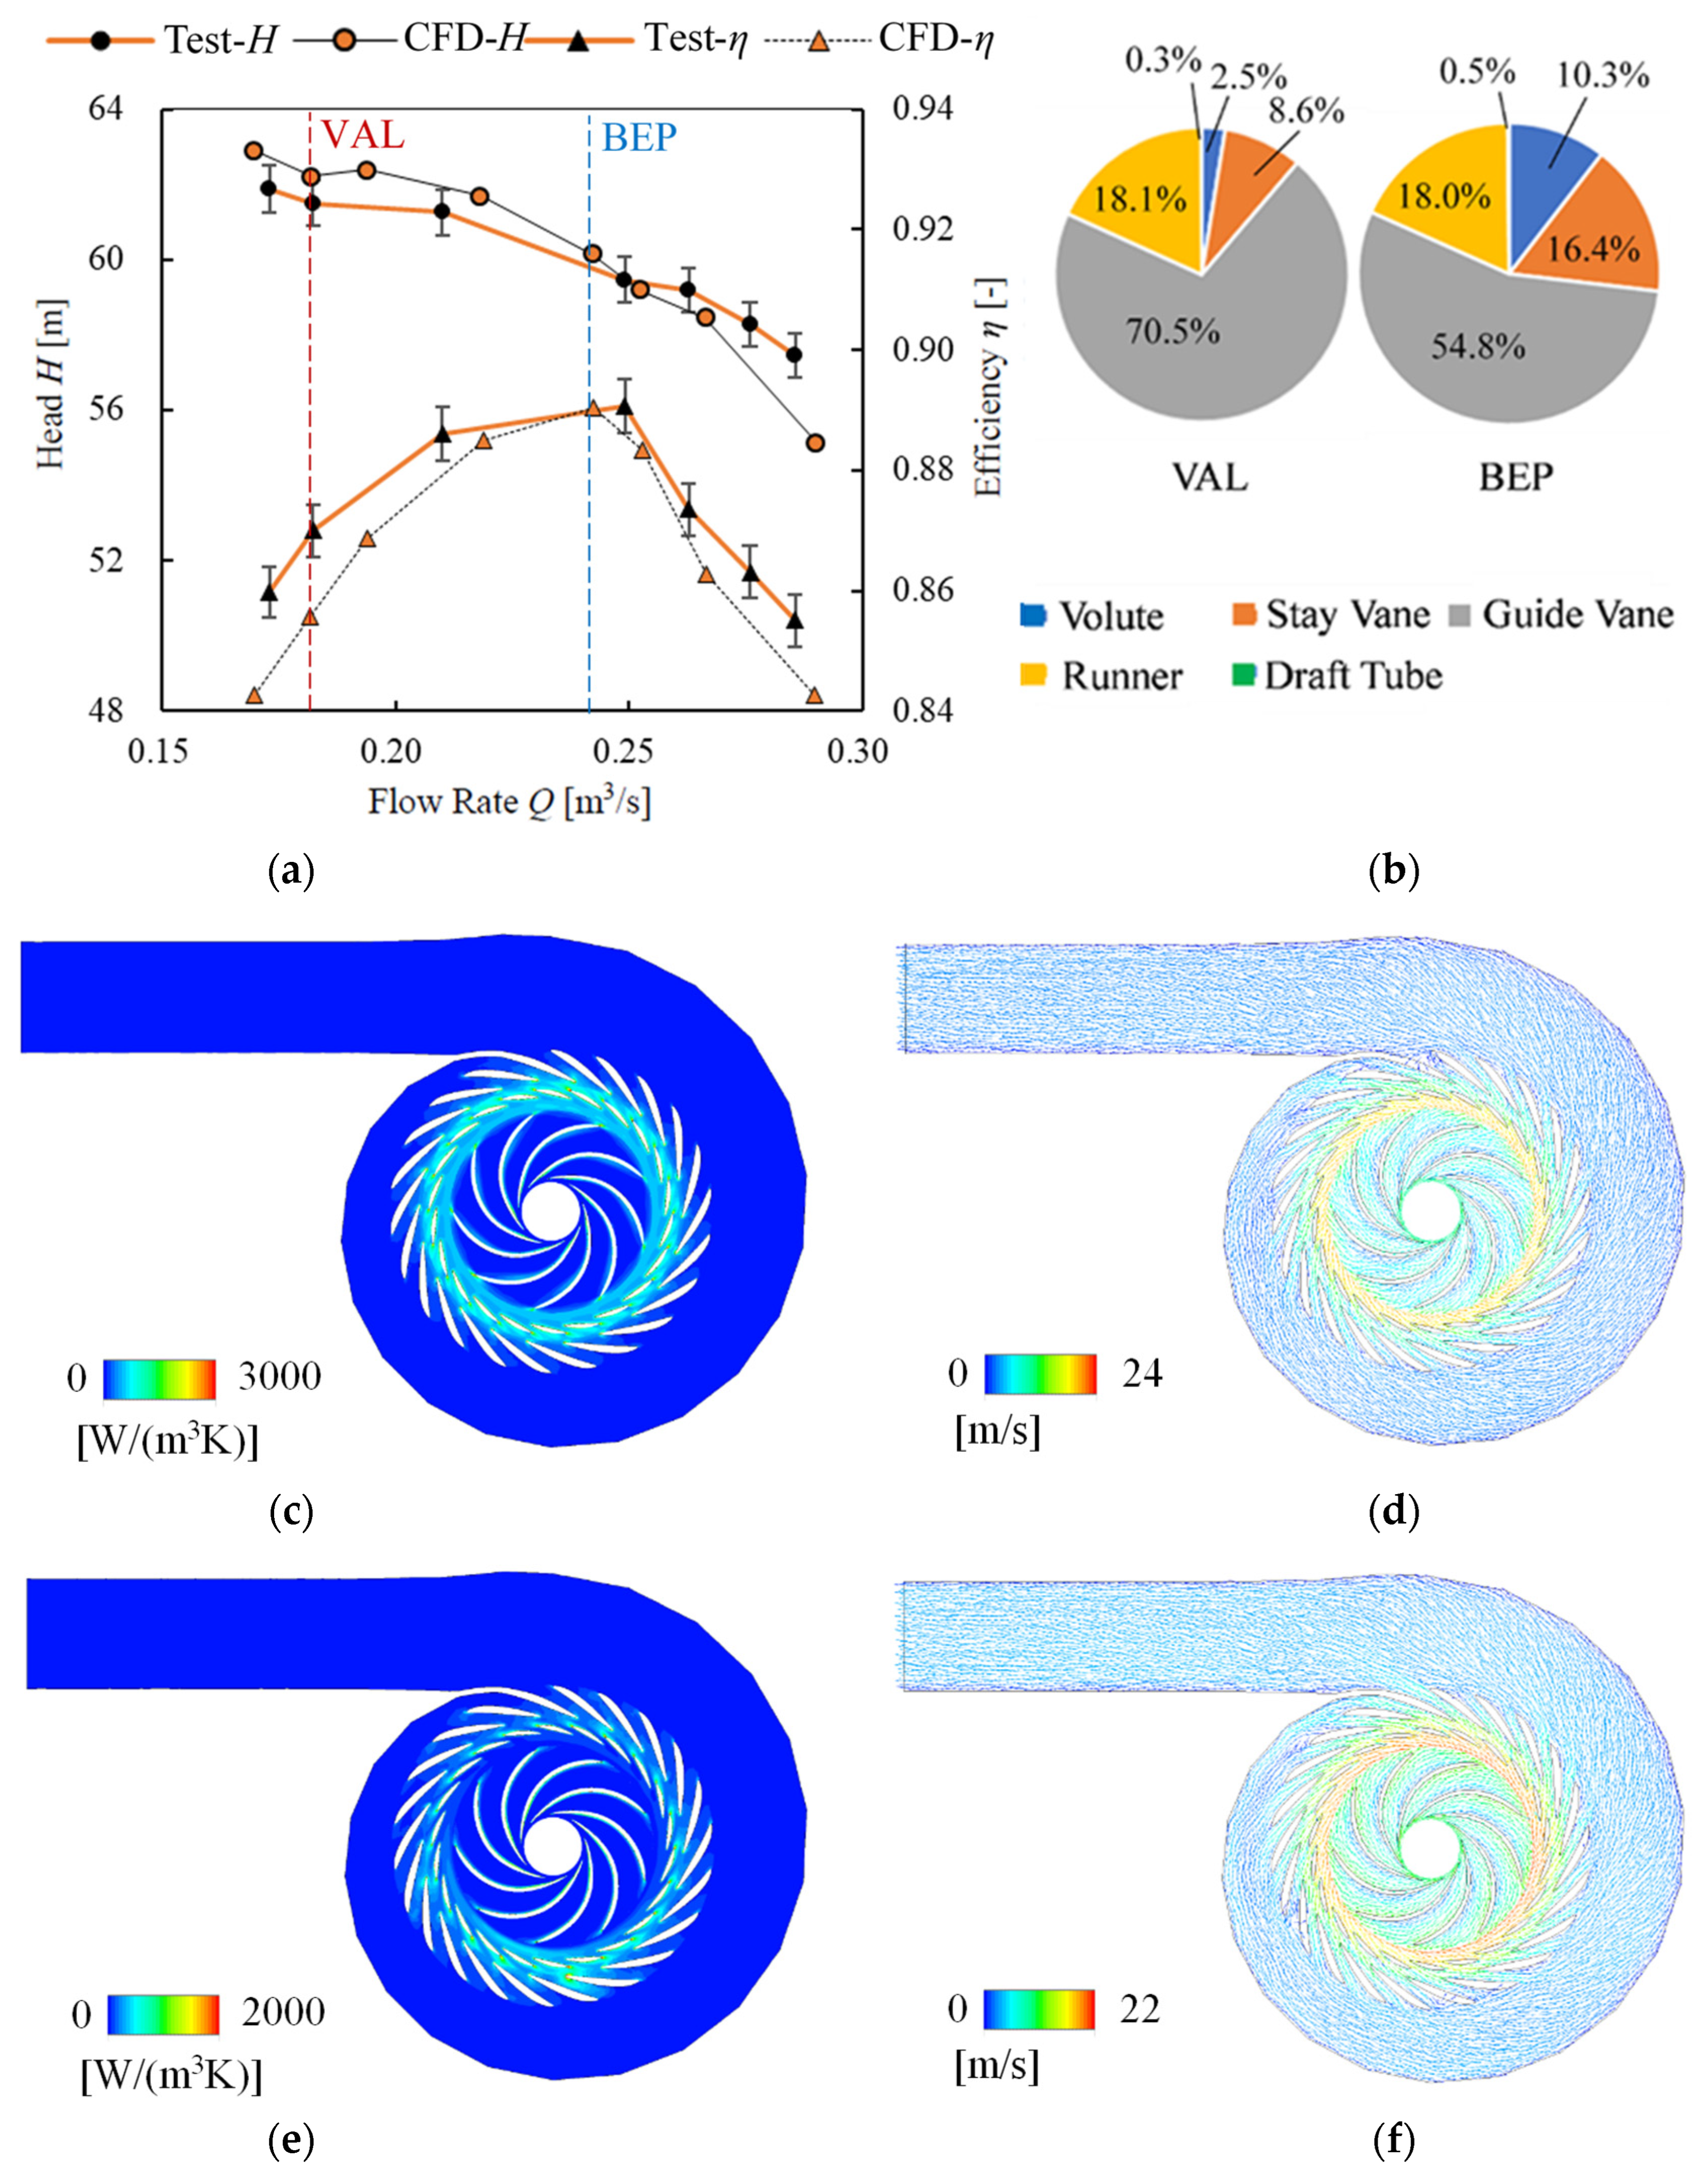
Figure 10 shows the situation of the guide opening angle α of 10 degrees. Figure 10a, respectively, shows the flow–head Q-H and flow–efficiency Q-η curve, where QBEP is approximately 0.243 m3/s and QVAL is approximately 0.183 m3/s. As shown in Figure 10b, it is found that, when the flow rate is at the QBEP point, the loss proportion of the guide vane is approximately 54.8%, which is the largest. The loss proportion inside the runner and stay vane is similar and lower than that in the guide vane. The loss in the volute is much lower. The loss in the draft tube is less than 1%, which is very low. When the flow rate decreased to QVAL, the loss proportion of the guide vane increased significantly to 70.5%, which was higher than the sum of other components and completely dominant. The proportion of loss in the stay vane and volute becomes obviously lower. It can be seen from the Spro contour and v vectors at QBEP point that the loss is relatively low and the flow regime is smooth in all of the guide vane channels. At the QVAL point, the flow regime in the guide vane becomes bad and causes an increase in the flow energy loss.

6. Discussion

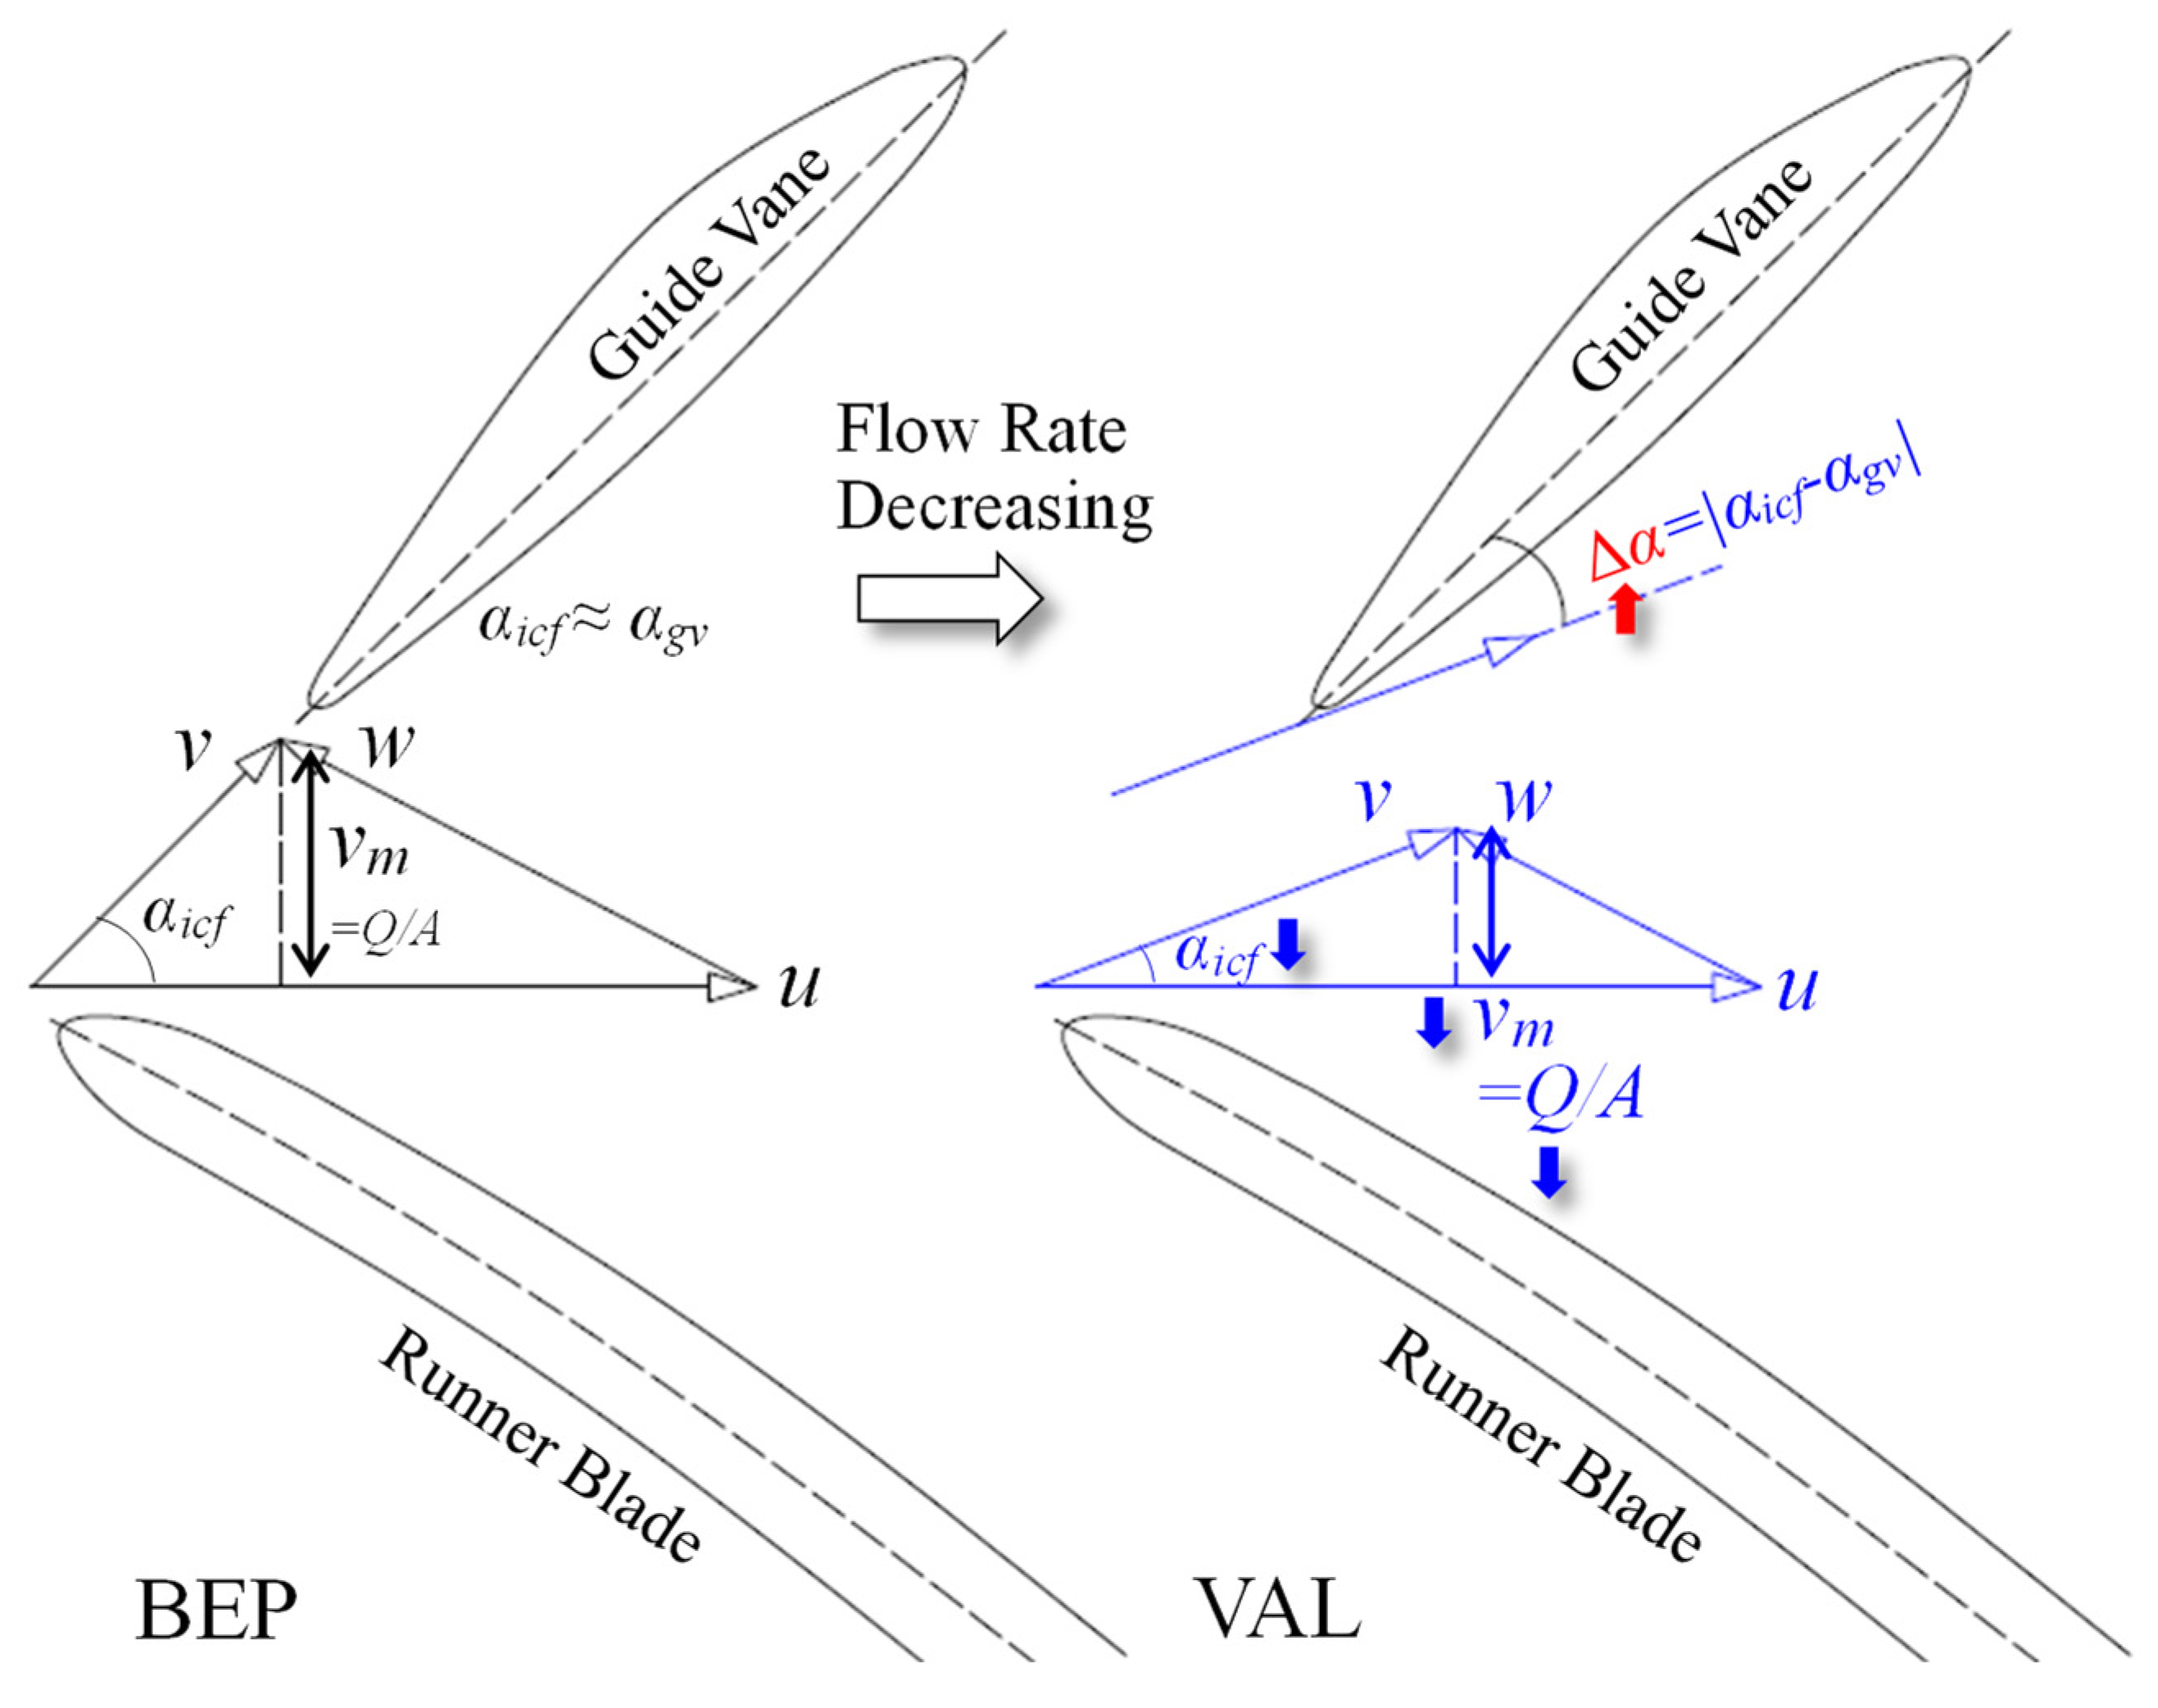
The stagnation and drop in head H with the decrease in flow rate Q is related to the mismatching of the guide vane flow angle. In order to have a better understanding of this mis-matching, Figure 11 is schematically drawn with two conditions of QBEP and QVAL. The most important change from the QBEP point to QVAL point is the decrease in the flow rate.
The most important analysis method of turbomachinery is the velocity triangle analysis. If we draw the velocity triangle at the runner trailing-edge in pump mode, the rotational linear velocity u can be determined at a specific rotational speed. The direction of relative velocity w can be determined because the runner blade is fixed. The meridional component of absolute velocity vm can be calculated by [32]:
v m = Q A
where A is the flow passing area where vm is analyzed.
When the flow rate is QBEP, which represents a good flow condition, the absolute flow angle between the runner and guide vane, defined as αicf, will be almost equal to the guide vane installation angle αgv. When the flow rate Q decreases, vm will become smaller. Because the direction of w is almost unchanged, αicf will be smaller, as indicated. The absolute difference Δα between αgv and αicf can be defined as:
Δ α = | α i c f α g v |
Therefore, Δα will be larger. This means that the good matching between the flow angle and guide vane installation angle will be broken when the flow rate decreases. If this mismatching becomes strong, the flow regime in guide vane channels will be very bad, leading to a ‘stall’ situation. This is why the stagnation of and drop in head H occur. This mis-matching will also occur when the flow rate increases. This is why the efficiency curve has an optimal region. For the large flow rate conditions, there is no positive Q-H slope problem.
In addition, the slip phenomenon of the blade channel caused by the blade number limitation will also make the originally estimated incoming flow direction upstream to the guide vane deflect to some extent. This phenomenon is not the same in different turbomachinery [33]. It will be strong in a pump turbine and will cause a change in velocity triangle components. As for the effect of the slip phenomenon on the Q-H instability of the pump turbine, we will pay special attention to it in future research. In general, the mismatching of the guide vane flow angle is especially important in small flow rate conditions, which is extremely off-design.

7. Conclusions

In this study, the flow energy loss and Q-H stability in a reversible pump turbine in pump mode was discussed for five different guide vane opening angles. These opening angle conditions cover the main conditions during daily operation in pump mode. The mismatching of the guide vane and runner incoming flow will induce an increase in flow energy loss in the guide vane and downstream components. It will cause a drop in head H and instability in the Q-H relationship. This situation occurs at both the large guide vane opening and small guide vane opening. With a decrease in the flow rate, the angle difference between the runner outlet flow and guide vane becomes bigger and bigger in order to generate the positive slope Q-H region. If this positive slope region overlaps a specific head, the operation stability will be influenced.
In the current pump turbine operation, the selection of the on-cam operation curve depends on the judgment of the high-efficiency envelop. However, the Q-H unstable region of the pump turbine in pump mode is also very important. As discussed in this study, if only considering high efficiency, the unit may face the risk of an unstable operation. Based on the research results of this paper, we can determine a scheme of selecting the on-cam envelop curve that takes into account both efficiency and stability without changing the hydraulic design. Our future research will compare and discuss the advantages and disadvantages of the selection of the on-cam operation scheme.
Generally, this study provides a reference for the solution of engineering problems, mainly serving the stable operation of the unit. This study is of great significance for the technical improvement in large-capacity medium and high head pumped storage power stations.

Author Contributions

Methodology, Z.W.; software, W.Y.; validation, R.T.; formal analysis, W.Y.; investigation, D.Z.; resources, W.Y.; writing—original draft preparation, W.Y.; writing—review and editing, R.T.; visualization, D.Z.; supervision, Z.W.; project administration, W.Y.; funding acquisition, R.T. All authors have read and agreed to the published version of the manuscript.

Funding

This research was funded by the Open Research Fund Program of State Key Laboratory of Hydroscience and Engineering (No. sklhse-2022-E-01).

Institutional Review Board Statement

Not applicable.

Informed Consent Statement

Not applicable.

Data Availability Statement

Not applicable.

Conflicts of Interest

The authors declare no conflict of interest.

References

  1. Jin, B. Research on performance evaluation of green supply chain of automobile enterprises under the background of carbon peak and carbon neutralization. Energy Rep. 2021, 7, 594–604. [Google Scholar] [CrossRef]
  2. Tan, X.; Liu, J.; Xu, Z.; Yao, L.; Ji, G.; Shan, B. Power supply and demand balance during the 14th five-year plan period under the goal of carbon emission peak and carbon neutrality. Electr. Power 2021, 54, 1–6. [Google Scholar]
  3. Kong, Y.; Kong, Z.; Liu, Z.; Wei, C.; Zhang, J.; An, G. Pumped storage power stations in China: The past, the present, and the future. Renew. Sustain. Energy Rev. 2017, 71, 720–731. [Google Scholar] [CrossRef]
  4. He, Y.; Guan, L.; Cai, Q.; Liu, X.; Li, C. Analysis of securing function and economic benefit of pumped storage station in power grid. Power Syst. Technol. 2004, 28, 54–57+67. [Google Scholar]
  5. Xu, F.; Chen, L.; Jin, H.; Liu, Z. Modeling and application analysis of optimal joint operation of pumped storage power station and wind power. Autom. Electr. Power Syst. 2013, 37, 149–154. [Google Scholar]
  6. Anagnostopoulos, J.S.; Papantonis, D.E. Pumping station design for a pumped-storage wind-hydro power plant. Energy Convers. Manag. 2007, 48, 3009–3017. [Google Scholar] [CrossRef]
  7. Yan, J.; Koutnik, J.; Seidel, U.; Hubner, B. Compressible simulation of rotor-stator interaction in pump-turbines. IOP Conf. Ser.-Earth Environ. Sci. 2010, 12, 012008. [Google Scholar] [CrossRef]
  8. Li, D.; Gong, R.; Wang, H.; Wei, X.; Liu, Z.; Qin, D. Unstable head-flow characteristics of pump-turbine under different guide vane openings in pump mode. J. Drain. Irrig. Mach. Eng. 2016, 34, 1–8. [Google Scholar]
  9. Zhu, D.; Xiao, R.; Tao, R.; Liu, W. Impact of guide vane opening angle on the flow stability in a pump-turbine in pump mode. Proc. Inst. Mech. Eng. Part C-J. Mech. Eng. Sci. 2017, 231, 2484–2492. [Google Scholar] [CrossRef]
  10. Yao, Y.; Xiao, Y.; Zhu, W.; Zhai, L.; An, S.; Wang, Z. Numerical analysis of a model pump-turbine internal flow behavior in pump hump district. IOP Conf. Ser.-Earth Environ. Sci. 2014, 22, 032040. [Google Scholar]
  11. Li, D.; Wang, H.; Xiang, G.; Gong, R.; Wei, X.; Liu, Z. Unsteady simulation and analysis for hump characteristics of a pump turbine model. Renew. Energy 2015, 77, 32–42. [Google Scholar]
  12. Li, D.; Wang, H.; Qin, Y.; Wei, X.; Qin, D. Numerical simulation of hysteresis characteristic in the hump region of a pump-turbine model. Renew. Energy 2018, 115, 433–447. [Google Scholar] [CrossRef]
  13. Xiao, Y.; Yao, Y.; Wang, Z.; Zhang, J.; Luo, Y.; Zeng, C.; Zhu, W. Hydrodynamic mechanism analysis of the pump hump district for a pump-turbine. Eng. Comput. 2016, 33, 957–976. [Google Scholar] [CrossRef]
  14. Lu, Z.; Xiao, R.; Tao, R.; Li, P.; Liu, W. Influence of guide vane profile on the flow energy dissipation in a reversible pump-turbine at pump mode. J. Energy Storage 2022, 49, 104161. [Google Scholar] [CrossRef]
  15. Song, H.; Zhang, J.; Huang, P.; Cai, H.; Cao, P.; Hu, B. Analysis of rotor-stator interaction of a pump-turbine with splitter blades in a pump mode. Mathematics 2020, 8, 1465. [Google Scholar] [CrossRef]
  16. Zhang, Y.; Chen, T.; Li, J.; Yu, J. Experimental study of load variations on pressure fluctuations in a prototype reversible pump turbine in generating mode. J. Fluids Eng. 2017, 139, 074501. [Google Scholar] [CrossRef]
  17. Zhang, C.; Xia, L.; Diao, W. Influence of flow structures evolution on hump characteristics of a model pump-turbine in pump mode. J. Zhejiang Univ. Eng. Sci. 2017, 51, 2249–2258. [Google Scholar]
  18. Yang, J.; Pavesi, G.; Liu, X.; Xie, T.; Liu, J. Unsteady flow characteristics regarding hump instability in the first stage of a multistage pump-turbine in pump mode. Renew. Energy 2018, 127, 377–385. [Google Scholar] [CrossRef]
  19. Wang, H.; Wu, G.; Wu, W.; Wei, X.; Chen, Y.; Li, H. Numerical simulation and analysis of the hump district of Francis pump-turbine. J. Hydroelectr. Eng. 2012, 31, 253–258. [Google Scholar]
  20. Yang, J.; Yuan, S.; Pavesi, G.; Li, C.; Ye, Z. Study of hump instability phenomena in pump turbine at large partial flow conditions on pump mode. J. Mech. Eng. 2016, 52, 170–178. [Google Scholar] [CrossRef]
  21. Zhao, W.; Wu, B.; Xu, J. Aerodynamic design and analysis of a multistage vaneless counter-rotating turbine. J. Turbomach. 2014, 137, 061008. [Google Scholar] [CrossRef]
  22. Vanzante, D.E.; To, W.M.; Chen, J.P. Blade row interaction effects on the performance of a moderately loaded NASA transonic compressor stage. Am. Soc. Mech. Eng. 2003, 1, 969–980. [Google Scholar]
  23. Sun, Y.; Ren, Y. Unsteady loss analyses of the flow in single-stage transonic compressor. J. Tsinghua Univ. Sci. Technol. 2009, 49, 759–762. [Google Scholar]
  24. Esfahani, J.A.; Modirkhazeni, M.S. Accuracy analysis of predicted velocity profiles of laminar duct flow with entropy generation method. Appl. Math. Mech. 2013, 34, 971–984. [Google Scholar] [CrossRef]
  25. Kluxen, R.; Behre, S.; Jeschke, P.; Guendogdu, Y. Loss mechanisms of interplatform steps in a 1.5-stage axial flow turbine. J. Turbomach. 2017, 139, 031007. [Google Scholar] [CrossRef]
  26. Soltanmohamadi, R.; Lakzian, E. Improved design of Wells turbine for wave energy conversion using entropy generation. Meccanica 2016, 51, 1713–1722. [Google Scholar] [CrossRef]
  27. Zeinalpour, M.; Mazaheri, K. Entropy minimization in turbine cascade using continuous adjoint formulation. Eng. Optim. 2015, 48, 213–230. [Google Scholar] [CrossRef]
  28. Menter, F.R.; Kuntz, M.; Langtry, R. Ten years of industrial experience with the SST turbulence model. Turbul. Heat Mass Transf. 2003, 4, 625–632. [Google Scholar]
  29. Herwig, H.; Kock, F. Direct and indirect methods of calculating entropy generation rates in turbulent convective heat transfer problems. Heat Mass Transf. 2007, 43, 207–215. [Google Scholar] [CrossRef]
  30. Tao, R.; Zhao, X.; Wang, Z. Evaluating the transient energy dissipation in a centrifugal impeller under rotor-stator interaction. Entropy 2019, 21, 271. [Google Scholar] [CrossRef]
  31. Zhou, Q.; Xia, L.; Zhang, C. Internal mechanism and improvement criteria for the runaway oscillation stability of a pump-turbine. Appl. Sci. 2018, 8, 2193. [Google Scholar] [CrossRef]
  32. Guan, X. Modern Pumps Theory and Design; China Astronautic Publishing House: Beijing, China, 2011; pp. 32–37. [Google Scholar]
  33. Capurso, T.; Stefanizzi, M.; Pascazio, G.; Camporeale, S.M.; Torresi, M. Dependency of the slip phenomenon on the inertial forces inside radial runners. AIP Conf. Proc. 2019, 2191, 020034. [Google Scholar]
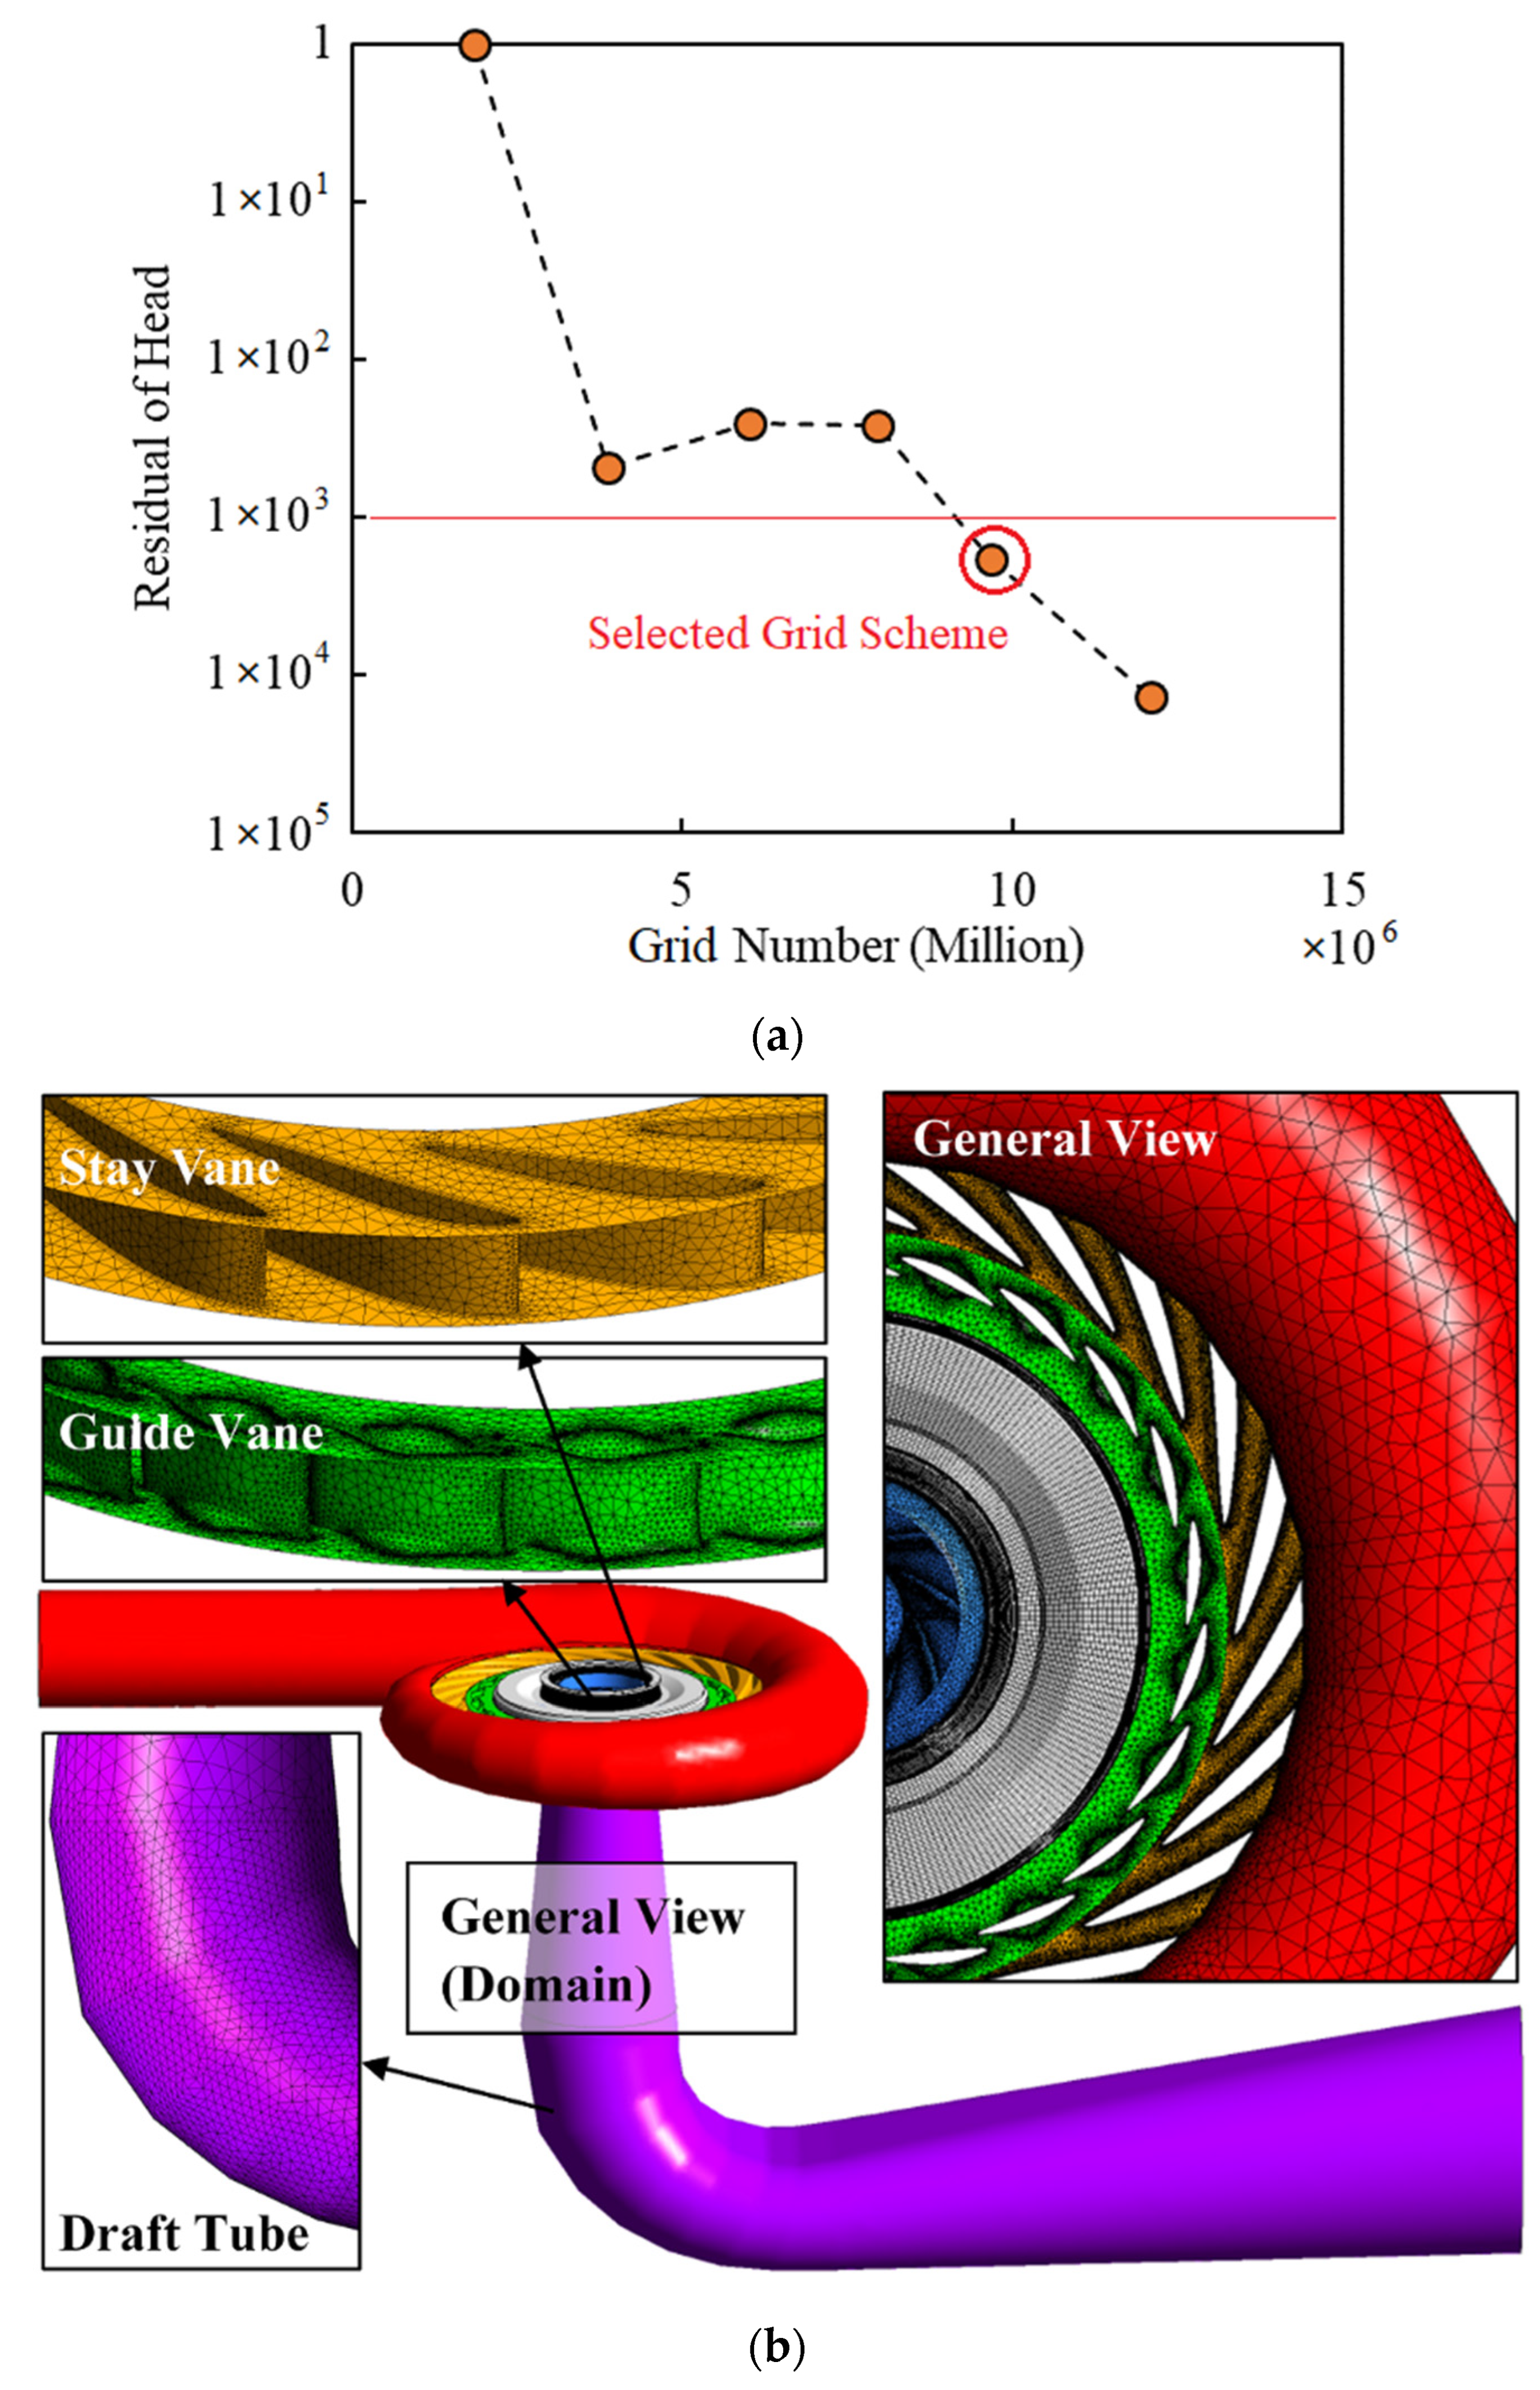
Figure 2. Fluid domain and grid. (a) Grid independence check; (b) the schematic map of the final grid.
Water 14 02526 g002
Figure 3. Test rig and apparatus. (a) The schematic map of the test rig and apparatus; (b) the on-site view of the test rig.
Water 14 02526 g003aWater 14 02526 g003b
Figure 4. Experimental–numerical comparison of energy performance in pump mode.
Water 14 02526 g004
Figure 5. Variation in typical conditions of different attack angles α. (a) QSTA. (b) QVAL. (c) ηBEP. (d) QBEP.
Water 14 02526 g005
Figure 6. Performance curve and flow pattern at 18° attack angle. (a) Q-H and Q-η curve; (b) proportion of flow energy loss; (c) VAL Spro; (d) VAL v; (e) BEP Spro; (f) BEP v; VAL: local valley of Q-H curve; BEP: best efficiency point.
Water 14 02526 g006
Figure 7. Performance curve and flow pattern at 16° attack angle. (a) Q-H and Q-η curve; (b) proportion of flow energy loss; (c) VAL Spro; (d) VAL v; (e) BEP Spro; (f) BEP v; VAL: local valley of Q-H curve; BEP: best efficiency point.
Water 14 02526 g007
Figure 8. Performance curve and flow pattern at 14° attack angle. (a) Q-H and Q-η curve; (b) proportion of flow energy loss; (c) VAL Spro; (d) VAL v; (e) BEP Spro; (f) BEP v; VAL: local valley of Q-H curve; BEP: best efficiency point.
Water 14 02526 g008aWater 14 02526 g008b
Figure 9. Performance curve and flow pattern at 12° attack angle. (a) Q-H and Q-η curve; (b) proportion of flow energy loss; (c) VAL Spro; (d) VAL v; (e) BEP Spro; (f) BEP v; VAL: local valley of Q-H curve; BEP: best efficiency point.
Water 14 02526 g009aWater 14 02526 g009b
Figure 10. Performance curve and flow pattern at 10° attack angle. (a) Q-H and Q-η curve; (b) proportion of flow energy loss; (c) VAL Spro; (d) VAL v; (e) BEP Spro; (f) BEP v; VAL: local valley of Q-H curve; BEP: best efficiency point.
Water 14 02526 g010
Figure 11. Schematic map of the mismatching of guide vane flow angle.
Water 14 02526 g011
Table 2. Grid number of each component.
ComponentGrid Number
Draft tube388,445
Runner (including clearance)3,368,717
Guide vane1,462,120
Stay vane2,669,804
Volute1,779,870
Total9,668,956
Table 3. Measured physical quantities and apparatus uncertainty.
QuantityApparatusTypeUncertainty
Flow rateElectromagnetic flowmeterRosemount 8705TSE±0.1%
Rotation speedRotary encoderE6B2-CWZ1X±0.02%
HeadDifferential pressure sensorSHAE 1151HP6E±0.1%
TorqueLoad sensorGWT MP47/22C3±0.015%
Tail-water pressureAbsolute pressure sensorRosemount 1151AP±0.1%
Guide vane angleAngular displacement sensorBGJ 60±0.10°
Publisher’s Note: MDPI stays neutral with regard to jurisdictional claims in published maps and institutional affiliations.