1. Introduction
Lake ice phenology is of particular research interest, and in recent decades this interest has been primarily driven by climate warming [
1,
2,
3,
4,
5,
6,
7]. The most frequently cited research results concerning limnic ice phenomena include data from studies conducted in individual water bodies, less frequently regional studies or analyses of ice phenomena in lakes carried out within a broader context [
8,
9,
10,
11,
12,
13,
14,
15,
16]. Many lakes in the high mountains have been examined in terms of ice phenomena but there has not been much research on the vertical and horizontal variation in their ice cover [
1,
2,
4,
13,
14,
17], and this represents a significant gap in global limnological knowledge.
Of all the ice phenomena observed in lakes and other water bodies, the presence of a complete ice cover is the one most readily noticed. Data on the thickness of ice covering lakes provide one of the key characteristics describing their ice regimes [
18]. Information on the average and maximum thickness of ice on lakes is usually juxtaposed with the dates of formation and disappearance of ice phenomena and ice layers, and how much time the ice was covering the water bodies [
18]. Studying patterns in the surface variability of ice thickness on lakes is important both in order to further our knowledge and for utilitarian reasons, since this knowledge can help us use these water bodies in a safer manner [
18,
19,
20,
21,
22,
23,
24,
25]. This issue has already been raised several times in the limnological literature with respect to lowland lakes and anthropogenic water bodies situated in different parts of the world [
8,
9,
11,
26,
27,
28,
29]. In contrast, very few papers have addressed the issue of spatial variability in ice thickness in mountain lakes, mainly because of the more difficult access to study areas and the much harsher conditions accompanying field measurements [
27,
30,
31,
32,
33,
34,
35]. This has resulted in studies being conducted at various times during the winter and being limited to point measurements of ice thickness.
The studies on surface variability of ice thickness that have been conducted to date on lowland lakes and water bodies situated in the uplands demonstrate that several factors influence this variability, among which the most important are the processes whereby the ice cover is subject to pressure from the layer of snow that accumulates on it in winter, and snow ice accretes from above [
26,
28]. During the initial icing stages, the variability in ice thickness is small (a few centimeters), and it increases significantly during snowy winters [
29]. A study by W.P. Adams and N.T. Roulet [
36] suggests that the redistribution of the snow layer by the wind results in local differences in the thickness of white and crystalline ice and in the thickness of the snow layer overlying the ice. They found that a thicker layer of snow (blown by the wind) accumulates in the coastal zone, forming drifts [
10]. This initially limits the formation of crystalline ice due to the insulating properties of snow, and subsequently triggers the pressure on the ice cover that results in the development of snow ice [
37]. Consequently, a thicker layer of crystalline ice was found in central parts of the lake, while a higher proportion of snow ice was found in the coastal zone [
10,
36]. However, differences in ice thickness in lowland lakes rarely exceeded several dozen centimeters [
27,
28,
38].
This paper attempts to answer several questions. How much variability is there in ice thickness in mountain lakes and how does this variability change during the winter season? What is the major factor affecting the variability in ice thickness in mountain lakes? How do local (topoclimatic and geomorphological) conditions influence ice patterns in the water bodies selected for the study? Do maximum thicknesses of the ice forming on lakes in high mountains of the temperate zone differ from the values modeled using Stefan’s [
39] formula based on freezing degree-days and to what extent?
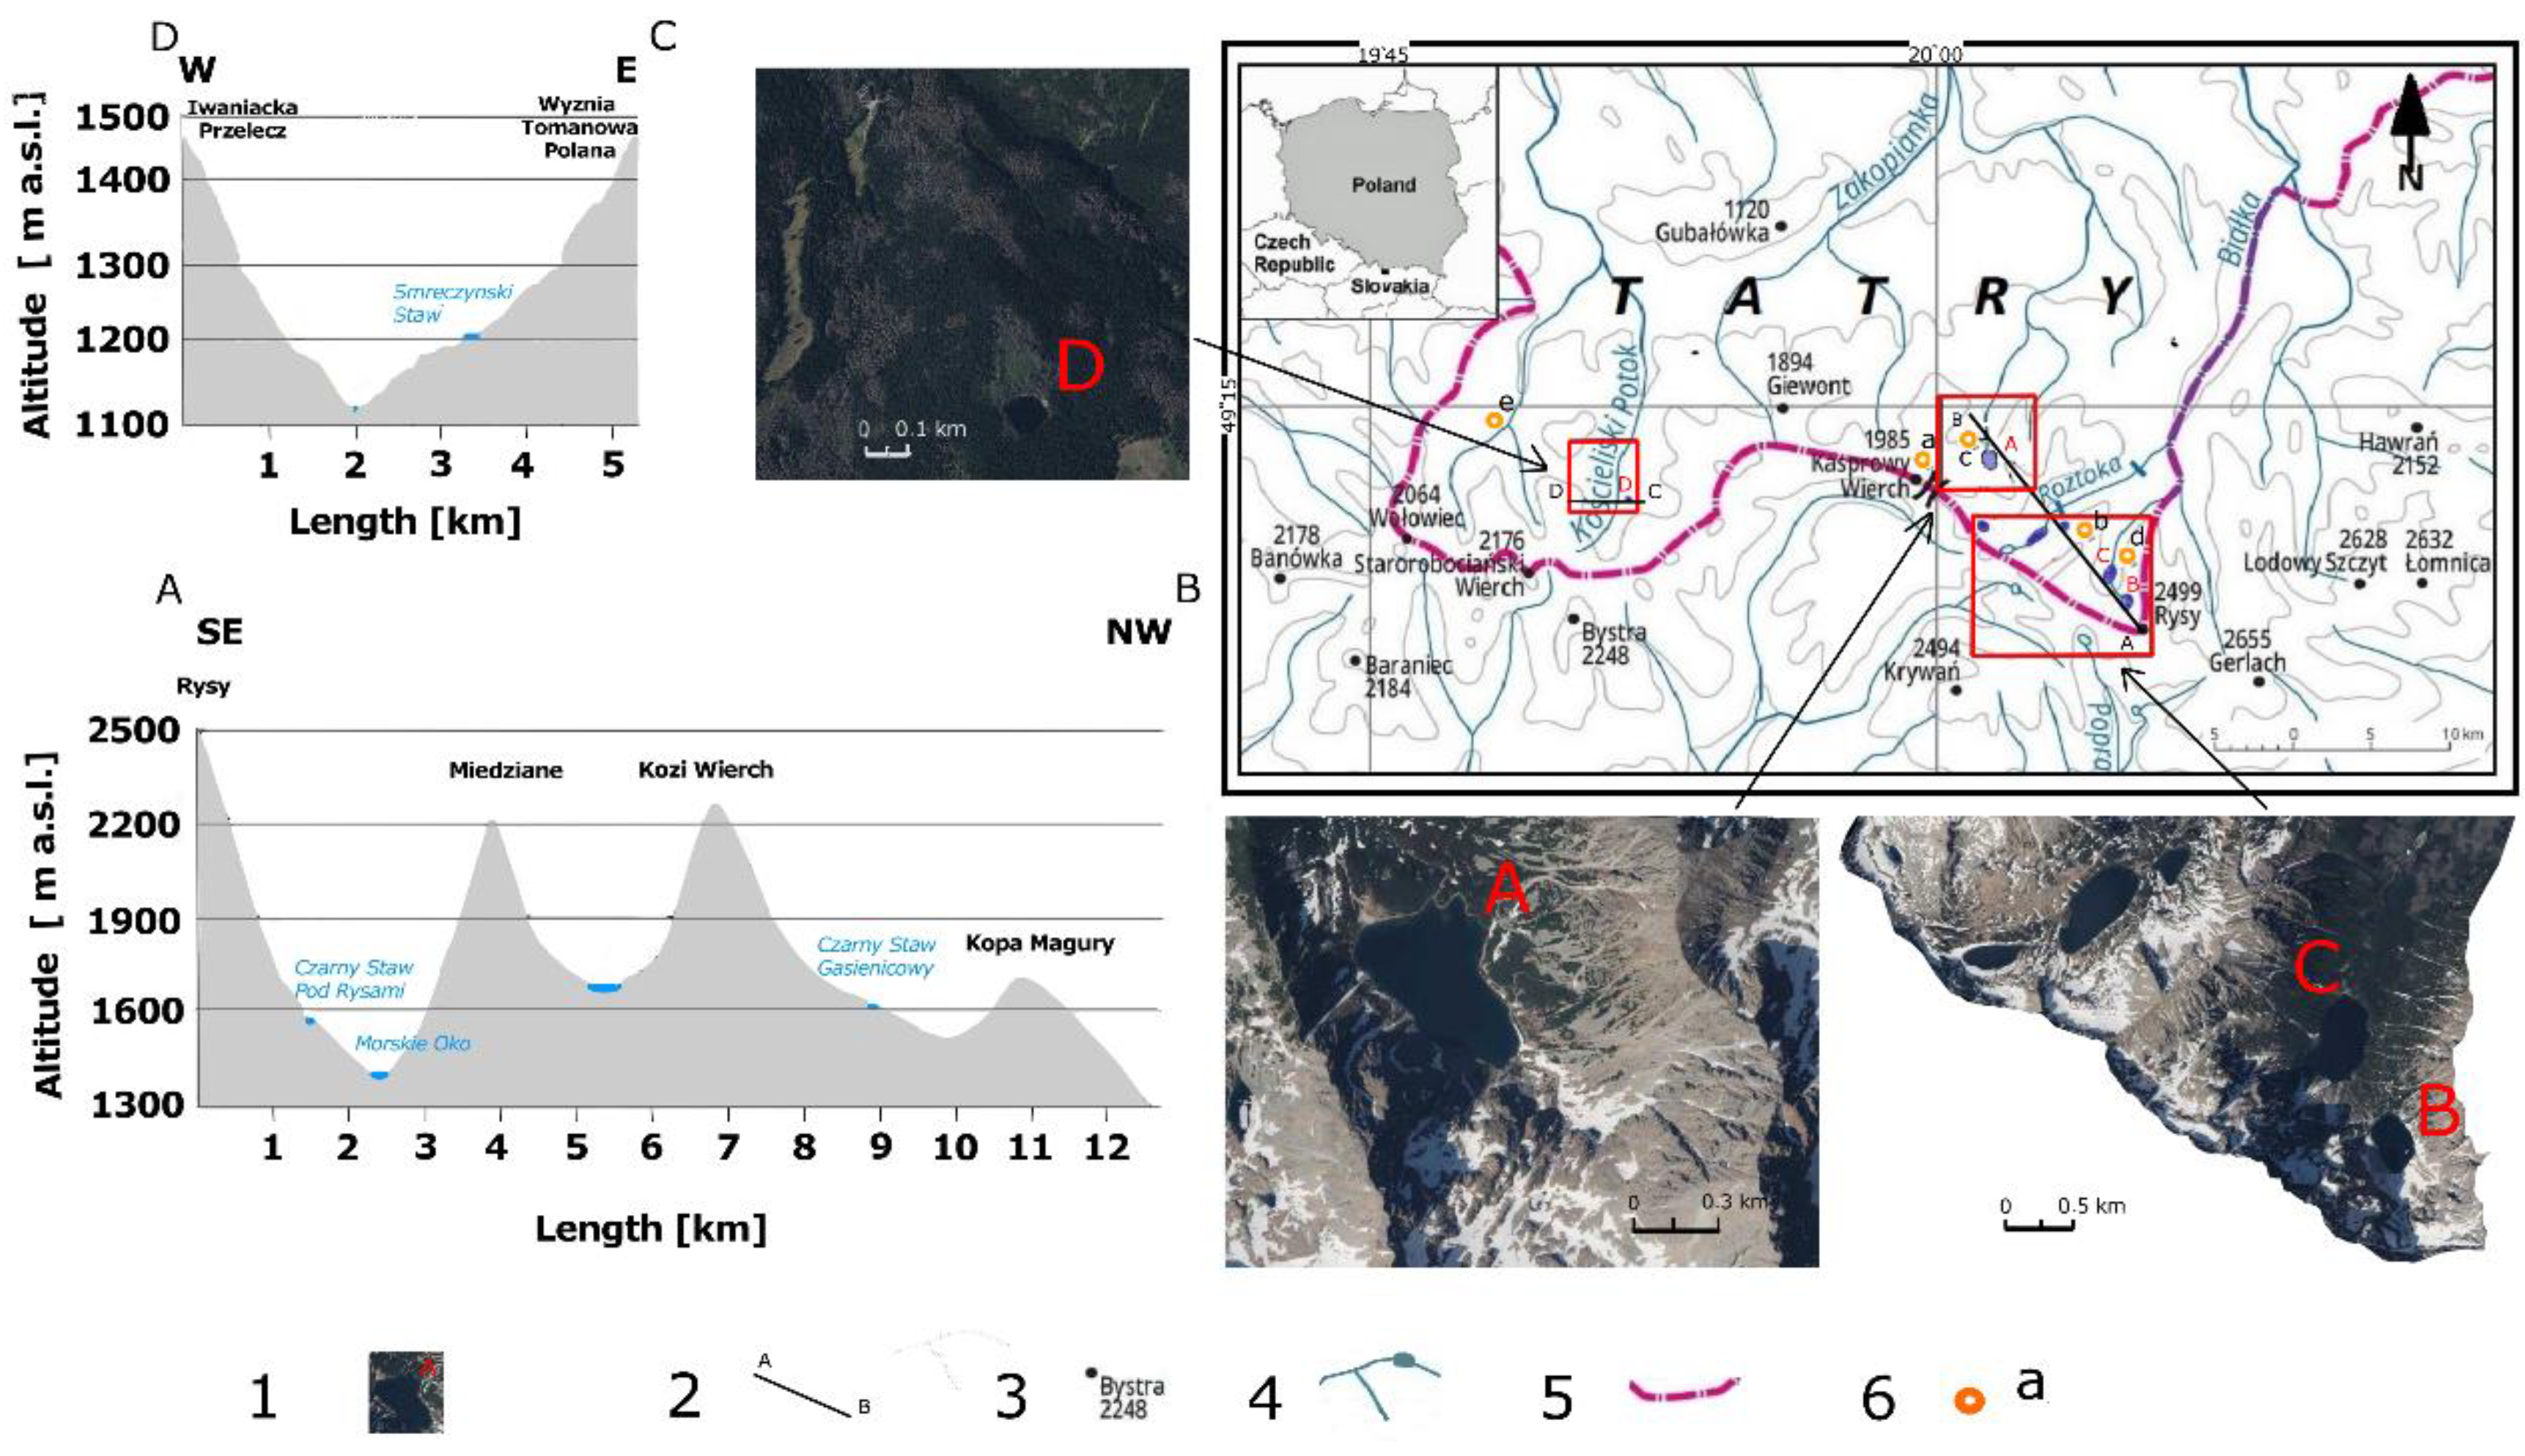
The purpose of the study was to describe the determinants of spatial variability of ice thickness in lakes in high mountains of the temperate zone, using the case of the Tatra Mountains in southern Poland.
2. Materials and Methods
The study covered four lakes in the Tatra Mountains, within the Tatra National Park. Three of them are located in the High Tatras and one in the Western Tatras (
Figure 1). The Smreczyński Staw is situated in the upper subalpine forest zone, the Morskie Oko at the upper border of the forest zone, and the Czarny Staw pod Rysami and Czarny Staw Gąsienicowy are situated in the dwarf pine zone. These are glacial lakes with quite diverse morphometric characteristics (
Table 1).
In order to illustrate the atmospheric conditions prevailing in the study area during the winter season, data on air temperature, precipitation, and snow cover thickness were used from Institute of Meteorology and Water Management (IMGW, Warszawa, Poland) stations located in different parts of the Tatra National Park at various altitudes above sea level: on the Kasprowy Wierch (1987 m a.s.l.), in the Dolina Pięciu Stawów Polskich (1670 m a.s.l.), on the Hala Gąsienicowa (1520 m a.s.l.), in the Dolina Rybiego Potoku by the Morskie Oko mountain shelter (1408 m a.s.l.), and on the Polana Chochołowska (1147 m a.s.l.) (
Figure 2). The data was obtained from the
https://meteomodel.pl/dane/historyczne-dane-pomiarowe/? (accessed on 20 January 2022) [
43] and
https://danepubliczne.imgw.pl/data/dane_pomiarowo_obserwacyjne (accessed on 22 January 2022) [
44] websites.
The data collected from meteorological stations demonstrate that air temperature patterns in the various parts of the study area were very similar. This is also evidenced by the Pearson correlation coefficients calculated, which ranged from r = 0.96 (p = 0.000) for temperatures from the stations located on the Polana Chochołowska and on the Kasprowy Wierch to r = 0.99 (p = 0.000) for temperatures from the stations located on the Hala Gąsienicowa and in the Dolina Pięciu Stawów. The average air temperature decreased with increasing altitude. During the ice accumulation period (from 14 November to 31 March), it ranged from −6.6 °C (Kasprowy Wierch) to −2.8 °C (Polana Chochołowska). The pattern remained similar from 1 November to 30 June. Average air temperatures during that period ranged from −2.0 °C (Kasprowy Wierch) to 2.3 °C (Polana Chochołowska).
In the case of daily precipitation totals, significant correlations between individual meteorological stations were noted as well. These ranged from r = 0.79 (p = 0.001) (Morskie Oko–Kasprowy Wierch) to r = 0.92 (p = 0.001) (Hala Gąsienicowa–Kasprowy Wierch). Total precipitation during the ice accumulation period ranged from 426 mm for the station located on the Hala Gąsienicowa to 524 mm for the station located on the Polana Chochołowska, which only partially translated into the thickness of the snow layer recorded at individual sites, since at the Polana Chochołowska station precipitation occurred more often in the form of rain than at the other meteorological stations. The maximum thickness of snow cover for individual stations ranged from 152 cm on the Hala Gąsienicowa to 235 cm on the Kasprowy Wierch.
Observations of changes in snow and ice cover thickness in selected lakes during the 2018/2019 winter season were conducted from the time of emergence of ice phenomena until their complete disappearance from the lakes.
The duration of ice phenomena in the lakes studied was determined from the analysis of Sentinel-2 satellite images (44 images from October 2018 until June 2019 were used) and from field observations. The accuracy of the dates determined for the appearance and disappearance of individual ice phases in the lakes in question is not worse than 3–4 days. The data was obtained from the
https://apps.sentinel-hub.com website (accessed on 22 January 2022) [
45].
Ice thickness was measured during two measurement series at a dozen to several dozen points distributed relatively uniformly within the ice covers (
Table 2). Measurement point locations were determined using a Garmin portable GPS receiver (Garmin, Olathe, Kansas, USA). At these points, holes were made using an ice chisel and an ice auger. The thickness of the ice cover and of the slush and snow layer deposited on the ice was measured using a specially constructed measuring staff. The accuracy of the measurement was 0.5 cm.
Based on the measurement data, a database was developed in Excel with two time slices. On this basis, maps of spatial variability of the thickness of the ice cover, snow together with slush, and snow and ice cover were developed using the MapInfo Professional 10.0 software. These data were also used to calculate the Pearson correlation coefficient between the thickness of the lake ice cover and the thickness of the snow and slush layer on the ice at measurement sites. The data had a normal distribution, which was verified using the Kolmogorov–Smirnov test [
46]. The level of statistical significance of the relationships found was tested using Student’s t-test. In both measurement series, the maximum and minimum values were also determined for each lake, and arithmetic means were calculated for the thickness of the ice cover and of the overlying layer of snow and slush. On the basis of the isopachyte charts produced, the volumes of ice, and snow and ice, covers and their percentage shares of the volume of the lakes studied were calculated. Statistical calculations were performed using the Statistica10PL software.
Maximum ice thickness during the season was also modeled using Stefan’s formula based on accumulated freezing degree-days. Stefan’s [
39] formula, which was initially used to model sea ice thickness, was subsequently modified by Michel [
47] and Lotsari [
48] (Equation (1)):
where:
η—maximum ice thickness during the season [cm];
—empirical coefficient of 0.017 m/°C−1/2 · day1/2;
S—accumulated freezing degree-days (AFDD).
3. Results
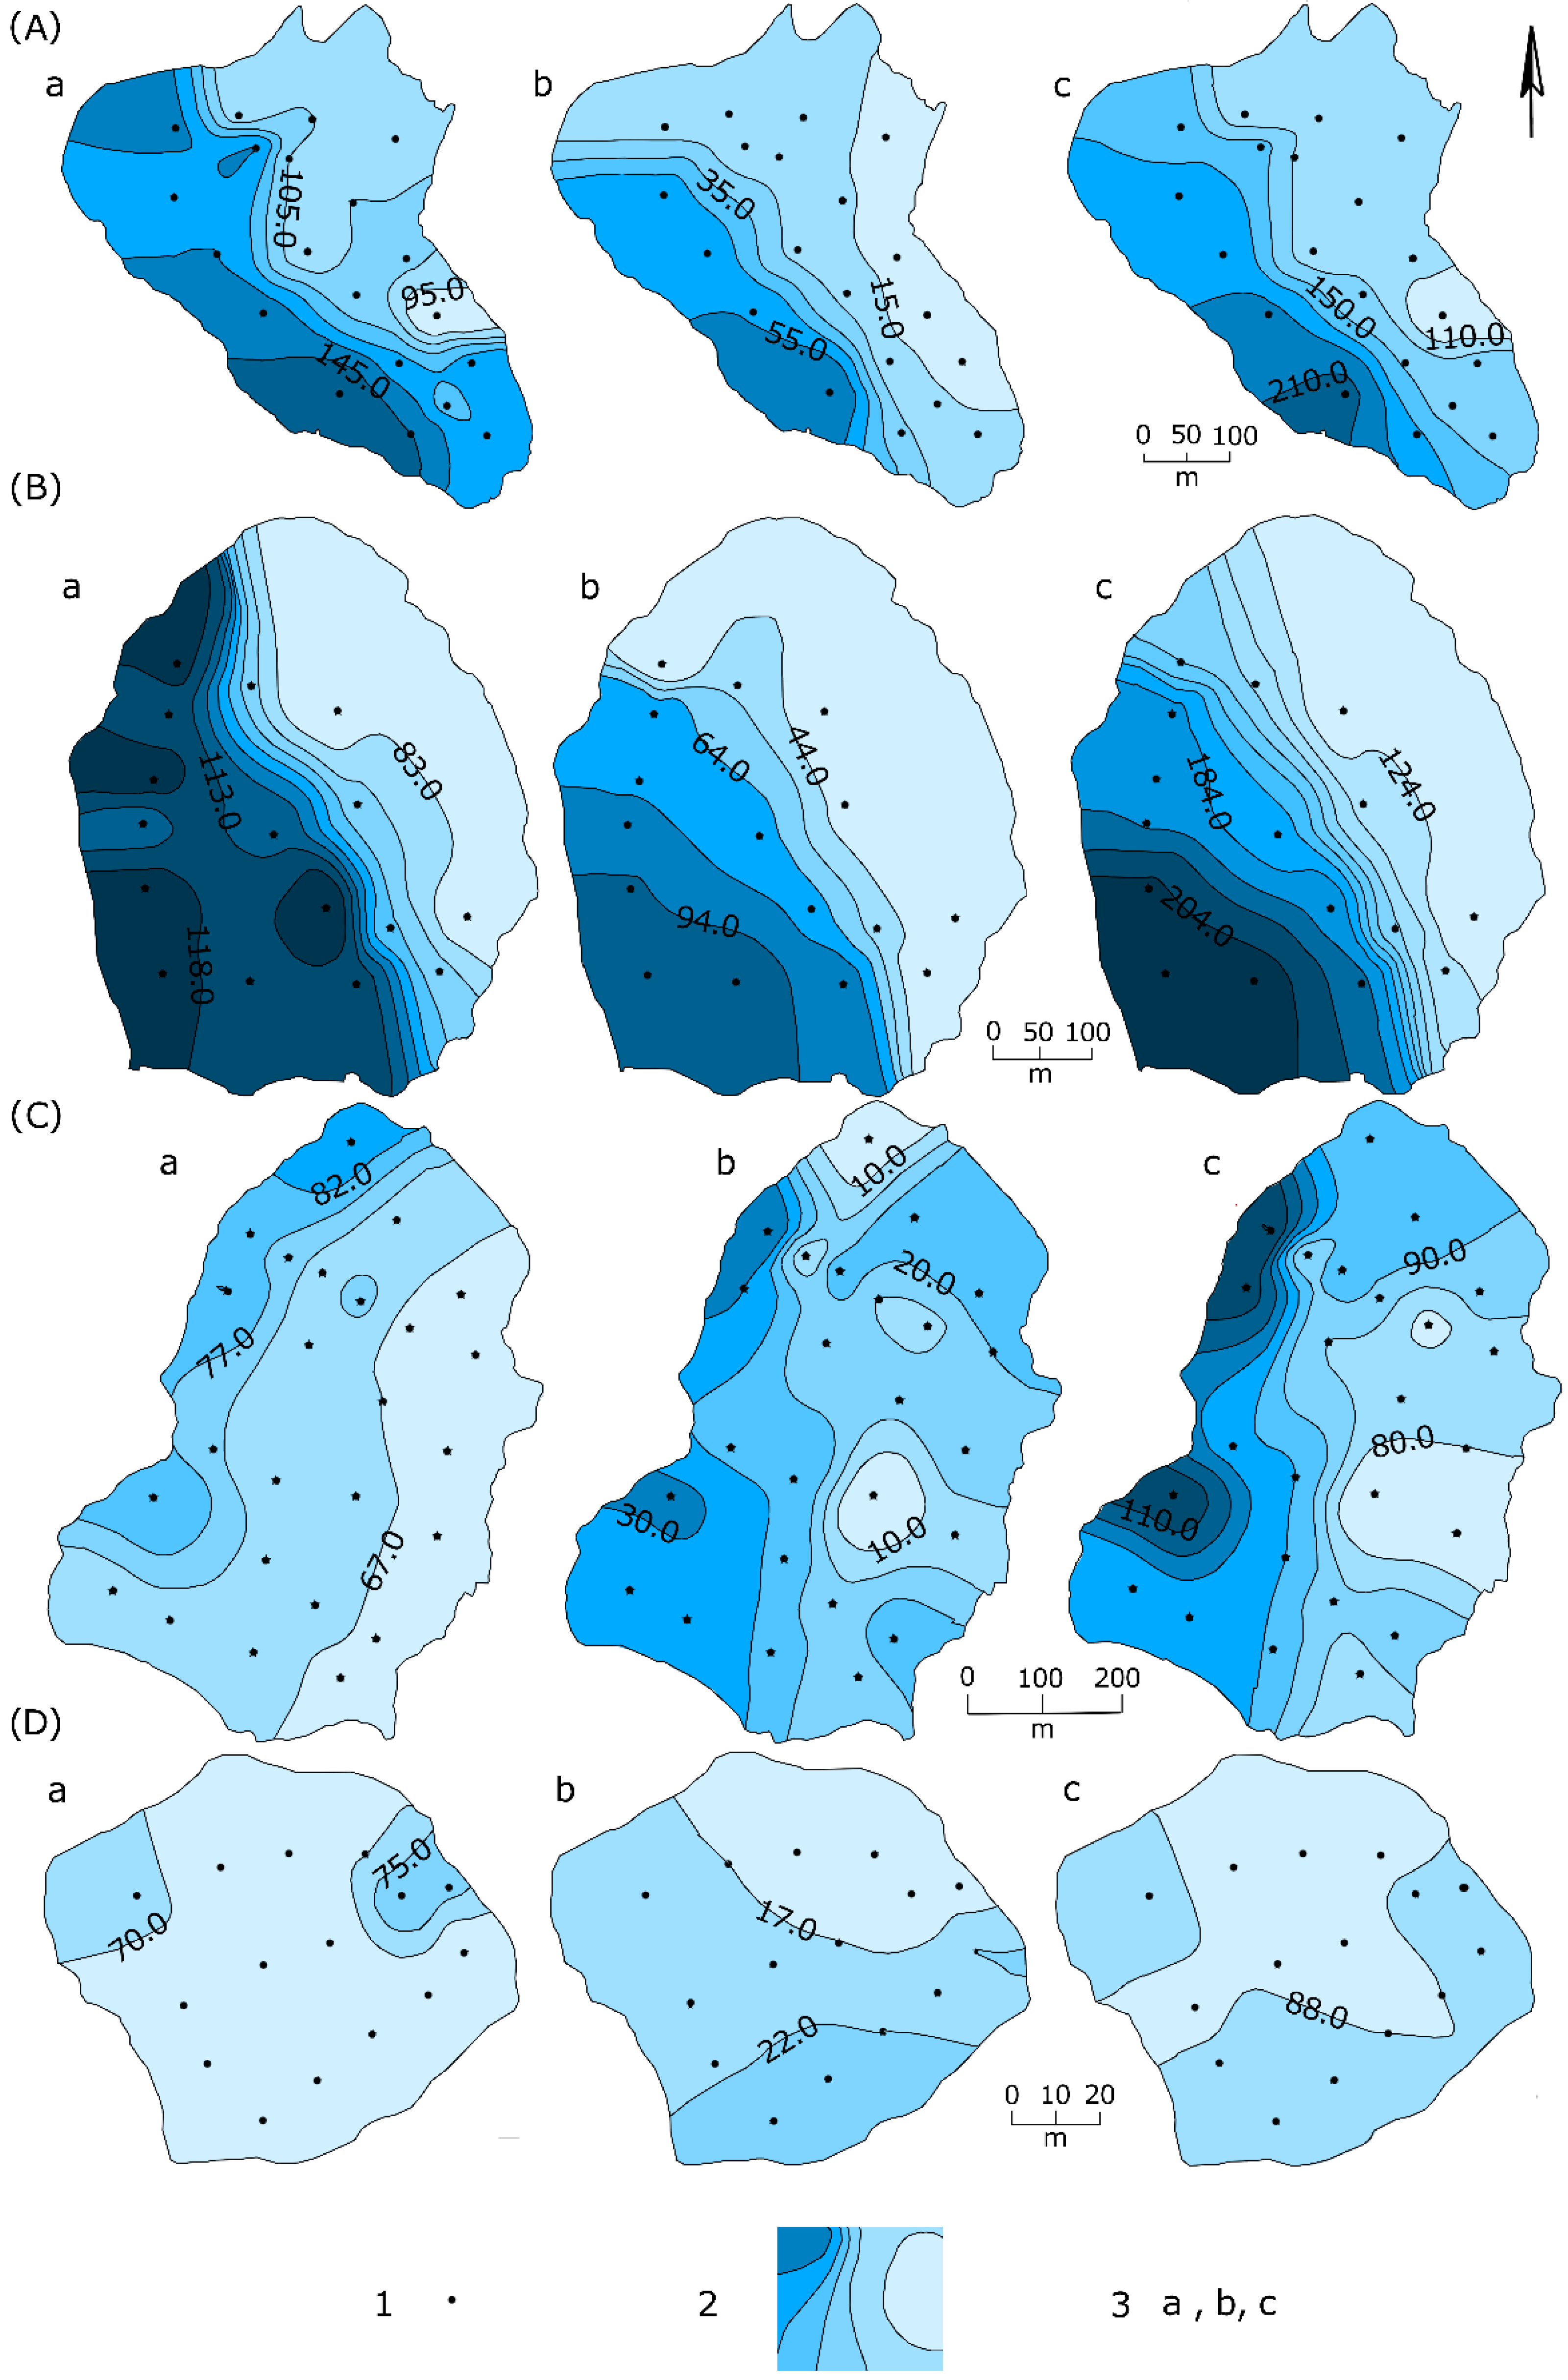
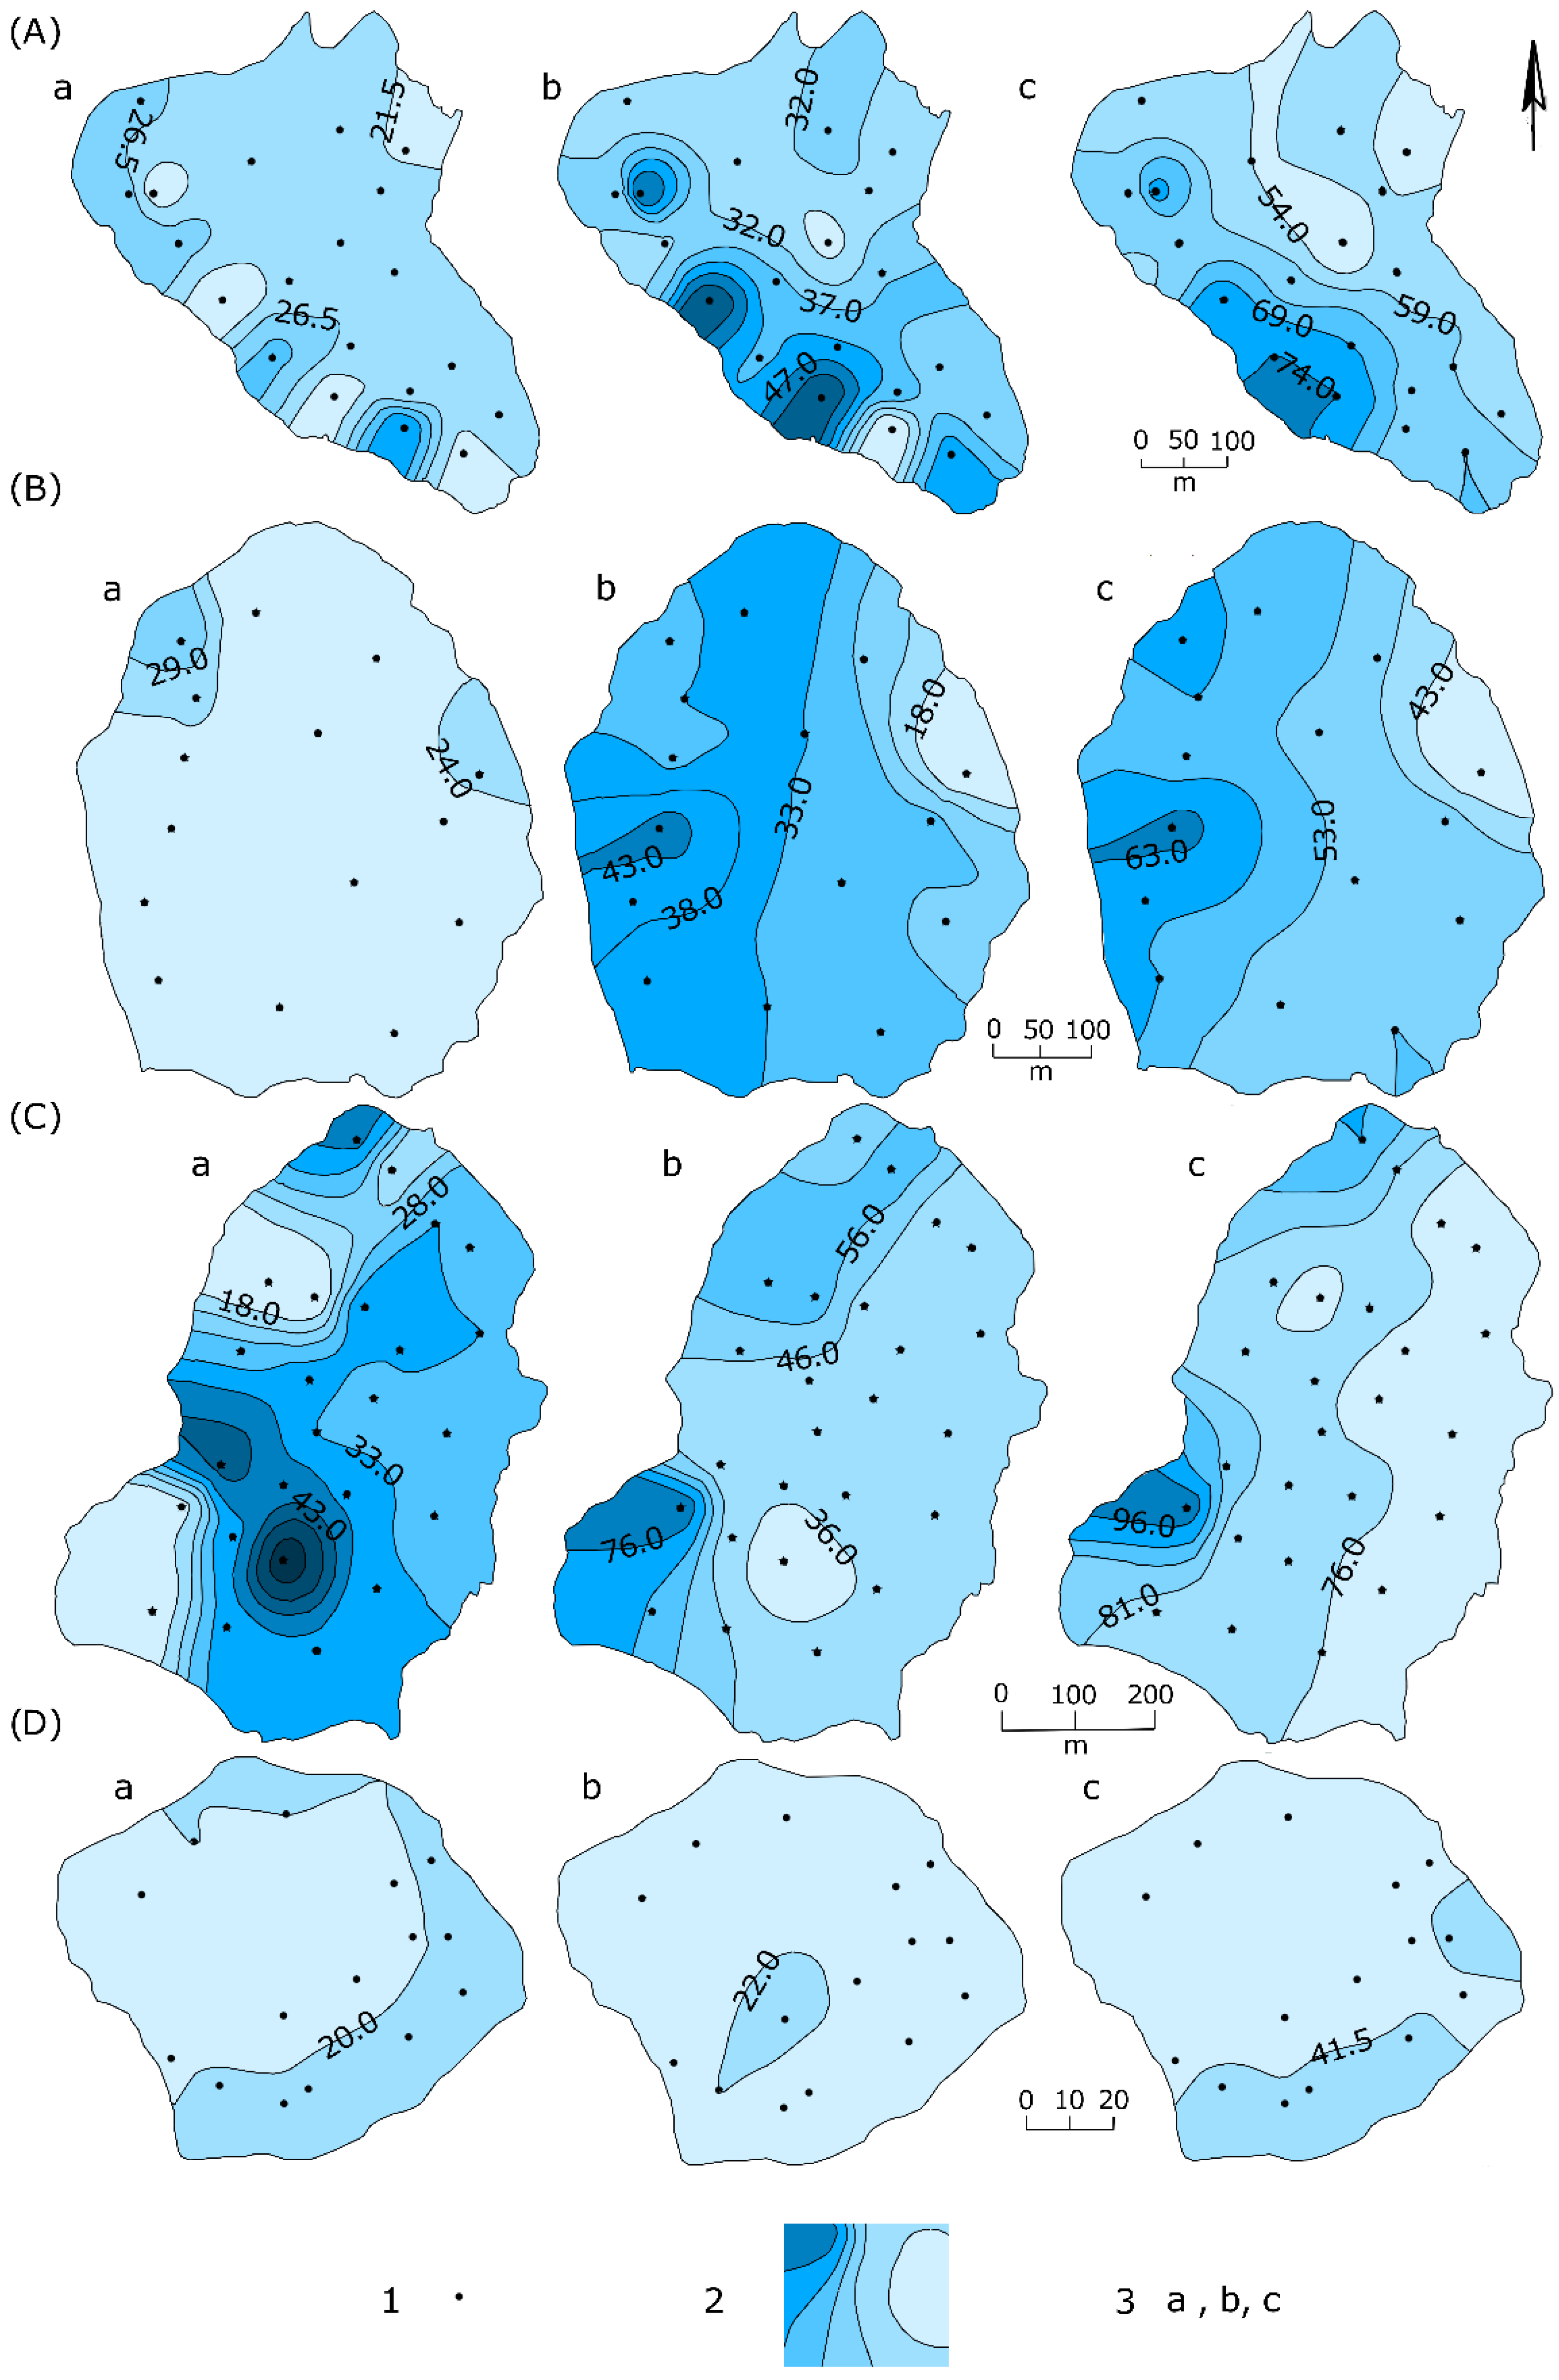
The patterns related to ice phenomena within the studied lakes in the Tatra Mountains varied considerably. Horizontal and vertical differences in ice cover structure occurred both at the beginning and at the end of the winter season analyzed. They were identified within all lakes in the study area, and on this basis, characteristics of individual water bodies were determined (
Figure 3,
Figure 4 and
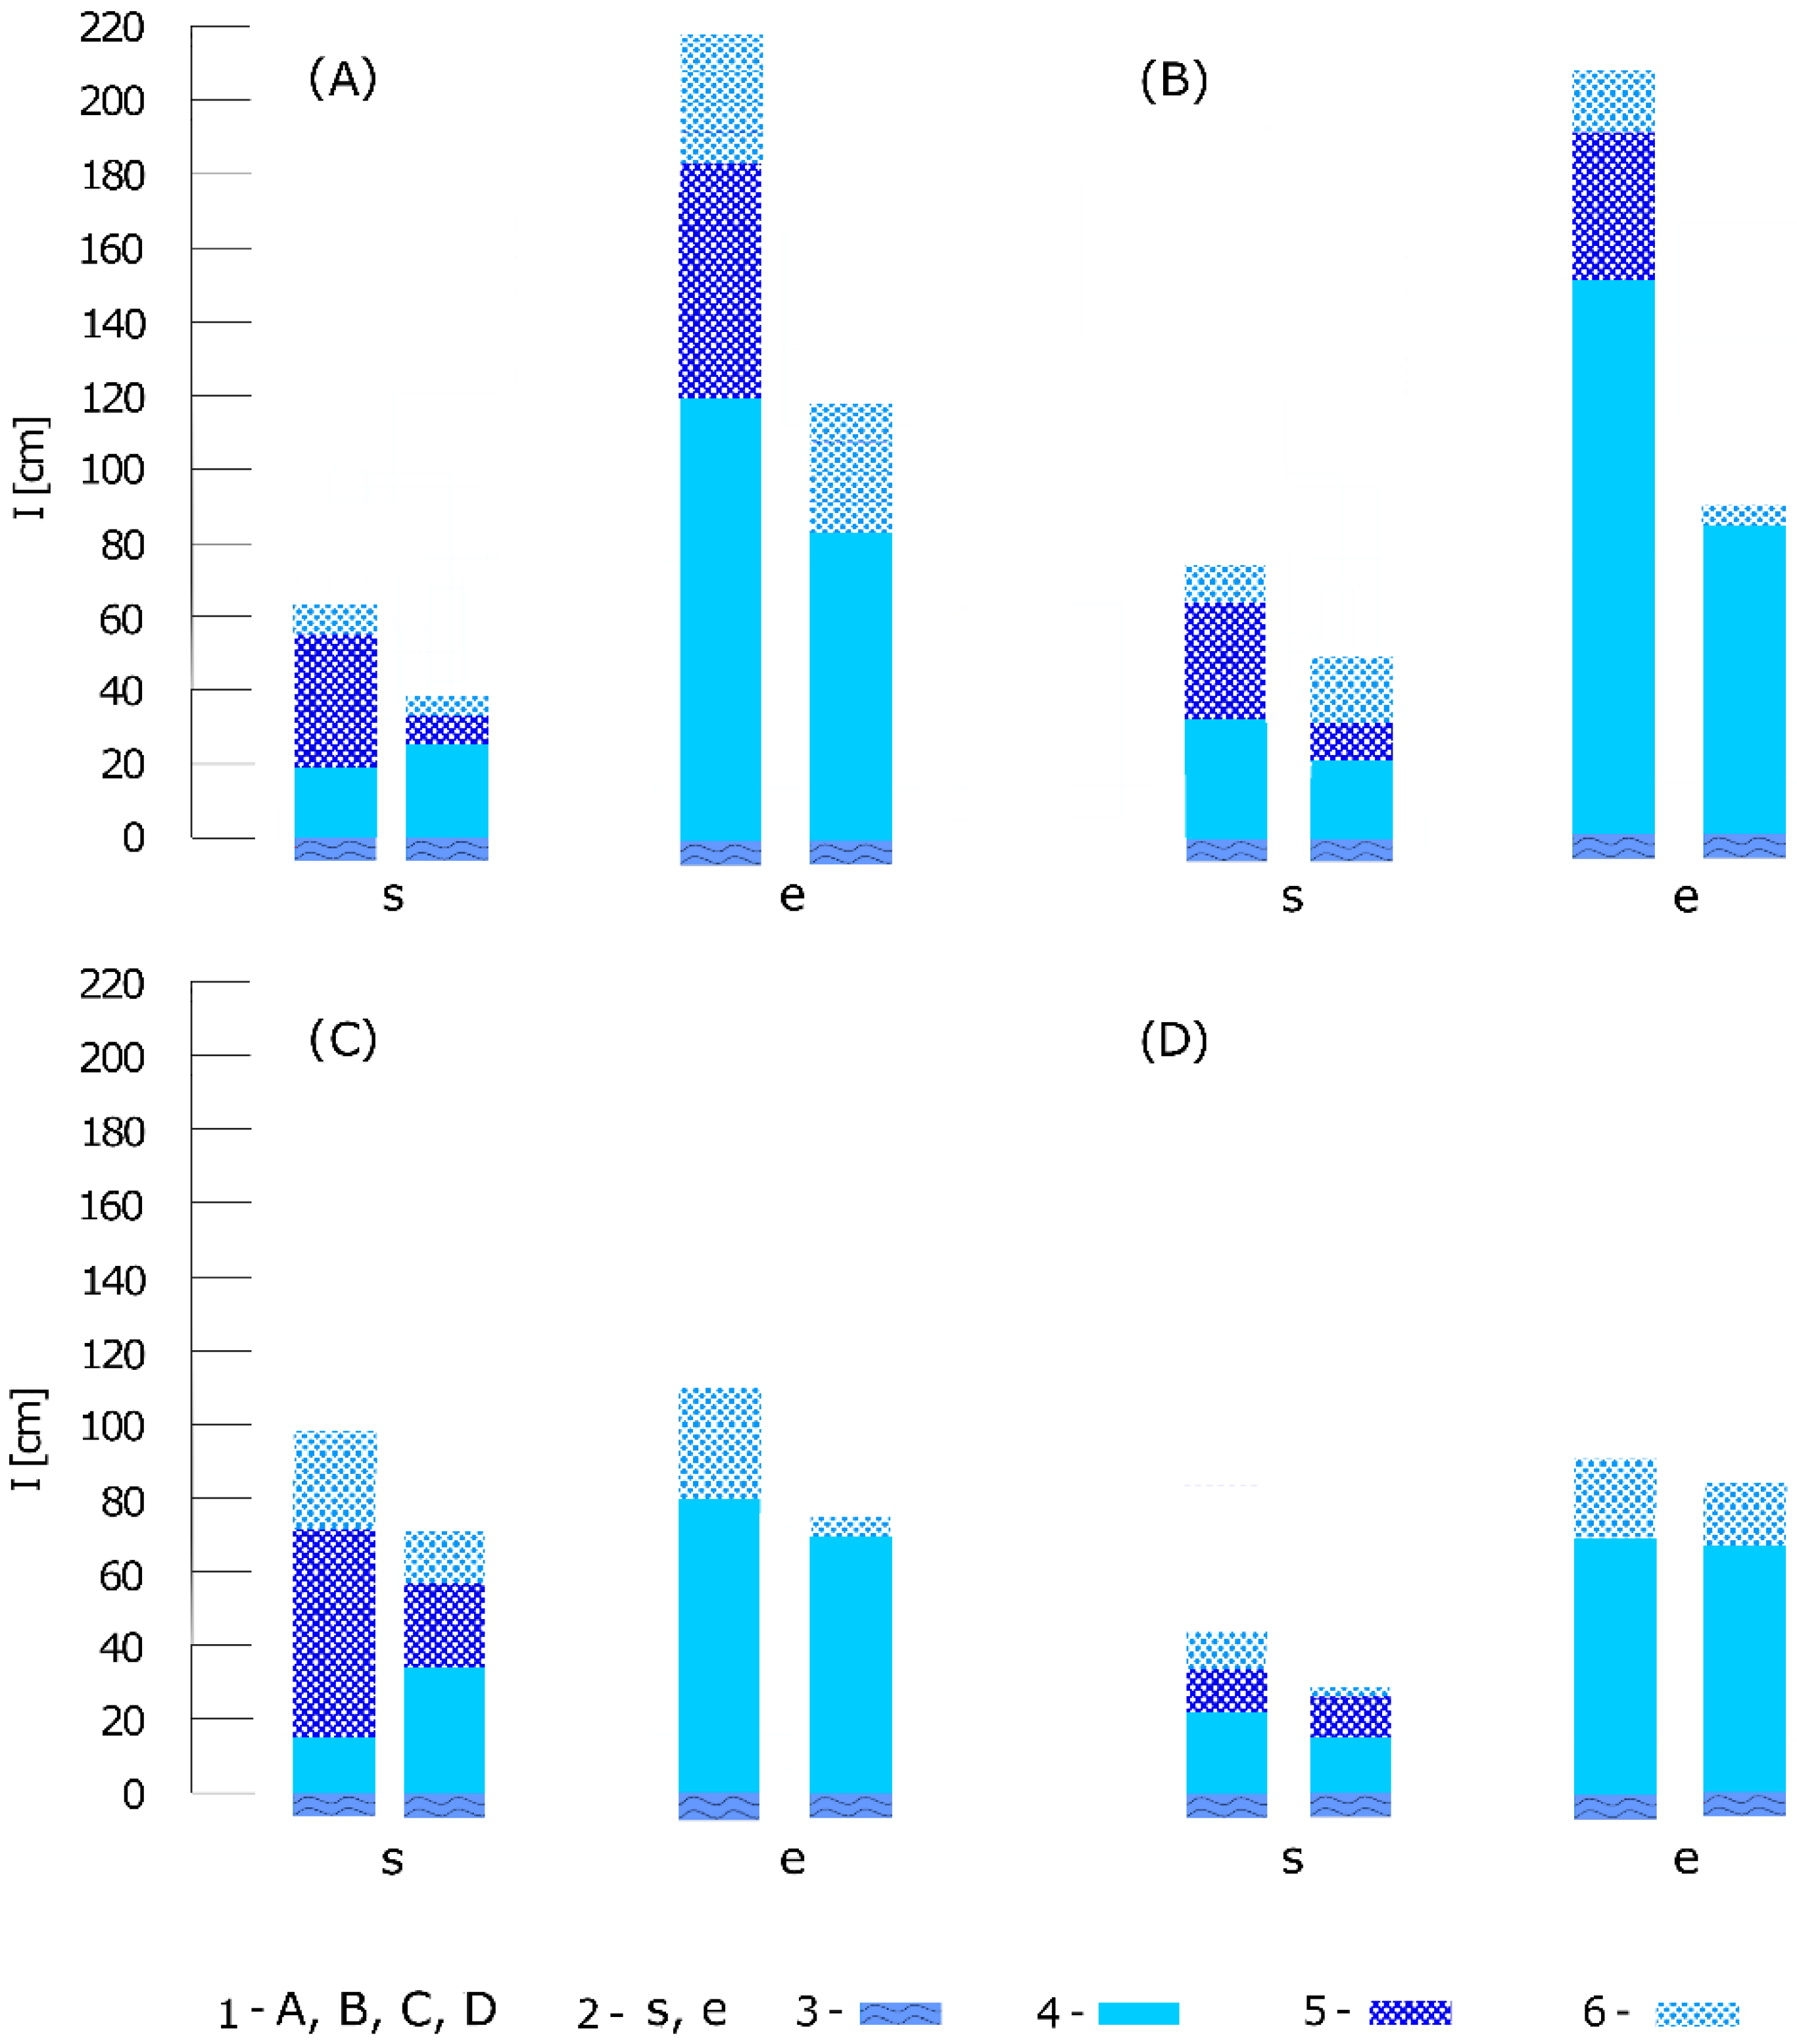
Figure 5). This variability included the ice cover, the presence of snow and slush on its surface, and the entire snow and ice cover (
Table 3).
The variability in the thickness of the ice cover deposited on the Czarny Staw Gąsienicowy at the end of December 2018 amounted to 24.5 cm, with an average ice thickness of 24.5 cm as well. The layer of snow and slush overlying the ice was slightly thicker and also varied significantly. The variability in the thickness of the snow and ice cover, which consisted of a layer of ice and the overlying slush and snow, amounted to 25.0 cm. The thickest ice and snow and slush layers were measured in the southwestern sectors of the lake, and the thinnest in its northeastern part. By the end of the winter season, the variability in ice thickness had increased to 65.0 cm, in the snow and slush layer to 58.0 cm, and in the snow and ice cover to 123.0 cm. At the same time, the spatial pattern recorded at the beginning of the winter season was maintained with respect to the maximum and minimum thicknesses of individual layers and of the entire snow and ice cover. A significant increase in lake ice volume and complete winter ice cover was found during the study season, with an accompanying slight decrease in snow volume. The average maximum ice thickness calculated for 20 holes drilled on 23 March 2019 was 120 cm, while the maximum ice thickness calculated using Stefan’s formula based on data from the closest station (on the Hala Gąsienicowa) was just 46 cm (38% of the measured maximum ice thickness).
The thickness of ice cover on the Czarny Staw pod Rysami at the beginning of the winter season was less varied. The difference between the maximum and minimum ice thickness at the end of December 2018 was 14.0 cm, and the average ice thickness was 22.2 cm. The average thickness of the slush and snow layer deposited on the ice cover was 31.6 cm at that time, and the difference between the maximum and minimum thickness of these layers was 31.5 cm. The variability in snow and ice cover was 26.0 cm at that time. The thickest ice was measured in the northern part of the lake, while slush and snow layers were thickest in its western sectors. Over the course of the winter season, the variability in the thickness of individual layers increased. In March 2019, the variability in ice thickness amounted to 43.0 cm, in snow and slush layer thickness to 68.0 cm, and in snow and ice cover thickness to 106.0 cm. In the maximum and minimum thicknesses of individual layers, the spatial pattern seen at the beginning of the winter season was preserved, similarly as for the Czarny Staw Gąsienicowy. Over the course of the winter, the volume of ice more than quadrupled, the volume of the slush and snow layer almost doubled, and the volume of the snow and ice cover more than tripled. The average maximum ice thickness calculated for 16 holes drilled on 17 March 2019 was 106 cm, while the maximum ice thickness calculated using Stefan’s formula based on data from the closest station (near the Morskie Oko shelter) was just 43 cm (41% of the measured maximum ice thickness).
In December, the variability in ice thickness in the largest lake studied—the Morskie Oko—amounted to 42.0 cm. Average ice thickness at that time was 31.9 cm. The average thickness of the overlying slush and snow layer was 46.4 cm in December and its variability was 55.0 cm. The variability in snow and ice cover thickness at the beginning of the winter season was 27.0 cm. In December, the thickest ice was measured in the southern part of the lake, and the thickest layer of snow accumulated on the ice was recorded in its southwestern part. By the end of the winter season, the variability in ice thickness had decreased to 23.0 cm, in the snow and slush layer to 30.0 cm, and the variability in the snow and ice cover had increased to 40.0 cm. At that time, the thickest ice was measured near the shore in the northern part of the lake, and the thickest slush and snow layer, and snow and ice cover, were measured in the western and northwestern parts of the lake. Over the course of the winter, the volume of ice more than doubled, and the volume of the slush and snow layer more than halved; as a result, the volume of the snow and ice cover increased very little during the season. The average maximum ice thickness calculated for 25 holes drilled on 10 March 2019 was 71 cm, while the maximum ice thickness calculated using Stefan’s formula based on data from the closest station (near the Morskie Oko shelter) was just 43 cm (61% of the measured maximum ice thickness).
The variability in the thickness of the Smreczyński Staw ice cover in December was 8.5 cm, and its average thickness was 20 cm. The average thickness of the overlying slush and snow layer was 19.8 cm and its variability was 5.5 cm. At this stage of ice development, there was also little variability in the thickness of the snow and ice cover in this lake (6.5 cm). The thickness of the various snow and ice cover layers increased during the winter season, and their variability increased as well. By the end of the study season, the variability in ice thickness had increased to 14.0 cm, in the snow and slush layer to 13.0 cm, and in the snow and ice cover to 8.0 cm. The thickest ice both in the first and second measurement series was measured in the northern part of the lake. Spatial variability in the other layers was negligible and did not exhibit significant changes during the winter. During the winter, the ice cover volume increased nearly three and a half times and that of snow and ice cover more than doubled, with little increase observed in the snow and slush layer. The average maximum ice thickness calculated for 15 holes drilled on 3 March 2019 was 69 cm, while the maximum ice thickness calculated using Stefan’s formula based on data from the closest station (on the Polana Chochołowska) was just 37 cm (54% of the thickness measured at the end of the season).
The data collected were the basis for determining the relationship between the thickness of the ice cover and the thickness of the overlying snow and slush layer. The correlation coefficients varied in their magnitudes and directions (
Table 4). In the early part of the winter season, the relationships were inversely proportional, meaning that there was relatively thin ice under a thick snow layer. The magnitude of the correlation coefficients ranged from −0.44 to −0.85 and they were statistically significant for only two of the lakes studied. At the end of the study season, positive correlations were found for three lakes covered by the study. The relationships were statistically significant for three lakes as well.
Based on field observations and satellite image analysis, ice phenomena in the lakes studied first appeared in the second half of November 2018 (
Table 5). The Smreczyński Staw was the first to freeze, and the Morskie Oko the last. A similar situation occurred with respect to the formation of the ice cover. The first lake to be fully covered by ice was the Smreczyński Staw, and the Morskie Oko and Czarny Staw Gąsienicowy were the last. The difference in the appearance of ice was 14 days (Smreczyński Staw—Morskie Oko), and in the formation of a complete ice cover it was 15 days (Smreczyński Staw—Morskie Oko and Czarny Staw Gąsienicowy). In April 2019, the lakes started to thaw. The lake where the ice cover and ice phenomena disappeared first (in the third decade of April) was the Smreczyński Staw. The ice cover and ice phenomena persisted the longest in the Czarny Staw pod Rysami (until the first and second decade of June, respectively). The difference in the time of disintegration of the ice cover was 44 days (Smreczyński Staw—Czarny Staw pod Rysami), and the difference in the time of disappearance of ice was 58 days (Smreczyński Staw—Czarny Staw pod Rysami). Ice phenomena persisted for the longest period on the Czarny Staw pod Rysami (211 days), and for the shortest period on the Smreczyński Staw (158 days). The complete ice cover also persisted the longest on the Czarny Staw pod Rysami (186 days), and the shortest on the Morskie Oko (152 days).
4. Discussion
Snow supply considerably contributed to the development of the ice cover on the lakes studied from the very beginning of the season. Significant drops in daily air temperature during the first part of the winter were accompanied by heavy snowfall. As a result, a thicker layer of snow accumulated on the ice after a permanent continuous ice cover had formed on the lakes. The average thickness of the snow layer overlying the ice at the turn of December and January ranged from a dozen (the Smreczyński Staw) to several dozen centimeters (the other lakes), up to a maximum of almost a meter (the Morskie Oko). Under these conditions, ice accretion from below was limited by the overlying insulating snow layer. In the early part of the winter—about a month after a complete ice cover had formed on the lakes—inverse correlations were found between the thickness of the ice and the thickness of the overlying snow cover in all cases. This indicates that relatively thin ice was measured under a thicker snow cover and, conversely, a thicker ice layer was found under a thinner snow cover. However, it should be noted that these relationships were of moderate magnitude, and they were only statistically significant in two cases. Almost from the beginning of the season, the snow layer overlying the ice was saturated with lake water flowing through cracks in the ice during the formation of the ice cover or the water supplied by numerous streams flowing into the lakes from the surrounding mountain slopes. During the first series of measurements, layers of slush were found in all the water bodies studied. The thickness of these layers exhibited considerable spatial variability, locally accounting for up to 90% of the thickness of snow cover overlying the ice. At the beginning of the season, the thickest slush and snow layers were measured in the southwestern part of the Czarny Staw Gąsienicowy (under the Kościelec face), in the western part of the Czarny Staw Pod Rysami (under the Kazalnica Mięguszowiecka face), and in the southwestern part of the Morskie Oko (slightly to the south of the exit of the Szeroki Żleb (couloir)). However, no significant patterns were found in the case of snow cover on the Smreczyński Staw. At that stage of the winter, the variability in ice thickness ranged from a dozen to several dozen centimeters. The spatial pattern of maximum ice thickness only partially coincided with that of thick snow and slush layers. At the end of the winter season, the thickest ice on the Czarny Staw Gąsienicowy was measured in the southwestern and northwestern parts of the lake (in the area of the Karb pass and under the Kościelec face). Thick snow and slush layers overlying the ice were also recorded in these areas. In the case of the Czarny Staw pod Rysami, both the thickest ice cover and the thickest overlying layers of snow and slush were found in the southwestern part of the lake (below the Kazalnica Mięguszowiecka face). On the other two lakes, the thickest ice cover was found in areas where the ice cover was commonly used by hikers during winter months. In the case of the Morskie Oko, it was the northern part of the lake, and in the case of the Smreczyński Staw the northeastern part. In these areas, layers of snow and slush are trampled by hikers, resulting in faster accretion of snow ice from above. Analyzing the relationships between the individual ice and snow layers, it should be noted that in the case of the Czarny Staw Gąsienicowy and the Czarny Staw Pod Rysami, the correlations were positive and statistically significant, which means that there was thicker ice under a thick layer of snow and slush. An inverse correlation occurred for the Smreczyński Staw, and for the Morskie Oko the correlations were very small and statistically insignificant.
The amount of snow supply and its redistribution by the wind were the main factors affecting the surface variability of ice cover thickness in the Tatra lakes during the study season. Crystalline ice made up just a few percent of ice cover on these lakes, forming primarily during the freezing stage. At subsequent stages of ice cover development, the main factor affecting the increase in ice thickness was the accretion of snow ice from above [
28,
35,
37,
49]. Thus, the uneven distribution of snow resulted in variations in the thickness of the ice formed [
9,
11,
26,
36,
50,
51]. The thickest ice during the winter of 2018/2019 was found in areas where snow drifts had previously accumulated, and the thinnest ice was found in those areas where snow had been blown away. An important factor determining the variability of snow and ice cover thickness on the Czarny Staw Gąsienicowy and Czarny Staw pod Rysami was also the supply of snow from the slopes in the form of smaller or larger avalanches. The greatest snow and ice thicknesses were measured below avalanche tracks, at the points where the snow released from the slopes was deposited [
52]. In the case of the Czarny Staw pod Rysami, it was the southwestern sector of the lake (below the Kazalnica Mięguszowiecka face). On the Czarny Staw Gąsienicowy, it was the western and northwestern fragments of the lake (under the Kościelec face and the Karb pass). In the case of the Morskie Oko, thick snow layers were also found at the exit of the Szeroki Żleb (couloir) both at the beginning and at the end of winter.
During the winter, there was an increase in the volume of ice, and snow and ice, covers as a result of successive snow supplies and the accretion of snow ice from above. This also translated into an increase in the percentage shares of both layers in the total volume of water retained in the studied lakes.
The maximum ice thicknesses modeled using the accumulated freezing degree-day formula were significantly lower than the average maximum ice thicknesses measured in a dozen to several dozen holes in March 2019, ranging from 39% to 61% of the figures measured. The degree of underestimation was the greatest for the ice thickness values obtained for the Czarny Staw Gąsienicowy and the Czarny Staw pod Rysami, where average maximum ice thicknesses were 120 and 106 cm, respectively. Such large discrepancies between the model and the values measured can be explained by the fact that the final thickness of ice on lakes in the Tatras is not determined solely by daily air temperatures during the ice accretion period. In this case, of more importance than significant drops in temperature is the gradual accretion of snow ice from above, which occurs throughout the season whenever temperatures drop even slightly below zero degrees Celsius. During snowy winters, when lake ice is covered by snow from the beginning until the end of the season, the thickness of crystalline ice resulting from accretion from below is only about 10–20% of total ice cover thickness in the lakes studied.
The analysis of materials obtained through remote sensing demonstrates that topographic conditions in the immediate vicinity of the lake are a very important factor affecting ice phenology in mountain lakes. The water freezing rate depended mainly on air temperatures and lake basin capacity, and additionally on the altitude above sea level (the first lake with ice phenomena and with ice cover was the small Smreczyński Staw, and the last one was the Morskie Oko, which is among the largest lakes in the Tatra Mountains). On the other hand, the extent to which the lake basin was shielded from solar radiation during the spring had a major impact on the rate of disintegration of the ice cover and the disappearance of ice phenomena. The impact of other factors on the freezing and thawing of the lakes examined cannot be ruled out either. These include, for instance, sub-ice water circulation (e.g., caused by the outflow of the Rybi Potok creek from the Morskie Oko Lake), the inflow of water from screes that are in contact with lake shores, the feeding of lake basins by potential springs in their bottom, and changes in insolation, understood not just as the effect of the shadows cast, but also arising from differences in cloud cover [
27,
29,
30]. Both ice cover and ice phenomena persisted the longest in the Czarny Staw pod Rysami and Czarny Staw Gąsienicowy. Ice was present on these lakes until the second decade of June despite the fact that mean daily air temperatures had been positive, with a few cooler days, since early April. Only after, respectively, 59 and 54 days with positive mean daily temperature values ice disappeared from the Czarny Staw pod Rysami and Czarny Staw Gąsienicowy. On those lakes that were less shielded from solar radiation and situated slightly lower, the ice cover disintegrated much quicker and ice phenomena receded earlier. In the Smreczyński Staw and the Morskie Oko, ice disappeared after 19 and 30 days with positive mean daily air temperatures, respectively.
5. Conclusions
The variability in the thickness of the ice, and snow and ice, covers formed on the lakes studied during the winter of 2018/2019 resulted from differences in daily air temperatures and precipitation patterns. The higher the lake was, the thicker ice formed on it, which was also associated with a greater supply of snow. Lakes at higher elevations also exhibited greater spatial variability in the thickness of the ice and of the overlying snow and slush layers.
The magnitude of, and spatial variation in, snow supply were identified as the main factors influencing the spatial variability in ice thickness. In nival-aeolian accumulation areas, thicker ice, and snow and ice, covers formed as a result of accretion from above. An additional factor contributing to a local increase in snow and (subsequently) snow and ice layer thickness was the supply of snow from the slopes in the form of avalanches of various magnitudes.
The maximum ice thicknesses actually measured at the end of the winter season far exceeded the maximum values obtained from modeling using Stefan’s formula, which was due to the peculiar ice cover development processes. Ice covers on Tatra lakes develop primarily as a result of ice accretion from above even when air temperatures drop only slightly below 0 °C.
The rate of freezing of the lakes studied depended on air temperatures in their vicinity, the capacity of the lake basin and the altitude above sea level at which the basin is located. The rate of disappearance of ice was dictated by the extent to which the lake basin was shielded from solar radiation and the elevation of the basin. In lakes shaded by rock faces (the Czarny Staw pod Rysami and the Czarny Staw Gąsienicowy), ice phenomena persisted for more than 50 days with positive air temperatures.


