1. Introduction
The oxygen transfer of fine-bubble aeration systems is enhanced by a high salt concentration (
cSalt; g/L) due to the inhibition of bubble coalescence. In former studies, we assessed the different factors influencing the oxygen transfer in saline water (SW) [
1,
2,
3]. In the present study, we investigate the transferability of these SW test results to process conditions in saline-activated sludge (sAS).
A high
cSalt is quite common in industrial wastewater. Additionally, the global trend towards saving freshwater by increased (industrial)-wastewater reuse or by using seawater for toilet flushing would raise the volume of saline wastewater that needs to be biologically treated [
3,
4]. The most prevalent process for aerobic biological wastewater treatment is the activated sludge process. Aeration is usually the most energy intensive part of the activated sludge process, accounting for 50 to 80% of the total energy requirement [
5]. To ensure a high aeration efficiency, it is mandatory that all parameters affecting oxygen transfer be considered in the design process. Therefore, a deeper understanding of the effects on the oxygen transfer of an increased
cSalt is crucial to enhance the energy efficiency of the activated sludge process.
Aeration in the aerobic biological wastewater treatment is essential to satisfy the oxygen demand of microorganisms in activated sludge [
5]. Today, mainly fine-bubble aeration systems are used in wastewater treatment plants (WWTPs). Thereby, compressed air is injected via diffusers installed at the bottom of the aeration tank. The oxygen is transferred from the ascending small bubbles into the liquid phase. The oxygen transfer is described by the volumetric mass transfer coefficient (
kLa; 1/h), which represents the product of the liquid-side mass transfer coefficient (
kL; m/h) and the liquid/gas interfacial area (
a; m
2/m
3). Many different factors influence the
kLa. In order to describe these effects, usually, the
kLa under process conditions is set in relation to the
kLa in tap water (TW) at standard conditions (20 °C water temperature; 0 mg/L dissolved oxygen concentration; 101.3 kPa atmospheric pressure; see
Table 1). Depending on the aerated medium, the quotients are labelled differently. In the following, we distinguish between
α (for aerating non-saline-activated sludge),
fS (for aerating saline water) and
αfS (for aerating saline-activated sludge).
In non-saline-activated sludge (AS), the
kLa is inhibited with dissolved and suspended contaminants and the biomass itself, which is why
α is usually <1.0. The prediction of
α in dependence of different parameters (e.g., wastewater contaminants and process parameters) has been the objective of many studies [
6,
7,
8]. Since the wastewater composition is subject to daily fluctuations, common practice in the design of aeration systems currently ensures necessary flexibility determining the minimum
αmin and maximum
αmax [
9]. The mean
α (
αmean) has been adopted to evaluate the aeration efficiency.
In SW, the
kLa increases with an increasing
csalt due to the inhibition of bubble coalescence. Hence,
fS takes values greater than 1.0 and increases linearly with an increasing
csalt. The increase in
fS depends on the airflow rate, type of diffuser and design of diffuser membrane [
2]. When the
cSalt reaches a certain concentration, which is specific for each salt and mixed salt solution, the coalescence is fully inhibited and
fS reaches its maximum (
fS,max) [
1]. This is termed the critical coalescence concentration (
CCC) [
10].
In sAS, the inhibiting effects of wastewater and AS ingredients as well as the enhancing effect of an increased salt concentration affect the
kLa. Therefore, depending on the balance between the inhibiting (described by
α) and enhancing (described by
fS) effects,
αfS can assume values of >1.0 or <1.0. Sander et al. [
3] ran oxygen transfer tests with iron hydroxide flocs to simulate activated sludge with different NaCl concentrations. They showed that the net effect can be expressed via multiplicative linking of
α and
fS:
Our previous studies showed that in SW,
fS,max as well as the maximum
kLa were higher with a small slit membrane design than one with large slits [
1]. For disc diffusers, the
kLa increases by 10% when using the small slit diffuser membrane design compared with diffusers with the large slit design [
2]. However, the improved
kLa is accompanied by an increased diffuser pressure drop (due to the smaller slits) and, therefore, by a higher energy requirement for air supply. Nevertheless, model calculations based on SW test results show that the aeration efficiency improves due to the higher oxygen transfer [
2].
However, it is questionable whether this also applies to process conditions in sAS. The activated sludge or wastewater ingredients could influence the coalescence behaviour in the aeration tank as well as the fouling of the diffusers. Therefore, in the present study we aim to investigate whether the use of diffusers with smaller slits also improves aeration in sAS. For this purpose, we operated a pilot-scale activated sludge tank with a water volume of 2.25 m3 and a depth of submergence of the diffusers of 3.5 m over 269 days with an industrial wastewater influent and measured the oxygen transfer continuously with the off-gas method. The time of operation was divided into four measurement phases. In each phase, we installed a new diffuser. With the corresponding TW results, αfS was calculated. In parallel, we recorded the pressure drop of the diffusers and the overall performance of the pilot plant.
We use the results to assess a modified design approach for considering the salt effect on the oxygen transfer. The new design approach enables a more precise design and, thus, a more energy efficient operation of an aeration system at high salt concentrations. The current design approach described by Sander et al. [
3] is only applicable for municipal wastewater with a high sea salt concentration. Therefore, it could not be used for the industrial wastewater of the present study, which shows another salt mixture than sea salt. Furthermore, the influence of the diffuser membrane design is not taken into account in the current design approach. Our modified design approach normalizes the effect of different salts and mixed salt solutions on the
kLa. Therefore, it is applicable for each coalescence inhibiting salt or mixed salt solution. Additionally, we show how the influence of the membrane design can be assessed by conducting simple SW tests with the diffusers used for aerating sAS.
2. Materials and Methods
2.1. Modified Design Approach for Considering Salt Effect on kLa
In order to design an aeration system as efficiently as possible, the individual influences must be considered as precisely as possible. The
fS value includes the salt effect on
kLa (see
Table 1). Sander et al. [
3] found a correlation between
fS of disc diffusers and concentration of sea salt (
cSeaSalt; g/L) and the critical coalescence concentration of sea salt (
CCCSeaSalt; g/L):
where
k is an empirical parameter between 0.08 and 0.16 depending on the airflow rate per disc diffuser (
qA,Disc; m
3/Disc/h). However, this approach is only valid for sea salt and does not consider the different
CCCs of different salts or salt mixtures. Therefore, we proposed to normalize salt effect by including the dimensionless ratio of
cSalt and the corresponding
CCC (
cSalt/
CCCSalt; -):
The normalised k-value (
kN; -) describes the slope of the linear increase in
fS until
cSalt/
CCCSalt = 1.0 and
fS reaches
fS,max. Since only the diffuser membrane design and
qA,Disc affects
fS,max or bubble diameter, but not the salt type [
2,
11,
12,
13], it is reasonable that solutions of different salts and salt mixtures with the same
cSalt/
CCCSalt ratio and aerated with the same diffuser would present similar
fS values. Other studies already showed the advantages of using a dimensionless concentration as independent parameter for analyses of hydrodynamics and oxygen transfer with different salt solutions in bubble columns [
13,
14,
15].
Because the salt type has no effect on fS,max, kN can be derived with Equation (6) by measuring fS,max of the diffuser used for aerating sAS in any salt solution. For fS,max determination, we recommend to use NaCl, because it is cheap and easy to handle. It must be noted that fS,max is affected by diffuser type and design of diffuser membrane. For disc and plate diffusers fS,max is also affected by qA,Disc or the airflow rate per plate (qA,plate; m3/Plate/h), respectively. Therefore, the test conditions should be the same as process conditions (same diffuser and in case of plate and disc diffusers the same qA,Disc or qA,Plate, respectively).
Behnisch et al. [
2] measured
fS values of different diffusers in a NaCl solution and checked whether there was a scale effect. They concluded that for measuring
fS,max a sufficient reactor volume as well as blower capacity is necessary, to ensure that the full range of airflow rate of diffusers can be set during the tests. Neither diffuser density nor water depth showed an influence on
fS [
2,
16]. From Equation (6) and with known
fS,max value and
cSalt/
CCCSalt = 1.0 resulted in:
Because of the influence of air-flow rate on
fS,max in case of plate and disc diffusers, for these diffuser types, the
kN value is identical for each salt and mixed salt solution, as long as the airflow rate remains constant. For tube diffusers,
kN is constant all the time, because there is no influence of the airflow rate on
fS within the operation range specified by the manufacturer [
2].
To consider the salt effect with Equation (6),
CCC of the given salt solution or wastewater must be determined. An analytical approach is described by Behnisch et al. [
2]. They measured
CCC of different salts in lab-scale as well as in pilot-scale setup by evaluating the oxygen transfer at different salt concentrations, and showed that there was no scale effect in determining
CCC. Therefore,
CCC measuring can be carried out in a small bubble column. For measuring the coalescence behaviour of saline wastewater, Zlokarnik [
17] proposed to use biologically treated wastewater. Otherwise, the wastewater ingredients would falsify the results. If biologically treated wastewater is not available, we recommend to use of a salt mixture with a similar salt composition for the tests.
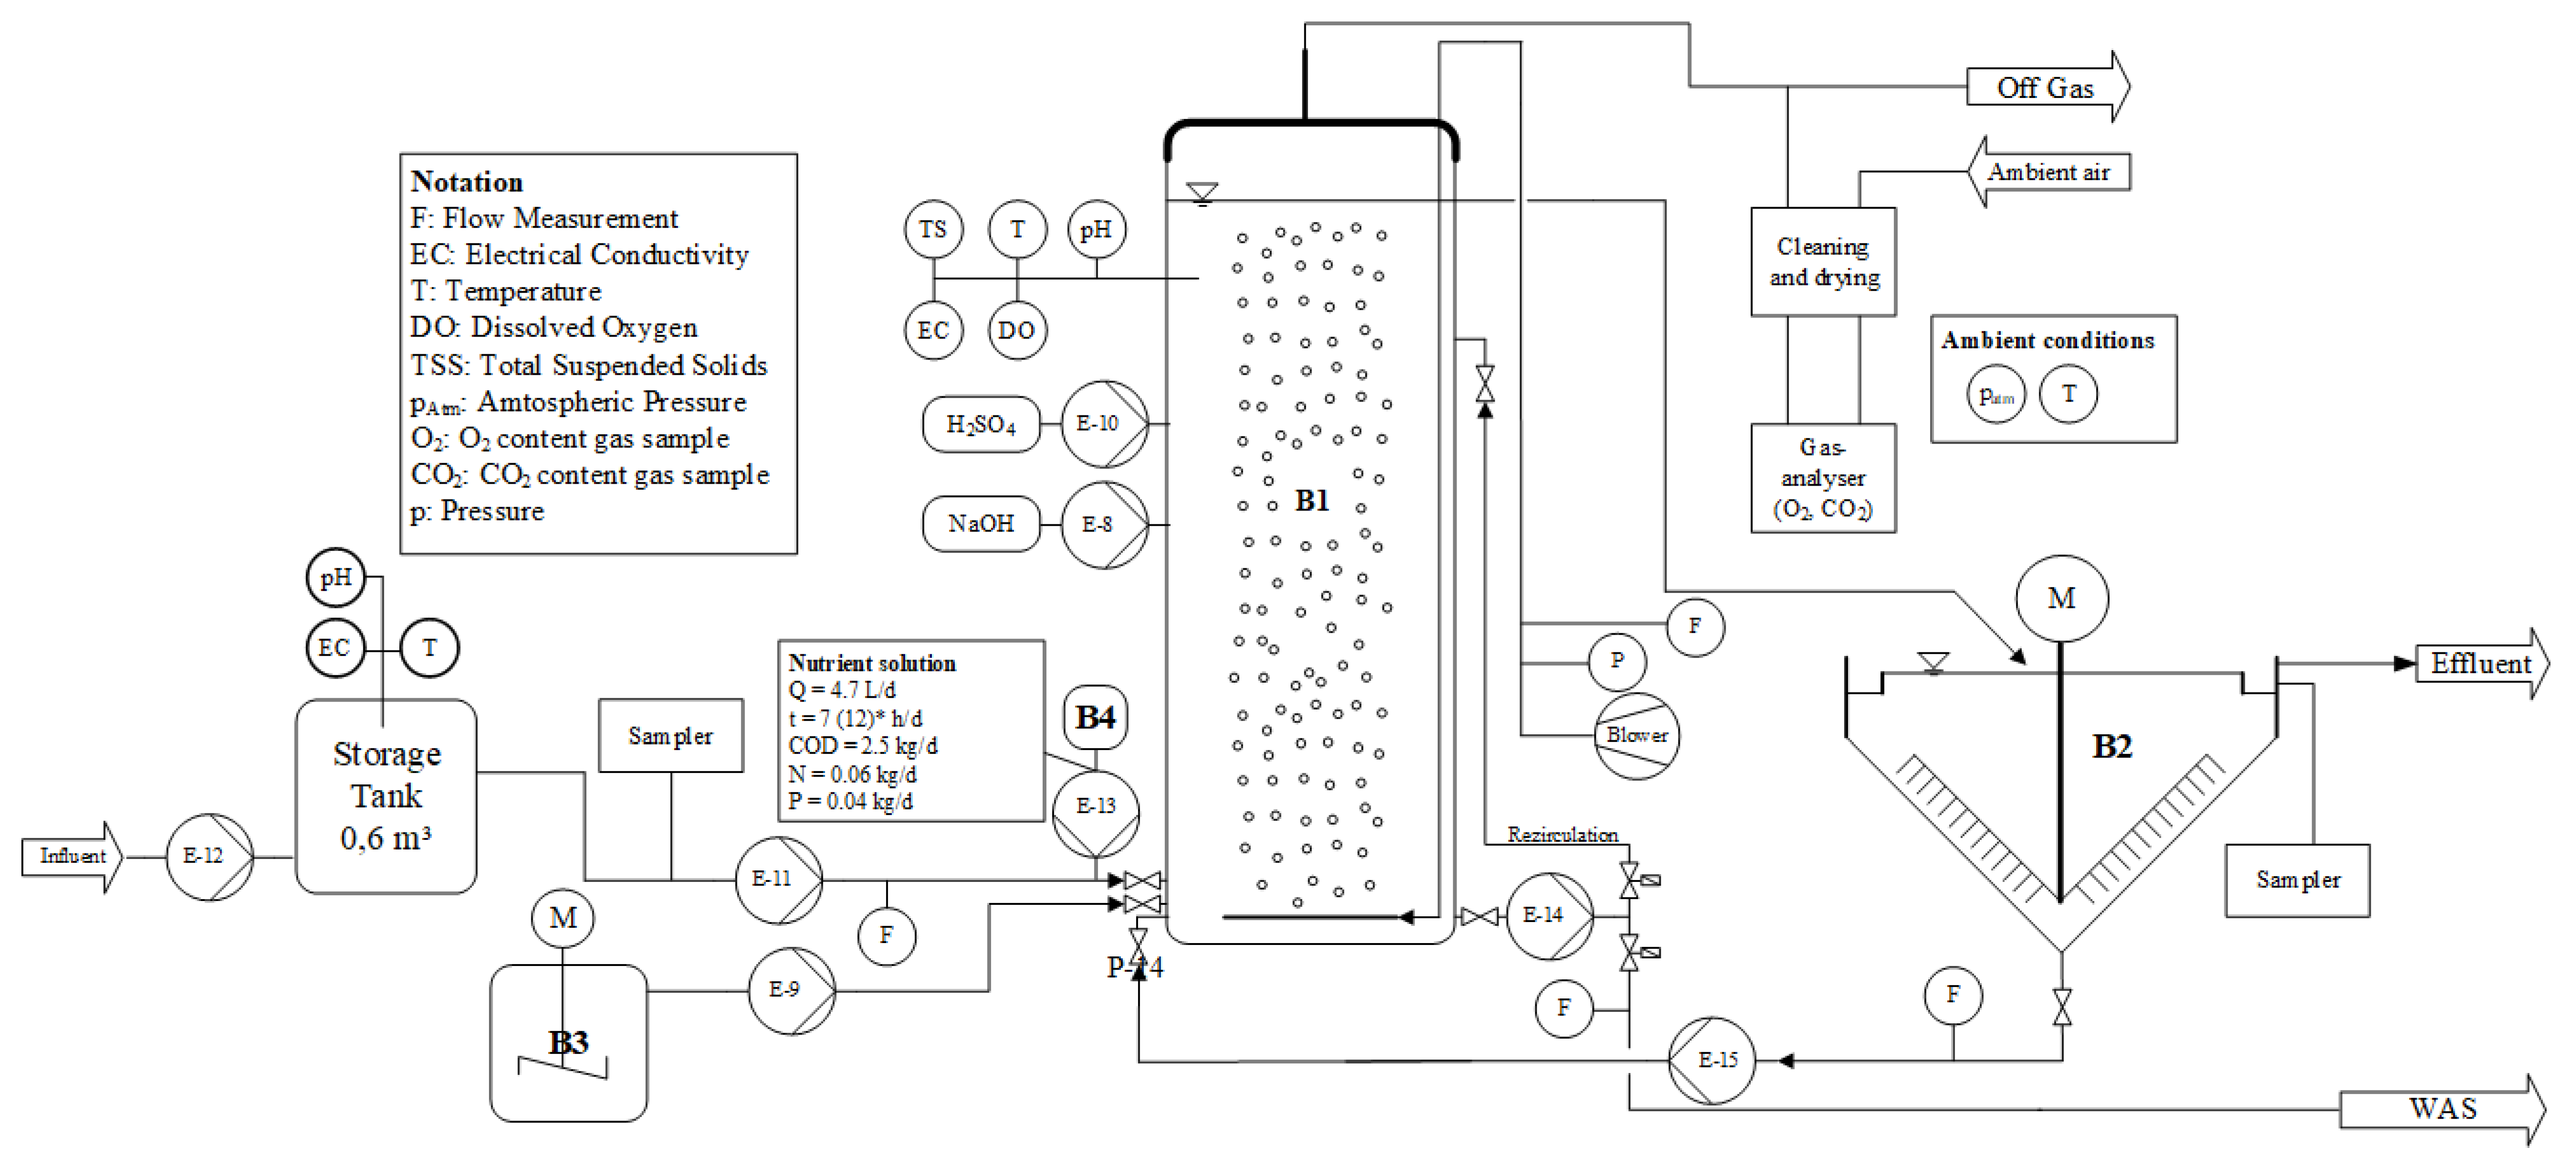
2.2. Pilot Plant
Figure 1 shows a scheme of the pilot-scale activated sludge test plant. The inflowing industrial wastewater consisted of a mixed effluent combining the wastewater generated by the various production lines of an industrial site. The main product of the industrial site was colour effect pigments, which are used, e.g., in paints for cars.
The influent was collected from grit chamber effluent of a WWTP treating the wastewater of the industrial site. It was stored for approximately 3 h in a 0.6 m3 tank before it entered the aerated biological reactor (B1). The storage tank was equipped with online probes (CPS16D, CLS50D, Endress + Hauser, Reinach, Switzerland) for pH (-) and electrical conductivity (EC; mS/cm). Then, 24 h composite samples were taken from influent before it entered B1. The 24 h composite samples were analysed by standard kit (Merck-Spectroquant, Merck KGaA) for total COD concentration (CODt), filtrated COD (CODf), ammonia, nitrate, nitrite and phosphorous. Despite the small storage tank, the influent to B1 was subject to strong concentration fluctuations, as can be seen from the high standard deviation values of analysed chemical parameters: 334 ± 295 mg/L CODt; 119 ± 237 mg/L CODf; 3.5 ± 5.8 mg N/L of ammonia and 1.0 ± 1.84 mg P/L of phosphorous. The influent contained neither nitrate nor nitrite. In contrast to the chemical parameters, EC was relatively stable at 10.1 ± 1.1 mS/cm.
B1 was a completely closed cylindrical tank with a diameter of 0.88 m, a water depth of 3.7 m and a water volume (VB1) of 2.25 m3. The reactor was equipped with one disc diffuser at the bottom of the tank with a depth of submergence of 3.5 m. A recirculation pump assisted in the mixing of the tank and pumped 2.5 m3/h from the bottom to the top of B1 continuously. Several online probes (CUS51D, CPS16D, CLS50D and COS61D, Endress + Hauser, Reinach, Switzerland) in the reactor measured total suspended solids (TSS), pH, EC and dissolved oxygen concentration (DO), respectively. All probes were checked and cleaned every two days. TSS probe was regularly compared with laboratory analysis. To increase the salt concentration in B1, a highly concentrated NaCl solution could be dosed from fully mixed tank B3.
The activated sludge was separated from the treated wastewater in the secondary clarifier (B2) and returned to B1. A 24 h composite sample of the clarified effluent was taken and analysed in the same way as the sample from the influent. The sludge retention time (
SRT; d) was set at approx. 11 d by daily withdrawal of 0.2 m
3 (
QWAS; m
3/d) waste-activated sludge (WAS) from B1. Taking sludge direct from the fully mixed aerated reactor had the advantage that the sensitive and time-consuming measurement of
TSS of WAS is not necessary. Therefore,
TSS in B1 and
TSS of
QWAS was the same and SRT could easily be calculated according to:
Inoculum biomass was taken from an industrial nitrifying activated sludge plant. EC of inoculum was 8.7 mS/cm. Thus, the biomass was already acclimatised to increased salt concentrations. Daily withdrawal of WAS started 26 days after inoculation. After another 100 days of start-up period, off-gas measurements were initiated and took 143 days.
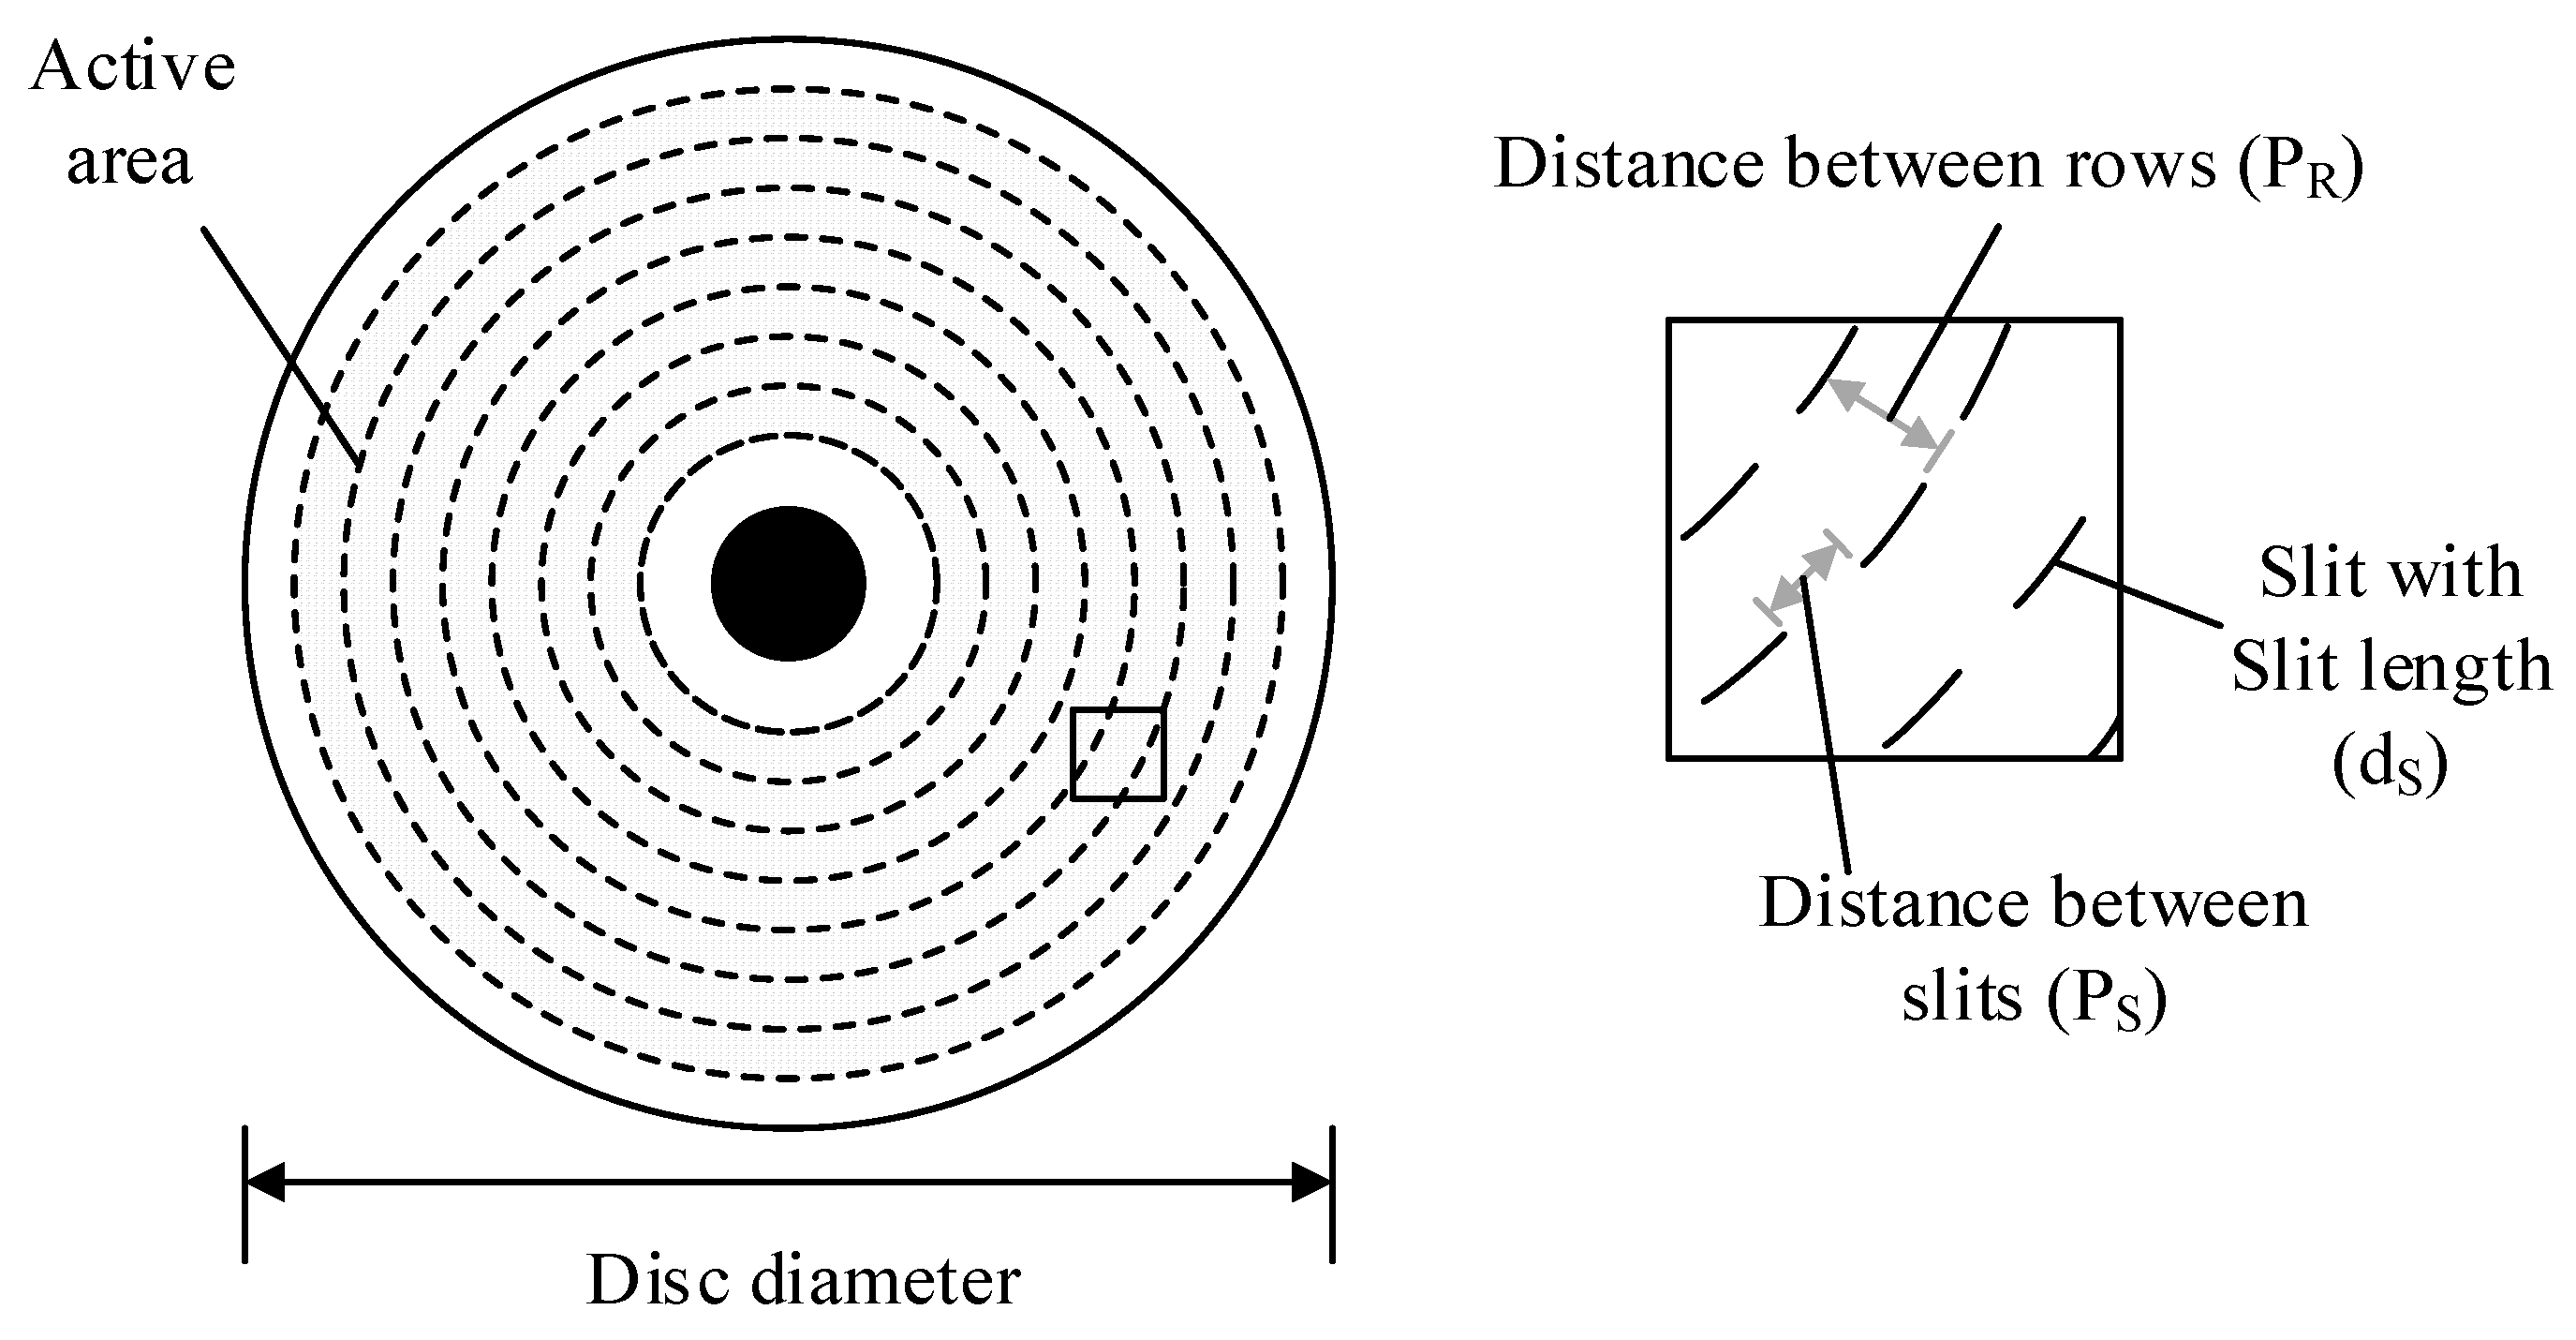
2.3. Disc Diffuser
The used disc diffusers had two different membrane designs (
Table 2 and
Figure 2). As previously shown [
1,
2], the membrane design influences the oxygen transfer in SW. The two different diffuser membrane designs differed in length of the slits (
dS), distance between slits (
PS), distance between rows (
PR) and slit density (
SD). The slit density is defined as the number of slits per activated (perforated) membrane area (
AA). The diffuser density (
DD) is the total membrane area (including non-perforated area) per area of the tank floor of B1. All installed diffusers were 28.5 cm in diameter, resulting in a DD = 10%.
2.4. Desorption Method in Tap Water
Before inoculation, oxygen transfer tests in TW with all tested disc diffusers in B1 were conducted by means of the desorption method [
18]. With this method, the oxygen concentration was increased 15–20 mg/L beyond the oxygen saturation concentration by aerating with pure oxygen gas or oxygen-enriched air [
19]. By switching to aeration with ambient air, the oxygen concentration started to decrease again until the saturation concentration was reached. From the curve of decreasing oxygen concentration, the
kLa was calculated with nonlinear regression.
Because oxygen probes in B1 are not suitable for use at very high
DO values (>20 mg/L), four electrochemical oxygen probes (COS51D, Endress + Hauser, Reinach, Switzerland) were installed at different heights in B1 during TW oxygen transfer tests. The resulting
kLa values were standardized to 20 °C water temperature and a
cSalt of 1 g/L (
kLa20,1000), according to EN 12255-15 [
18]. Airflow rate (
QA) was measured at standard temperature and pressure (0 °C; 101.3 kPa; 0% humidity) with a thermal flow sensor (t-mass A 150, Endress + Hauser, Reinach, Switzerland).
2.5. Off-Gas and Pressure Drop Measurement in Saline-Activated Sludge
The
kLa in saline-activated sludge was measured with the off-gas method [
6,
7,
20,
21]. For this purpose, gas samples of off-gas and ambient air were collected continuously in parallel, and analysed for volumetric fraction of O
2 and CO
2 in a gas analyser (X-Stream X2, Emerson, St. Louis, MO, USA) which was calibrated weekly. Before entering the analyser, gas samples were cleaned and dried (CSS-V2, M & C TechGroup, Ratingen, Germany). According to Equation (3),
αfS resulted from the ratio of
kLa in sAS to
kLa in TW. As before during oxygen transfer tests in TW,
QA was measured at standard conditions with a thermal flow sensor (t-mass A 150, Endress + Hauser, Reinach, Switzerland). The total air supply pressure (
pT; kPa) was measured with manometer (PMC21, Endress + Hauser, Reinach, Switzerland) installed downstream of the blower. Pressure drop of the disc diffusers (
pD; kPa) was calculated with the following equation [
22]:
with
ph being the hydrostatic pressure resulting from depth of submergence (=3.5 m) and
pS the pressure of pipes and valves (=0.3 kPa).
Due to the high oxygen transfer and the relatively weak pollution of the influent, the
DO in B1 was between 7 and 8 mg/L. This was too high when using the off-gas method, where
DO is limited to 50% of the oxygen saturation concentration due to the increasing uncertainty of the results [
20]. Therefore,
QA had to be reduced to the minimum airflow rate of the used diffusers given by the manufacturer (=1.5 m
3/h). Nevertheless,
DO was still too high. Therefore, we increased the oxygen uptake rate (
OUR) by dosing a high nutrient solution from an additional tank (B4). The nutrient solution consisted of glycerol as carbon source, ammonium hydrogen carbonate as nitrogen source and dipotassium phosphate as phosphorus source. Glycerol is considered to be readily biodegradable and has almost no influence on oxygen transfer even at relatively high concentrations of up to 10 vol.% [
23]. The maximum glycerol concentration was less than 0.3 vol.%. An influence of the nutrient solution on the oxygen transfer could, therefore, be excluded. The nutrient solution was only dosed during a few hours of the day (mostly at night). In the absence of dosing, DO increased >50% of saturation concentration and data collected during this time were discarded.
2.6. Description of Test Phases
An overview for the different test phases together with the individual notation of the disc diffusers are given in
Table 3. The period of oxygen transfer measurement took 143 days and consisted of four phases (I–IV). For operational reasons, the off-gas measurement had to be interrupted for 45 days between Phase II and III. The operation of the pilot plant continued during this time. In Phase II and Phase III, a disc diffuser with diffuser membrane design Type A, and in Phase I and IV a disc diffuser with diffuser membrane design Type B was installed (see
Section 2.3.). In each phase, a new diffuser was installed. In the following, the notation of the different disc diffusers includes the number of the test phase (I, II, III and IV) and the length of slits (0.75 mm and 1.25 mm); e.g.,
Disc I (1.25) means the disc diffuser from Phase I with a slit length of 1.25 mm. Besides the different membrane designs, the type of additional salt dosage varied between the test phases. In Phase I and II, the salt was dosed as a shock load. The influent was turned off and salt dosage from B3 started for 48 h. After salt dosage, the influent restarted. During the time, withdrawing of WAS and dosage of the nutrient solution continued. In Phase III and IV, the dosage of salt was carried out continuously. In order to reduce the required amount of NaCl, the influent flow rate was reduced to 110 L/h during time of NaCl dosage.
2.7. Measurement of Salt Concentration
The salt concentration was measured with ion analyses according to APAH [
24]. For this purpose, samples from B1 were regularly taken and were filtrated to 0.45 μm. The samples were analysed for major anions (Na
+, K
+, Mg
2+, Ca
2+, Fe
2+ and P
+) and cations (Cl
− and SO
42−) with ionic chromatography (IC; 930 Compact IC Flex, Metrohm, Switzerland) and inductively coupled plasma optical emission spectrometry (ICP-OES; Spectro Arcos, Spectro Analytical Instruments, Germany) according to ISO 10304-1 [
25] and ISO 11885 [
26]; carbonate hardness (MQuant 1.10648.0001; Merck KGaA) and electric conductivity (CLS50D, Endress + Hauser, Reinach, Switzerland). Since such analyses can easily yield incorrect results due to impurities or measurement errors, we carried out anion–cation balance of every sample. In total, 79% of our analysed samples showed an anion–cation difference of less than ±5% and, therefore, fulfilled the criterion for acceptance according to APAH [
24]. Results that missed the criterion of acceptance were discarded.
3. Results and Discussion
In the following, first we presented the results of the ion analyses of the industrial wastewater. With the given results, we show which ions were present in the industrial wastewater and proved the linearity between
EC and
cSalt. Then, we showed how the
kN,
fS and
CCC were found exemplarily for the present disc diffusers and industrial wastewater salt mixture in order to assess the salt effect on the oxygen transfer. The results of previous tap water oxygen transfer tests are shown in
Section 3.3. To give an overview of the overall operation performance of the pilot plant, the most important operation parameters are listed and discussed in
Section 3.4. In
Section 3.5., the results of the off-gas and pressure drop measurements are discussed in the context of the
EC, airflow rate and
COD F/M ratio. The calculated
α values are discussed in
Section 3.6. To assess whether a small slit design is recommended in saline conditions, we finally compared standard oxygen transfer rate in process water (
SOTRPW; kg/h) and the aeration efficiency (
AE; kg/kWh) of both diffuser membrane designs in
Section 3.7.
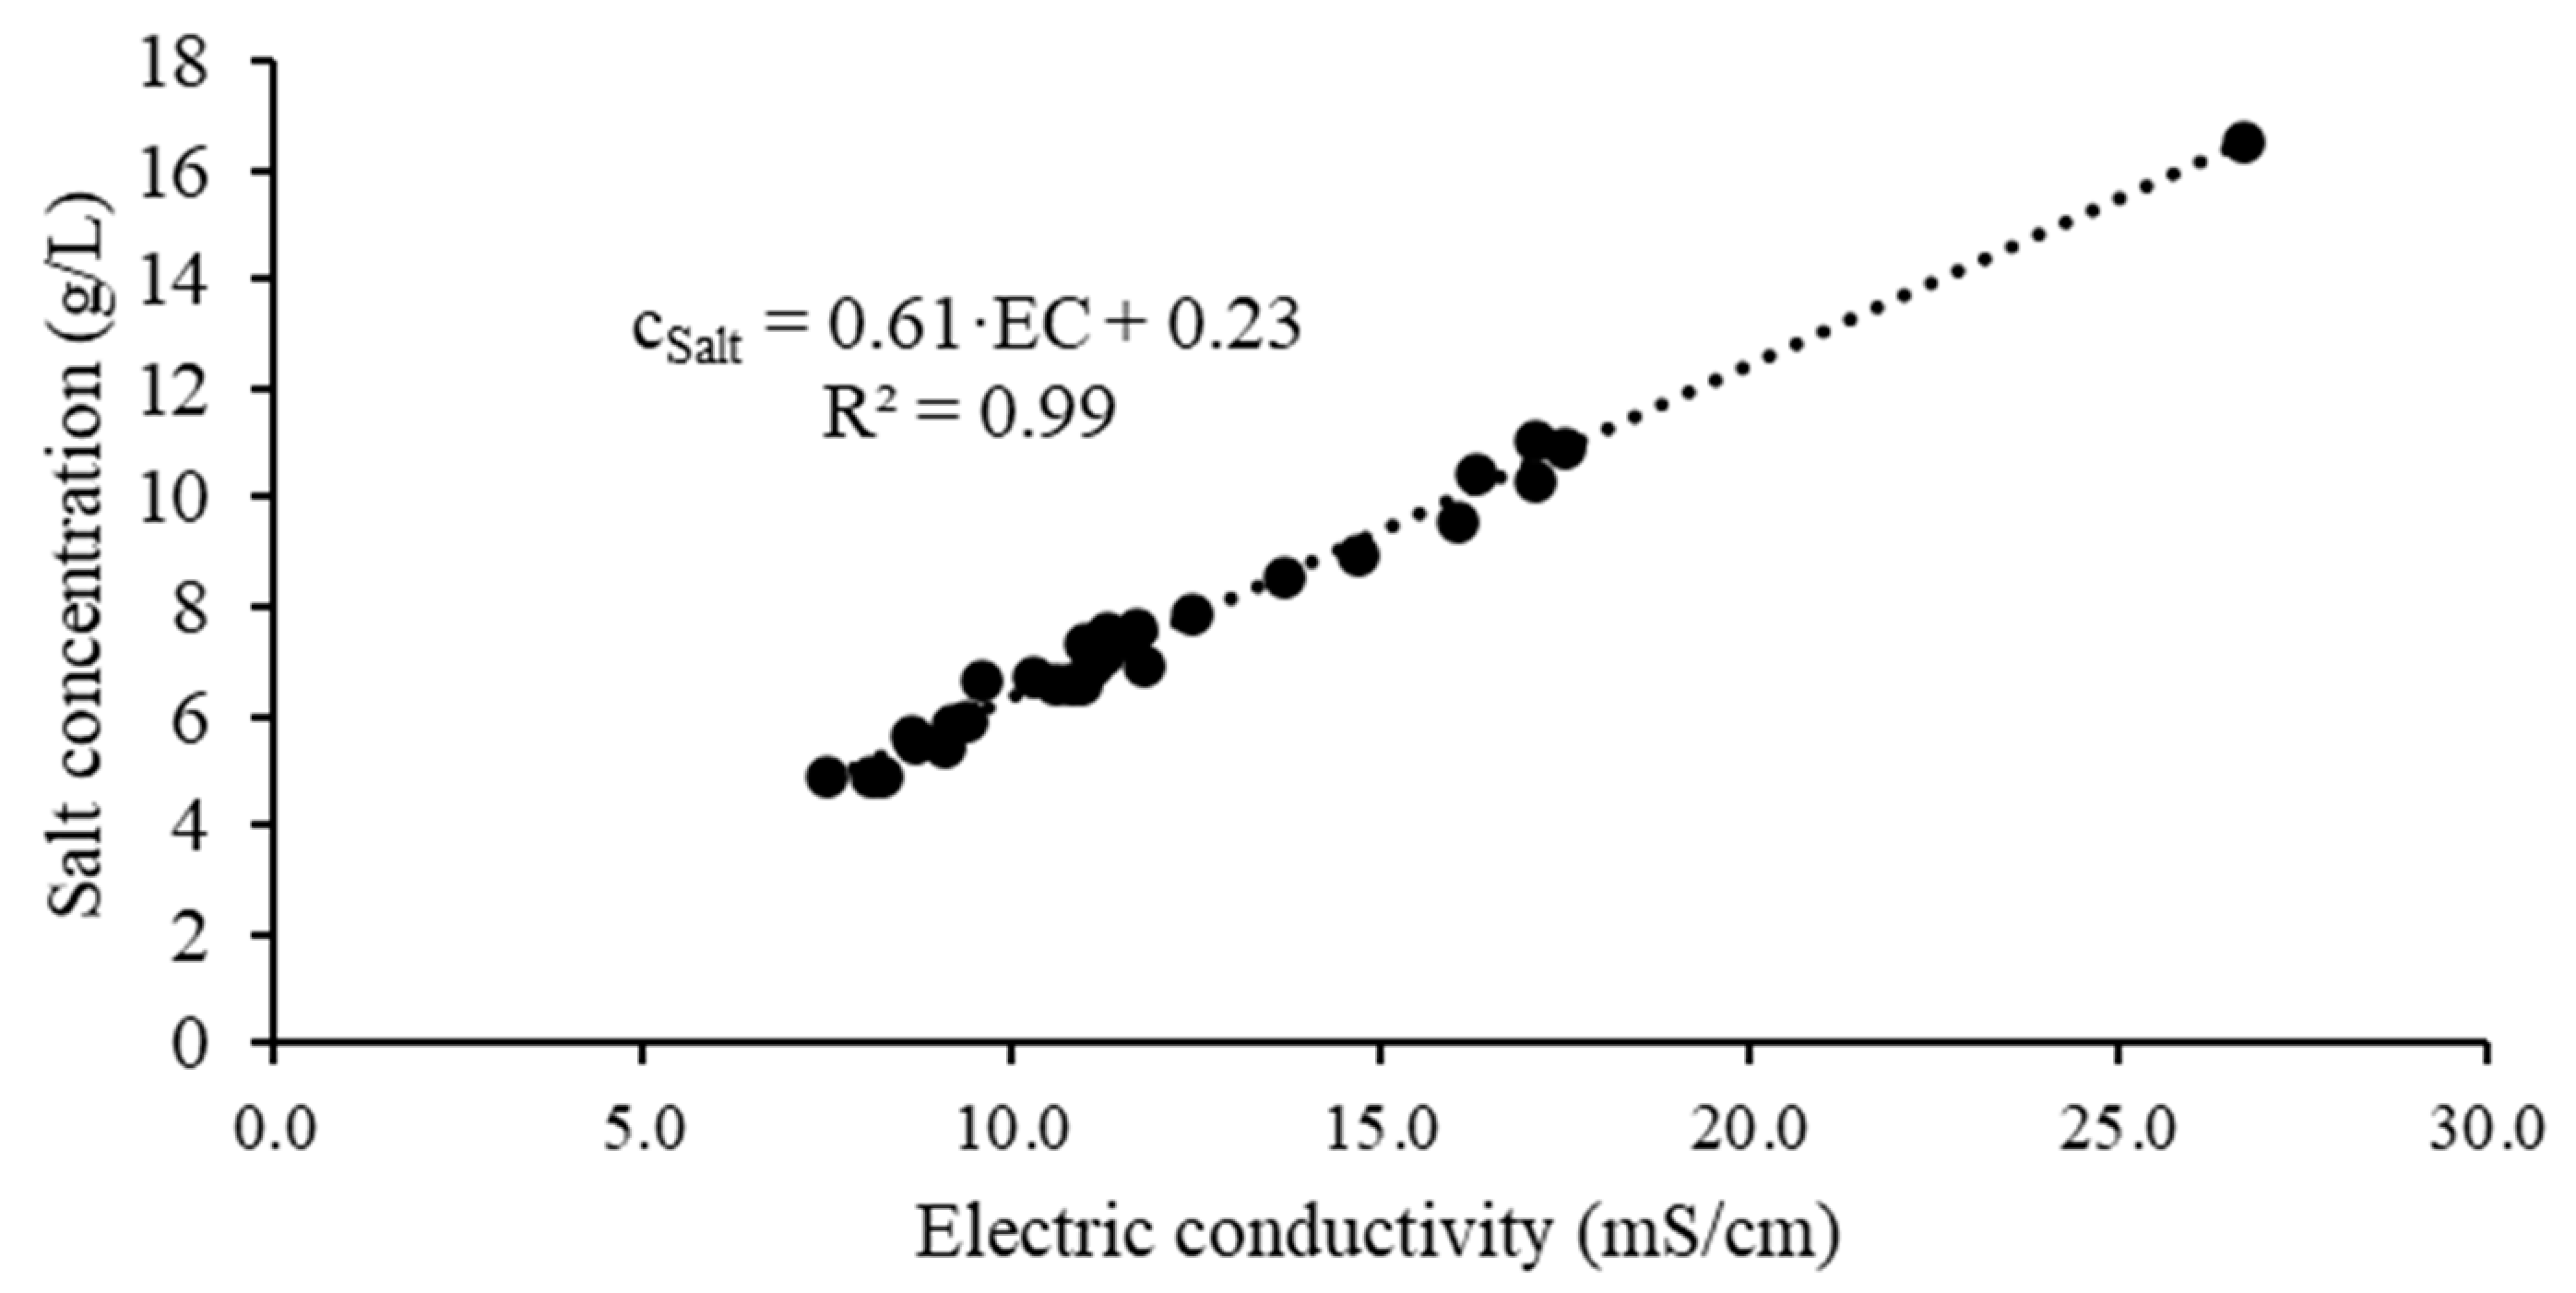
3.1. Analysed Ions and Salt Concentration in Activated Sludge
On average, the sum of anions (
Σceq,anions) and cations (
Σceq,cations) in the industrial wastewater was 120 meq/L (milliequivalent per litre). The main components of
Σceq,cations were chloride (78 mol%) and sulphate (17 mol%); and of
Σceq,anions. it was sodium (90 mol%). The
cSalt was calculated by summing the mass concentration of all analysed ions [
24].
Figure 3 shows the
cSalt as a function of the
EC. A linear trend line was derived and plotted as a dotted line. The coefficient of the determination (
R2) of 0.99 indicated a very good linear dependency between the
EC and
cSalt. With the given equation from
Figure 3, it was possible to calculate the
cSalt (in g/L) in real time and on-site by measuring the
EC (in mS/cm):
3.2. Determination of kN and Measuring CCC of Saline Industrial Wastewater
The modified equation for considering the salt effect on the
kLa is described in
Section 2.1. In the following, we showed how to find the
kN for the used diffusers and wastewater conditions based on experimental results in SW, which are described in detail in Behnisch et al. [
2]. With the
kN and measured
CCC, we were able to calculate the
fS value in dependence of the salt concentration measured on site in sAS.
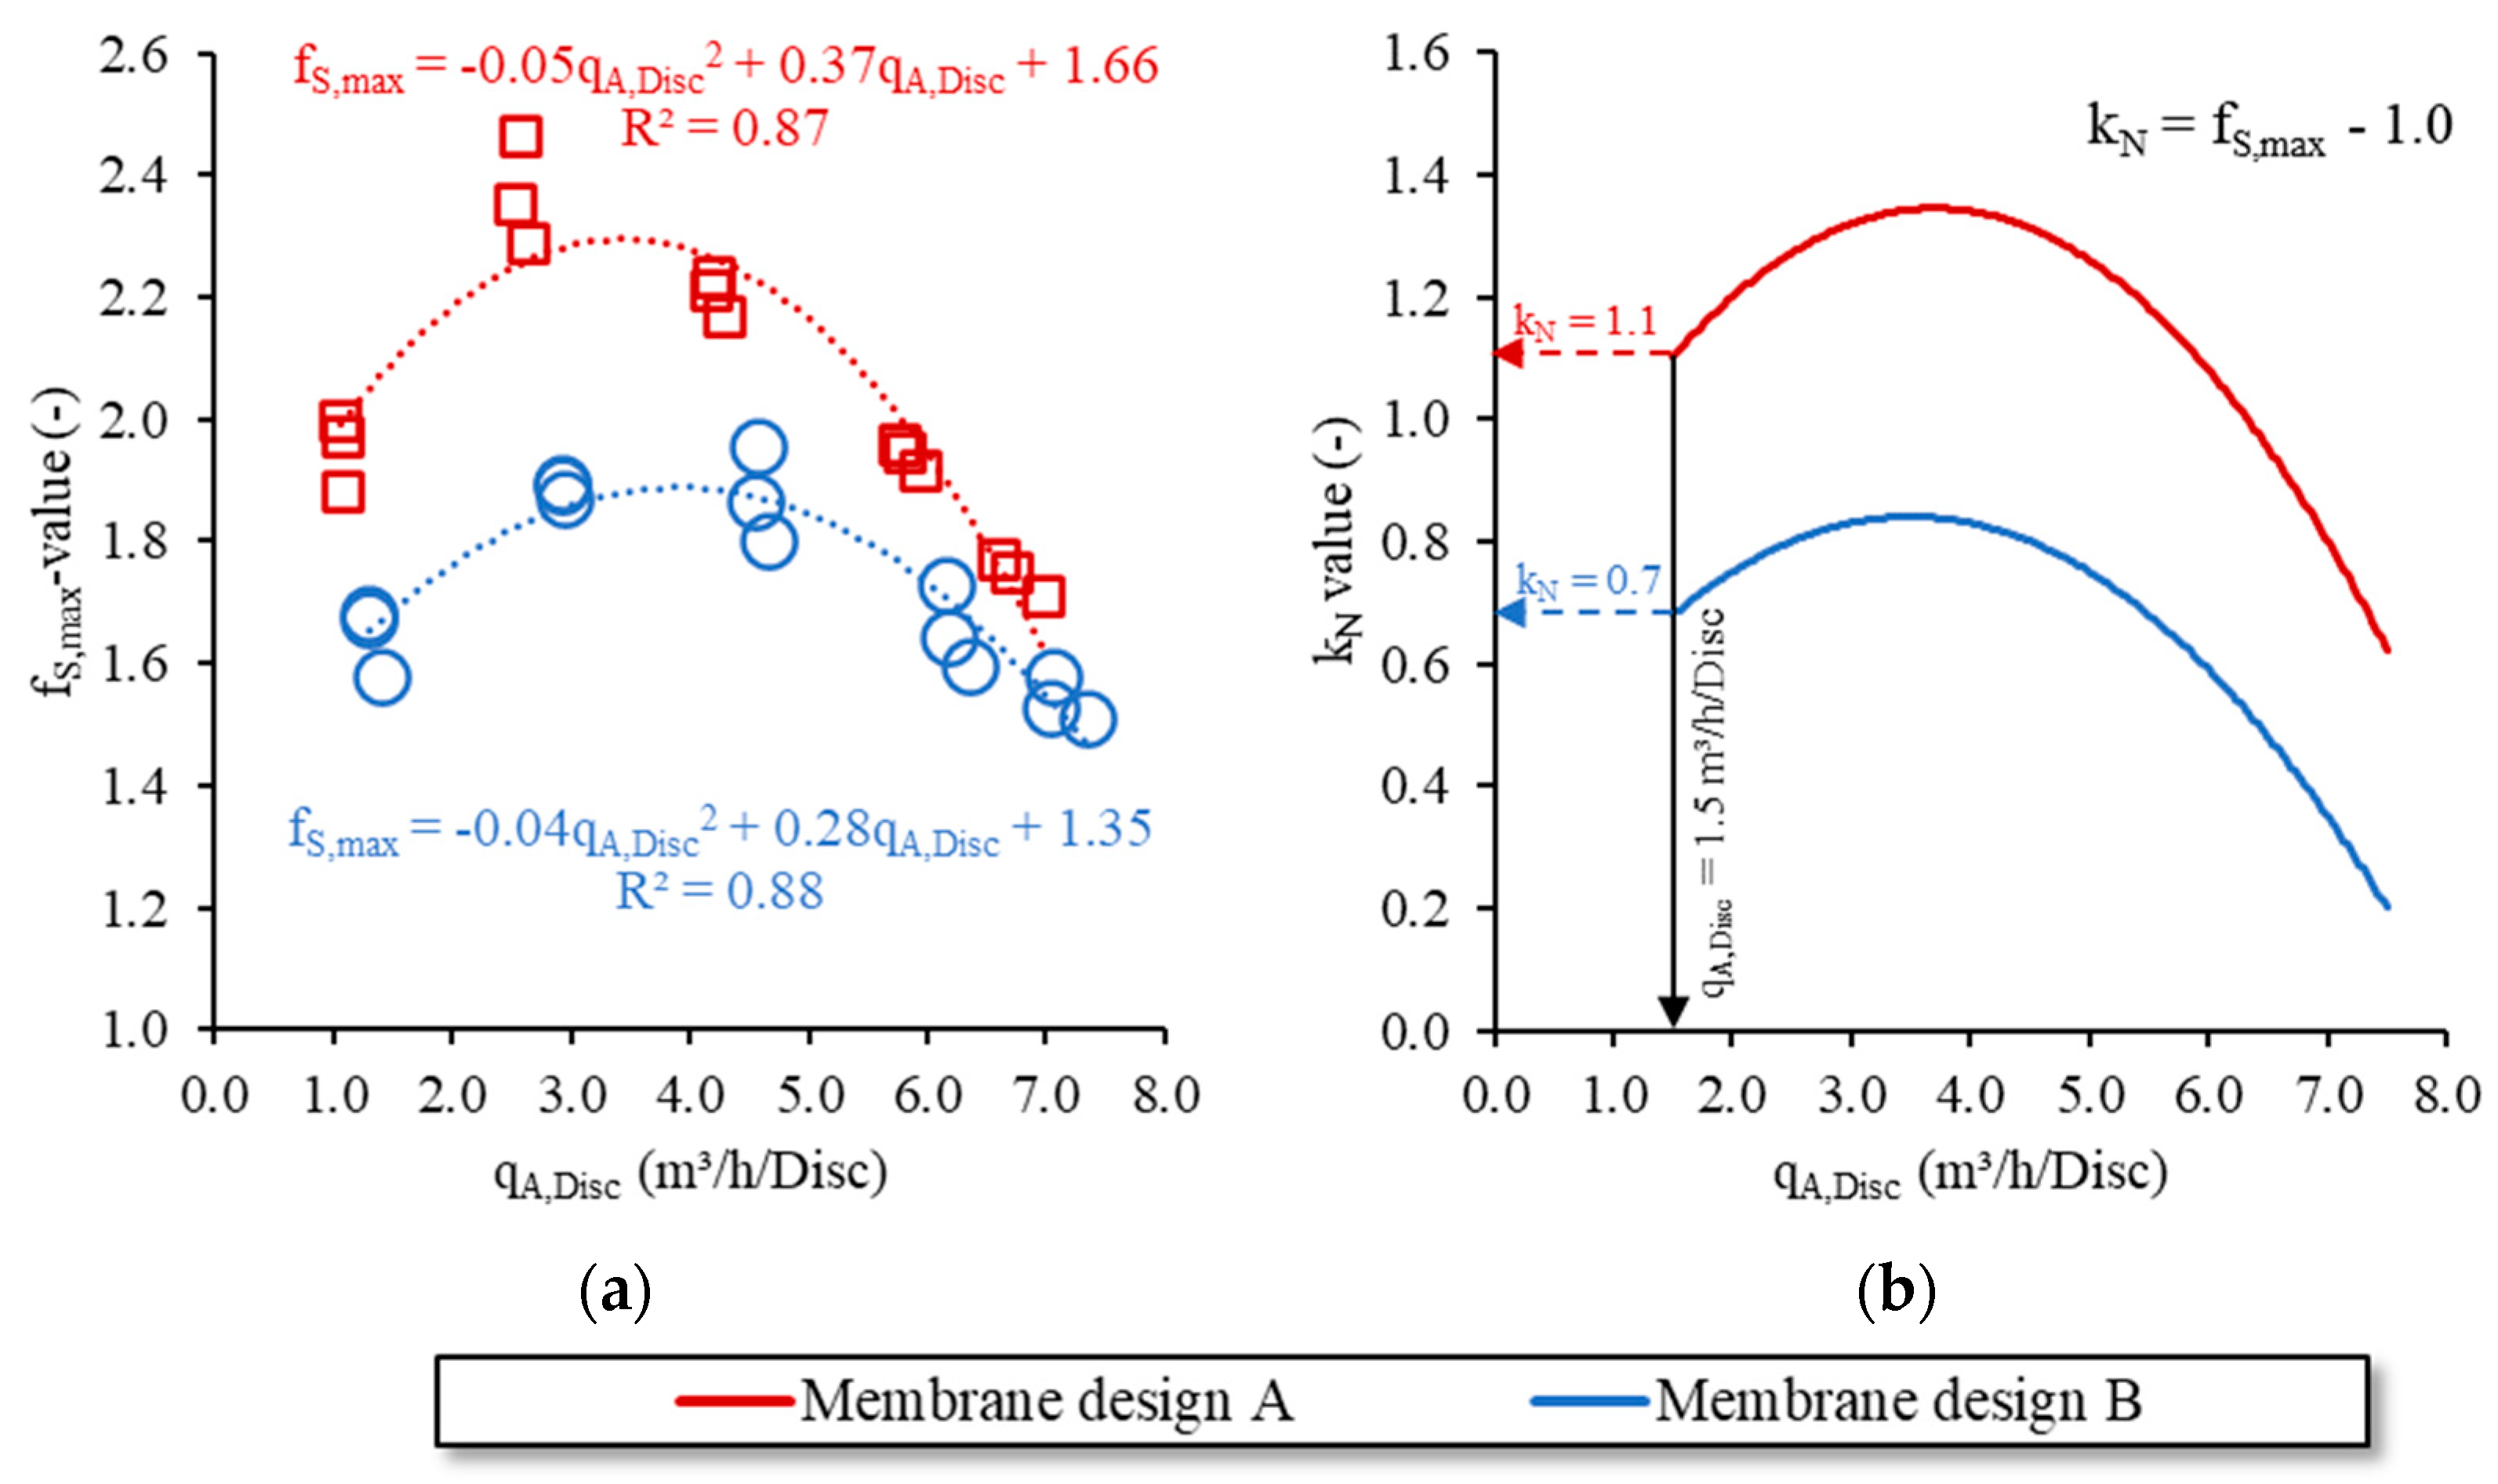
In a previous study [
2], we measured
fS,max of the disc diffusers described in
Section 2.3. The tests were conducted in a NaCl solution (0–15 g/L) in a pilot-scale test tank (water volume 17.1 m
3; depth of submergence 3.65 m) with different airflow rates. The results are shown in
Figure 4a as a function of
qA,Disc for both membrane designs. The influence of
qA,Disc on
fS,max was obvious. The highest
fS,max was reached in the middle of the operation range of the diffusers. The
fS,max for the corresponding
qA,Disc could be calculated using the specified regression functions. With the known
fS,max value, the
kN value could be derived from Equation (7). The
kN values for both diffuser membrane designs as a function of
qA,Disc are shown in
Figure 4b. The
kN value ranged between 0.6 and 1.3 and between 0.2 and 0.8 for membrane design A and design B, respectively. The airflow rate during the off-gas measurement was constant at
qA,Disc = 1.5 m
3/Disc/h. The corresponding
kN value was 1.1 for diffuser membrane design A and 0.7 for diffuser membrane design B, respectively. The
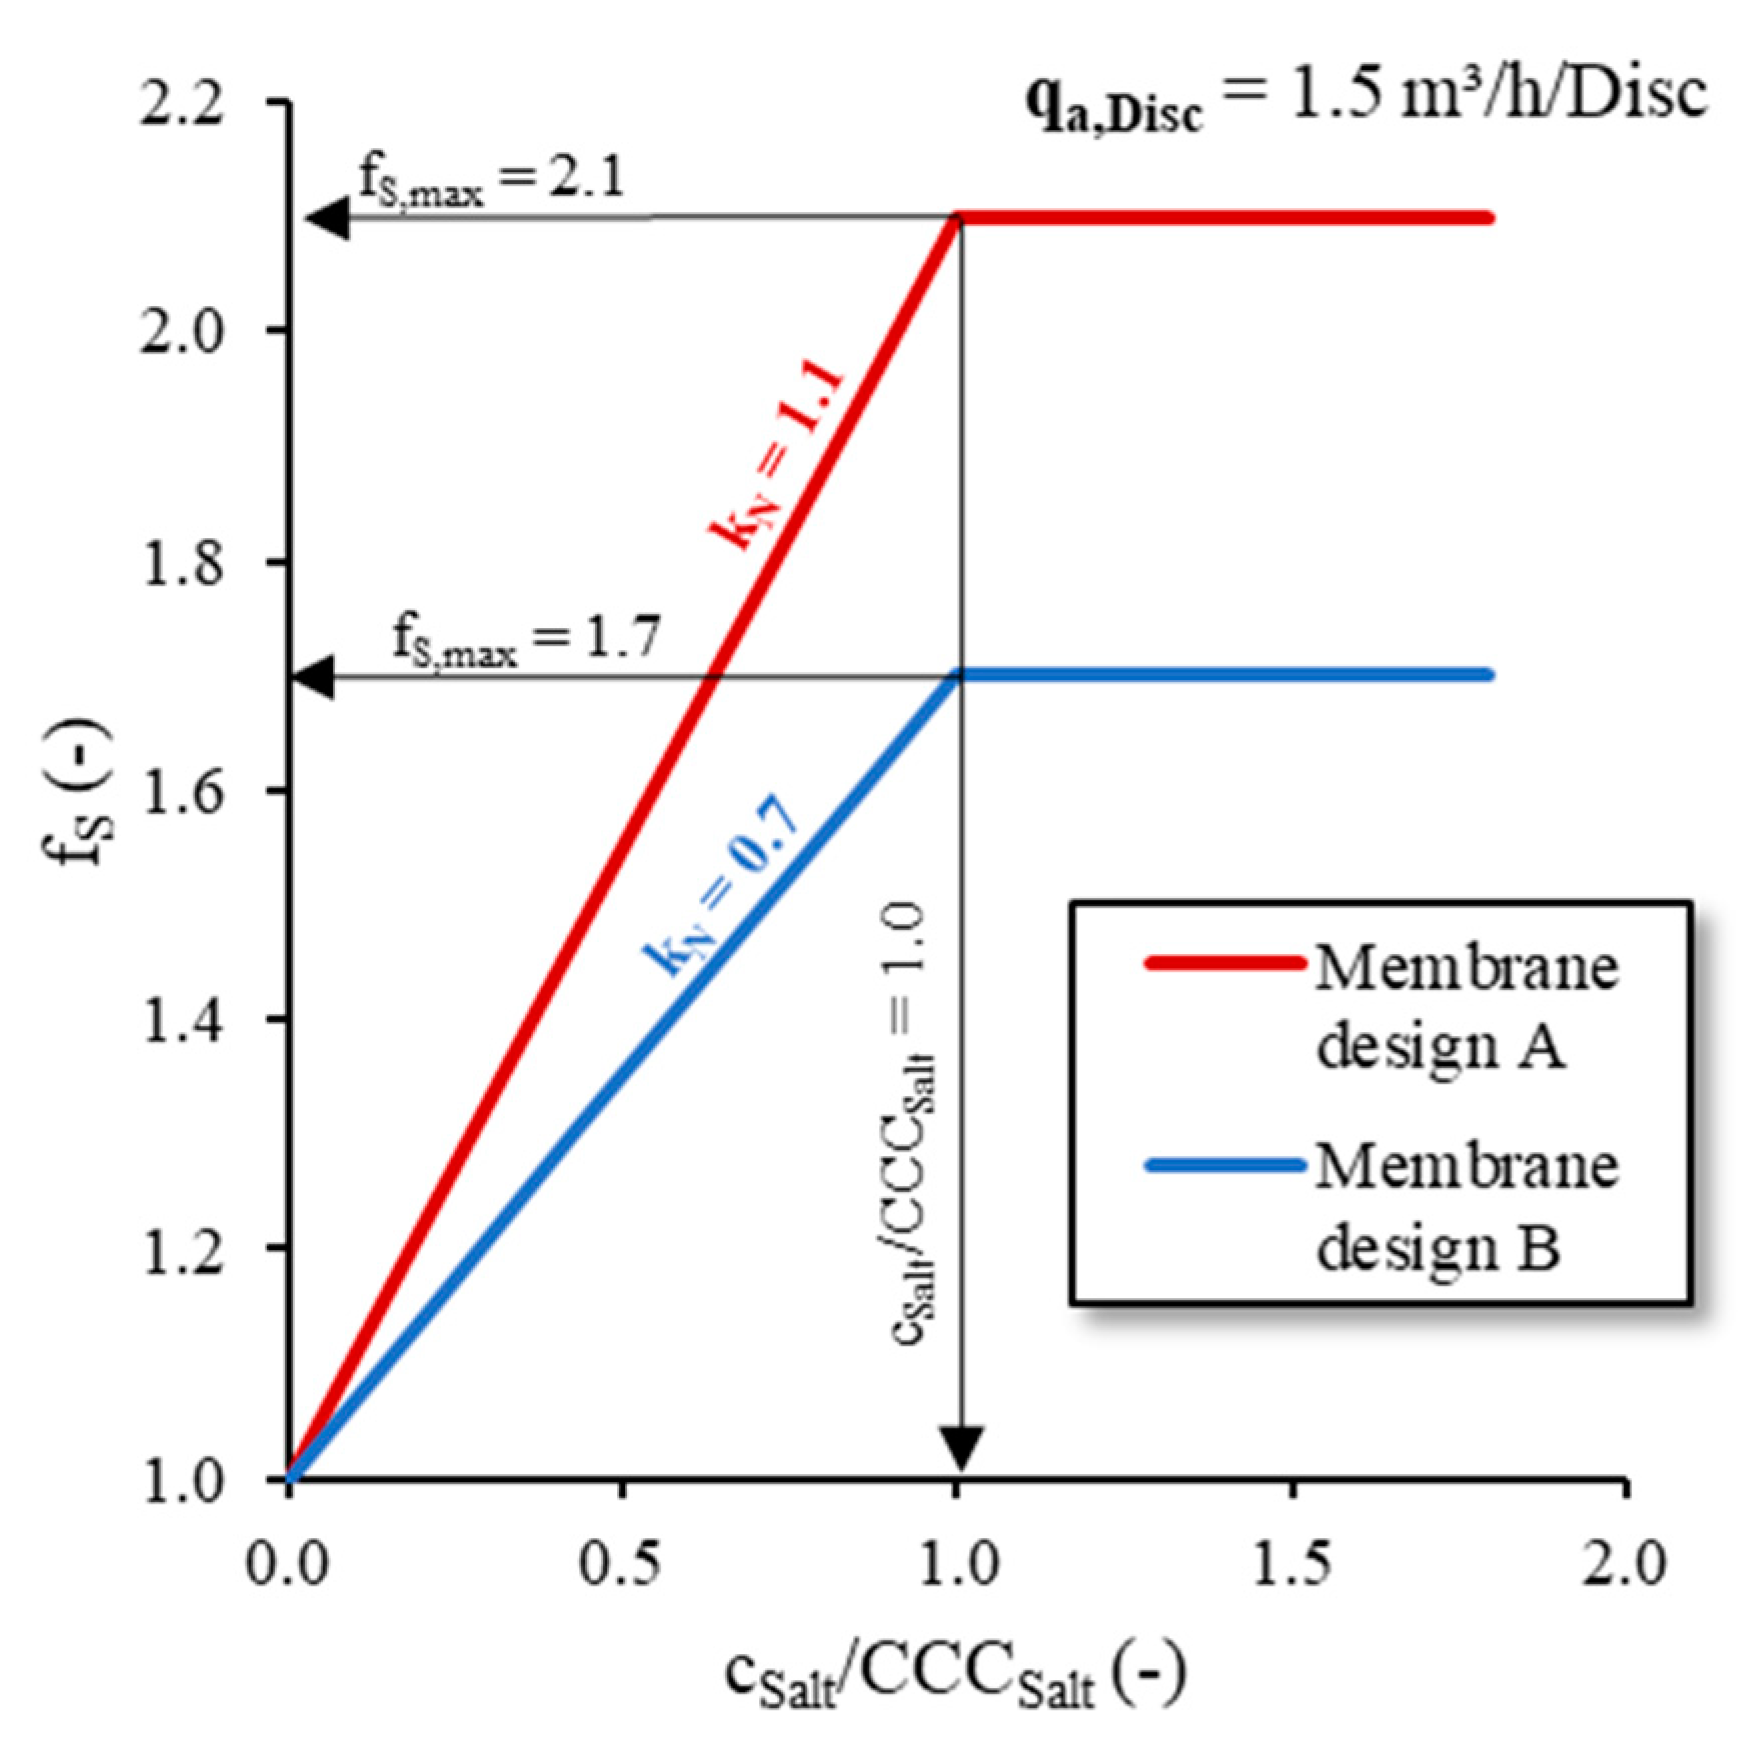
fS value calculated according to Equation (6) is plotted as a function of the dimensionless
cSalt/
CCCSalt ratio in
Figure 5. With
qA,Disc = 1.5 m
3/Disc/h,
fS,max was 2.1 for diffuser membrane design A and 1.7 for membrane design B, respectively.
The
CCC of the industrial wastewater was measured according to the analytical approach described by Behnisch et al. [
2]. Accordingly, oxygen transfer tests were performed at different airflow rates and salt concentrations, as well as
fS being calculated. The point at which the fitted lines for the zone of the linear increase and the zone of the constant
fS met defined the
CCC. The
CCC measurement was taken in a 250 L bubble column in the lab of the Technical University of Darmstadt. The transport of a sufficient amount of biologically treated saline industrial wastewater was not possible and, furthermore, the industrial wastewater showed only small fluctuations in the salt concentration (see
Section 2.2). Therefore, we used an artificial salt solution consisting of a salt mixture of NaCl and Na
2SO
4 in a ratio of 5:2. The salt solution in the bubble column, therefore, showed a similar ion composition (
Σceq,Cl−/
Σceq,cations = 0.75;
Σceq,SO42−/
Σceq,cations = 0.25) as found on average in industrial wastewater (see
Section 3.1). The artificial salt solution made it possible to determine
fS at different salt concentrations. We measured a
CCC of 9.2 g/L. In a previous study with the same disc diffuser measuring the CCC of various single salt solutions, the CCC ranged between 6.0 g/L and 15.7 g/L [
2].
With the given
kN and
CCC values, we were able to consider the salt effect on the
kLa on-site as a function of the salt concentration. Thereby, the good linear dependency of the
EC and
cSalt (see
Figure 3) made it possible to measure the
cSalt in real time very quickly and easily.
3.3. Tap Water Oxygen Transfer Tests
To calculate
αfS, we had to know the
kLa in TW. Therefore, oxygen transfer tests in TW with all disc diffusers were conducted in B1 before inoculation with sAS (see
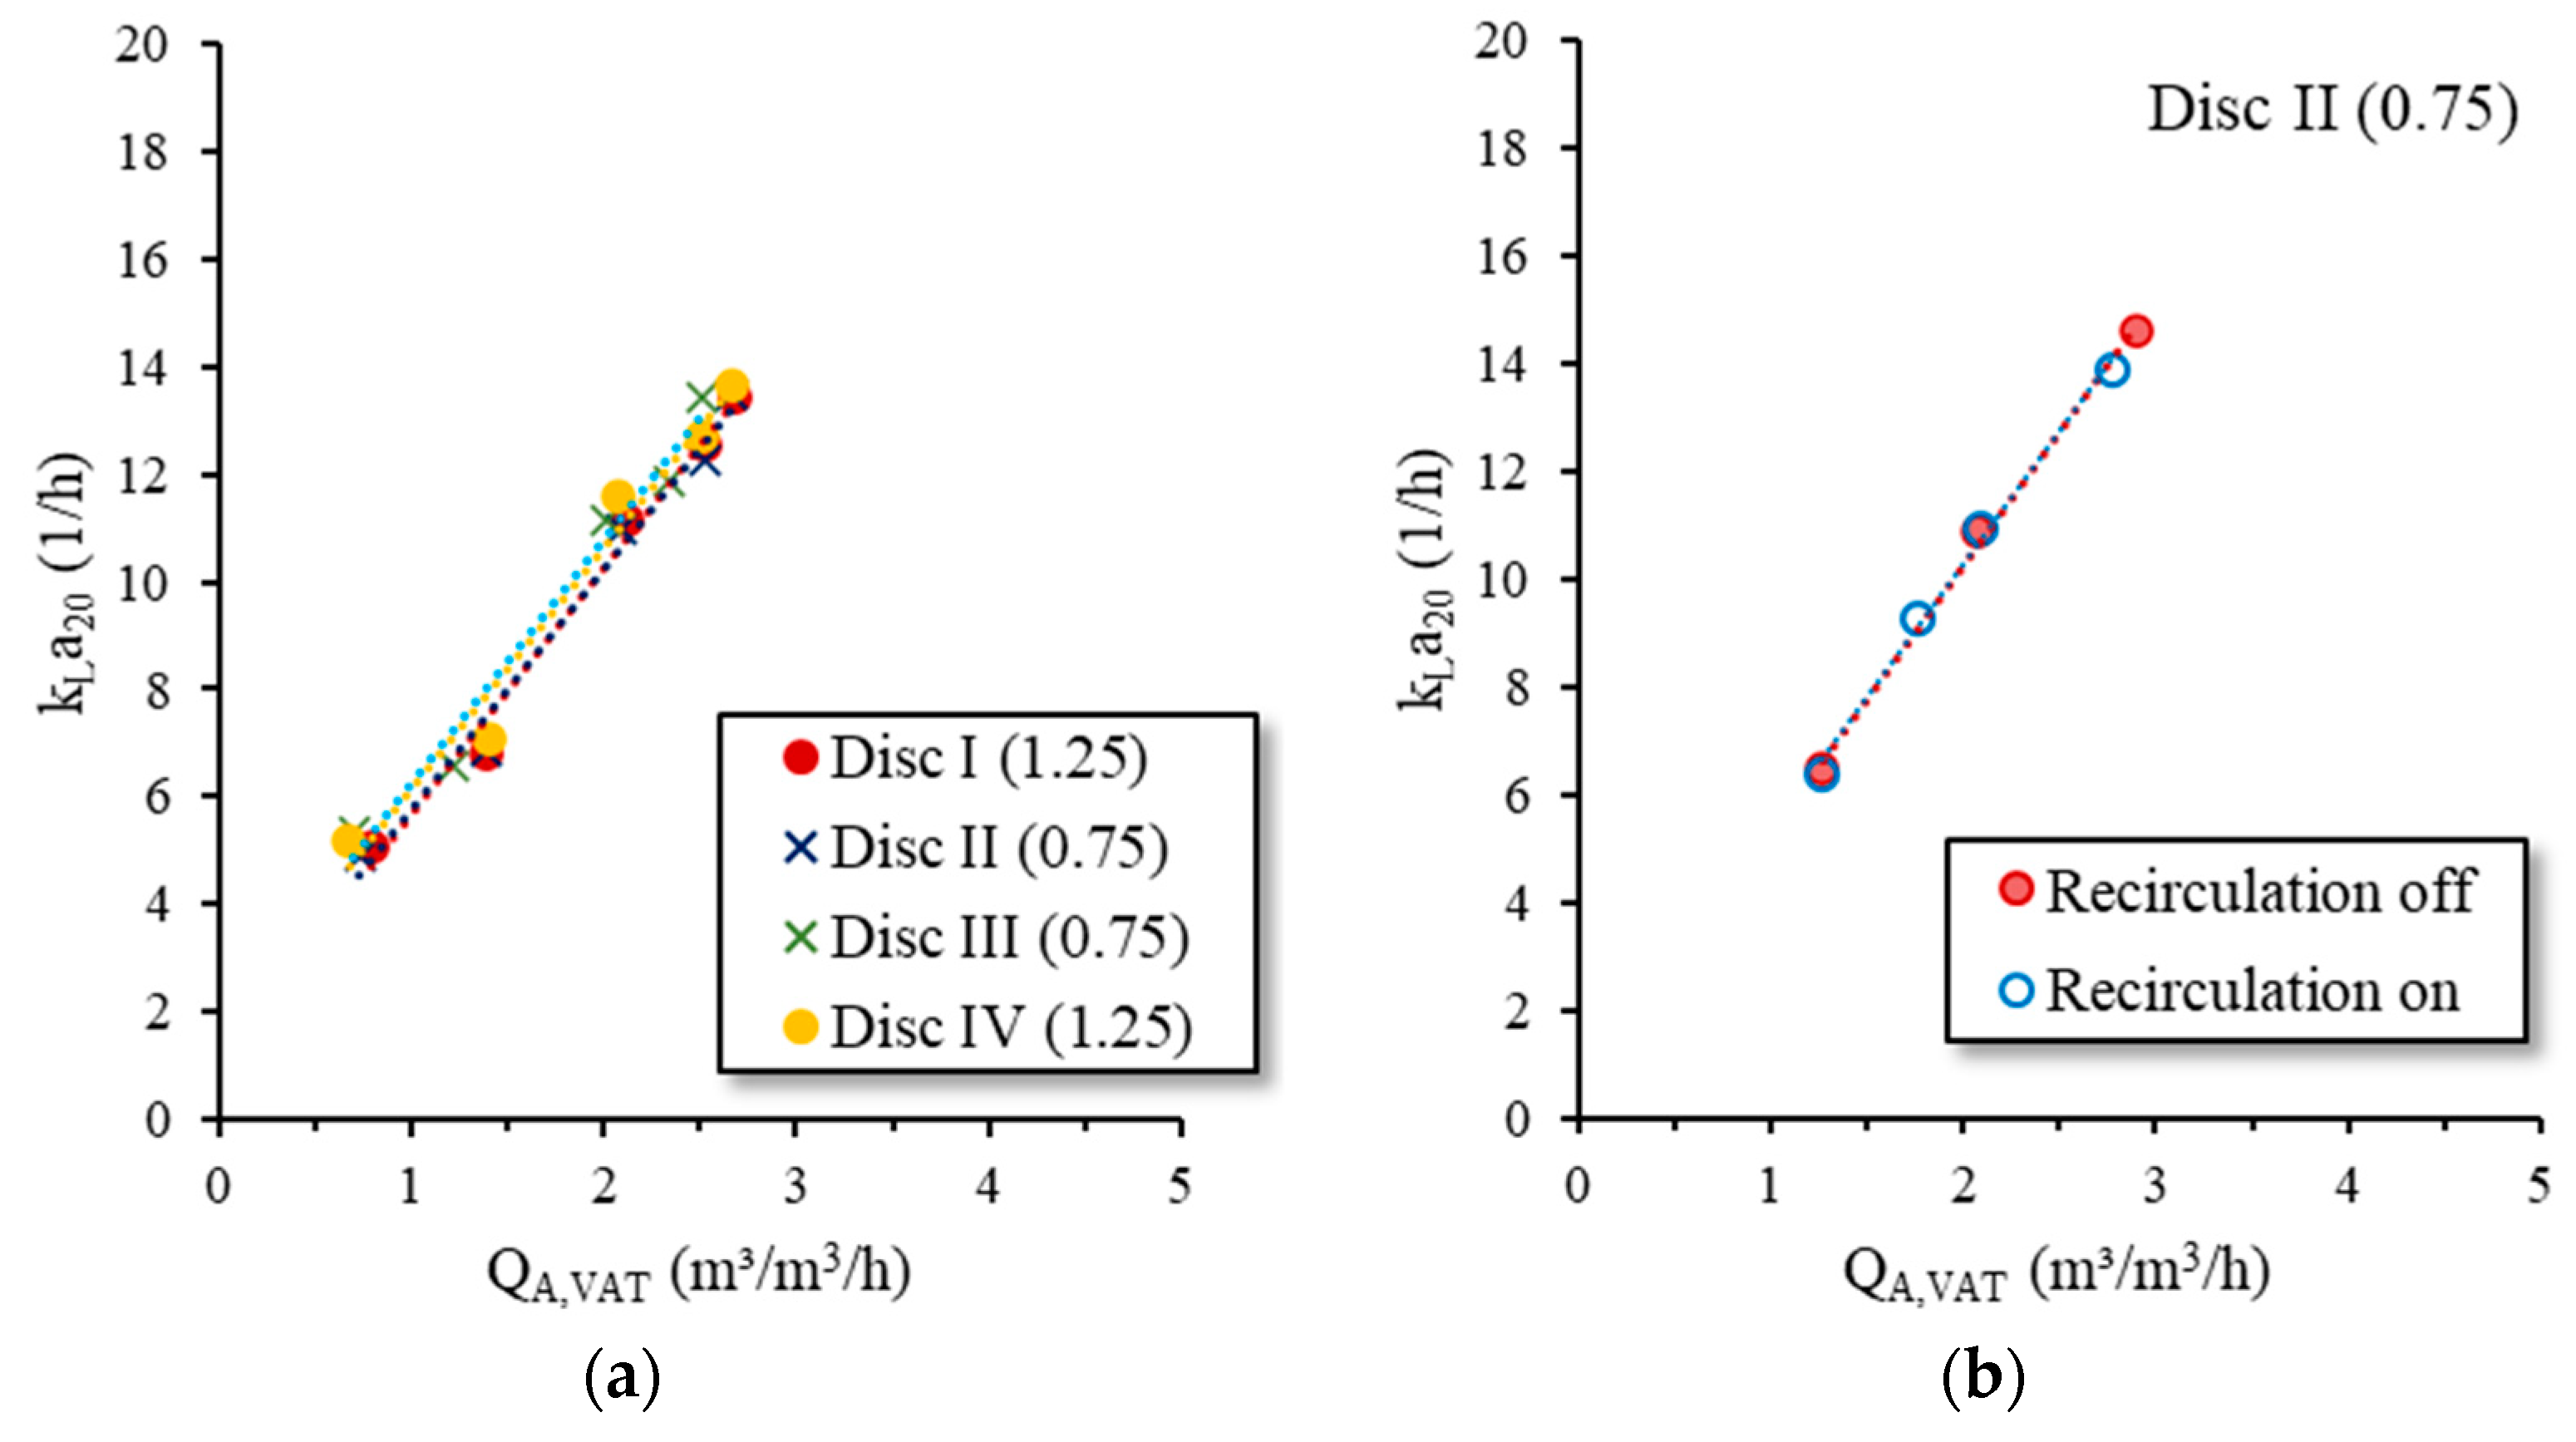
Section 2.4). The measured
kLa values as a function of the airflow rate per aerated reactor volume (
QA,VAT; m
3/m
3/h) are shown in
Figure 6a). When the
QA,VAT = 1.0 m
3/m
3/h, the average
kLa was 6.0 h
−1 and 5.9 h
−1 for membrane designs A and B, respectively. It can be seen that there was no significant difference between the diffusers as well as the different membrane designs. Additionally, in our previous oxygen transfer tests in TW with the same disc diffusers in different reactors of varying volumes, we did not determine a significant difference in the
kLa [
1,
2].
The tap water oxygen transfer tests were conducted without B1 intern recirculation. To assess the effect of recirculation on the
kLa, the tests with
Disc II (0.75) were repeated with recirculation. During the tests, the recirculation pump (P4) ran at 100% of its capacity (6.5 m
3/h), which was much more than in the later tests with sAS (2.5 m
3/h). The results are shown in
Figure 6b. It can be seen that the recirculation had no effect on the
kLa.
3.4. Overall Performance of the Pilot Plant
An overview of the most important operating parameters of the pilot plant in the individual test phases can be taken from
Table 4. The wastewater temperature (T; °C) of approximately 21 °C in Phase I and II was somewhat lower than in Phase III and Phase IV (~25 °C). This could be explained by the fact that Phase I and Phase II were carried out in spring, while Phase III and Phase IV were run in the summer months. The mean
COD F/M ratio of approx. 0.25 gCOD/g TSS/d was comparable in all experimental phases. Only Phase IV showed a slightly higher load. During this phase, the industrial wastewater inflow contained an exceptionally high organic load for a few days. The
COD F/M ratio and the
SRT of 11 d corresponded to a nitrifying municipal WWTP [
8]. The
TSS in B1 was between 7 g/L and 4.4 g/L, with a volatile content of 62% to 75%. In Phase I and Phase II, the influent flow (
QIn; L/h) was approximately 200 L/h. To reduce the required amount of added salt, the inflow in Phase III and Phase IV was reduced to 110 L/h. The total COD elimination (
ηCOD;%) was stable above 90% in all phases. In the COD concentration in the effluent, both
CODt and
CODf were permanently below 50 mg/L. Only in Phase IV there was a slight increase, which could also be attributed to the unusually high and intermittent loading of the plant. The sludge volume index (
SVI; mL/g) during operation decreased from 119 mL/g in Phase I to 47 mL/g in Phase IV, which was very low.
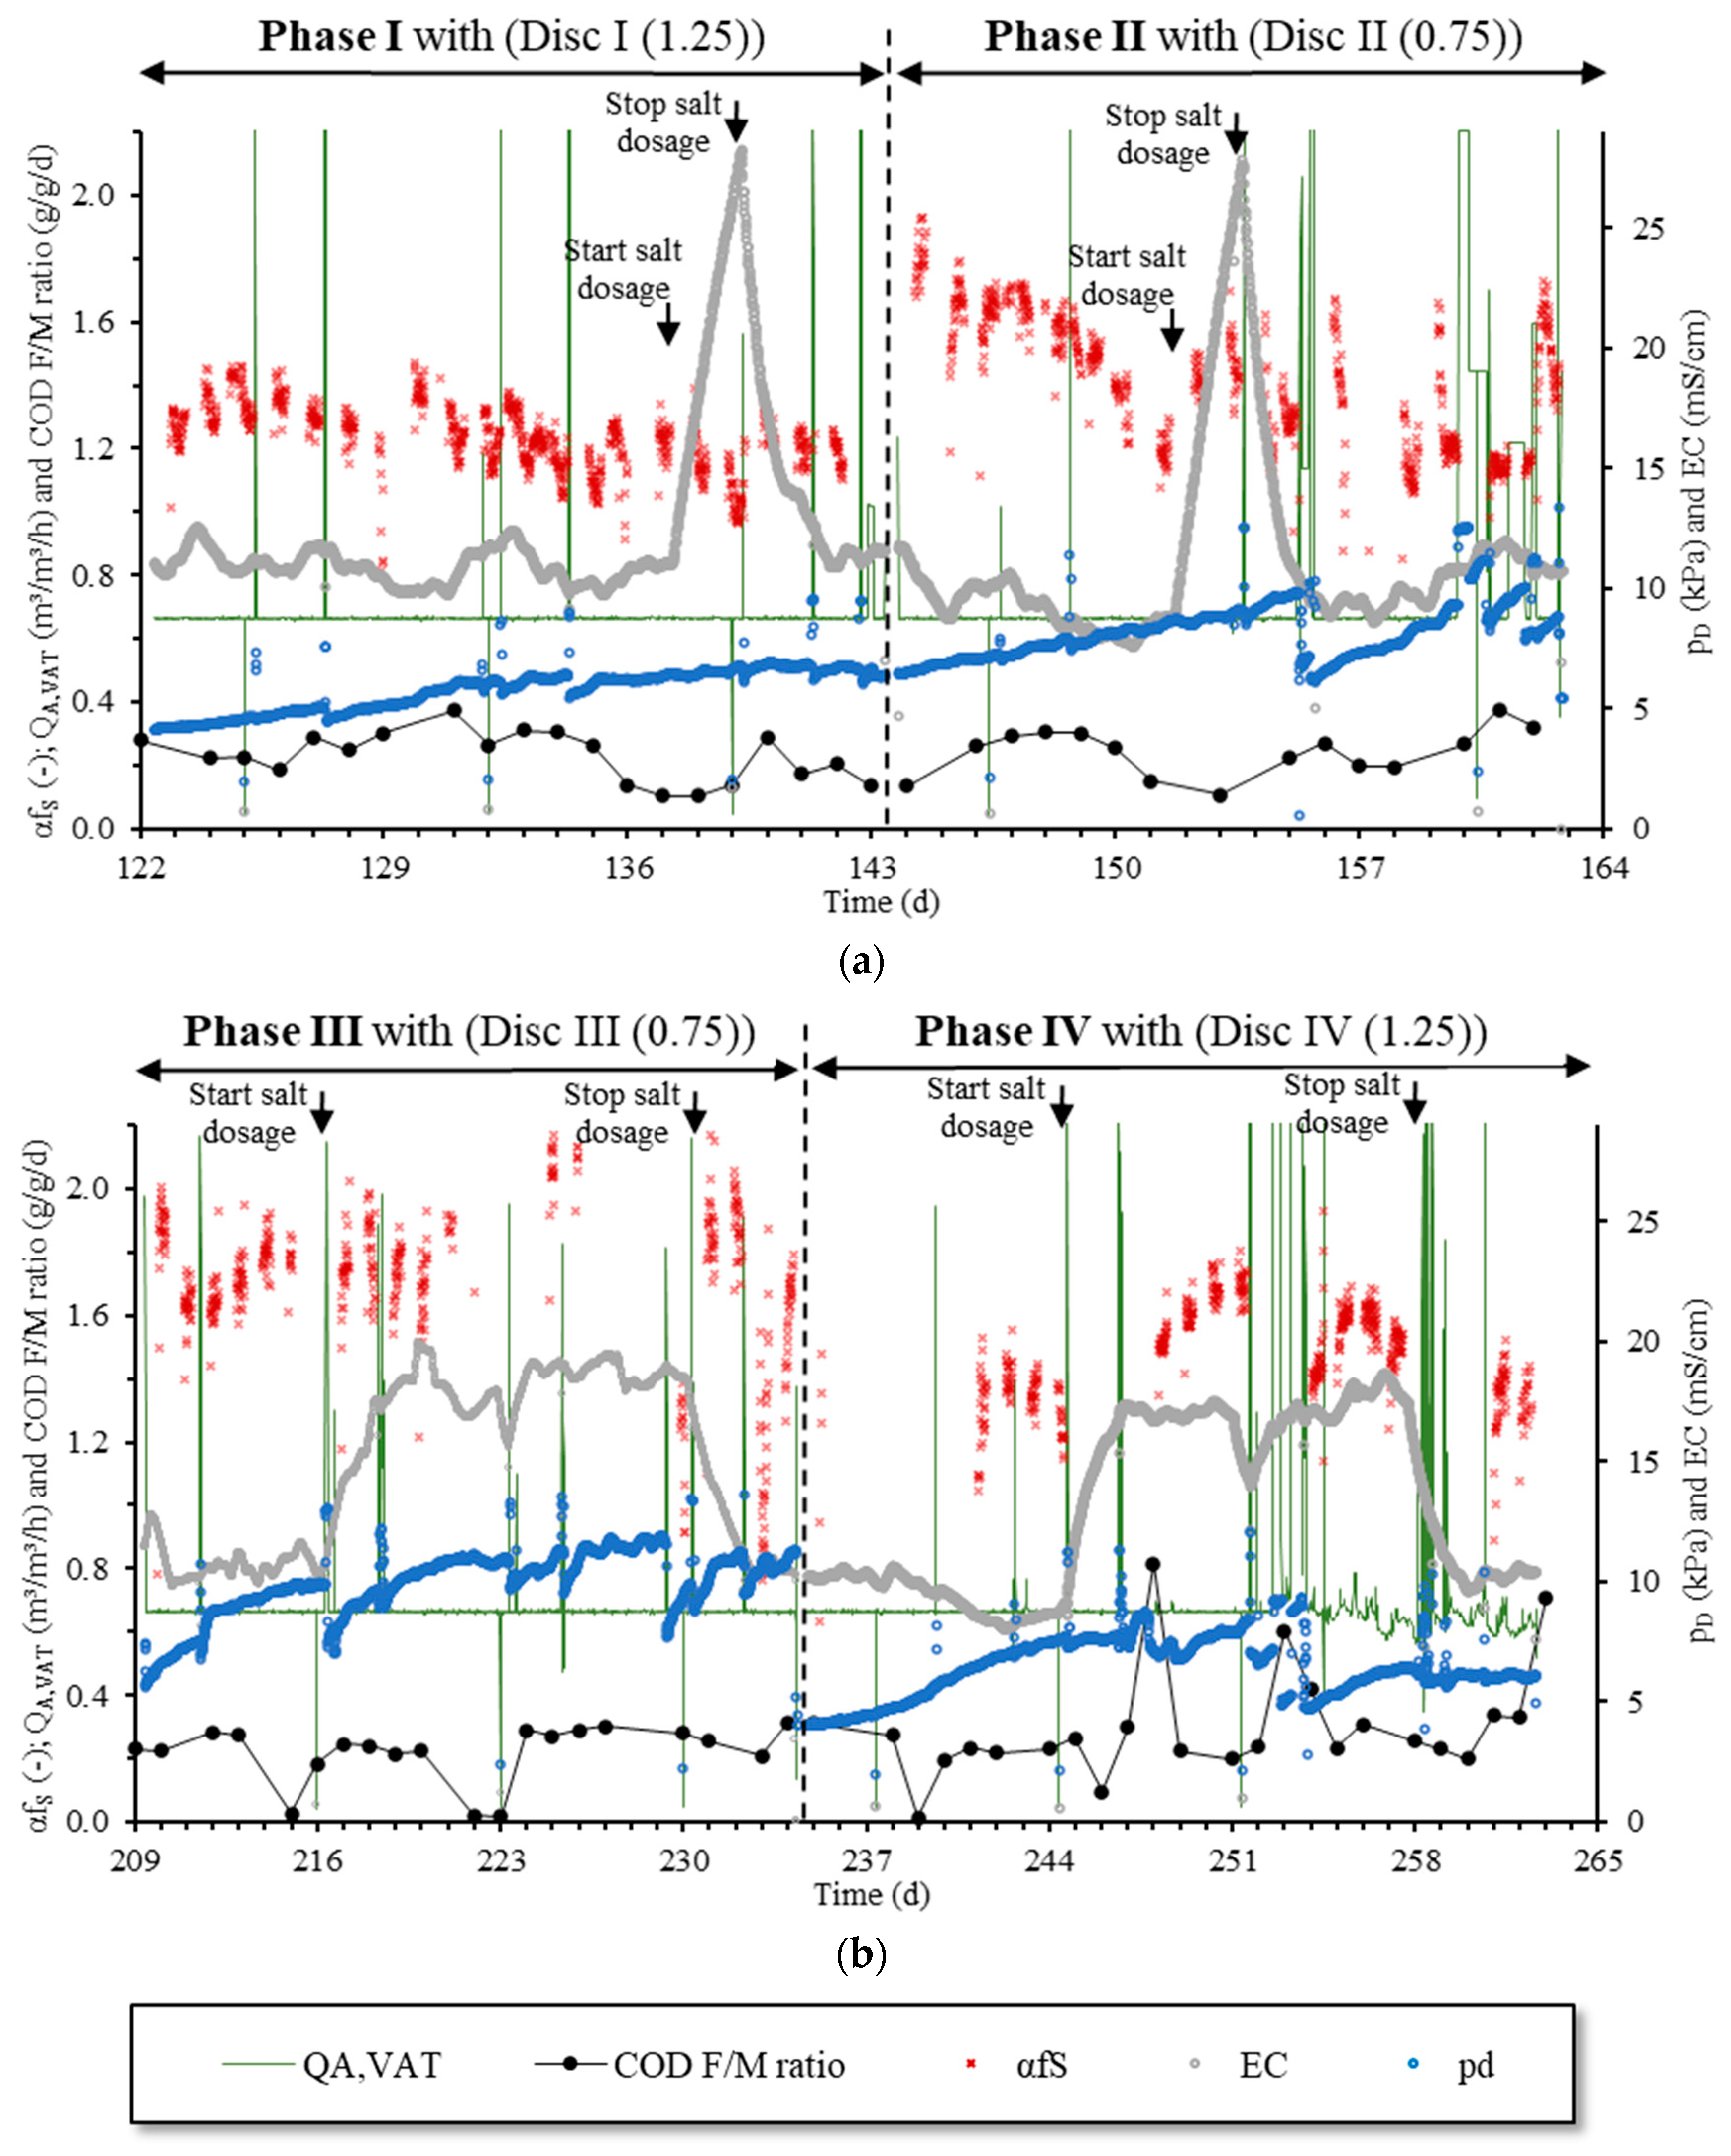
3.5. Off-Gas Measurement and Pressure
Figure 7 shows the
QA,VAT,
αfS,
EC and
pd as 15 min averages and the
COD F/M ratio as a 24 h average for each individual test phase. Not shown are all the
αfS values where
DO was above 50% of oxygen saturation concentration or other circumstances (e.g., maintenance of equipment) preventing the oxygen transfer measurement with the off-gas method. In the following, we discussed them individually.
3.5.1. EC, QA,VAT and COD F/M Ratio
In
Figure 7, the times when salt was added from B3 are clearly recognisable by the rapidly rising
EC. The
EC in the reactor out of the salt dosing times ranged between 7.7 and 12.1 mS/cm and corresponded to that of the inflowing industrial wastewater. According to Equation (10), this corresponded to a
cSalt between 4.9 and 7.6 g/L, which was much lower than the measured
CCC of 9.2 g/L (see
Section 3.2). This mean that without additional salt dosing, the coalescence was not fully inhibited. When salt dosing in Phase I and Phase II started, the
EC increased 2.5 times in less than 2 d, and dropped sharply again after the salt dosage stopped and inflow restarted. In Phase III and Phase IV, the salt was dosed continuously for approximately 14 d. The
EC reached a mean value of 17.7 mS/cm (=11 g/L) in 62 h after the salt dosage started. When the salt dosage stopped, the
EC reduced to the original value through dilution with the influent. As shown before (
Table 4), the average
COD F/M ratio was comparable in all phases. Only in Phase IV, the average ratio increased slightly due to a high COD load in the influent on days 248, 253, 254 and 263. The
QA,VAT averaged 0.7 m
3/h in all phases (corresponding to a
QA = 1.5 m
3/h or
qA,Disc = 1.5 m
3/h/disc). It increased only for maintenance, when taking a sample from B1 for the
TSS measurement or to satisfy the oxygen demand when the COD load in the influent was very high. This can be seen in
Figure 7 from the peaks in the otherwise very stable profile of the
QA,VAT.
3.5.2. Pressure Drop pD
Figure 7 shows that in all phases the
pD increased during the time of operation. In Phase I,
pD rose from 4.1 to 6.3 kPa during 21 d of operation and, thus, by an average of 0.07 kPa per day. At the beginning of Phase II, the
pD of the newly installed
Disc II (0.75) was 6.4 kPa, which corresponded randomly in regards to the
pD at the end of Phase I. Then, the
pD increased rapidly by 0.82 kPa per day and reached 9.8 kPa after only 12 days of operation. After a brief increase in the
QA,VAT, the
pD dropped to 6.2 kPa. However, when the
QA,VAT was reduced to the previous value, the
pD rose again rapidly. This decrease in the
pD after a short-term increase in the
QA,VAT could also be observed in Phase III and partly also in Phase IV. This can be explained by the fact that the biofilm on the surface and in the slits of the diffuser was removed by the increased airflow rate. The
pD was, therefore, temporarily reduced until a new biofilm was formed. The formation of the biofilm and the clogging of slits were improved by the present low airflow rate [
27].
At the beginning of Phase III, the pD was 5.6 kPa. A rapid increase in the pD followed, which could only be interrupted for a short time by briefly increasing the airflow rate. At the end of Phase III, however, the pD appeared to be relatively stable at approximately 10 kPa. With the beginning of Phase IV and the change to Disc IV (1.25), the pD dropped to 4.1 kPa. This corresponded to the starting pD value of Disc I (1.25) in Phase I. After a slow increase, the pD reached a relatively stable value of approximately 7.7 kPa. After the brief increase in the airflow rate as a response of the high organic load on days 253 and 254, the pD dropped again to 4.7 kPa, rose slightly and remained stable at 5.9 kPa.
In all phases, no influence of the EC or salt concentration on the pD could be observed. Neither did the increase in the pD change with the shock-wise increase in the salt concentration in Phase I and Phase II nor did it change with the temporarily elevated concentrations in Phase III and Phase IV. In addition, no effect on the pD could be observed with the decrease in the EC or salt concentration.
In summary, we observed a partly strong increase in the
pD whilst aerating the saline-activated sludge. Only at the end of Phase III and Phase IV after approximately 14 days of operation, the
pD was stable with 10 kPa (
Disc III (0.75)) and 7.7 kPa (
Disc IV (1.25)). Membrane design A showed a higher
pD due to the smaller slits than membrane design B at all times. The reason for the rising
pD was most probably the growing biofilm on the surface and in the slits of the membrane diffuser, as to be expected when aerating activated sludge. The low airflow rate especially enhanced the growth of the biofilm [
27]. Furthermore, we observed no influence of the
EC or salt concentration on the
pD. This confirmed former results of
pD measurements in SW [
2,
16]. In SW, the difference in the
pD for the two membrane designs was on average 2.0 kPa and, therefore, in the same magnitude as observed here in sAS.
3.5.3. αfs
The high
αfS values of >1.0 in all phases (see
Figure 7) showed the positive effect of an increased salt concentration on oxygen transfer. In non-saline conditions (
fS = 1.0), for a nitrifying WWTP, an
α of 0.6 to 0.85 would be expected [
8]. Our results showed that the
αfS in sAS with the given diffusers was up to three times higher. The partially high fluctuations of
αfS within only a few hours resulted from the multitude of oxygen-transfer-inhibiting effects, which changed with the changing influent wastewater characteristics. Various studies showed an inverse relationship of oxygen transfer and a high organic influent concentration [
7,
28,
29]. In our tests, however, the organic load was determined only once a day on the basis of a 24 h composite sample. A comparison of these data with a 24 h
αfS mean value could not be determined either, as the
αfS could not be recorded during the entire day due to the reasons already explained in
Section 2.5. The dynamic modelling of
α was, therefore, not possible due to the lack of data.
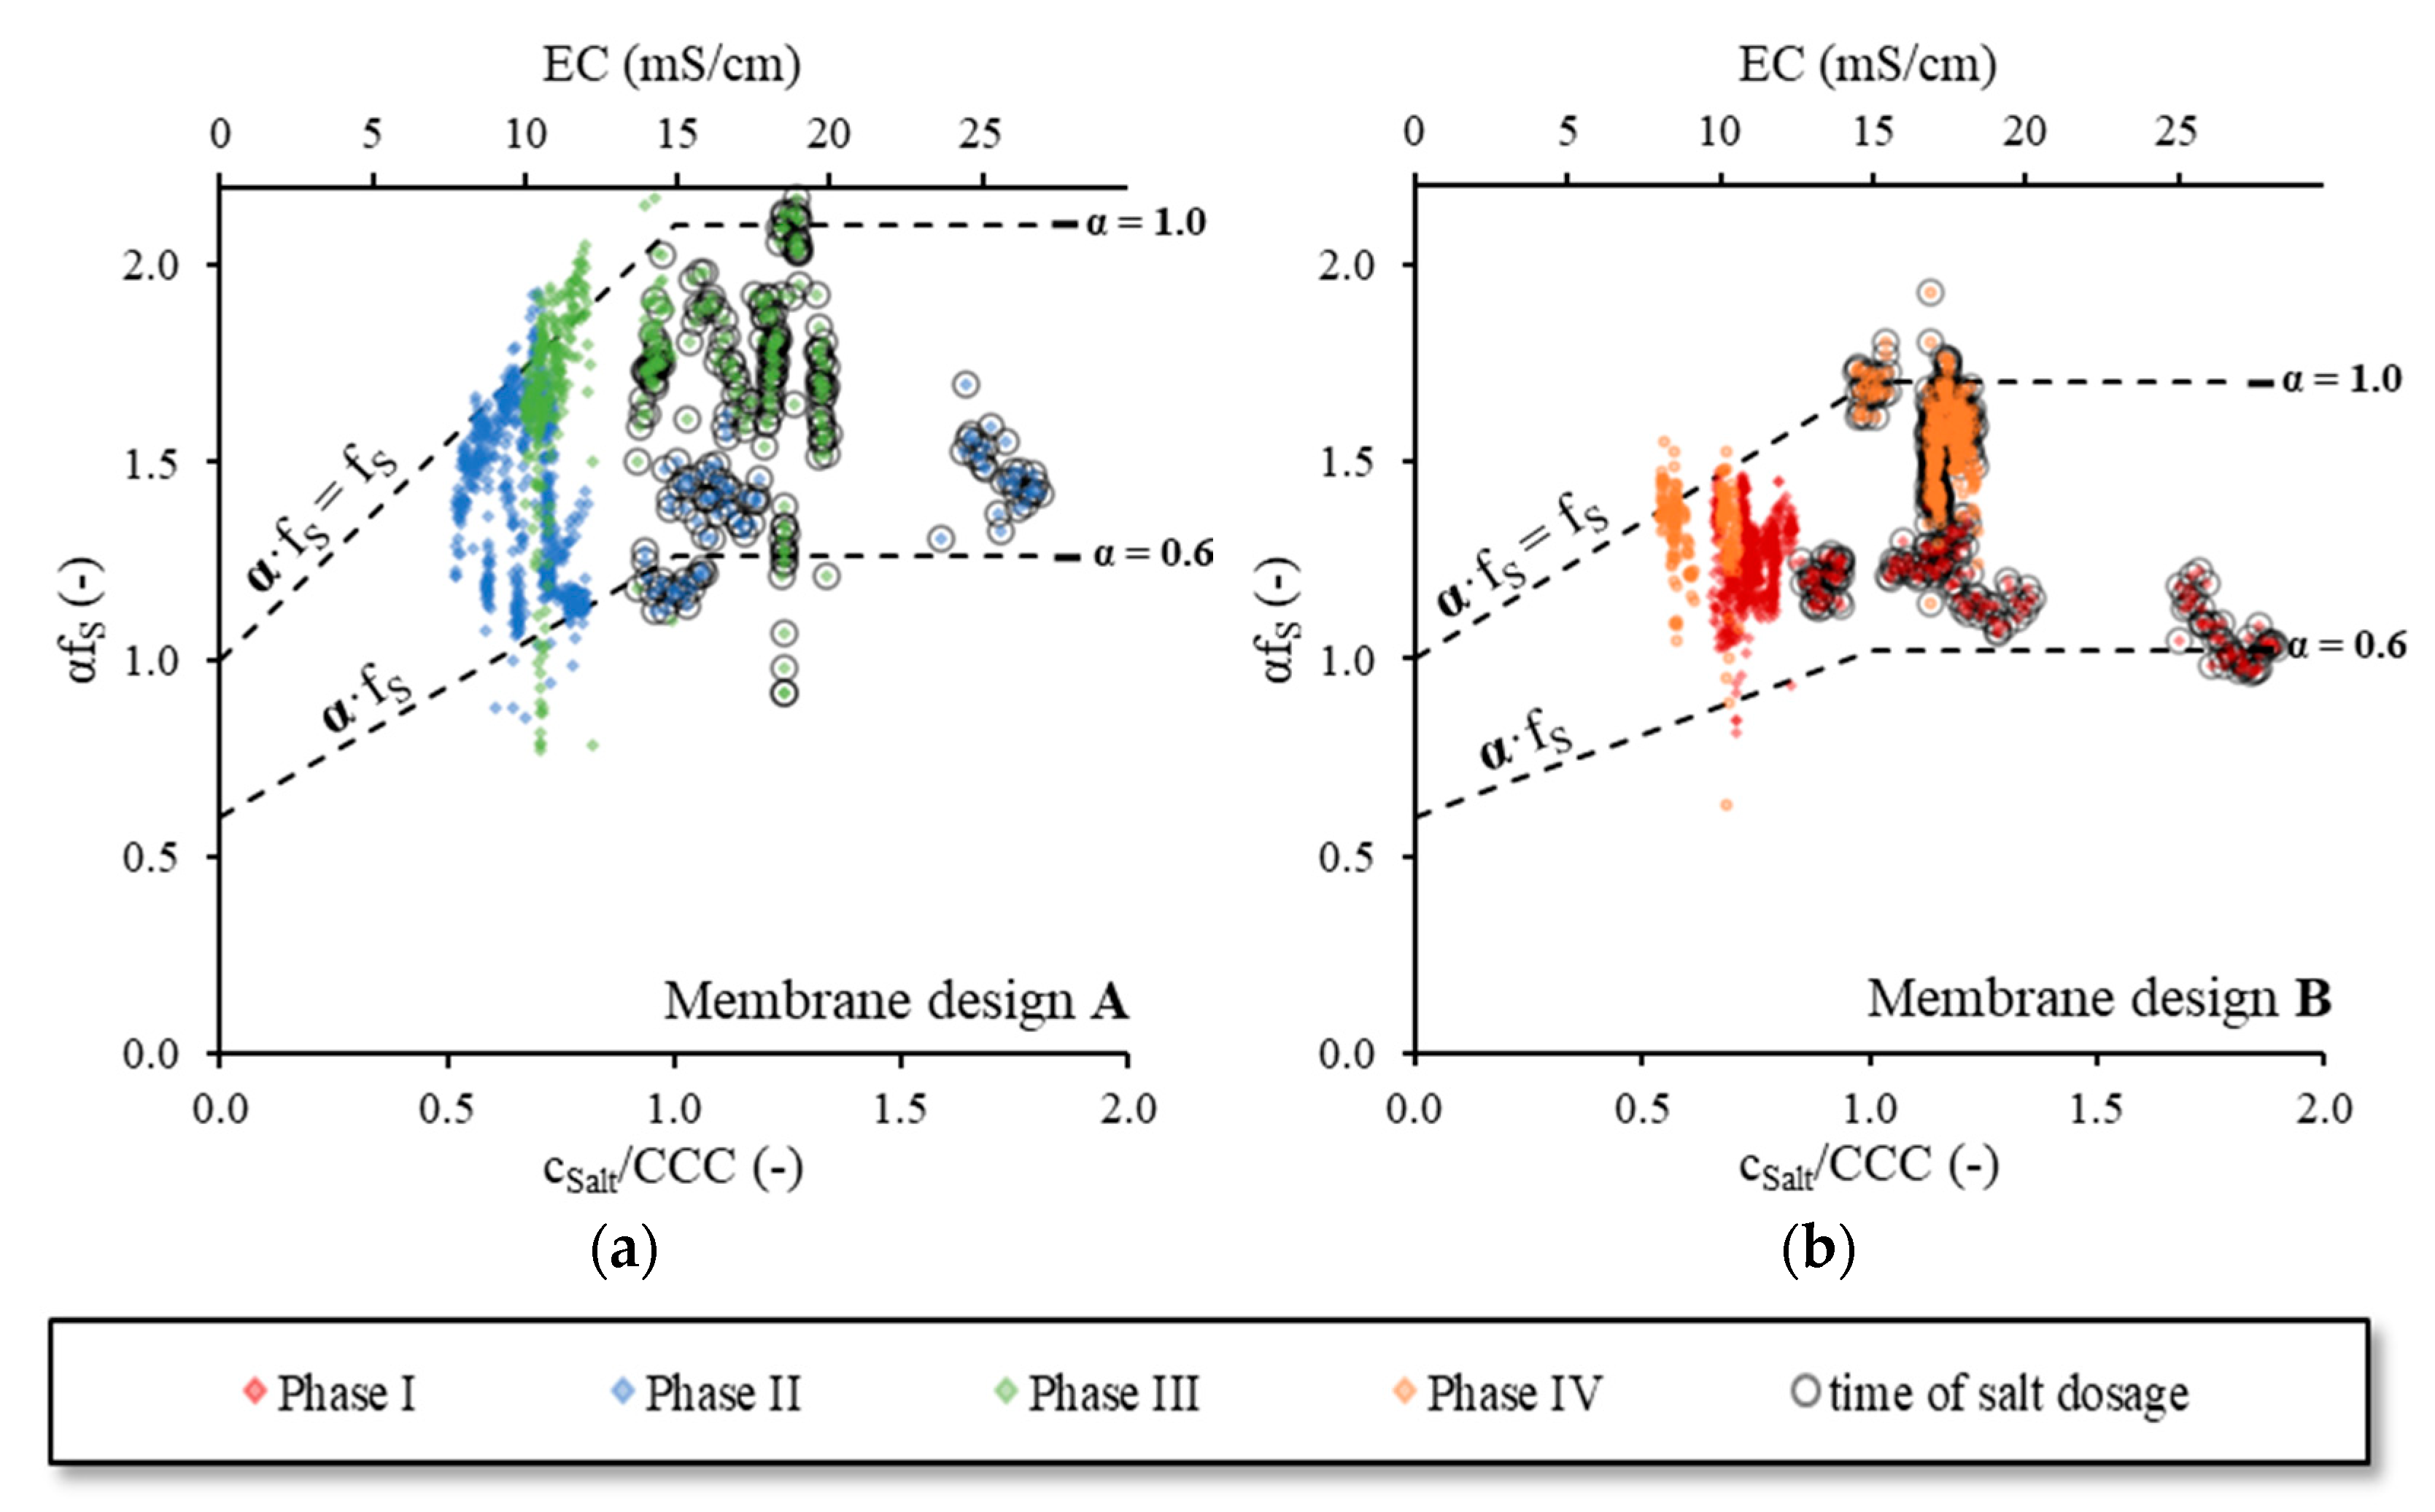
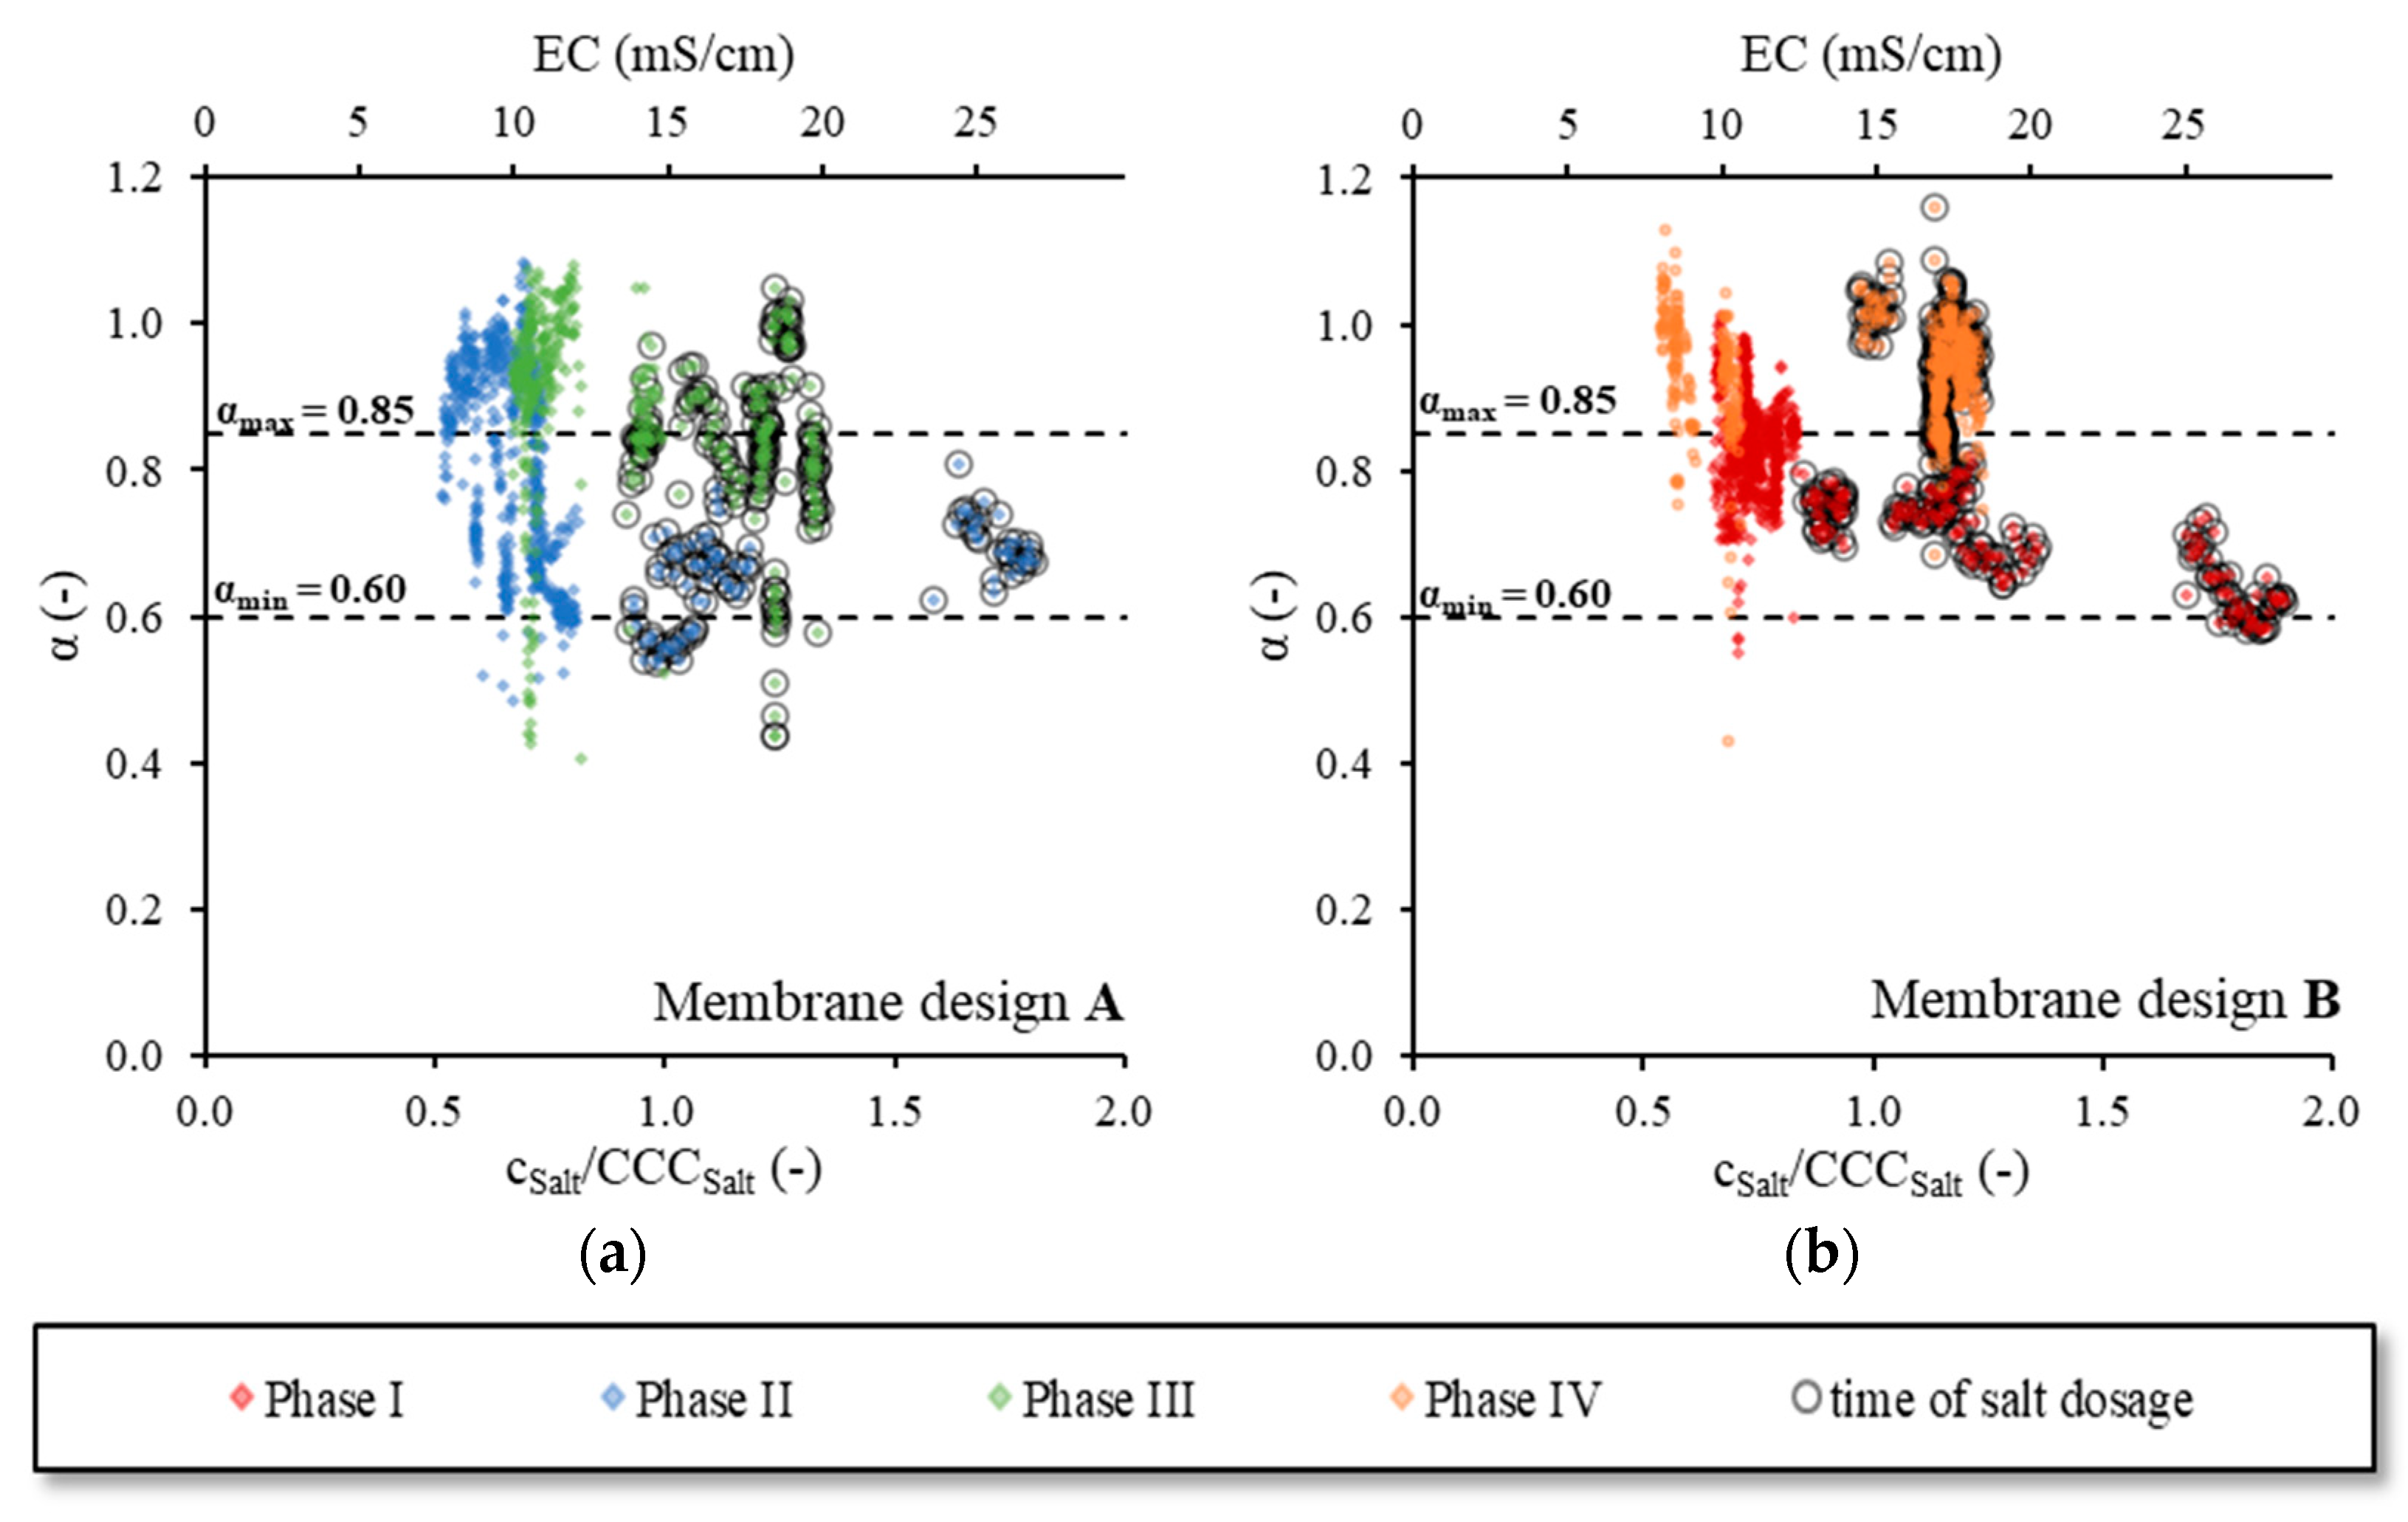
To assess the effect of the
cSalt on
αfS,
Figure 8 shows
αfS values as a function of the
cSalt/
CCCSalt ratio, separated by the membrane design. The
EC measured in B1 was plotted on the second abscissa. Presented as empty circle symbols, the
αfS values measured during the time of the salt dosing were additionally highlighted.
The upper dashed line shows the mean
fS progression calculated for the respective diffuser membrane design as described in
Section 3.2. Since the airflow rate was kept constant during the tests,
fS was only influenced by the membrane design and
cSalt. Therefore, the calculated progression of
fS represented the limit below the range of
αfs, which was to be expected. The measured
αfS values close to the calculated progression of
fS indicated that
α was approximately 1.0 and the oxygen transfer was not inhibited by wastewater ingredients. Corresponding to the dispersion of the
fS values around the specific regression functions in SW (see
Figure 4a),
αfS values fluctuated around the calculated
fS progression.
With a decreasing
α,
αfS decreased. Assuming a minimum
α for the current operation conditions (see
Table 4) of 0.6 [
8], the lower limit of the expected range of
αfS could be calculated (lower dashed line). In total, 90% of the measured
αfS values was within the expected range. Therefore, with the method presented in
Section 2.1 and the given design recommendations for α, we were able to correctly predict the range of
αfS and
fS in sAS as a function of the salt concentration.
When comparing the results of
Figure 8a,b, it became obvious that
αfS was higher for diffusers with diffuser membrane design A than with diffuser membrane design B. Averaging all αf
S values of a membrane design yielded a mean value of 1.6 for membrane design A and 1.4 for membrane design B, respectively. This represented a relative improvement of 14% in the oxygen transfer with membrane design A compared to membrane design B. If only the results of the phases with the same type of salt addition (shock or continuous) were compared, a similar improvement of 13% (Phase I vs. II) or 14% (Phase III vs. IV) was found. During the tests in SW with the same diffuser membrane designs [
1,
2], an improvement of a comparable magnitude was found (+10%).
Therefore, the present results confirmed the previous SW results [
2], and the oxygen transfer increased significantly in sAS in a similar proportion to that in SW and further improved when an optimized diffuser membrane design was used. The AS in the aerated reactor at the present TSS concentration of up to 7 g/L and the wastewater ingredients did not apparently affect the coalescence behaviour of the ascending gas bubbles. Thus, when designers of aeration systems for the activated sludge process are faced with the question of which diffuser or which diffuser membrane design show a higher oxygen transfer in sAS, this can be assessed with the use of relatively simple experiments in SW as described by Behnisch et al. [
1]. However, it must be investigated in the future to what extent these findings can be transferred to other biological treatment processes, which are also aerated by fine-bubble aeration systems. The coalescence could be affected due to a higher concentrated AS, such as the one presently used in membrane bioreactors. In other treatment processes, the biomass grows on inorganic carrier material or forms granules. These could influence the ascent of the gas bubbles and, therefore, the coalescence behaviour. Further experiments are, therefore, necessary.
3.6. α Value
With the known
fS for the respective membrane design (see
Section 3.2),
α was calculated according to Equation (4).
Figure 9 shows
α as a function of the
cSalt/
CCCSalt ratio separated by the membrane design. The EC measured in B1 was plotted on the second abscissa. Values measured during the salt dosage were highlighted with empty circles. According to the design recommendations for aeration systems in nitrifying WWTPs [
8], an
α between 0.60 (=
αmin) and 0.85 (=
αmax) was expected for the given treatment operation conditions (see
Table 4). The limits of the expected range of
α were marked as dashed lines. Less than 2% of the measured
α values were below the expected range. This showed that the
αmin value was estimated correctly and agreed with data from the literature.
Contrarily, approximately 45% of values were above
αmax. High
α values are not uncommon in WWTPs. However, an increase in
α of up to ~1.0 is usually only for a short time a day in periods of low-income load, e.g., at night or in the early morning. In the present case, the high
α values could be explained by the fact that the industrial wastewater is permanently slightly polluted. Surfactants and other possible oxygen-transfer-inhibiting constitutions were not explicitly measured, but elevated concentrations of such substances are usually accompanied by an increased organic concentration in the influent [
8,
27,
30]. An increased concentration of such substances in the influent is, therefore, most unlikely. Even the nutrient solution and its ingredients, which is dosed in order to achieve a sufficiently high OUR in the reactor (see
Section 2.5.), has almost no influence on the oxygen transfer [
23]. Therefore, if the wastewater was more polluted, extended times with lower
α and
αfS could be expected.
In Phase I and Phase II, the salt was dosed by shock load over 48 h. During the salt dosage, the inflow of industrial wastewater and, thus, possibly inhibiting ingredients was stopped. Only the dosage of the nutrient solution was continued. Since the ingredients of the nutrient solution did not inhibit the oxygen transfer and the
TSS concentration was kept constant by continuing the WAS removal, we expected that
α would rise towards 1.0. The opposite happened. In Phase I,
α even decreased slightly with an increasing
EC (see
Figure 9b). This was not observed in Phases III and IV with a continuous salt dosage.
A possible explanation is that the salt shock caused the microorganisms to produce oxygen-transfer-inhibiting substances [
6,
8,
29,
30]. Since the influent was stopped during the salt dosage, these substances accumulated in the system (i.e., reactor B1 and B2), thereby enhancing the effect. When the salt dosing was stopped and the inflow restarted, these substances were diluted and
α rose to the value before the salt dosing. This explanation was consistent with observations from other studies. It is a well-known fact that microorganisms secrete more extracellular polymeric substances (EPSs) to adapt to adverse environmental conditions [
31]. Ng et al. [
32] found an increase in organic dissolved substances with a rising salt concentration. Jia et al. [
33] measured an increase in the EPS concentration with both increasing and decreasing salt concentrations. Baquero-Rodríguez et al. [
34] stated that the solved fraction of EPSs (SMP) especially inhibited the oxygen transfer.
We could not investigate this phenomenon further. However, when designing aeration systems, it should be noted that the oxygen transfer can be inhibited if the salt concentration fluctuates, not because of variations in fs, but because of secondary effects. Strong fluctuations in the concentration can be prevented, for example, with an equalisation tank upstream of the aeration tank.
3.7. Performance Comparison of Both Diffuser Membrane Designs
Results presented in
Section 3.5.3. show that installing diffusers with the small slit membrane design increased the oxygen transfer up to 14% in sAS compared to the large slit membrane design. However, the small slits resulted in a rising pressure drop (see
Section 3.5.2) and a corresponding increased power requirement of the blowers (
P). Therefore, using diffusers with the small slit membrane design in saline conditions caused advantages and disadvantages. It is questionable at which
cSalt/
CCC ratio the use of the small slit membrane design improves aeration. To answer this question, we compared the performance of both diffuser membrane designs.
For the performance comparison, we calculated, based on the TW results (see
Section 3.3), the given equations for calculating
fS (see
Section 3.2) for the corresponding membrane design and a fixed
α in the standard oxygen transfer rate in the process water (
SOTRPW; kg/h), standardized at
DO = 0 mg/L, atmospheric pressure = 101.3 kPa and
T = 20 °C:
where
V is the aerated water volume (m
3),
β is the ratio of oxygen saturation concentration in process conditions to standard conditions (-) and
cS,20 is the oxygen saturation concentration at standard conditions (mg/L). Since the
α of the present experiment was exceptionally high due to the low wastewater contamination (see
Section 3.6.), to obtain representative results for the
SOTRPW calculation, we assumed a fixed
α of 0.75, which is a typically mean value for nitrifying WWTPs [
8].
The aeration efficiency (
AE) was suitable to illustrate the interaction between increased energy requirements and improved oxygen transfer. It is defined as the ratio
SOTRPW to
P [
18].
Positive displacement blowers (PD) are commonly used for air supply on WWTPs. For this type of blower,
P could be calculated using the isochoric power formula [
34]:
where
QA is the airflow rate (m
3/s),
ph is the hydrostatic pressure resulting from the depth of submergence (kPa),
pD is the pressure drop of diffusers (kPa),
pS is the pressure of the pipes (kPa) and valves and
η is the overall efficiency of the blower (-). The
ph increased with the increasing
cSalt due to the increment of water density. Nevertheless, this increase was marginal and could be neglected [
2]. The
pD depended on the membrane design (see
Section 3.5.2). The
pS was affected neither by the
cSalt nor by the diffuser membrane design. Assuming a typically
η for the PD blowers of 0.60 [
35] and using
pD results shown in
Section 3.5.2 (Design A: 10 kPa; Design B: 7.7 kPa) for
QA = 1.5 m
3/h, a
P of 32 W and 30 W was calculated for diffuser membrane design A and design B, respectively.
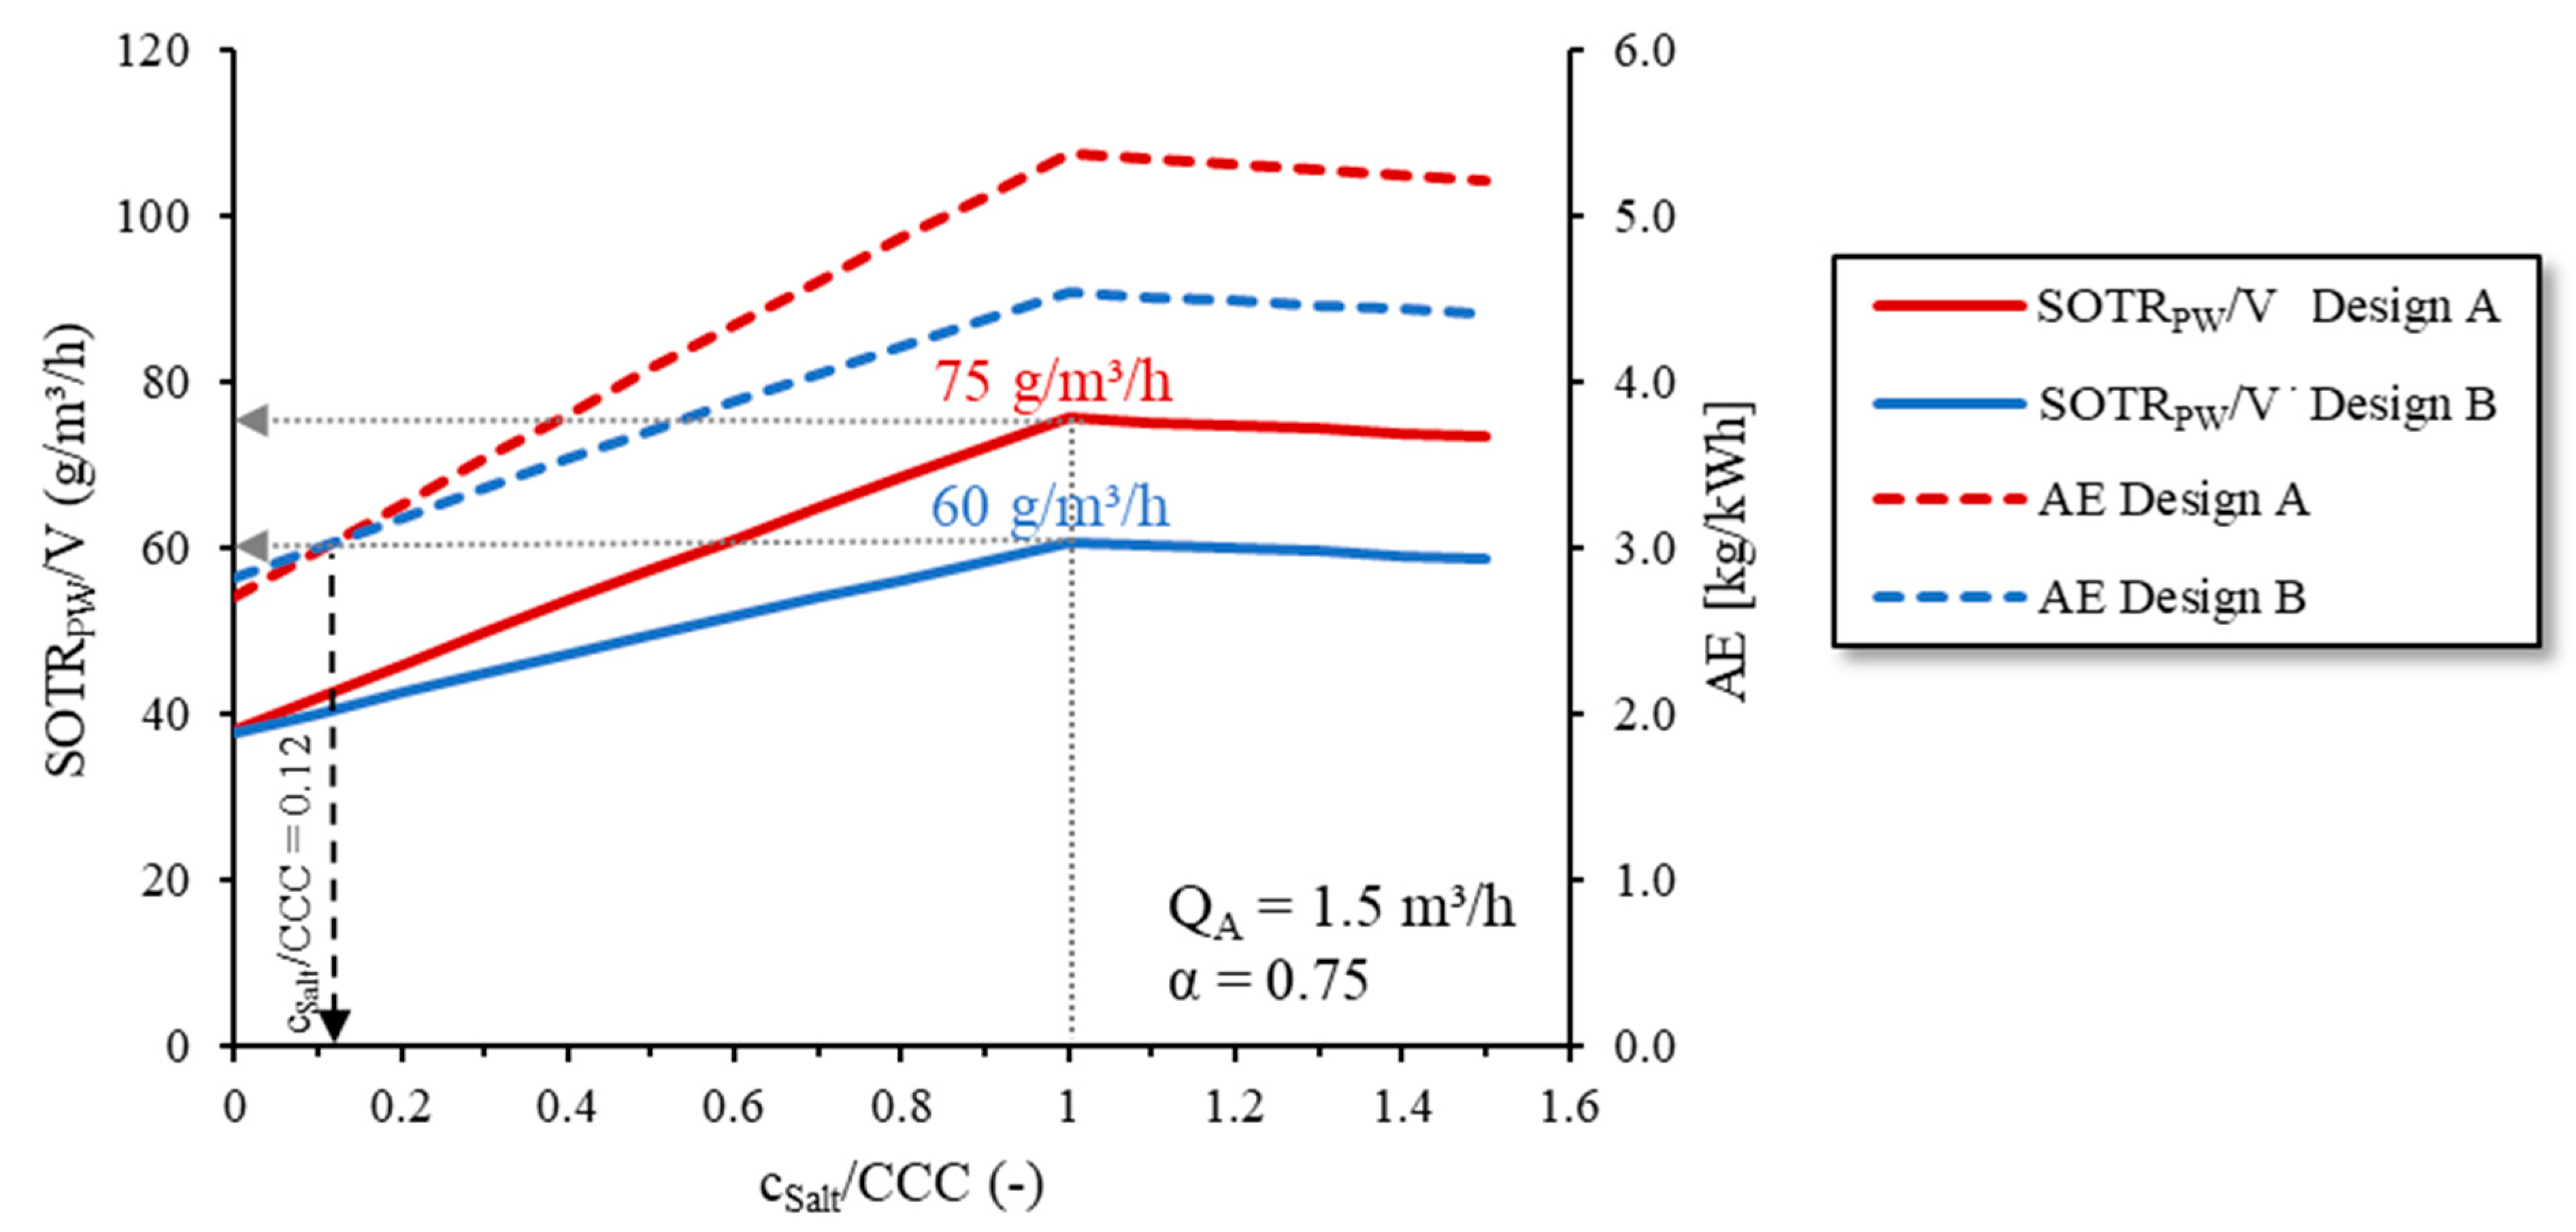
Figure 10 shows the
SOTRPW per aerated water volume (
SOTRPW/
V; m
3/h) as a function of the
cSalt/
CCC ratio. AE was plotted on the second ordinate. For both diffuser membrane designs, the
SOTRPW/
V and AE increased with an increasing
cSalt/
CCC ratio and reached their maxima when the
cSalt/
CCC = 1.0. When the
cSalt/
CCC > 1.0, the
SOTRPW/
V and AE decreased again due to the constant
fS (see
Figure 5) with a simultaneous decrease in the oxygen saturation concentration.
The high
SOTRPW/
V values of up to 75 g/m
3/h reached for membrane design A and 60 g/m
3/h for membrane design B when the
cSalt/
CCC = 1.0 showed improved aeration due to the increased salt concentration. In TW with fine-bubble aeration systems and corresponding
QA,VAT, a mean
SOTRPW/
V of 60 g/m
3/h is typical [
36,
37]. Despite the consideration of the
kLa inhibition by
α = 0.75, this value was reached and even clearly exceeded in the case of diffuser membrane design A.
When the
cSalt/
CCC = 0,
SOTRPW/
V was identical for both diffuser membrane designs due to similar TW
kLa values (see
Section 3.3). However, due to the higher pressure drop of membrane design A and the corresponding higher power requirement for air supply, the
AE of membrane design A was lower than that of membrane design B. This means that in non-saline conditions, the use of diffusers with smaller slits decreases the energy efficiency of aeration systems. Therefore, in non-saline conditions, it is more efficient to use diffusers with larger slits and, therefore, a lower pressure drop.
Because of the increasing coalescence inhibition and the corresponding increase in fS with the rising cSalt/CCC ratio, the SOTRPW/V and AE increased more rapidly for membrane design A than for membrane design B. When the cSalt/CCC > 0.12, the AE of membrane design A exceeded the AE of membrane design B. That mean that with given the diffusers (fS, pD) and a fixed QA of 1.5 m3/h, the aeration improved when using diffusers with membrane design A than with membrane design B as soon as the cSalt/CCC > 0.12.
However, in the present SOTRPW and AE calculation, for simplification we used a fixed airflow rate (QA = 1.5 m3/h) as set during the sAS oxygen transfer tests. Since fS increased differently for different diffuser membrane designs, this resulted in different SOTRPW values with an increasing cSalt/CCC ratio as described before. To match the same SOTRPW/V with both diffuser membrane designs, QA could be adjusted. Since both fS and pD changed with a changing QA, this would require the recalculation of the SOTRPW and P.


