3.2. Source Identification of Water Pollution
The correlation matrix in the principal component analysis (PCA) represents both the positive and negative correlation among the water quality parameters based on the water sampling data of 2015. Several positive and negative correlations among the water quality parameters indicate more than one component solution in PCA. It also represents the range of variables in a standardized format. Moreover, the determinant greater than zero, (i.e., 5.62 × 10
−8;
Table 4) also suggests conducting a PCA to find out the correlations among water quality parameters.
The Kaiser–Meyer–Olkin (KMO) and Bartlett’s test is a justification of the data reduction procedure. The significant result (
p = 0.000;
Table 5) of Bartlett’s test of sphericity interprets that at least there is a significant correlation in the correlation matrix, and the correlations are not near zero. The Kaiser–Meyer–Olkin measure of sampling adequacy, (i.e., 0.687;
Table 2) also measures the effect size of the data to conduct the PCA. The accepted value of the Kaiser–Meyer–Olkin measure of sampling adequacy is > 0.4.
The communalities also explained the highest 96.5% (
Table 6) variance extracted from the parameter Cr, followed by 96.4% and 92.4% from Cd and Pb, respectively, as well as the lowest 71.3% from DO. However, the extraction of variance >20% from the data was good for the PCA. The total variance explained three components solution (
Table 6). The first three components show the eigenvalues greater than one (
Table 6 and
Figure S1), and the first component explained about 61.727% (
Table 6) of the total variance, and cumulatively, the rotated component matrix explained about 85.363% of the total variance although cumulatively >60% of the explained total variance was accepted for the component rotation.
The scree plot (
Figure S1) determined how many components should be extracted in this PCA. The scree plot also showed that after the first two-component values, the difference among the eigenvalues declined, and then the curve flattened. The values less than zero were not accepted for the component analysis, and the values close to one also could not interpret the data meaningfully. Hence, the scree plot analysis also suggests a three-component solution, although the third component was very poorly defined, relating to only a strong factor loading, i.e., pH (
Table 6).
The varimax rotation method produced an orthogonal factor rotation, and it forced the factor solution to be orthogonal as well as the factors were not highly correlated to each other. If the factors were uncorrelated orthogonal, then the varimax with Kaiser normalization factor rotation would yield a more orthogonal factor solution. There would be some correlation among the factors and the varimax with the Kaiser normalization rotation procedure would measure it. Moreover, the factors sorted by size also helped to interpret the rotated component matrix efficiently.
The first component explained about 61.727% (
Table 6) of all water quality data and observed adequate positive loadings of specific conductance (SPC)/ electrical conductivity, (i.e., SPC = 0.967), total dissolved solids, (i.e., TDS = 0.935), salinity, (i.e., SAL = 0.956) as well as temperature, (i.e., temp = 0.797). However, dissolved oxygen, (i.e., DO = −0.816) and aluminum, (i.e., Al = −0.720) have strong negative loadings. Although the strong loadings indicated that they were strongly influencing each other, the negative loadings suggested an opposite trend to the positive loadings in the same group.
Similarly, the second component explained about 12.71% of the total variance, and the observed adequate to moderate positive loadings of arsenic (As = 0.809), chromium (Cr = 0.806), lead (Pb = 0.714), and cadmium (Cd = 0.564) indicated inorganic pollution in the Langat River both from the natural and anthropogenic sources. These strong loadings of inorganic metals in the second component also suggested that they were in the same group and were strongly related to each other. Strong factor loadings of Cr in the second component also indicated the high concentration of Cr in the river mainly from the weathering of oxisols, which come from the lithogenic serpentinite rock underneath the peninsular of Malaysia [
47]. In addition to the natural weathering process, the corrosion inhibitors and pigments in the industrial effluents also contribute to increasing the concentration of Cr in the river.
Similarly, the third component observed a strong positive loading of pH (0.956) indicating an intrusion of saline water in the Langat River and this third component explained the 10.926% variance. The dissolved metals are largely influenced by the physicochemical parameters such as pH, electrical conductivity, water residence time, and changing bedrock lithology from granite bedrock upstream to the quaternary sediments downstream. Moreover, mildly alkaline river water under oxidizing conditions favors adsorption of Cd, Pb, and As possibly onto the secondary oxides of Fe, Al, and Mn [
48]. Therefore, the dissolution of As, Cd, and Pb with the high pH (alkaline) condition can be predicted well through the multiple regression model. While the rotated component matrix contains all loadings (even those <0.3) for each component, and the component plot (
Figure 2) gives a visual representation of the loadings.
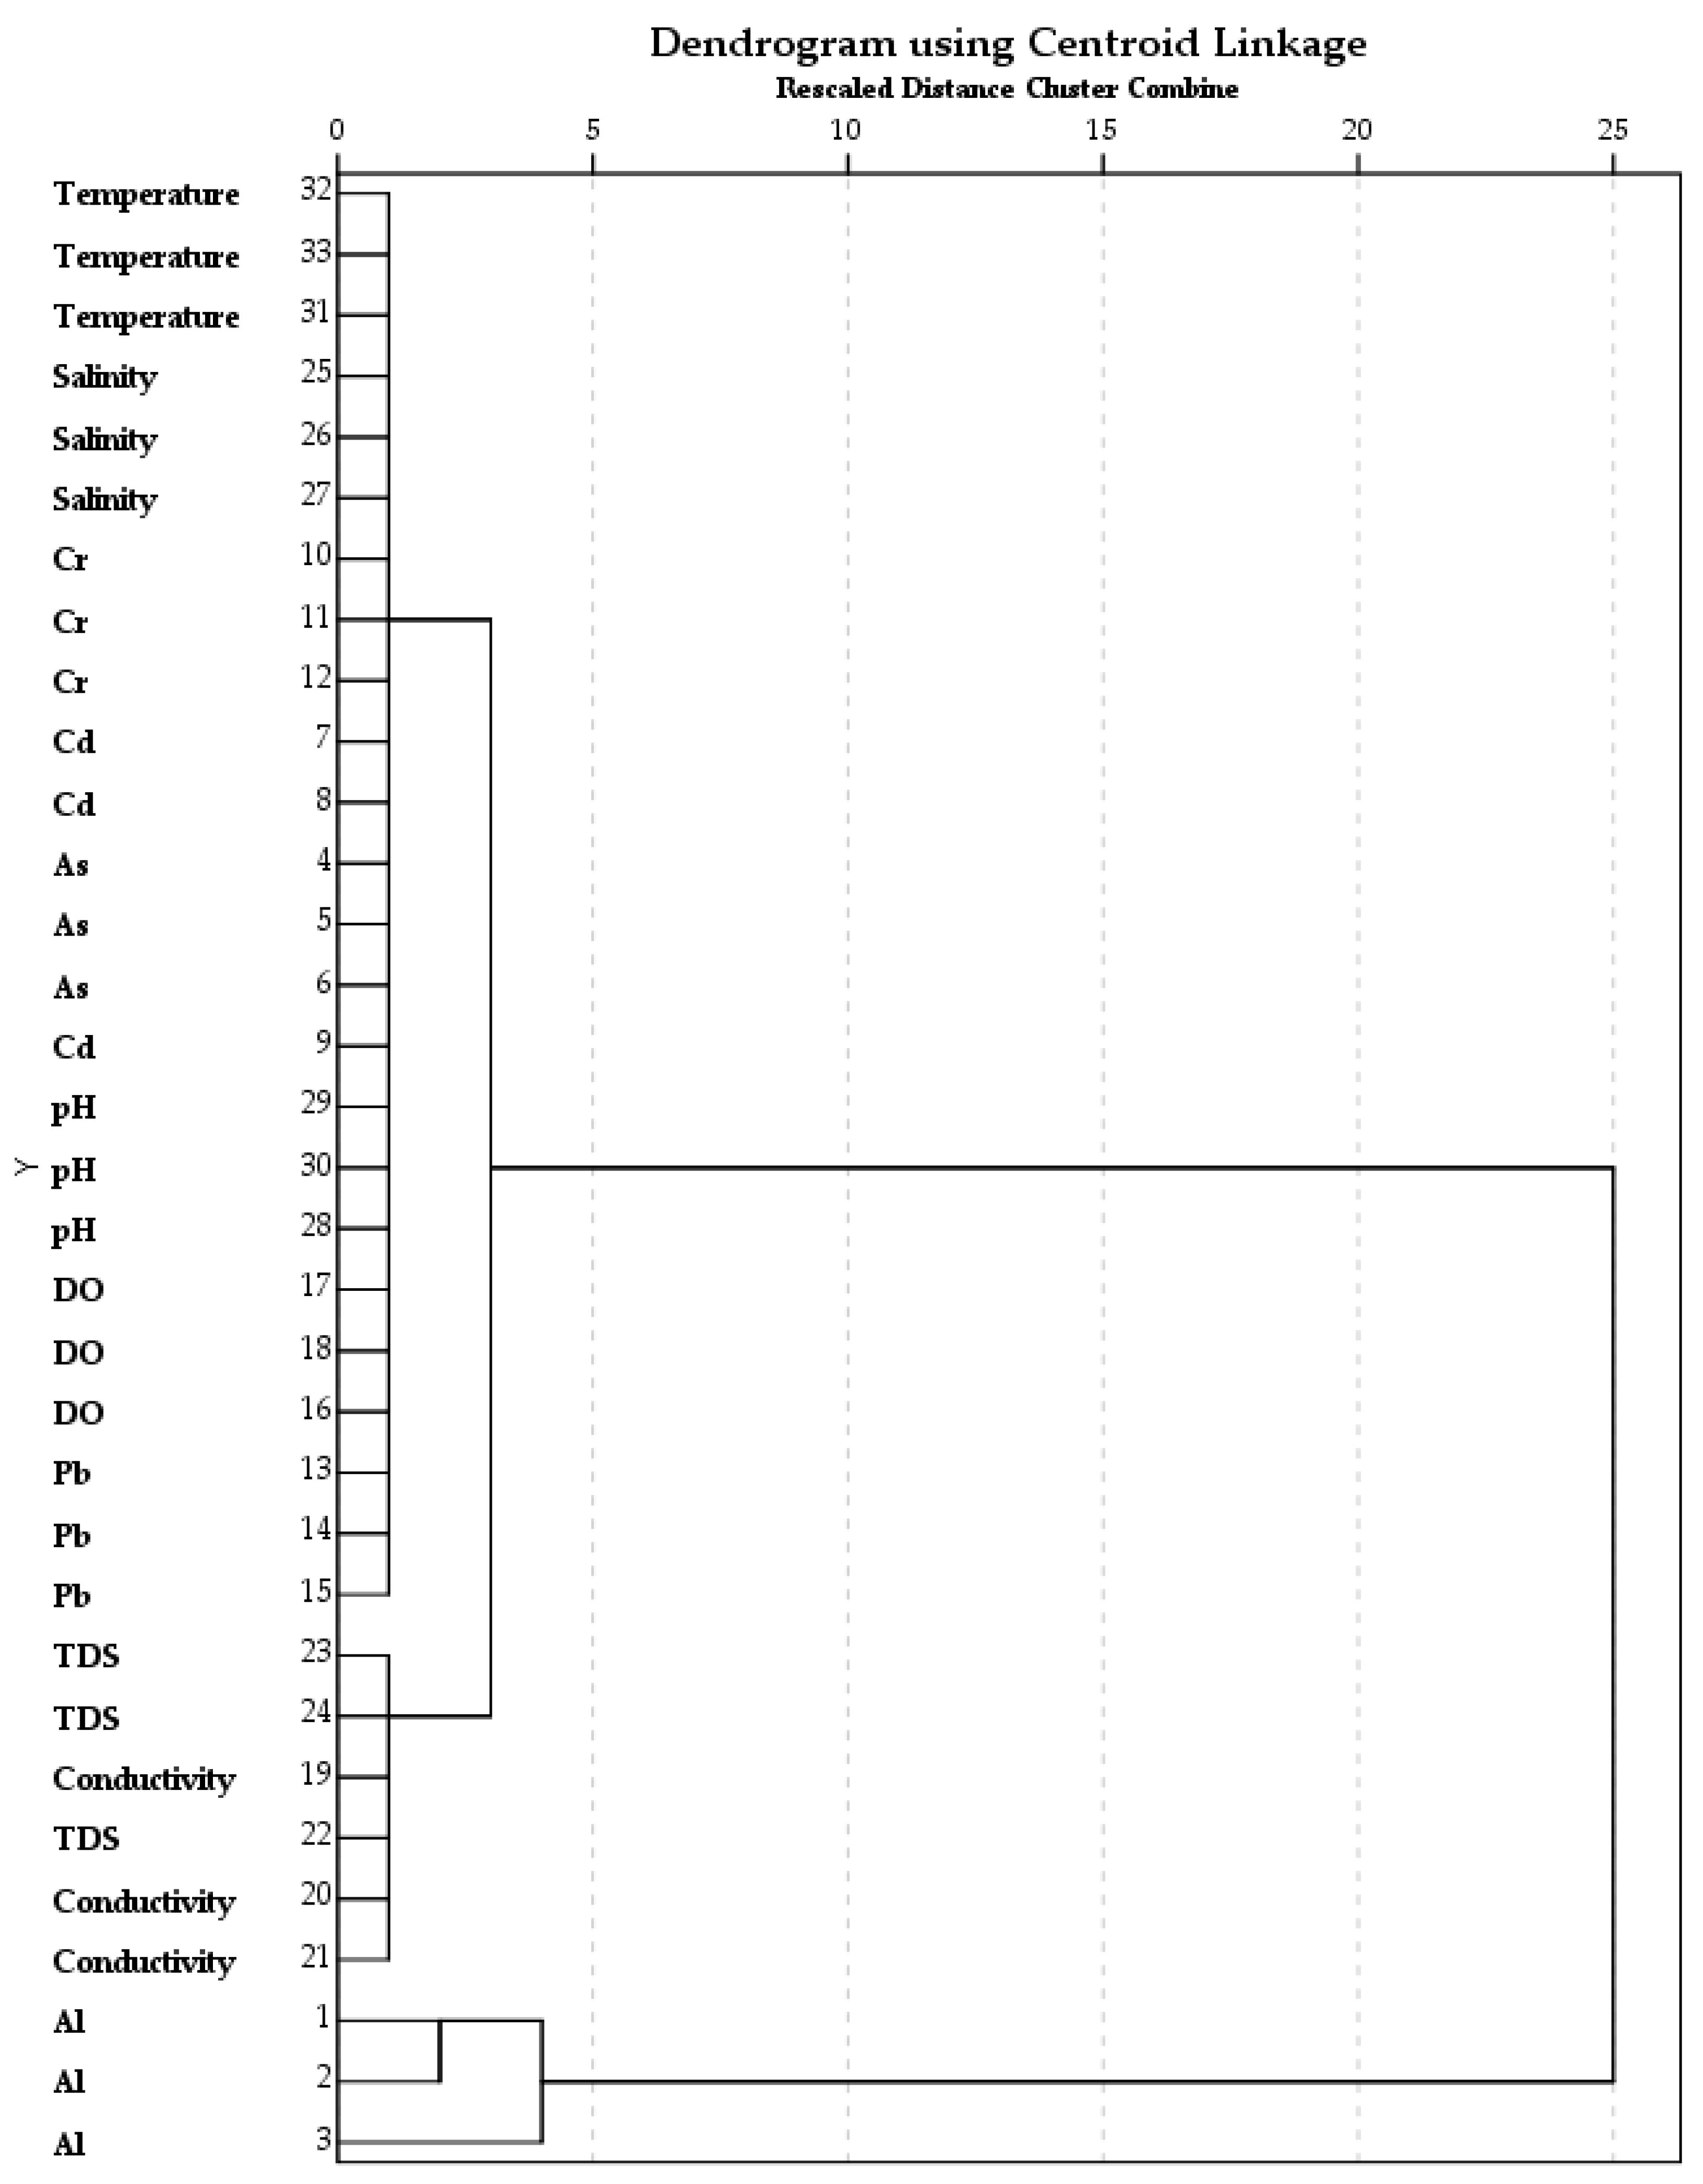
The hierarchical cluster analysis (HCA) supported the findings of principal component analysis (PCA) because the graphical representation of HCA found the similarities among the water quality parameters within a cluster as well as dissimilarities among the clusters. The agglomeration schedule coefficients also verified the graphical representation of clusters through a dendrogram. Two main clusters (Group 1 and Group 2) were specified based on the water quality parameters through HCA (
Figure 3). Group 1 consisted of salinity (SAL), pH, dissolved oxygen (DO), temperature (temp) as well as metals i.e., As, Cd, Cr, and Pb. The selected metals in Group 1 are also like the loadings of metals in the factors loading in Group 2 of the principal component analysis (PCA). The presence of metals, i.e., As, Cd, Cr, and Pb in the same cluster is also supported by the Pearson correlation analysis. The Pearson correlation (
Table 7) among the dissolved metals indicated significant and strong affirmative correlations, e.g., between Al-Pb (r = 0.781,
p < 0.01), As-Pb (r = 0.565,
p < 0.01) Cd-Pb (r = 0.735,
p < 0.01) and Cr-Pb (r = 0.582,
p < 0.05).
The physicochemical parameters, i.e., salinity, pH, temperature, and dissolved oxygen (DO) are related to each other and have significant negation correlation with the studied metals except for DO (i.e., Al-DO = 0.626,
p < 0.01; As-DO = 0.533,
p < 0.01; Cd-DO = 0.650,
p < 0.01; Pb-DO = 0.582,
p < 0.01;
Table 7) indicated their strong influence on the presence of dissolved metals in the Langat River. Although electrical conductivity and total dissolved solids are related to other parameters in Group 1, they are dissimilar to other parameters in the same group. For example, TDS and electrical conductivity have a negative significant correlation with metals (
Table 7). Similarly, the significantly opposite correlations between pH and metals, (i.e., Al, Cd, Cr, Pb) in the Langat River are also supported by the study of Aris et al. [
49]. Therefore, Group 1 indicated that the metals in the Langat River are mainly via natural weathering of granite rock underneath the entire basin [
47,
48,
49,
50,
51] as well as effluent discharges from the domestic, industrial, and runoff from the urban and agricultural sources. Moreover, Liu et al. [
52] also reported the presence of dissolved Pb from the atmospheric sources in the river.
However, in the HCA, Group 2 only represents the dissolved Al (
Figure 3) indicating the large attribution from man-made sources to increasing the concentration of Al in the river. However, the cluster of Al is also related to other metals and physicochemical parameters in the Langat River. Hence, the Pearson correlation (
Table 7) between Al and other metals in the Langat River found significant and strong positive relations, i.e., Al-Pb (r = 0.781,
p < 0.01), Al-Cd (r = 0.689,
p < 0.01) and Al-Cr (r = 0.468,
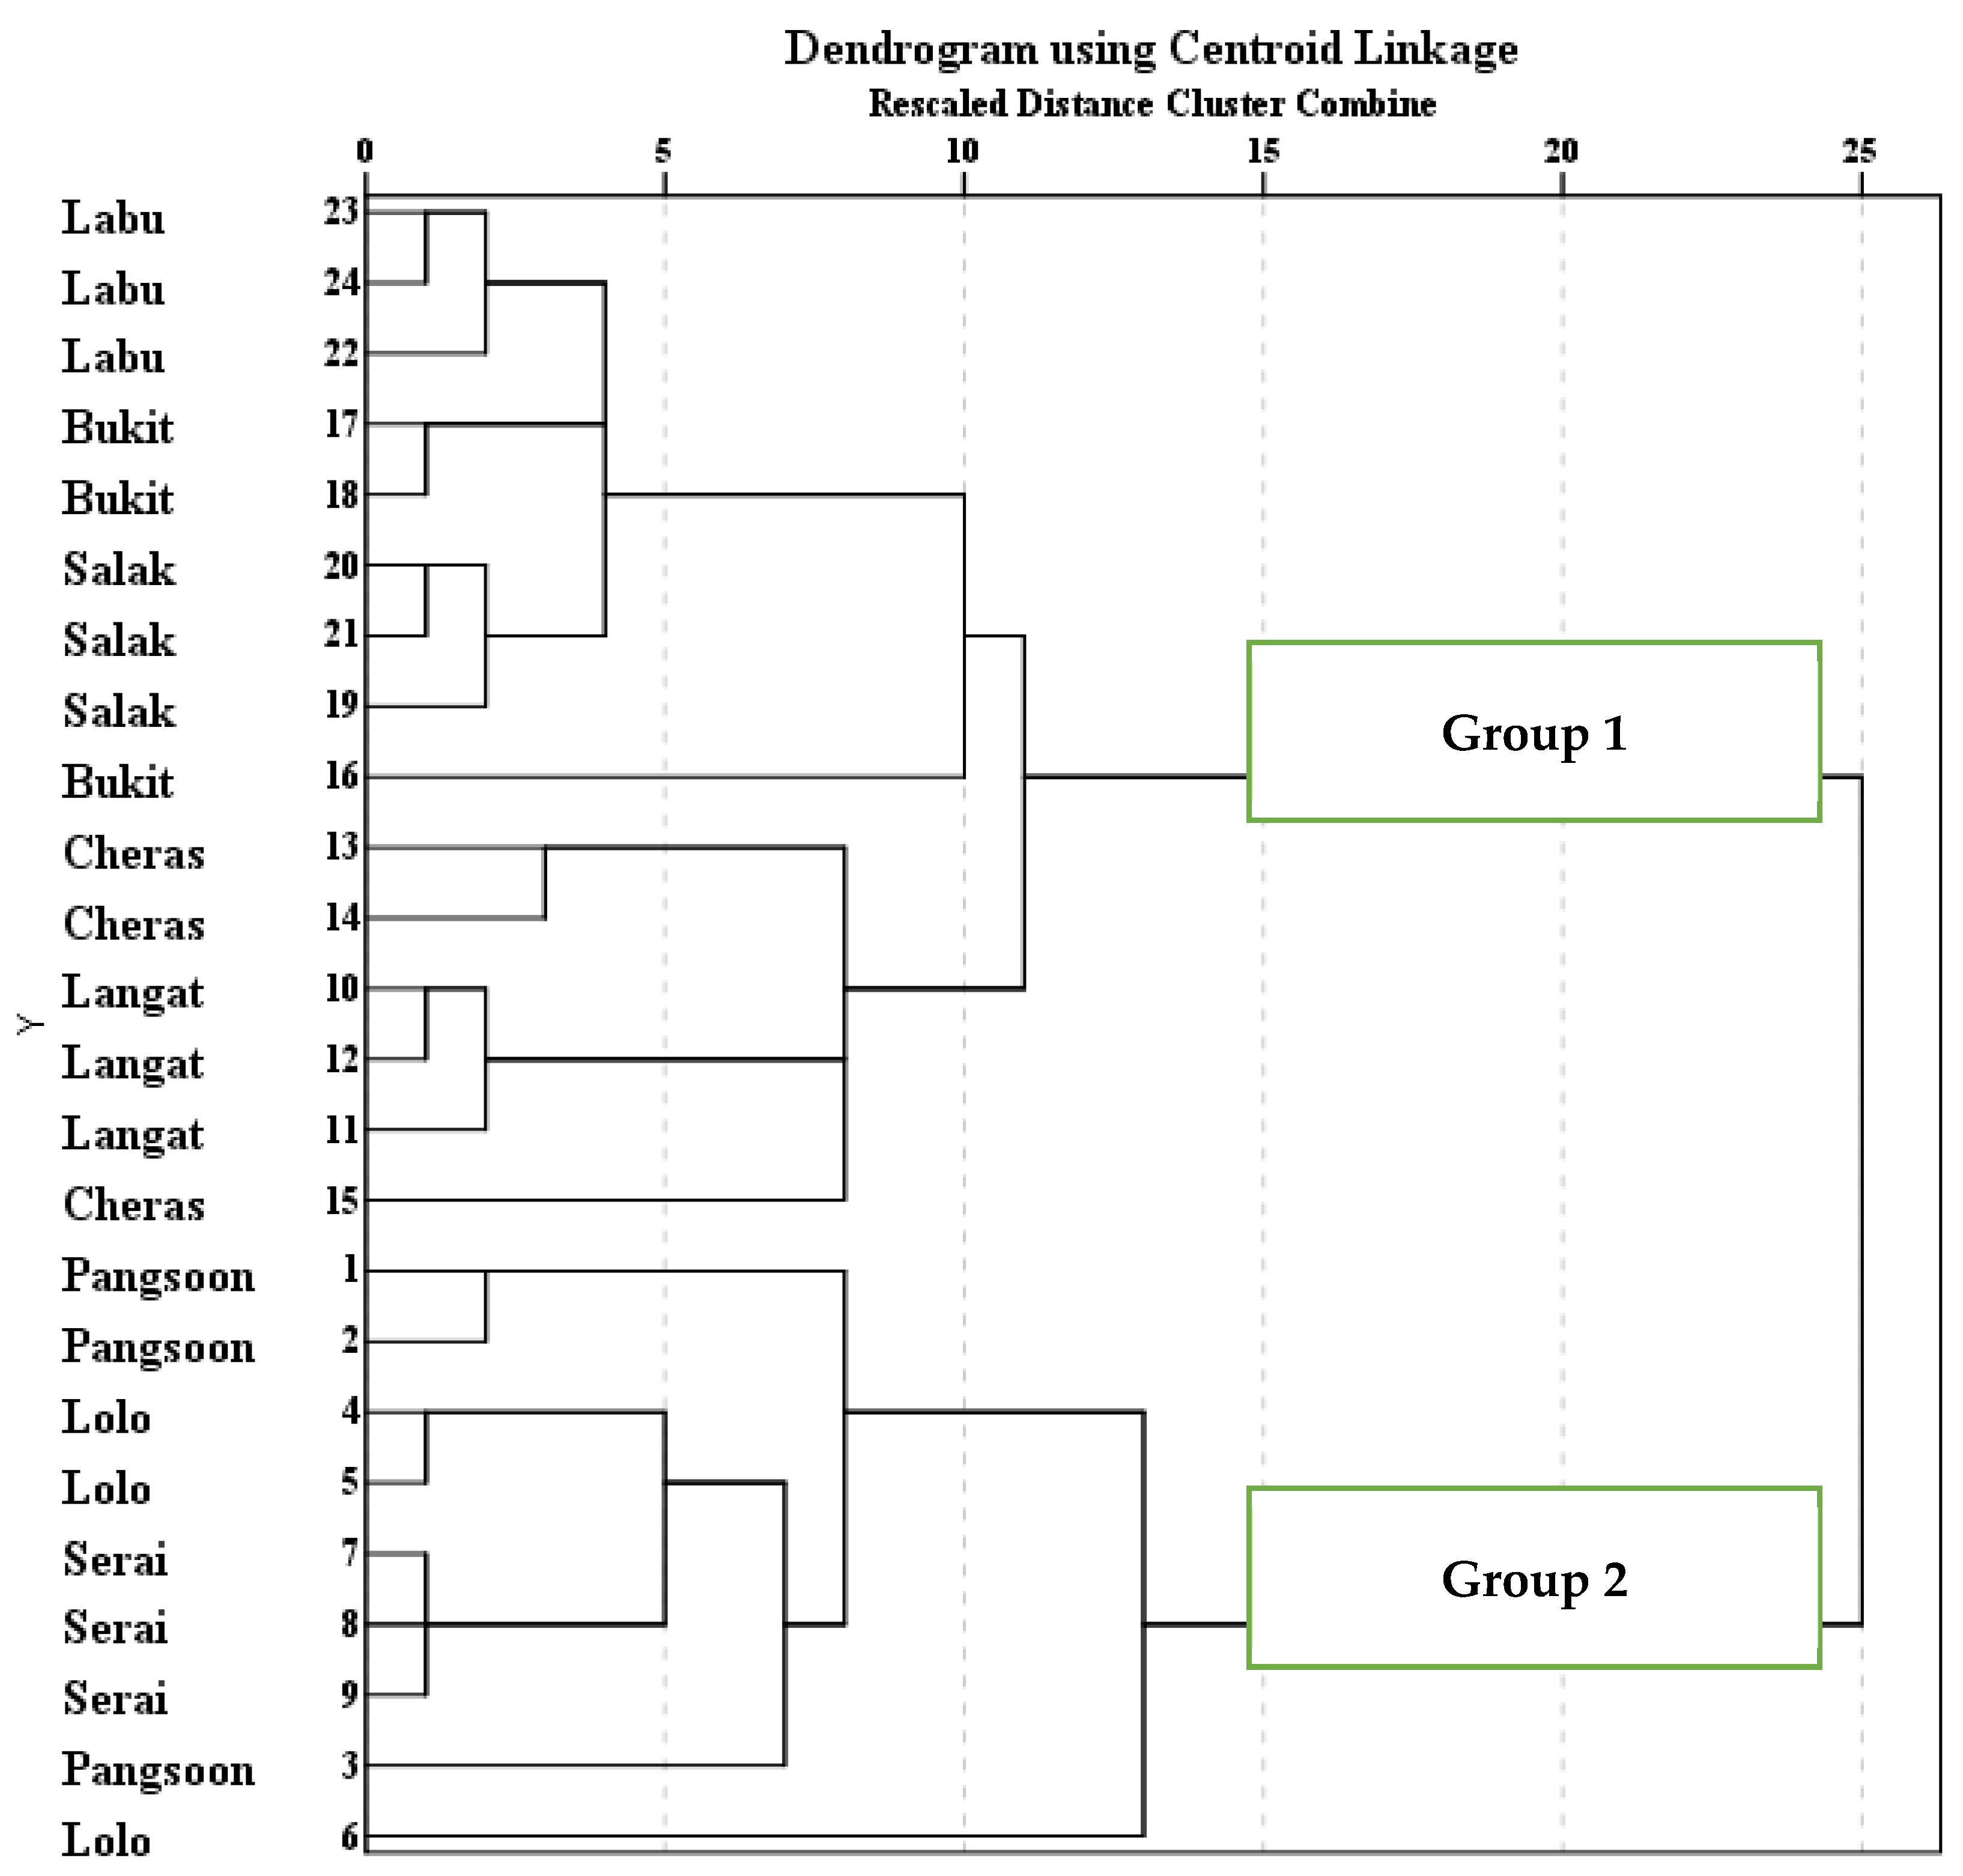
p < 0.05). Therefore, the HCA clustered the river sampling points broadly in two groups (
Figure 4) for their similarities within locations and dissimilarities among locations based on the water quality parameters to identify specific pollution sources in the Langat River. Group 1 comprised of Pangsoon, Lolo, and Serai areas, which are the upstream area with undisturbed forests, while Group 2 consisted of Langat, Cheras Mile 11, Bukit Tampoi, Salak Tinggi, and Sungai Labu areas, which are situated in mid to downstream of the basin, and these findings are similar to the study of Yap [
53].
The four drinking water treatment plants (DWTPs), i.e., Sungai Pangsoon, Sungai Lolo, Sungai Serai, and Sungai Langat are situated upstream (
Figure 4). The upstream of Langat River Basin is a hilly area along with the dense tropical forest. The inhabitants are mainly the native people of this Hulu Langat area. Therefore, there are few human activities in the upstream area except for a small number of campaign sites. Thus, the water was clean at the upstream water sampling points, especially at the Sungai Pangsoon, Sungai Lolo, and Sungai Serai points compared to the Sungai Langat point [
53]. The water quality was slightly polluted at the Sungai Langat point based on the observation, which might be due to the land clearance, agricultural, and logging activities as well as discharges of effluent from the industries in a few places.
However, the remaining four drinking water treatment plants, i.e., Cheras Mile 11, Bukit Tampoi, Salak Tinggi, and Sungai Labu from midstream to downstream of Langat River Basin experience moderate to high water pollution incidents. The Cheras Mile 11 DWTP is situated in the midstream of the Langat River Basin. The midstream of Langat River Basin is a built-up area and pollution in the river is mainly from the residential and industrial discharges apart from the agricultural activities such as oil palm plantation and rubber cultivation. Hence, the pollution level downstream is higher compared to the up and midstream because it accumulates all the pollution occurring in the up to midstream. The chemical pollution from the industrial zones is happening frequently [
54] apart from the agricultural, animal husbandry, and residential waste discharge activities, etc.
The watercolor of the Langat River from midstream to the downstream was observed light brownish to deep brownish. The reason for the brownish watercolor might be due to the excessive run-off from the oil palm plantation and rubber cultivation. The land use map of Langat River Basin also indicates the oil palm plantation in these areas (
Figure 5). The discharge of sewage might have also contributed to the pollution of the Langat River [
53]. Many manufacturing, metal finishing, and paper-based industries as well as ex-mining, and sand and gravel extraction activities in the mid to downstream areas have contributed largely to the pollution of Langat River [
54].
3.3. Predicting Metal Concentration in Langat River
The multiple linear regression model is proved very useful to predict the water pollution in the Langat River. Therefore, the Shapiro–Wilk normality test was performed to justify the suitability of data to run the regression model. The Shapiro–Wilk normality test at the 0.05 level ensured that the metals and physicochemical data had normal distribution; however, the data of As (
p = 0.593), and DO (
p = 0.081) were log-transformed to run the regression model (
Table 8). The increase, as well as decreased concentration of water quality parameters based on the regression model, were appropriate to predict the metal’s concentration in the Langat River.
The multiple linear regression Model-1 represents the concentration of dissolved Al in the Langat River, estimated that around 79.1% of data, (i.e., adjusted R²) were used to justify the model. The ANOVA was also found significant (F = 11.851; p = 0. 00003) for Model 1 (Al) to predict the linear relation between the dissolved Al concentration and the other independent variables. Model 2 (As), represents the dissolved As, which estimated that about 60% of the variance was used to calculate the model. The significant ANOVA (F = 5.321; p = 0.003) for Model 2 also indicates a linear relationship between As and other independent variables. Similarly, Models 3 (Cd), 4 (Cr), and 5 (Pb) also explained the regression model via calculation of 63.4%, 22.9%, and 76.6% of data, (i.e., adjusted R²), respectively. The significant ANOVA test of the Model 3 (F = 5.976; p = 0.002), and Model 5 (F = 10.433; p = 0.0001) also indicated the linear relationships among the water quality parameters.
Model 1 explains that Pb (p < 0.05), electrical conductivity (p < 0.05), pH (p < 0.05) and temperature (p < 0.05) were significantly related to the dissolved concentration of Al in the Langat River. Therefore, if there was an increase in a unit, (i.e., 1 µg/L) of dissolved Pb, then there would be an increase of 22.082 µg/L of dissolved Al in the river. However, if there was an increase of 1 °C in temperature, then there would be an increase of 55.311 µg/L of dissolved Al in the Langat River. However, a 1 unit decrease in electrical conductivity and pH will significantly decrease 2.605 µg/L and 316.037 µg/L, respectively, of the Al concentration in the Langat River. The As and Cr models suggest that these metals are primarily from natural sources and the concentrations of these metals do not significantly depend on other water parameters. Pb (p < 0.05) can significantly increase the concentration of Cd, (i.e., Model 3) in the Langat River. It is determined that an increase in Pb by a unit has the potential to increase Cd levels by 0.108 µg/L. On the other hand, a unit of electrical conductivity decrease in the Langat River has the potential to decrease the Cd concentration by 0.012 µg/L. Accordingly, it was calculated that the concentration of Pb, (i.e., Model 5) in the Langat River significantly depends on the concentrations of Al (p < 0.05), Cd (p < 0.05), electrical conductivity (p < 0.05) and temperature (p < 0.05). Therefore, an increase in Al, Cd, and electrical conductivity by a unit have the potential to increase the concentration of Pb by 0.020 µg/L, 2.572 µg/L, and 0.065 µg/L, respectively, in the Langat River. Contrarily, the decrease in a unit of temperature will significantly decrease the concentration of Pb by 1.731 µg/L in the Langat River.
The multiple linear regression model for the selected dissolved metals:
where:
= Coefficient;
= Error.


