
Conceptual Evaluation of Factors Controlling Groundwater Chemistry in Ad-Dawadmi, Saudi Arabia, Using Visualization and Multiple Lines of Evidence

 , , ,
, , ,
Abstract
:1. Introduction
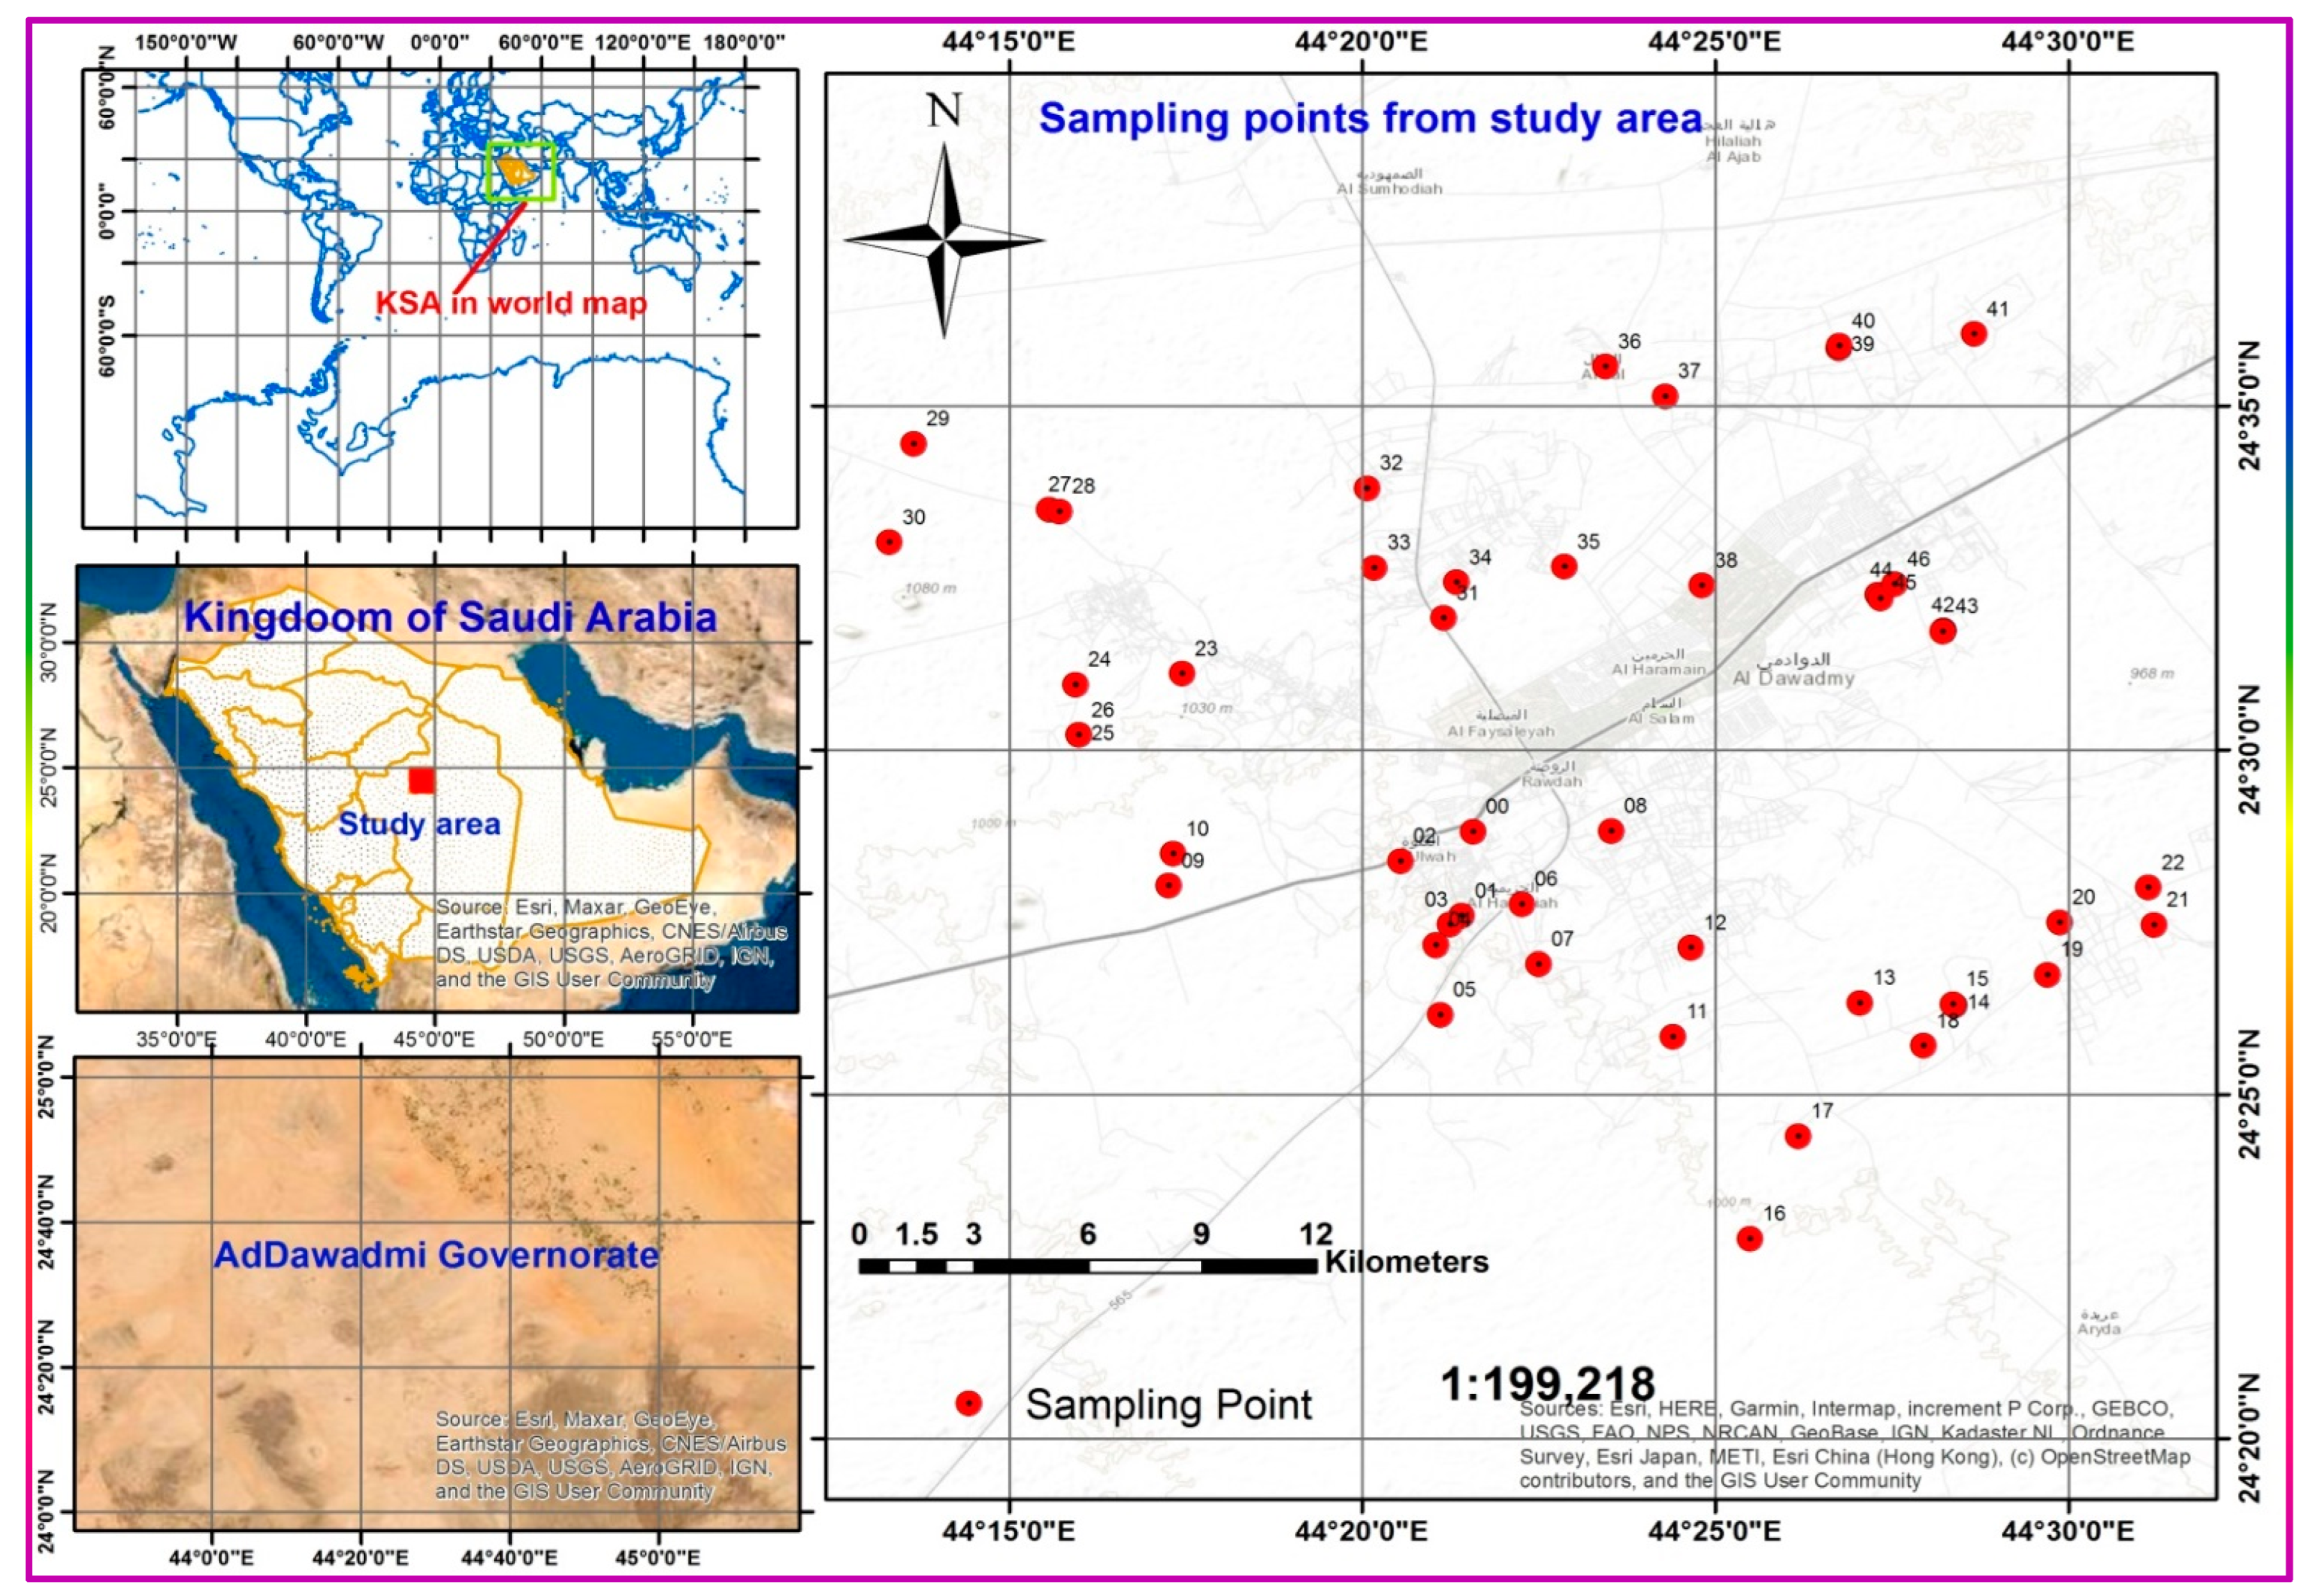
Location and Study Area Description
2. Materials and Methods
2.1. Sampling and Preservation Methodologies
2.2. Analyses Techniques, Methodologies and Procedures
- In-Field Parameters
- b.
- Hydrochemical Analyses
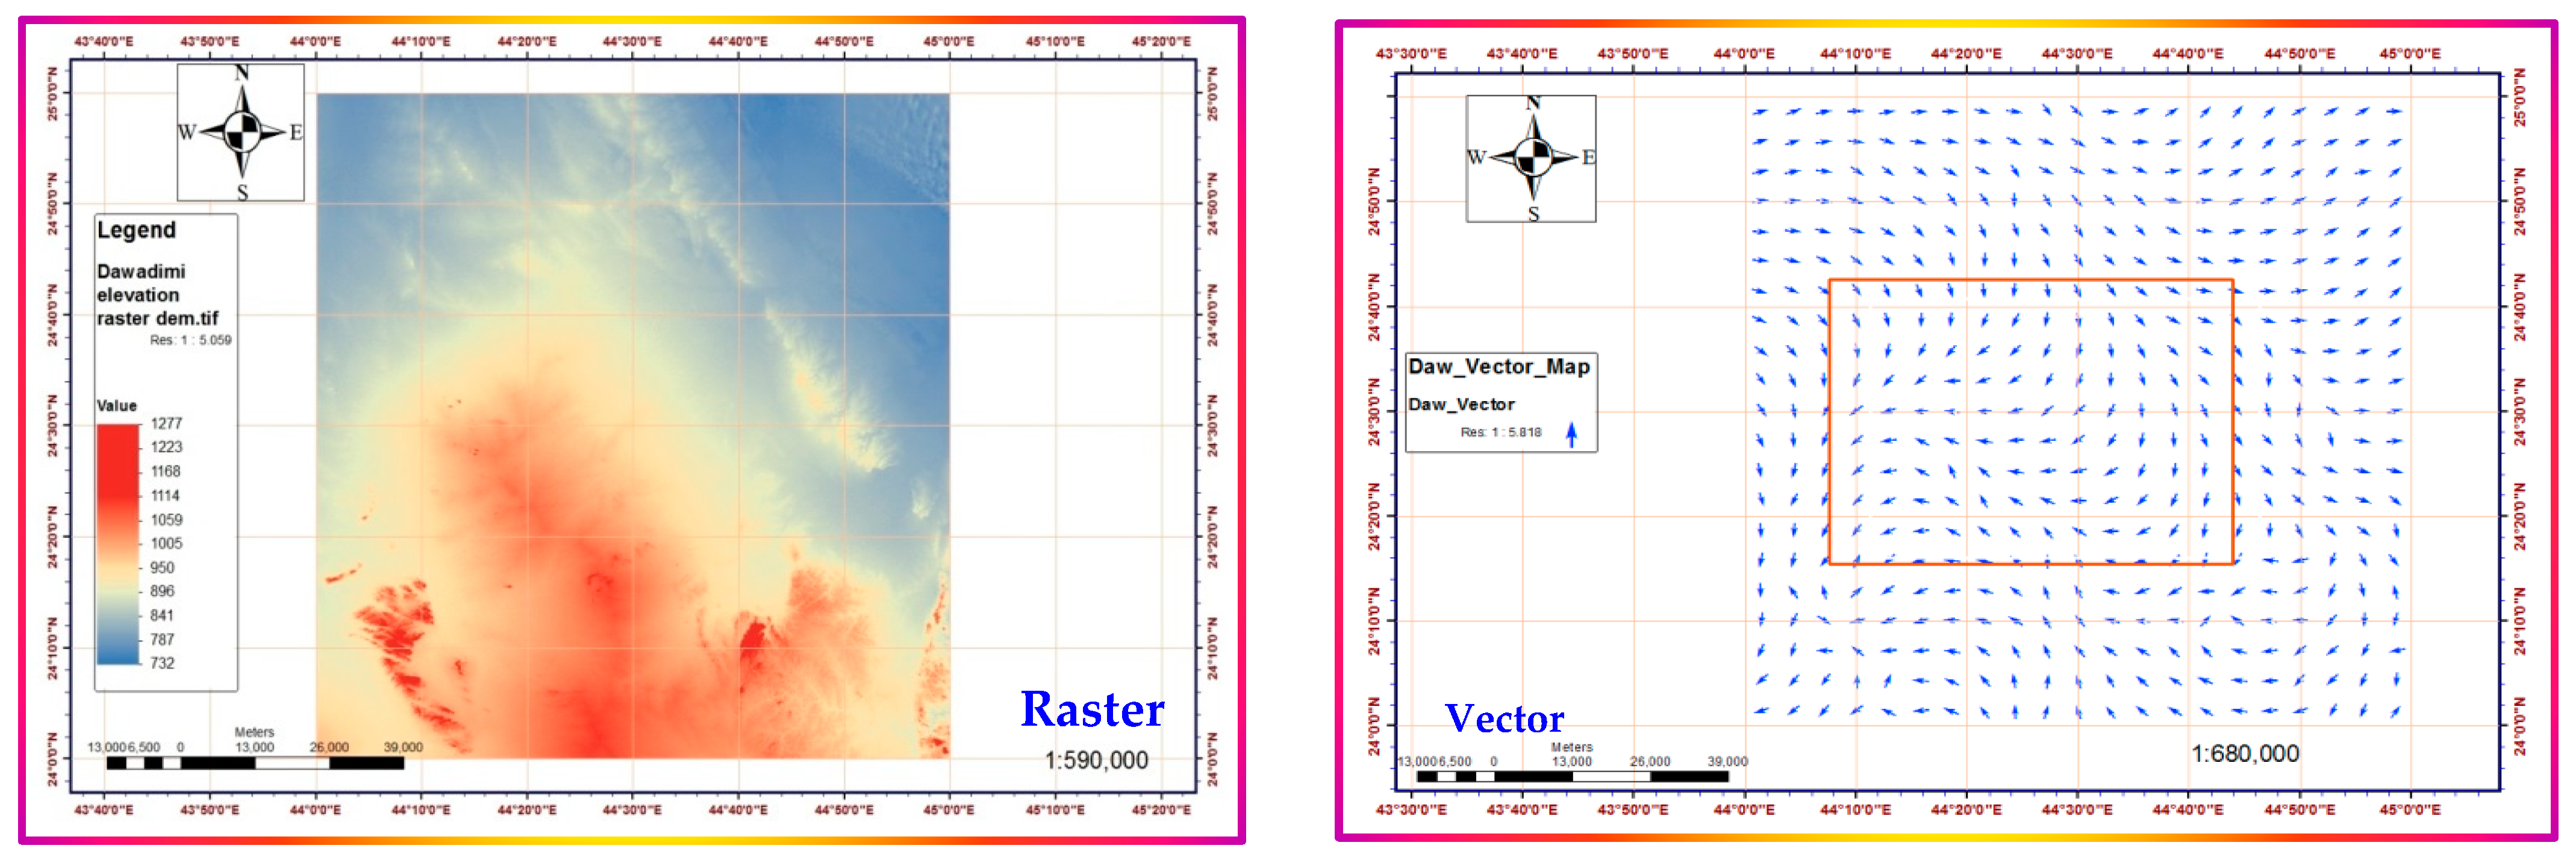
2.3. Geospatial and Geostatistical Analyses
3. Results and Discussion
3.1. Physicochemical Properties
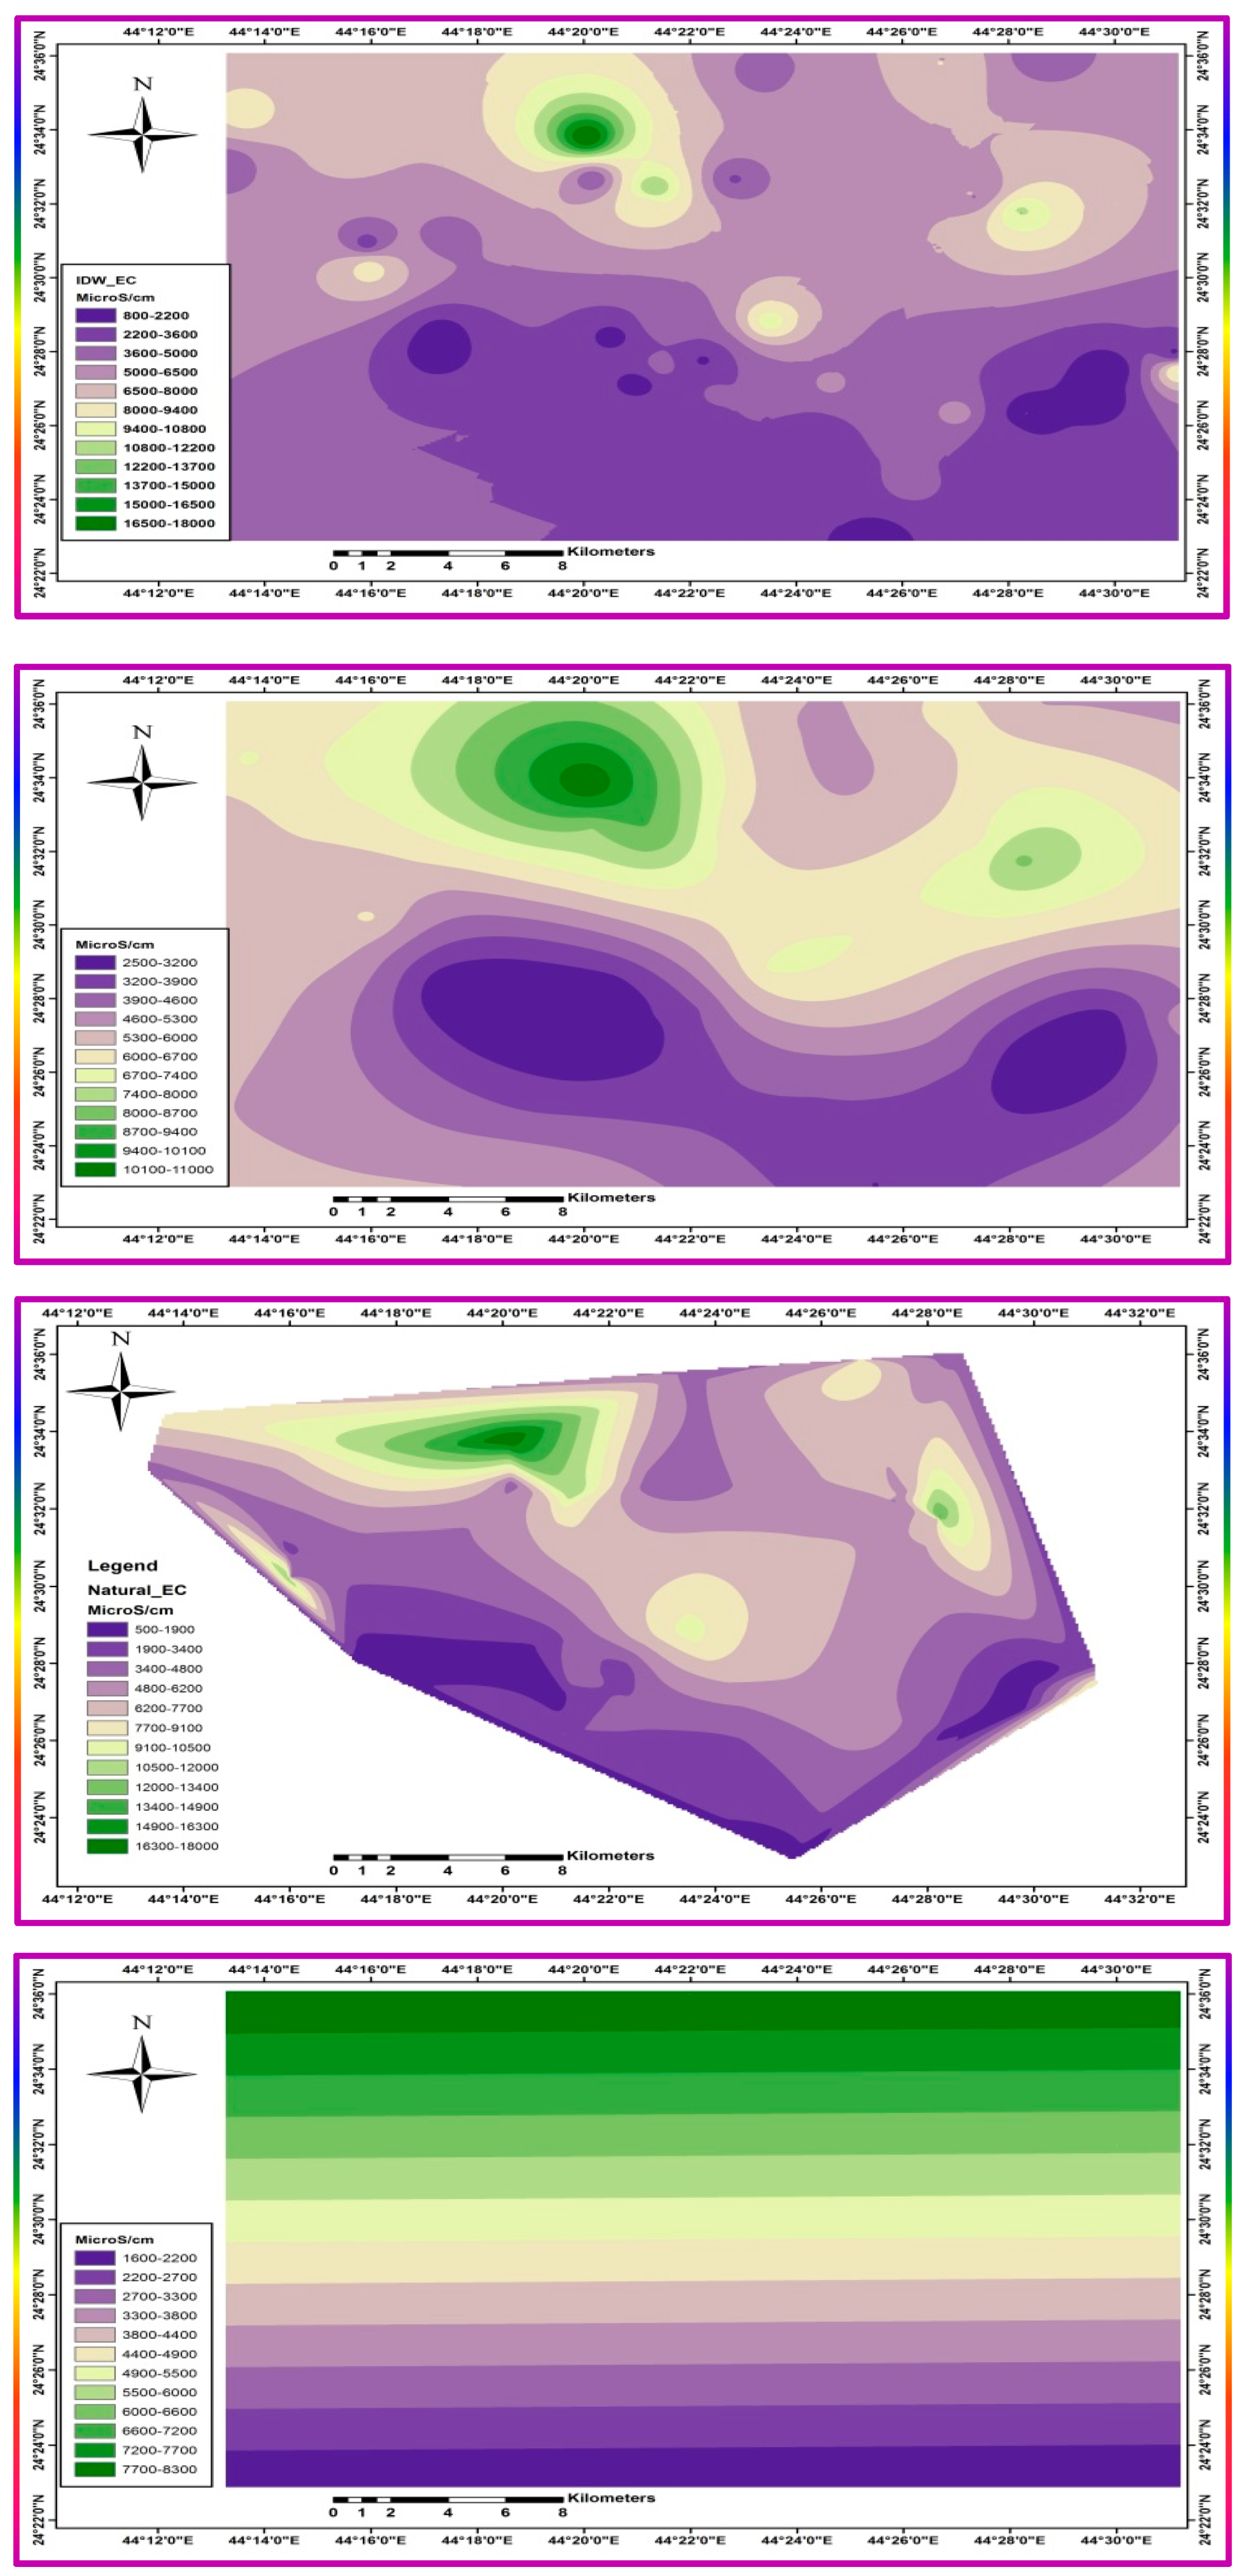
3.2. TDS Spatial Distribution Maps
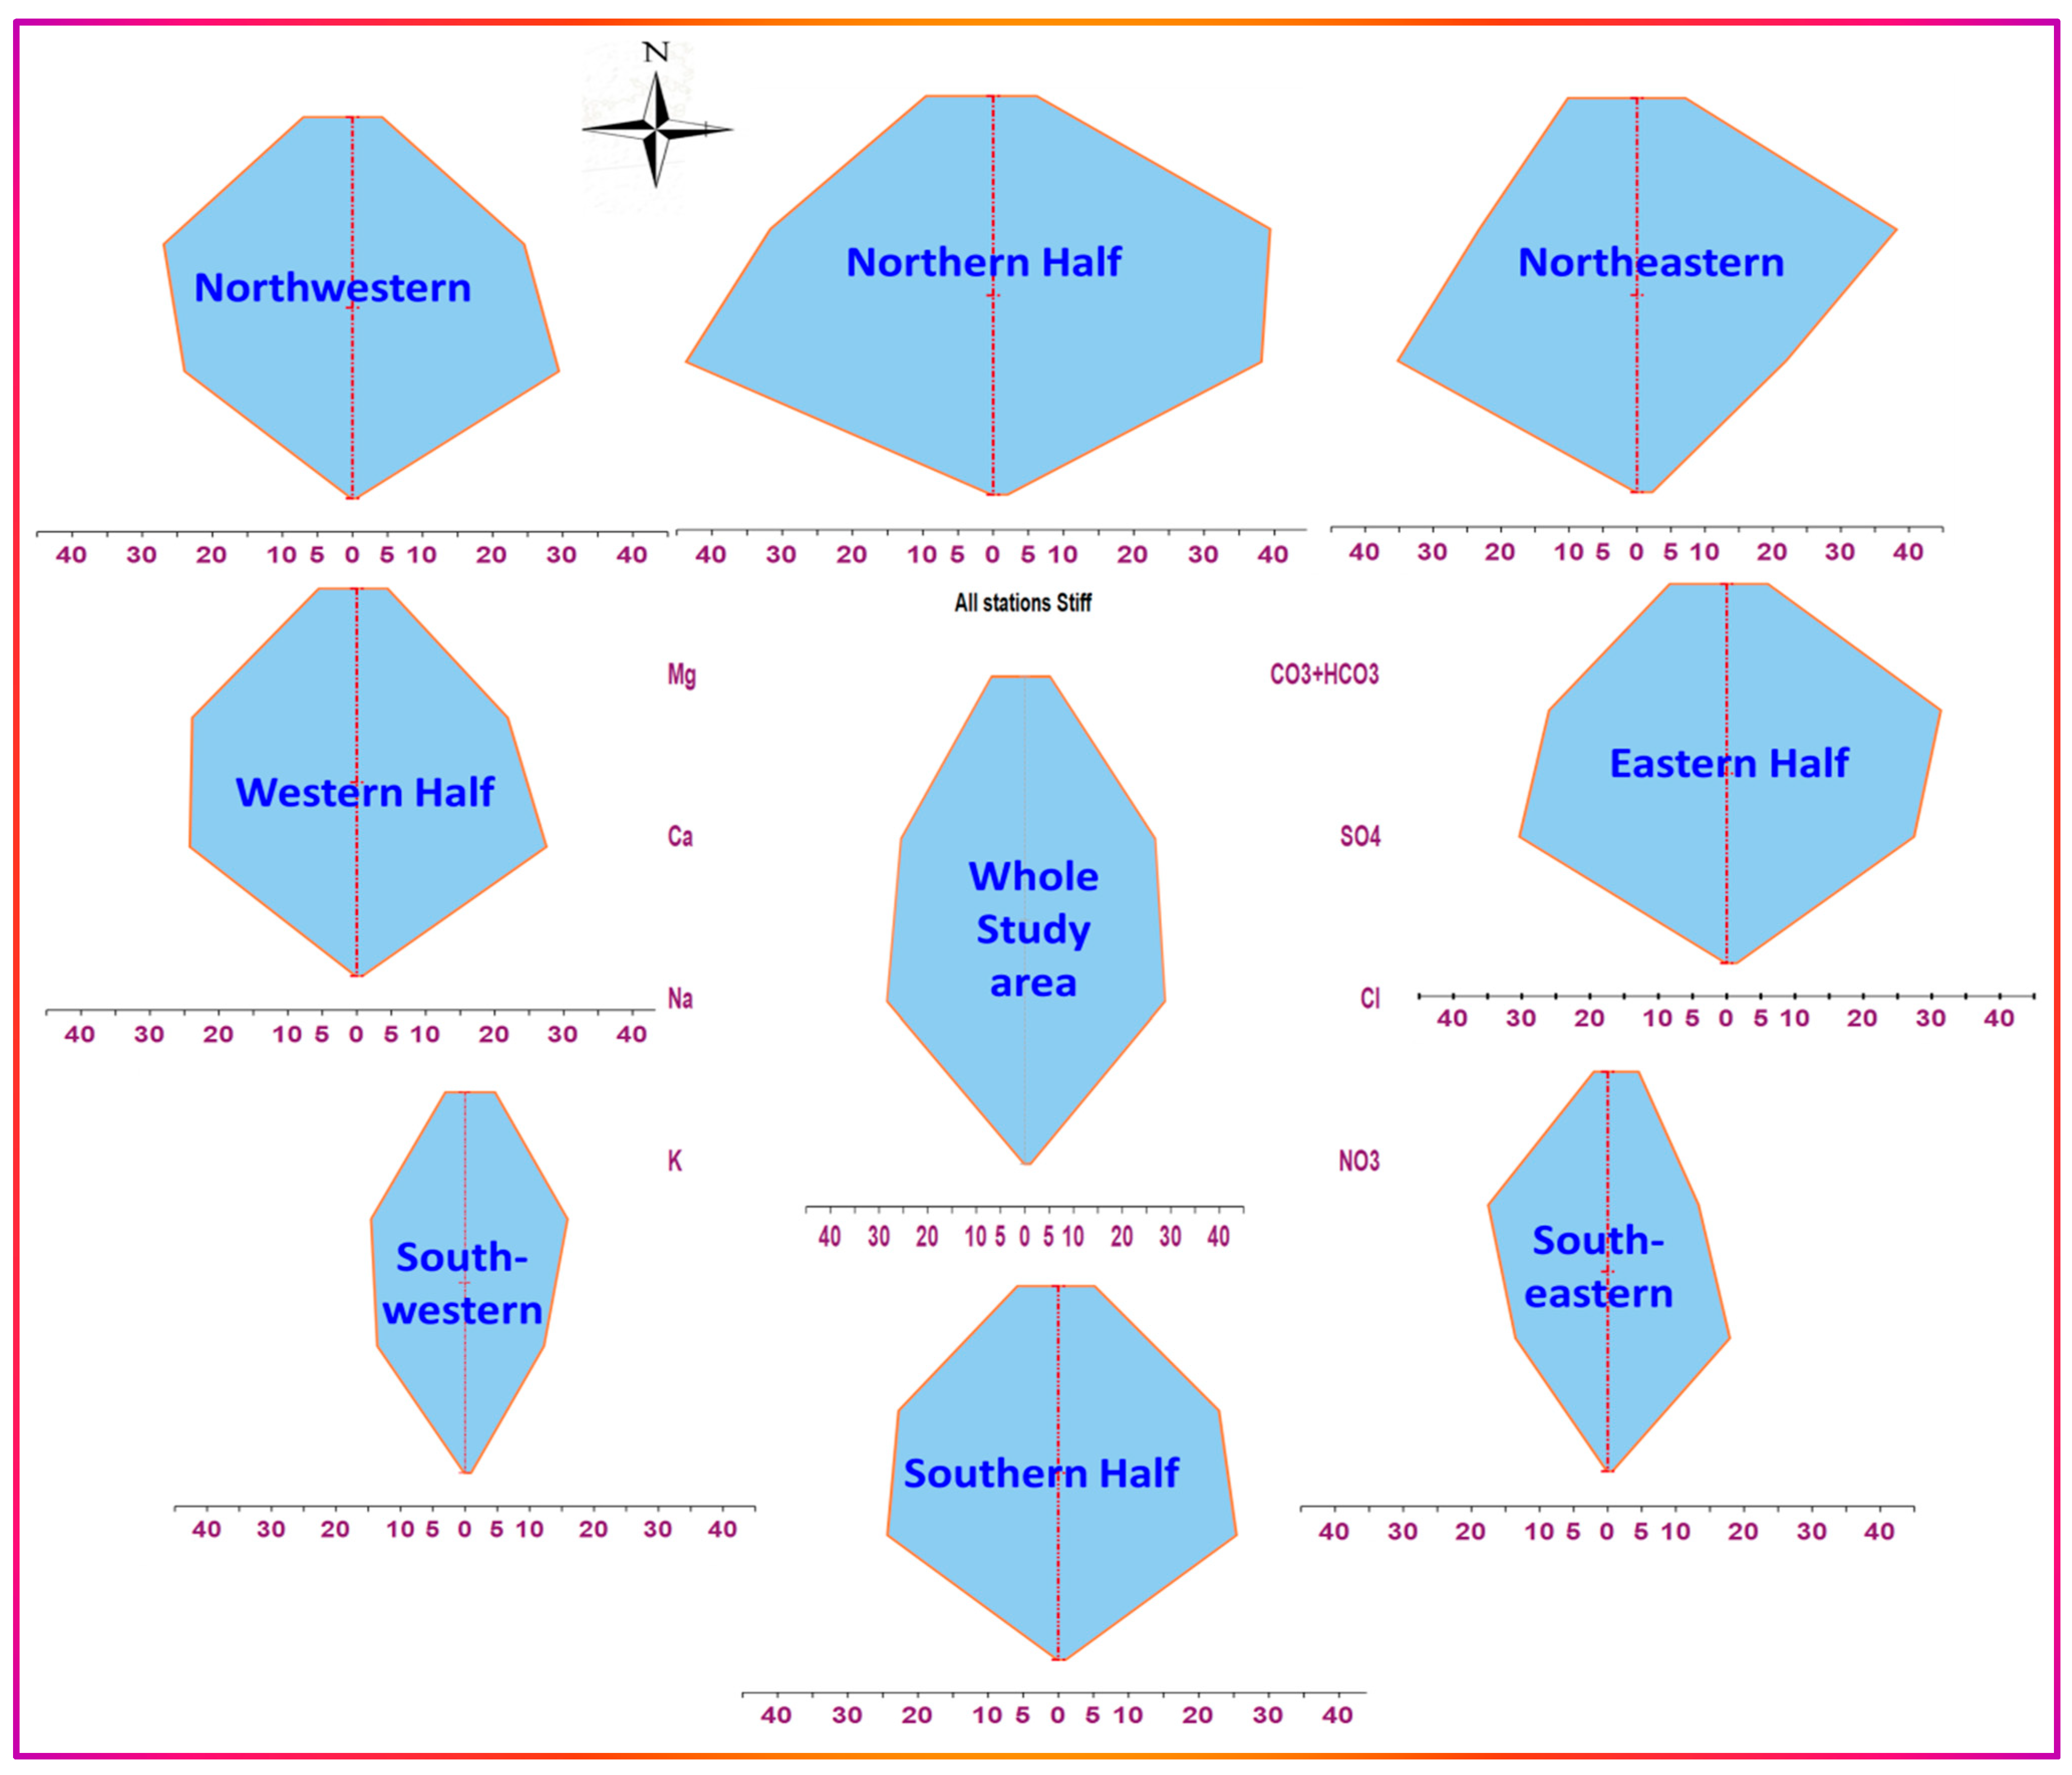
3.3. Major Ions Constituents’
- ➢
- The study area (all samples): Na+−Ca2+//Cl−−SO42−
- ➢
- The northeastern part: Na+−Ca2+//SO42−−Cl−
- ➢
- The northwestern part (Masddah): Ca2+−Na+// Cl−−SO42−
- ➢
- The southeastern part (Addasmah and AsSmearah): Ca2+−Na+// Cl−−SO42−
- ➢
- The southwestern part: Ca2+−Na+// SO42-−Cl−
- ➢
- The eastern half: Na+−Ca2+//SO42−−Cl−
- ➢
- The western half: Na+−Ca2+//Cl−−SO42−
- ➢
- The Northern half: Na+−Ca2+//SO42−−Cl−
- ➢
- The southern half: Na+−Ca2+//Cl−−SO42−
3.4. Interactions and Relationships among the Major Constituents
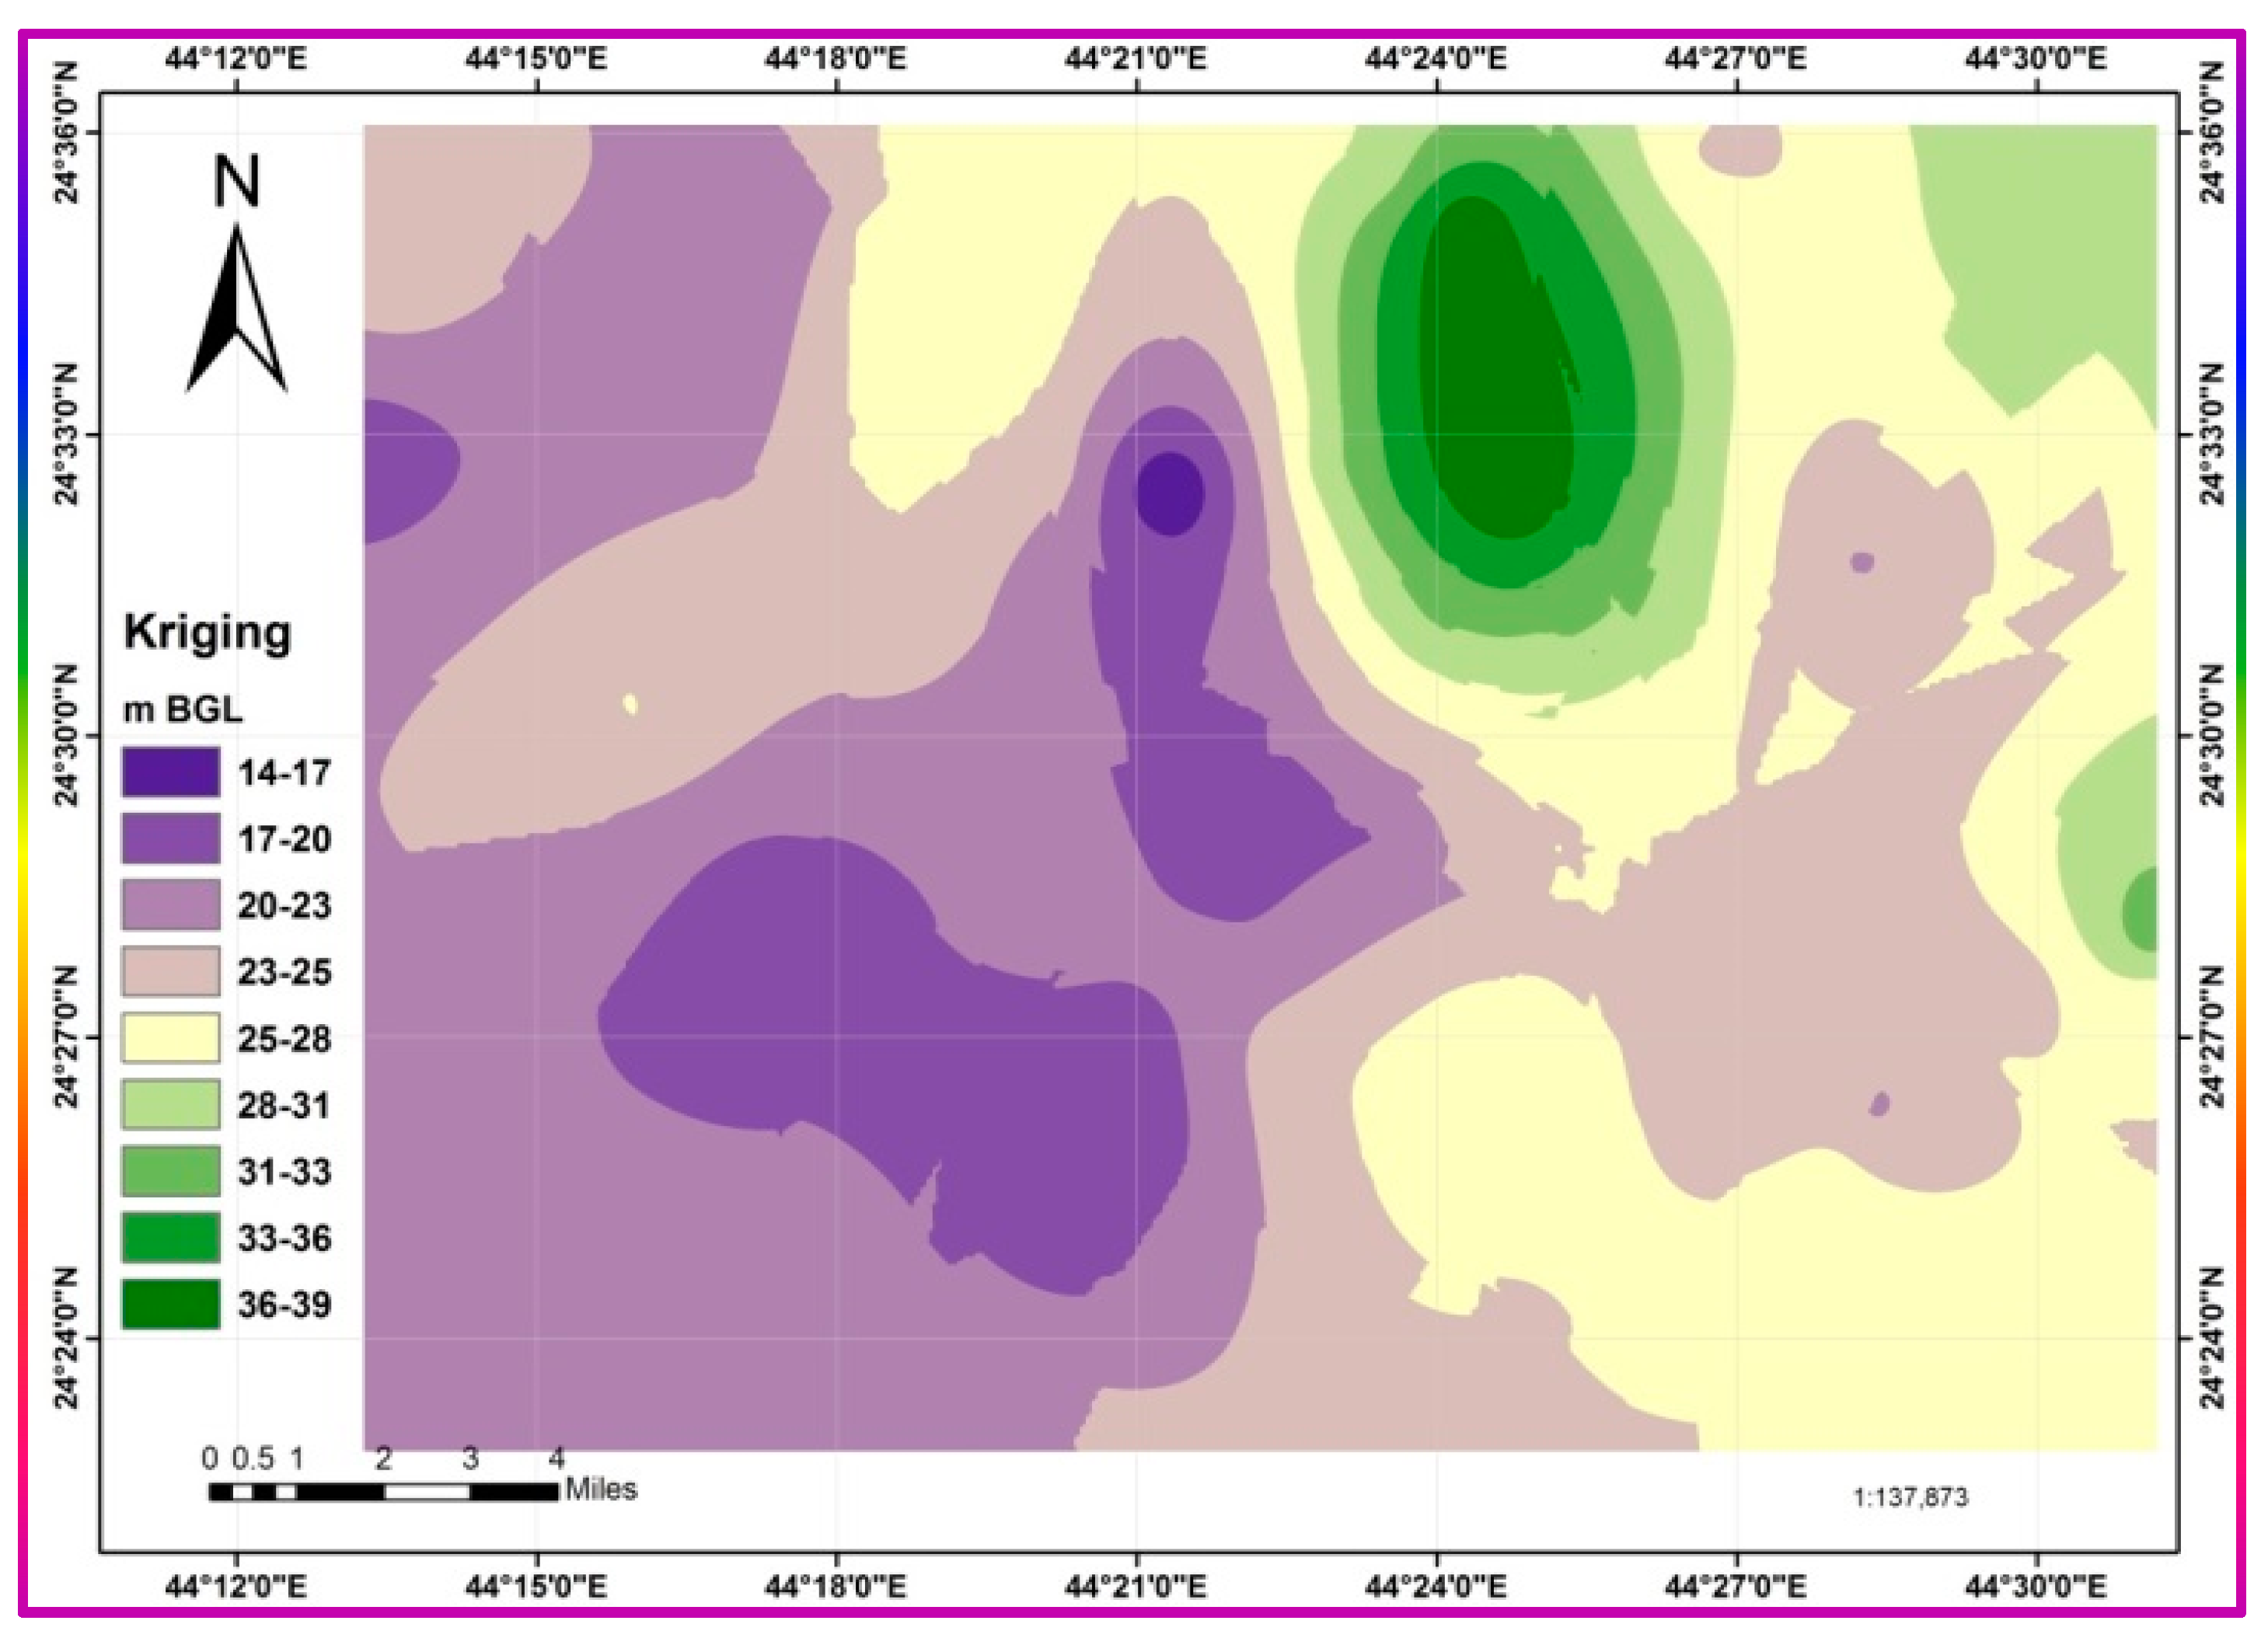
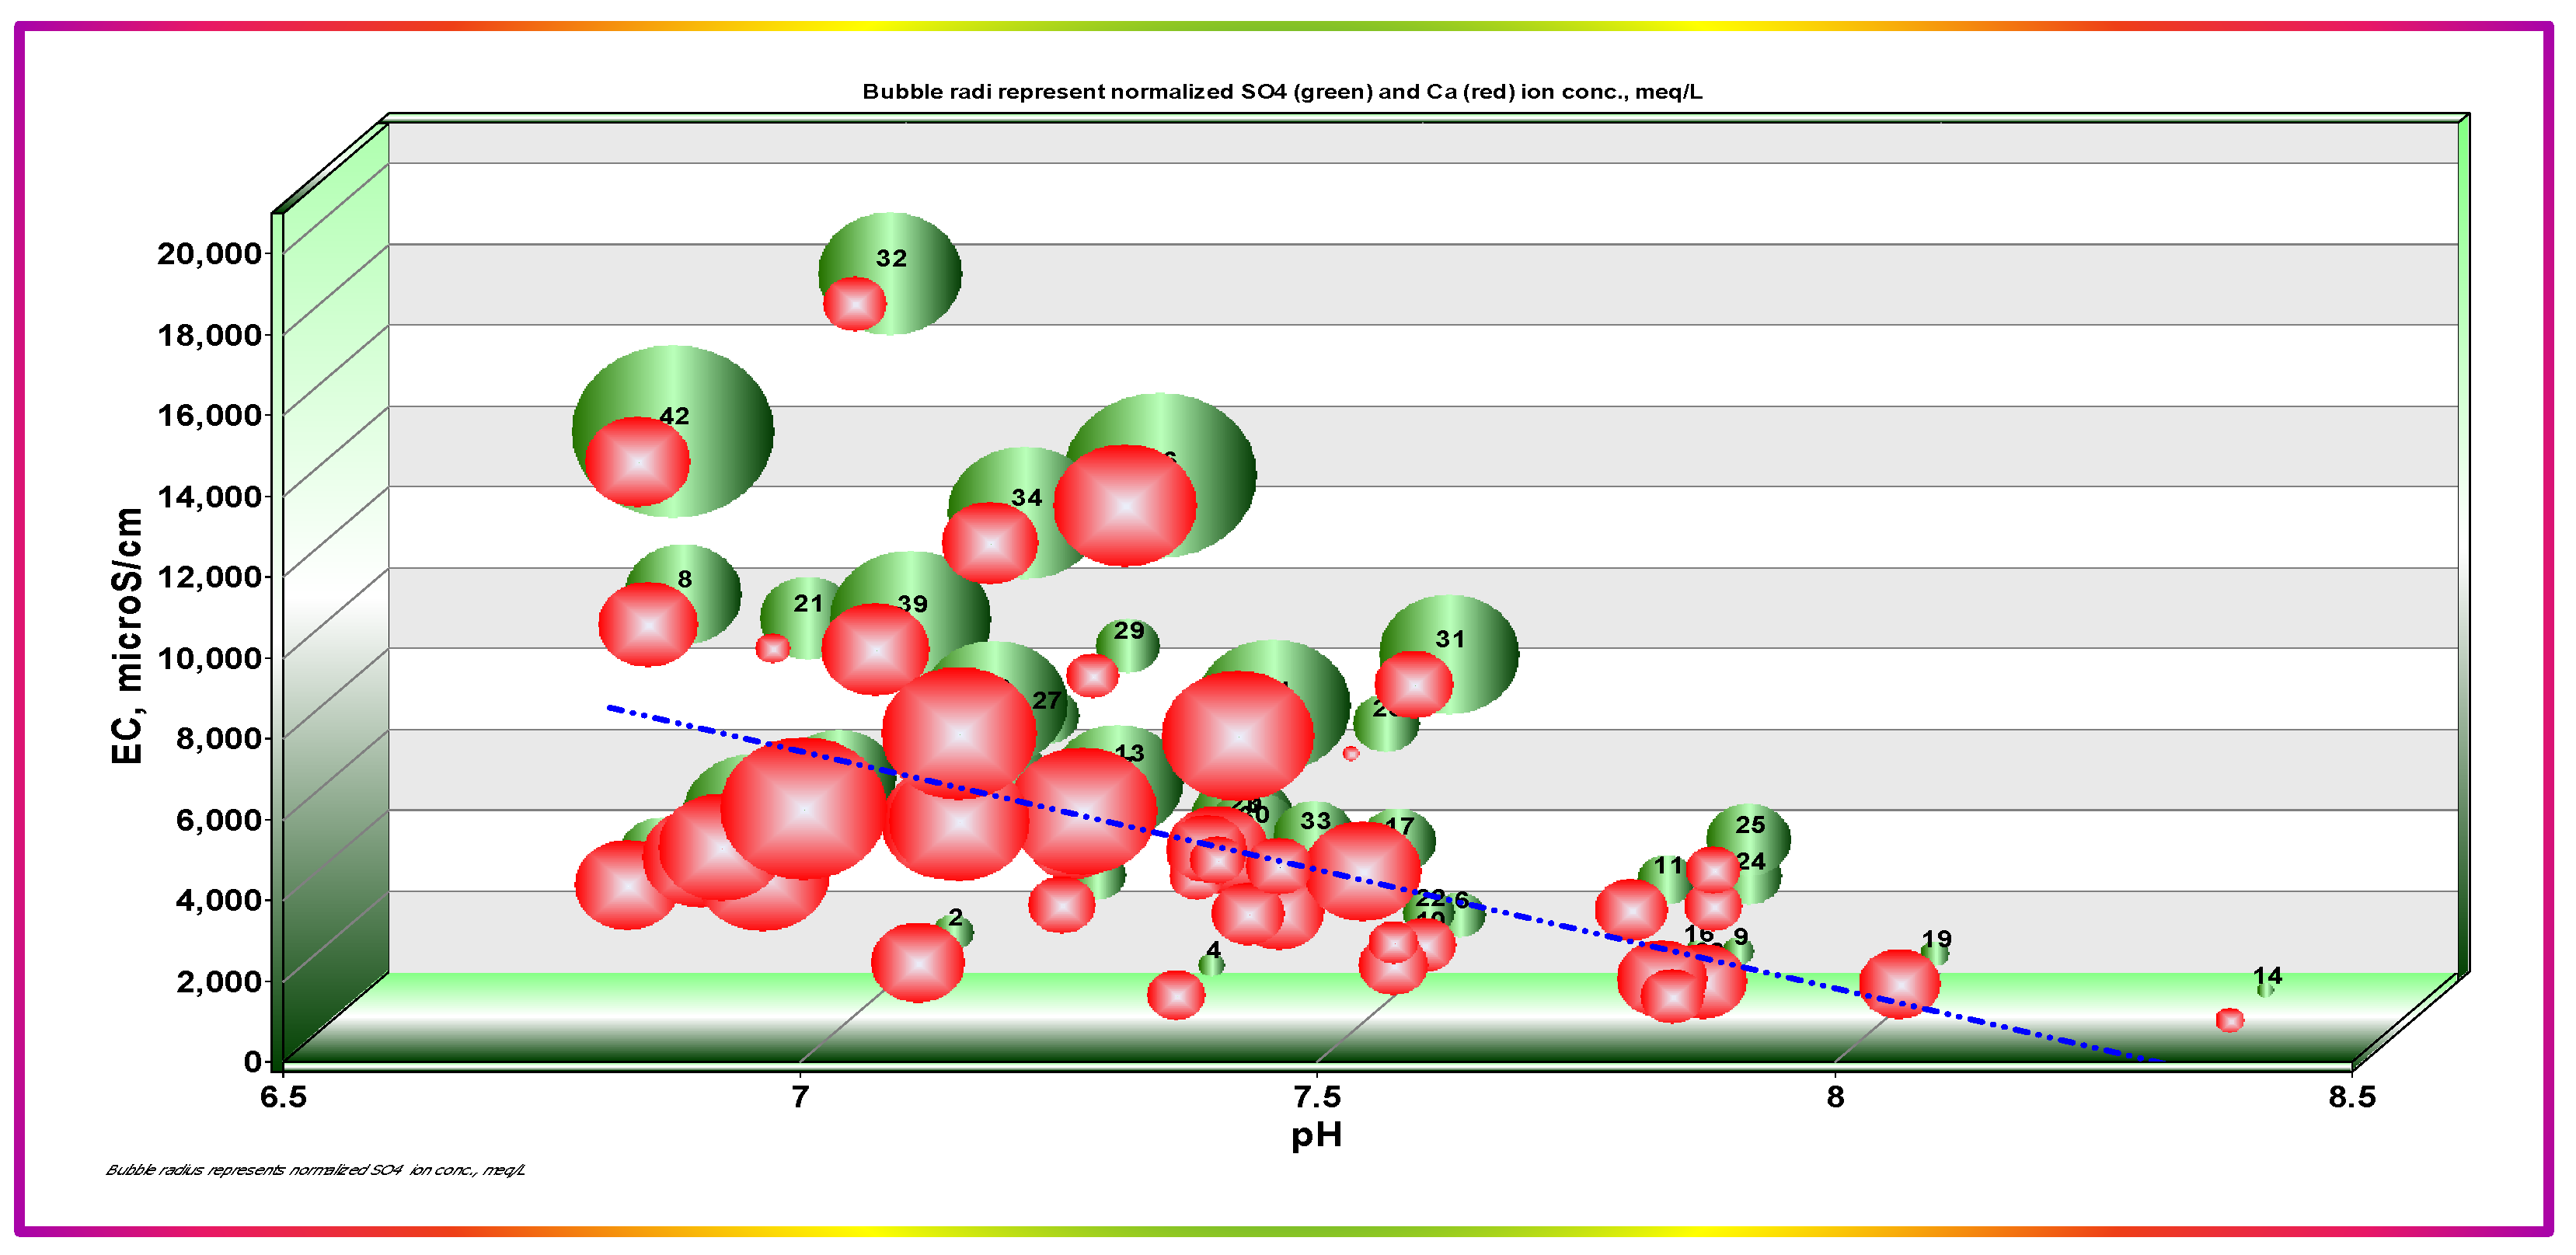
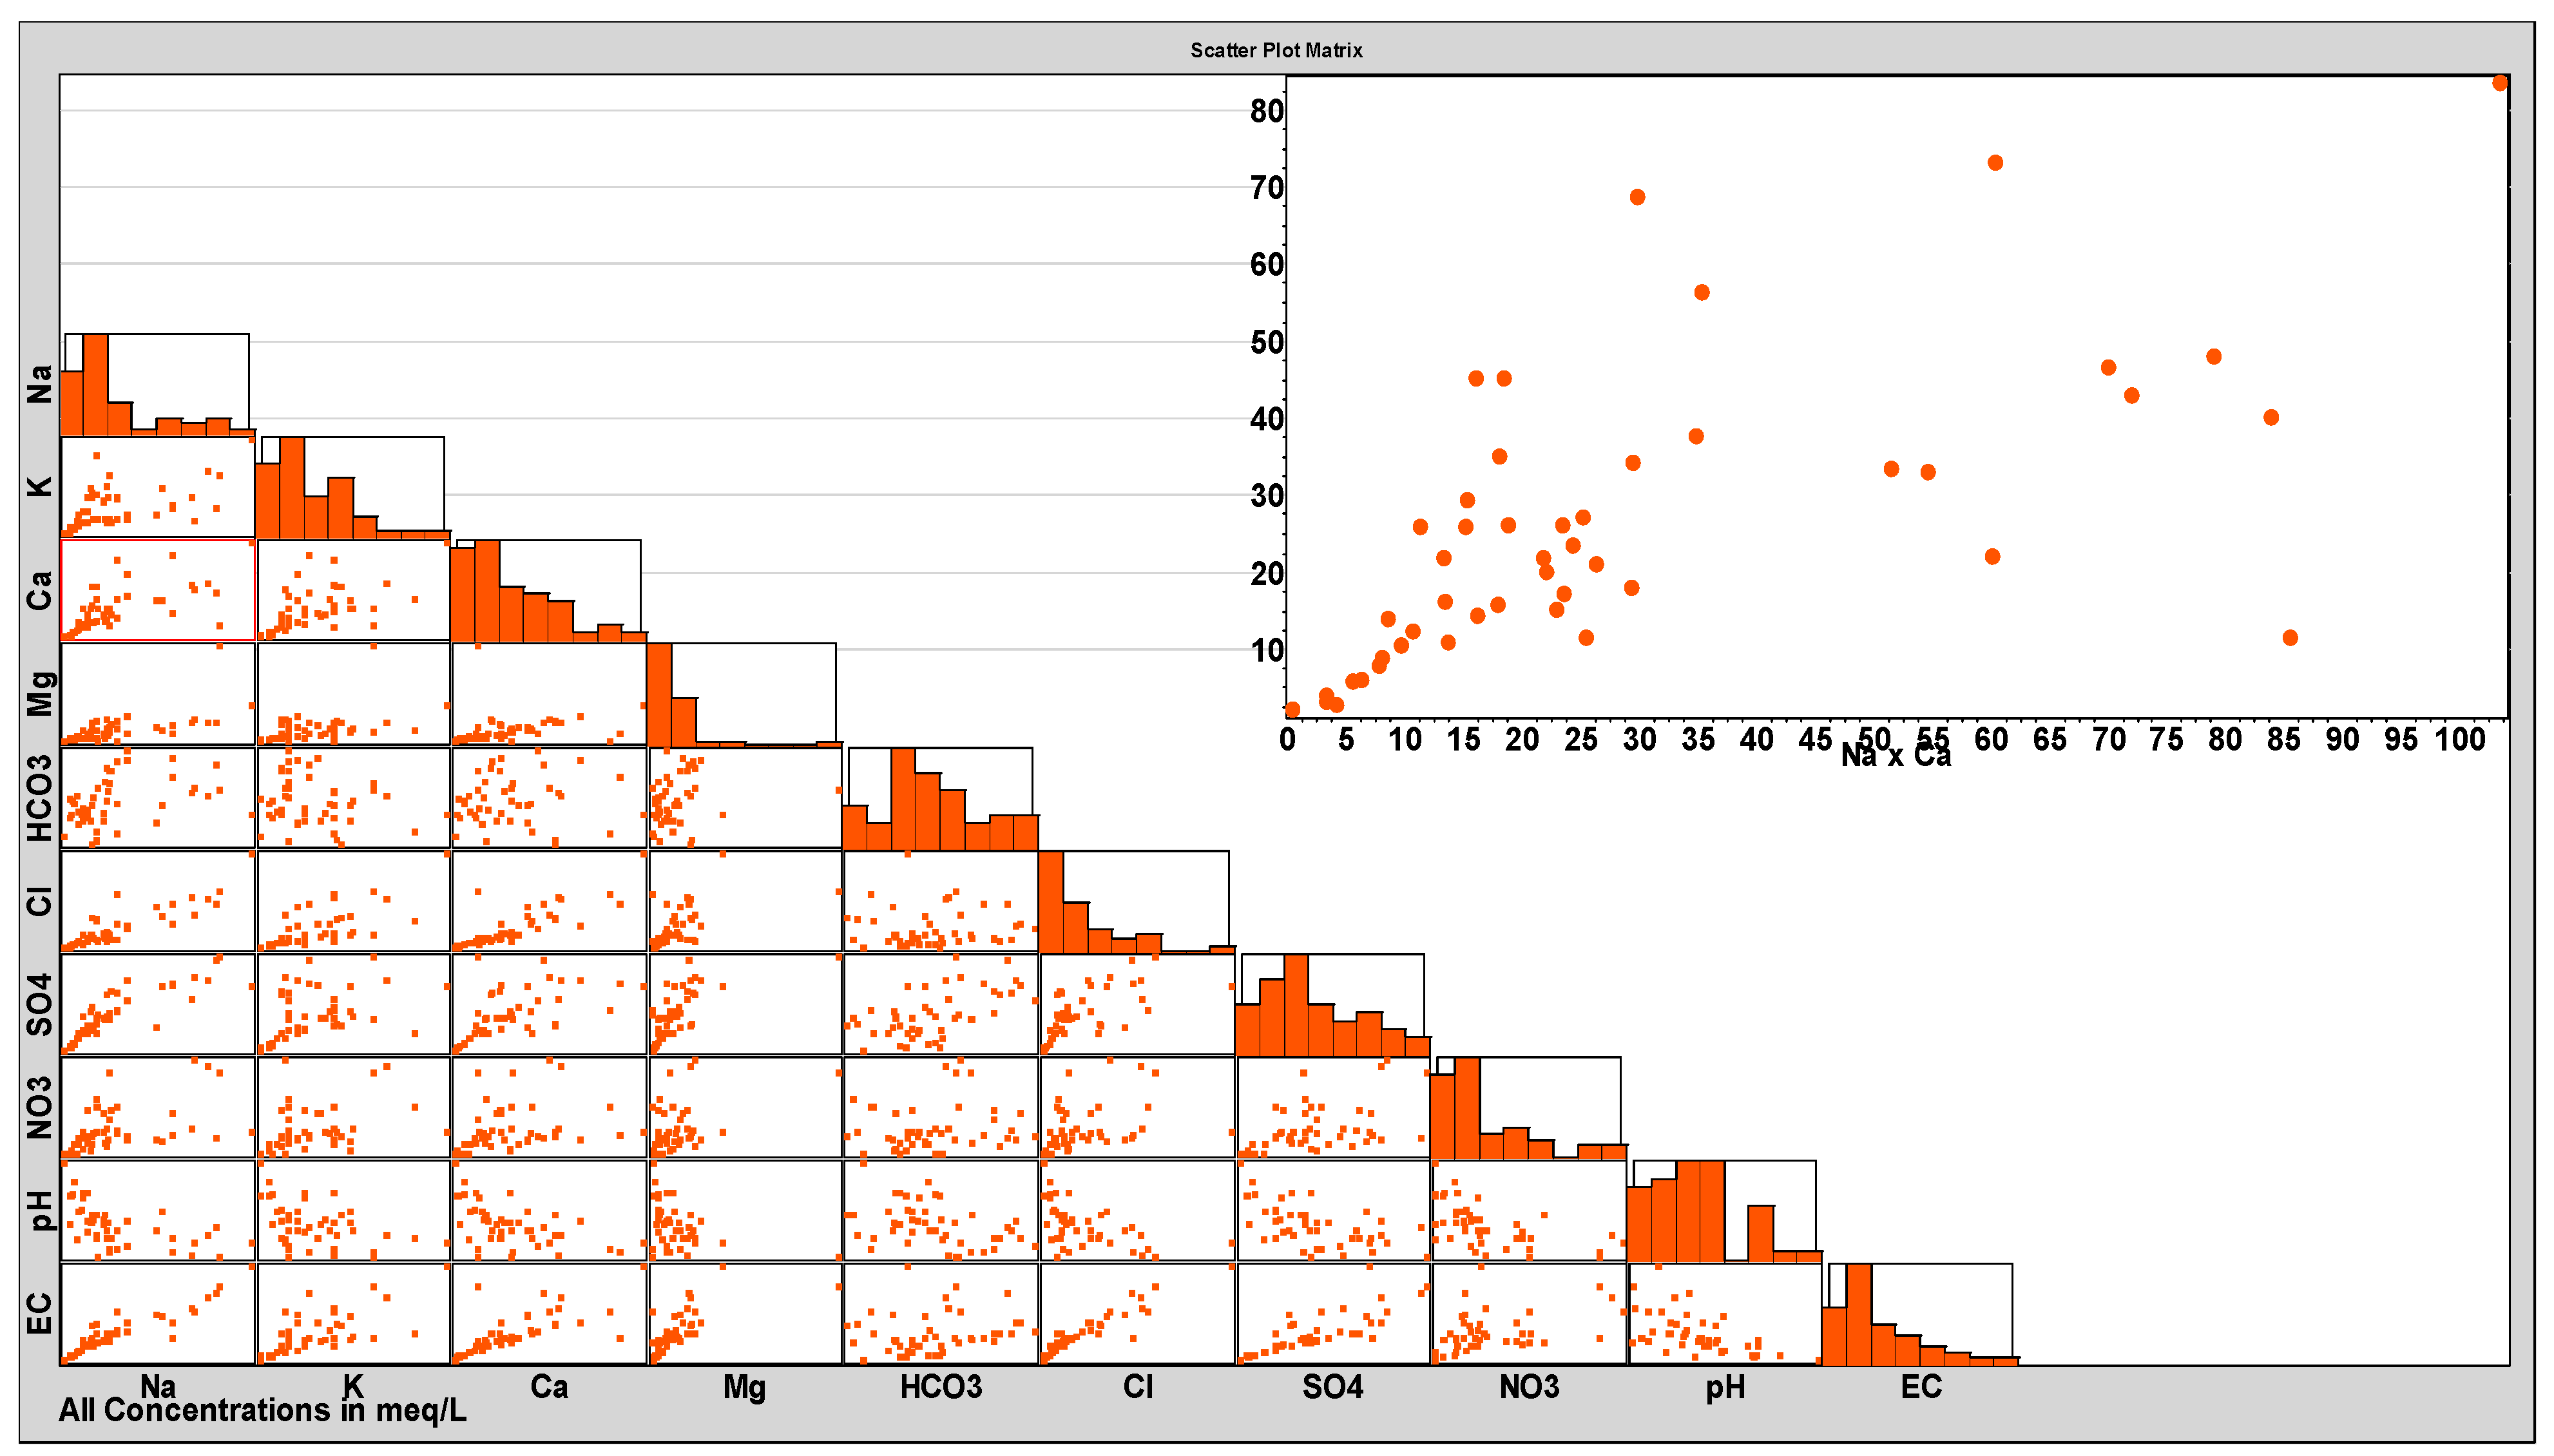
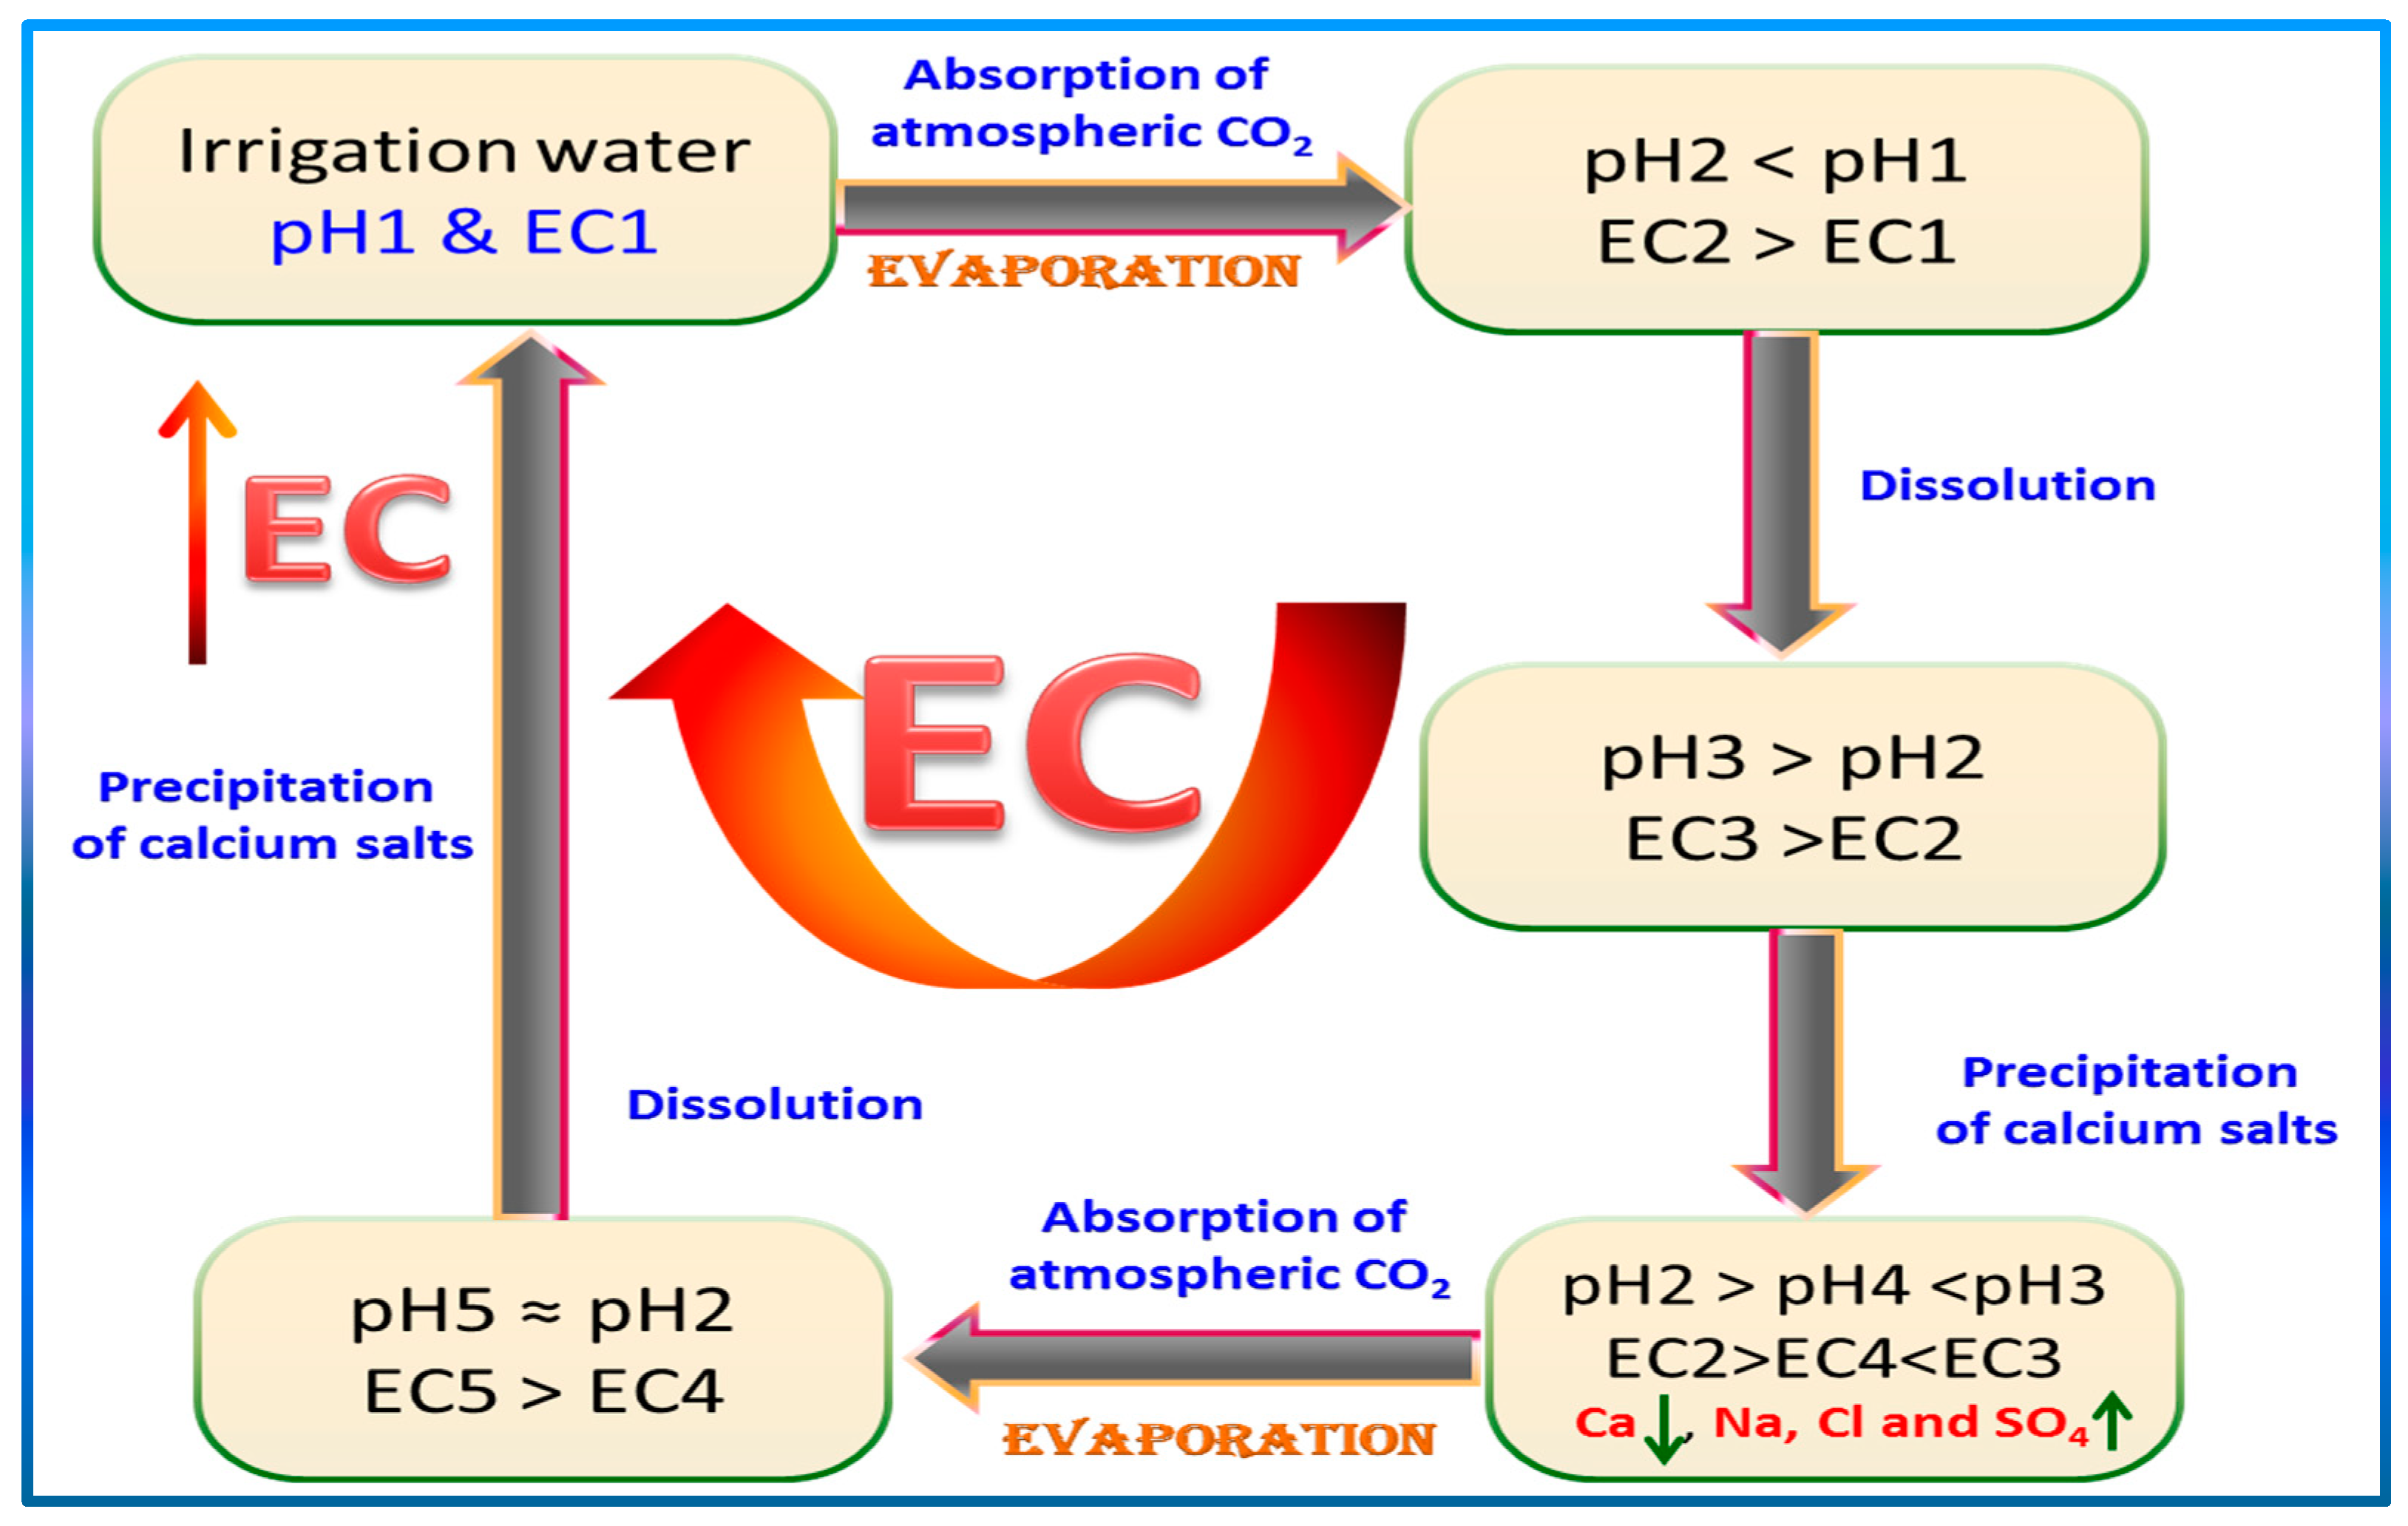
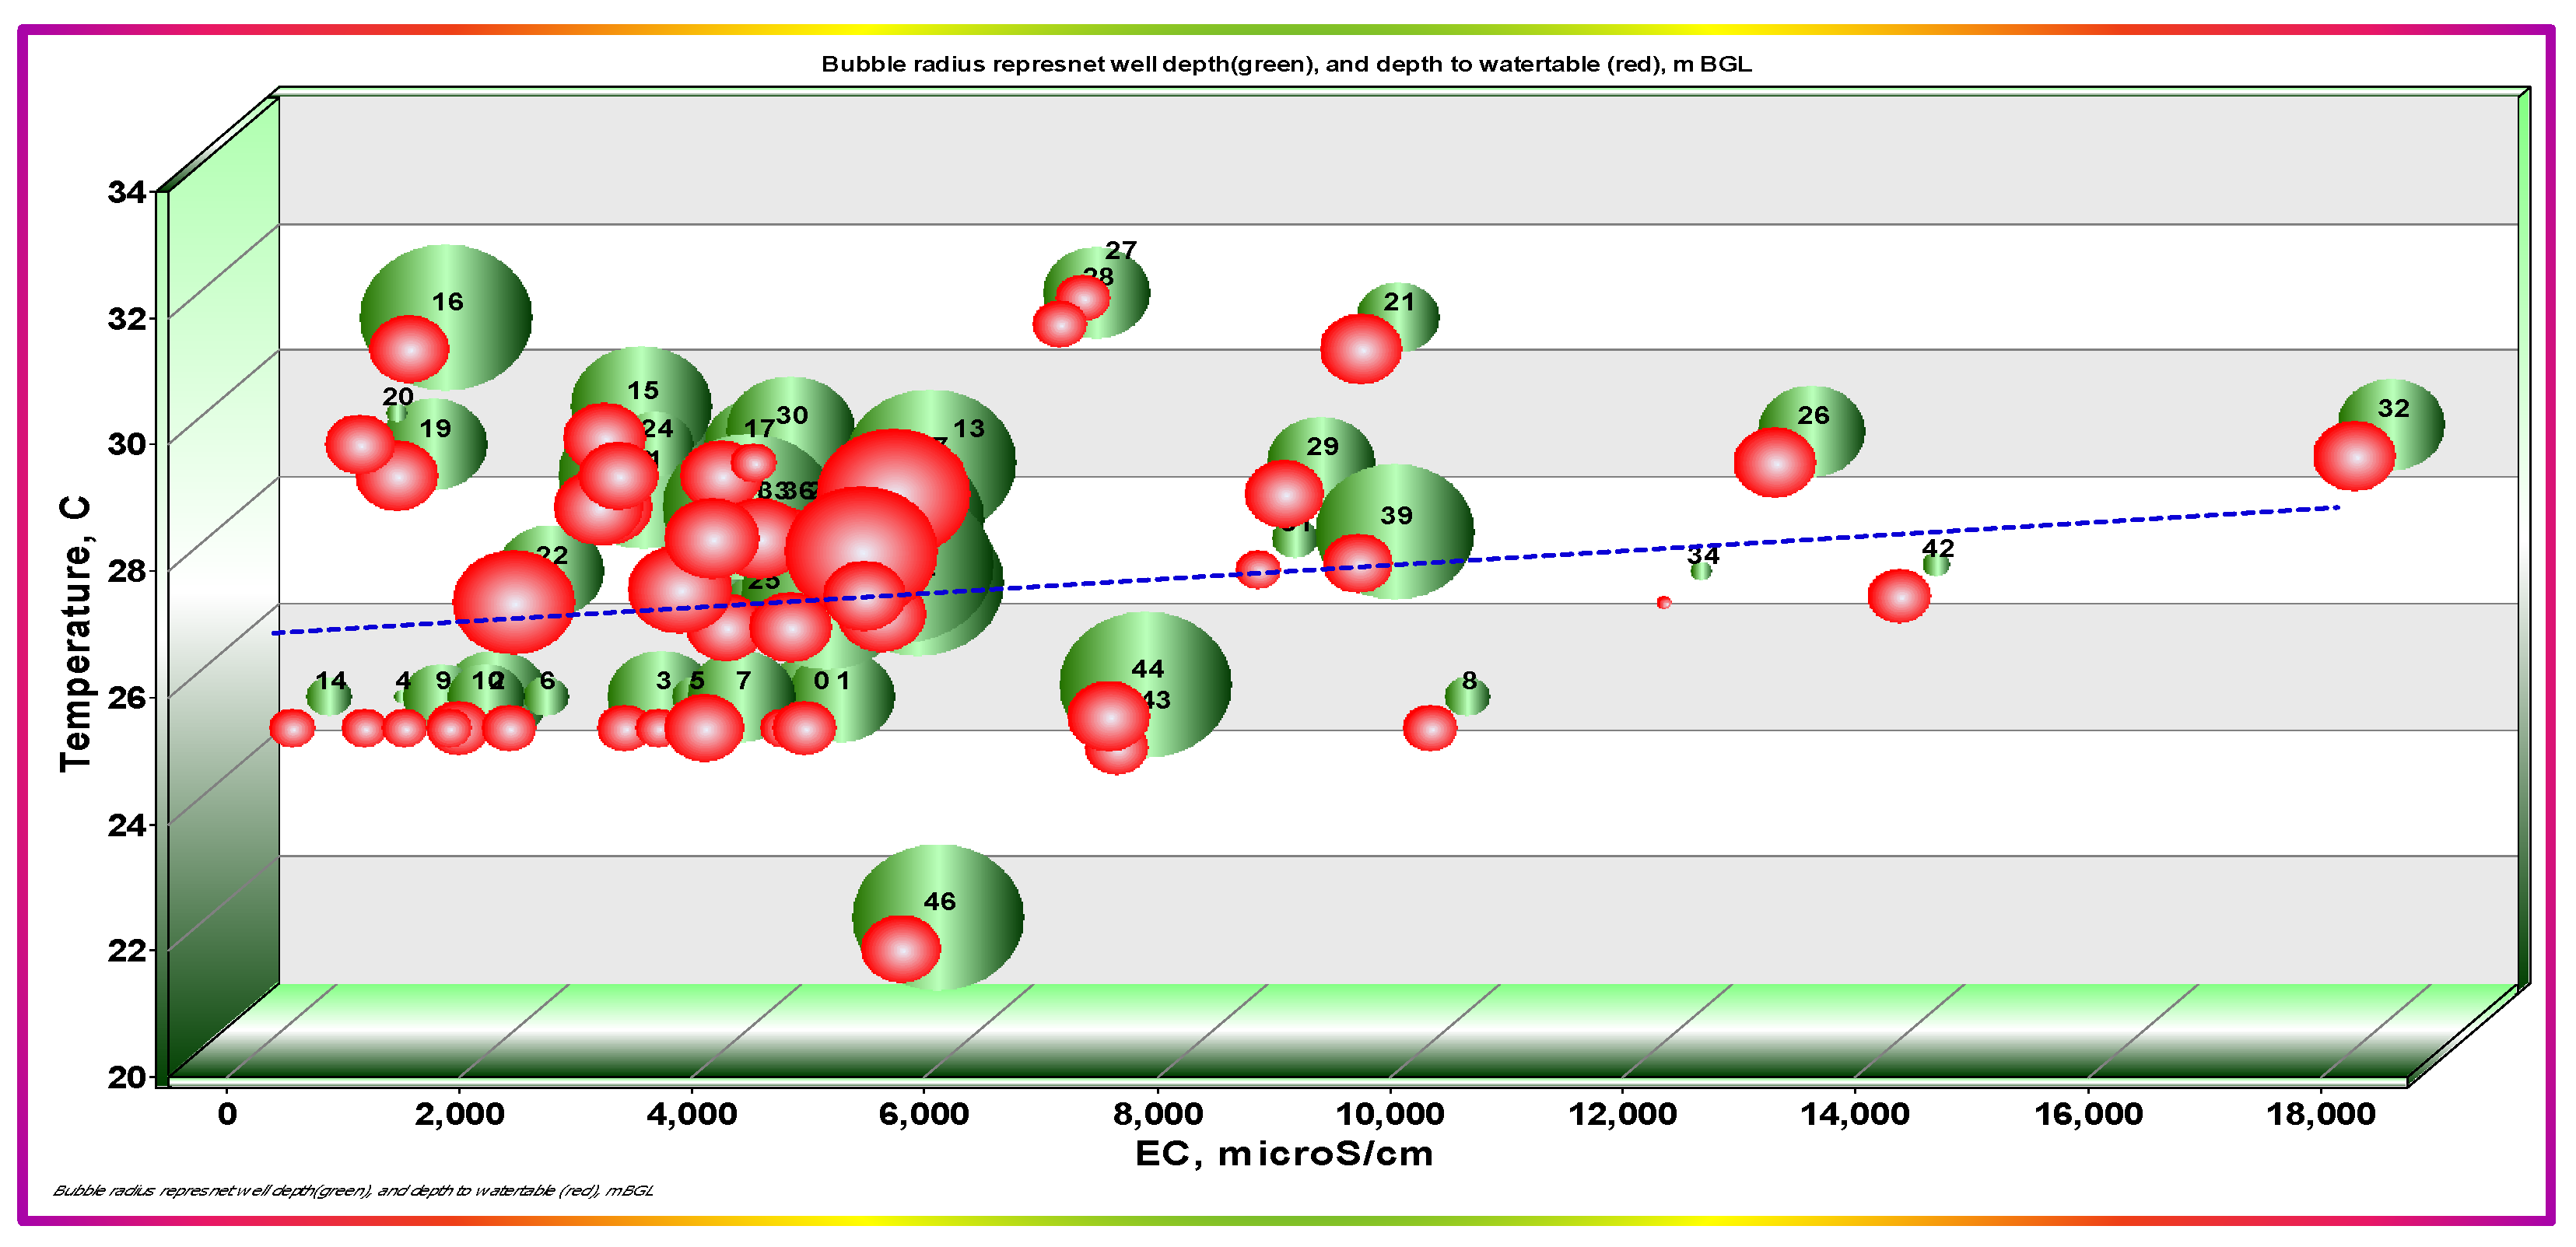
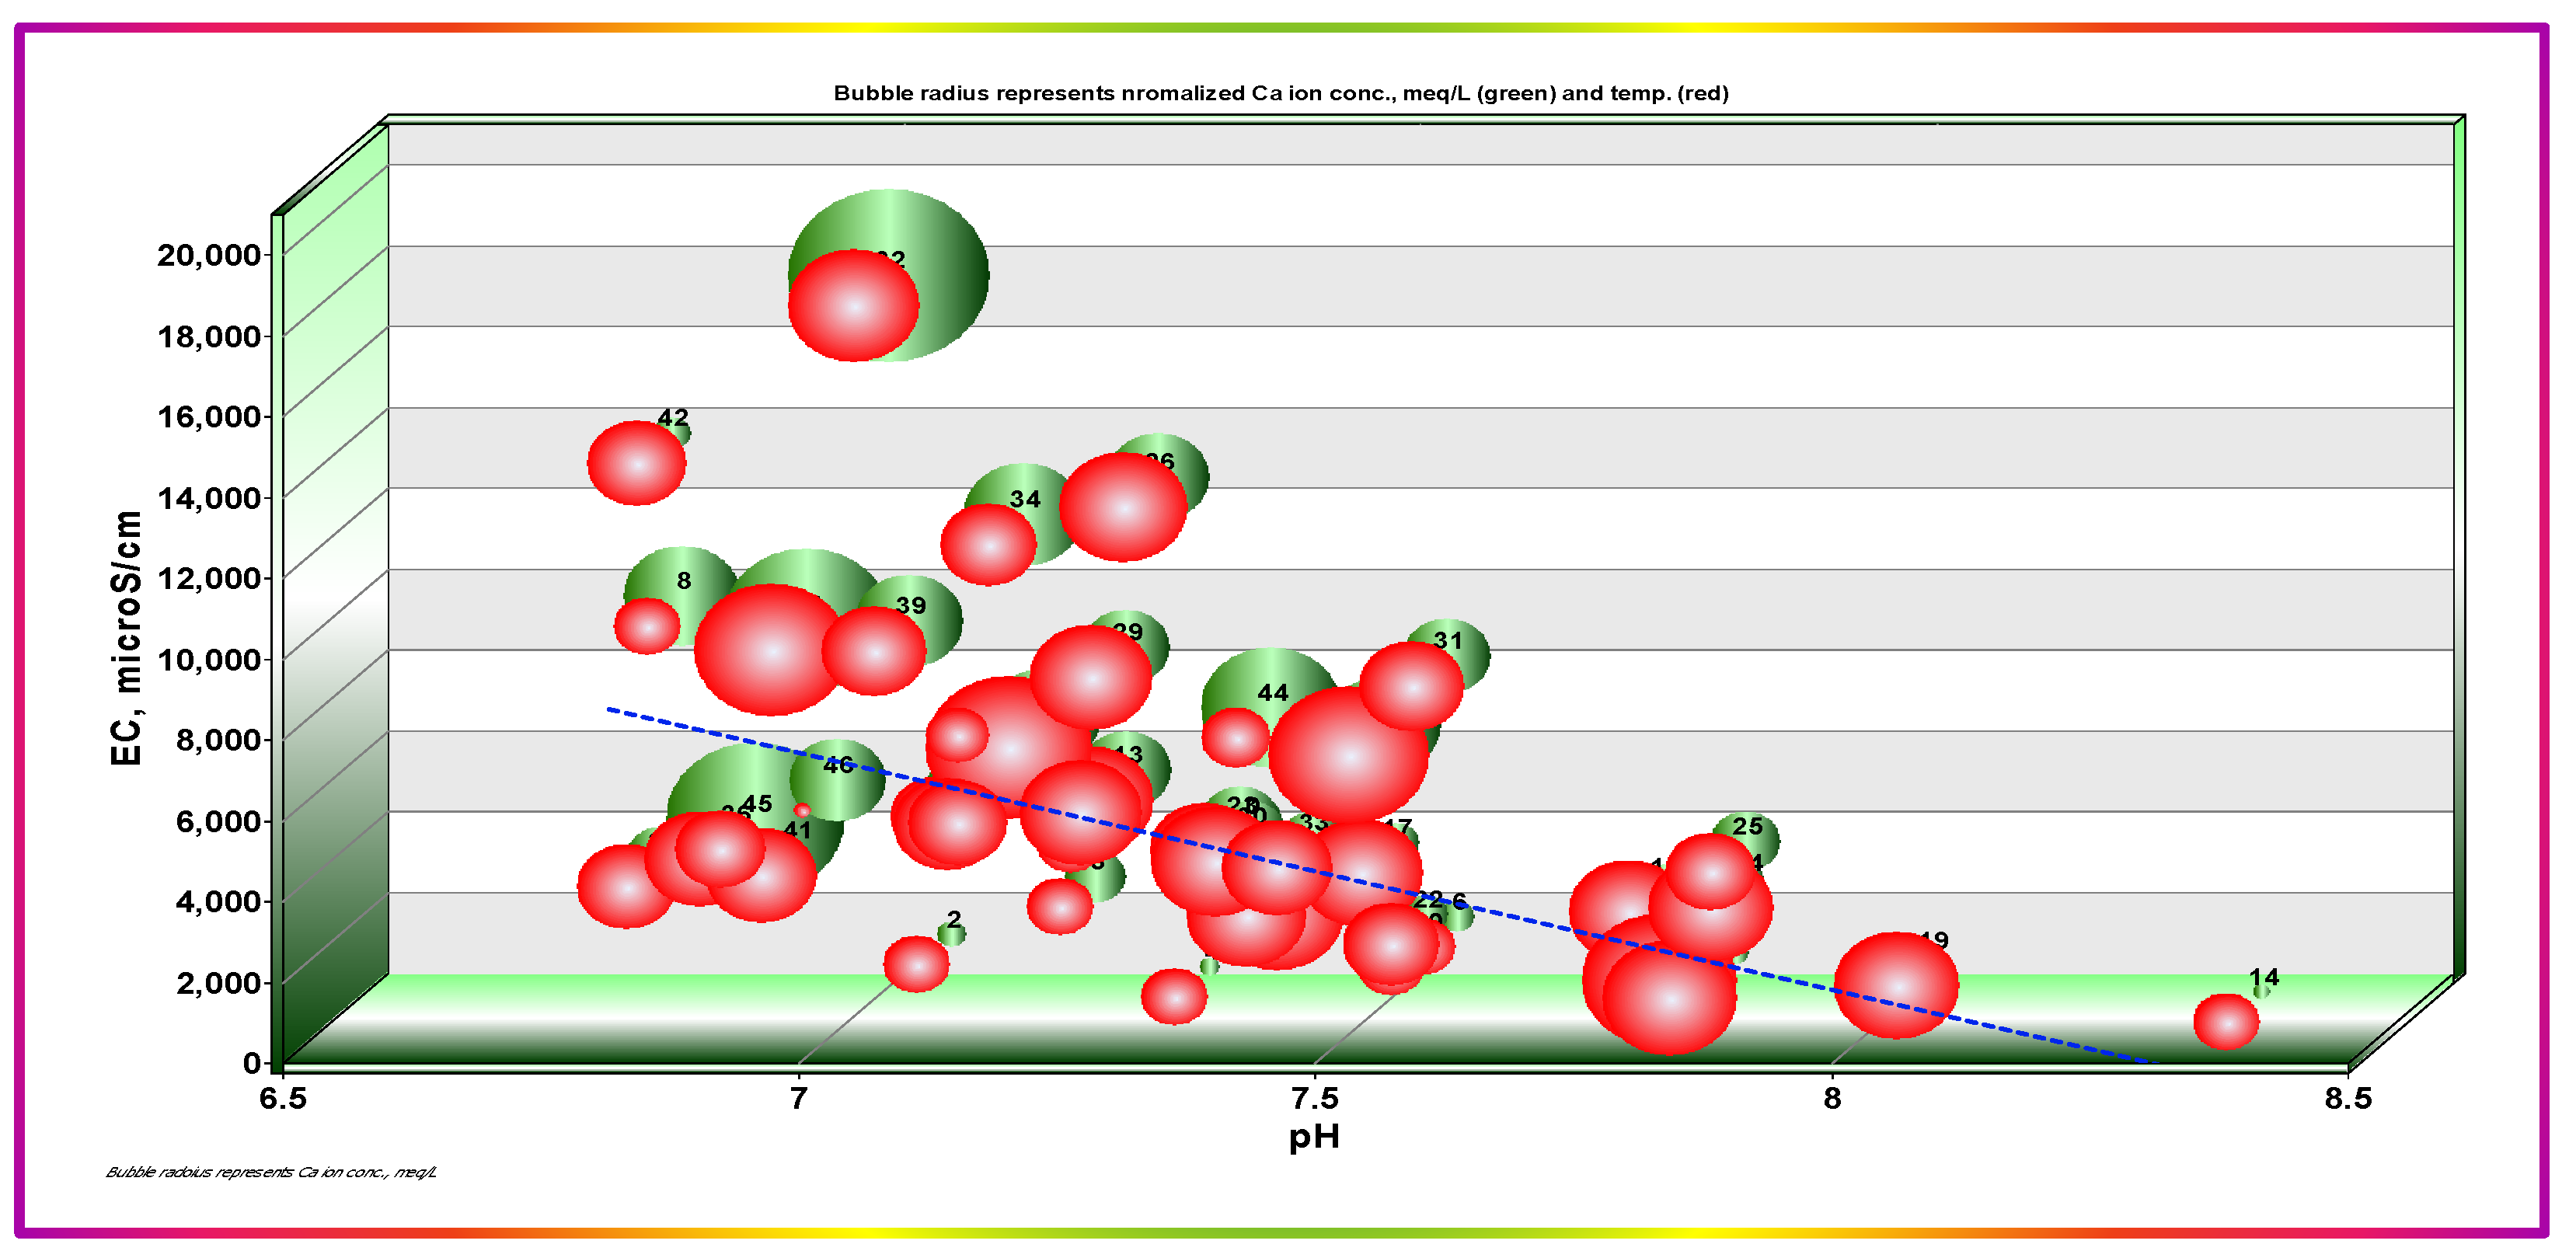
- EC values are mostly linearly dependent upon Na+, Cl−, Mg2+, Ca2+, and SO42−, especially at lower salinity levels. Ca2+ shows a deviation from that linearity at higher levels, which may be ascribed to its precipitation with a similar but milder trend for SO42−. The normality test for EC distribution failed with a p-value < 0.005, which may be caused by localized processes leading to a wide span of EC values with no remarkable central tendency. Moreover, higher EC values were noted for wells in the older and more intense farms. HCO3−, NO3−, and K+ exhibited no general trend with EC. On the contrary, pH exhibited a generally expected inverse relationship with EC, with remarkable deviation from linearity at higher EC values demarcating the occurrence of concurrent processes that alter EC with a quasi-exponential relationship instead of a linear relationship. One such change may be ascribed to the repeated replenishment with HCO3− from cycle to cycle of irrigation, since the absorption of atmospheric CO2 lowers the pH, leading to more dissolution of the contacted soil salts; more dissolution of carbonates again gives rise to higher pH values that result in precipitation of Ca salts, leading to a another lowering in pH. This supposed vicious salinization cycle is illustrated in the simplified Scheme 1, showing a continuous exacerbation of GW salinity. These cycles of pH fluctuations lead to an ultimate rise in EC values by changing the major contributor’s proportions.
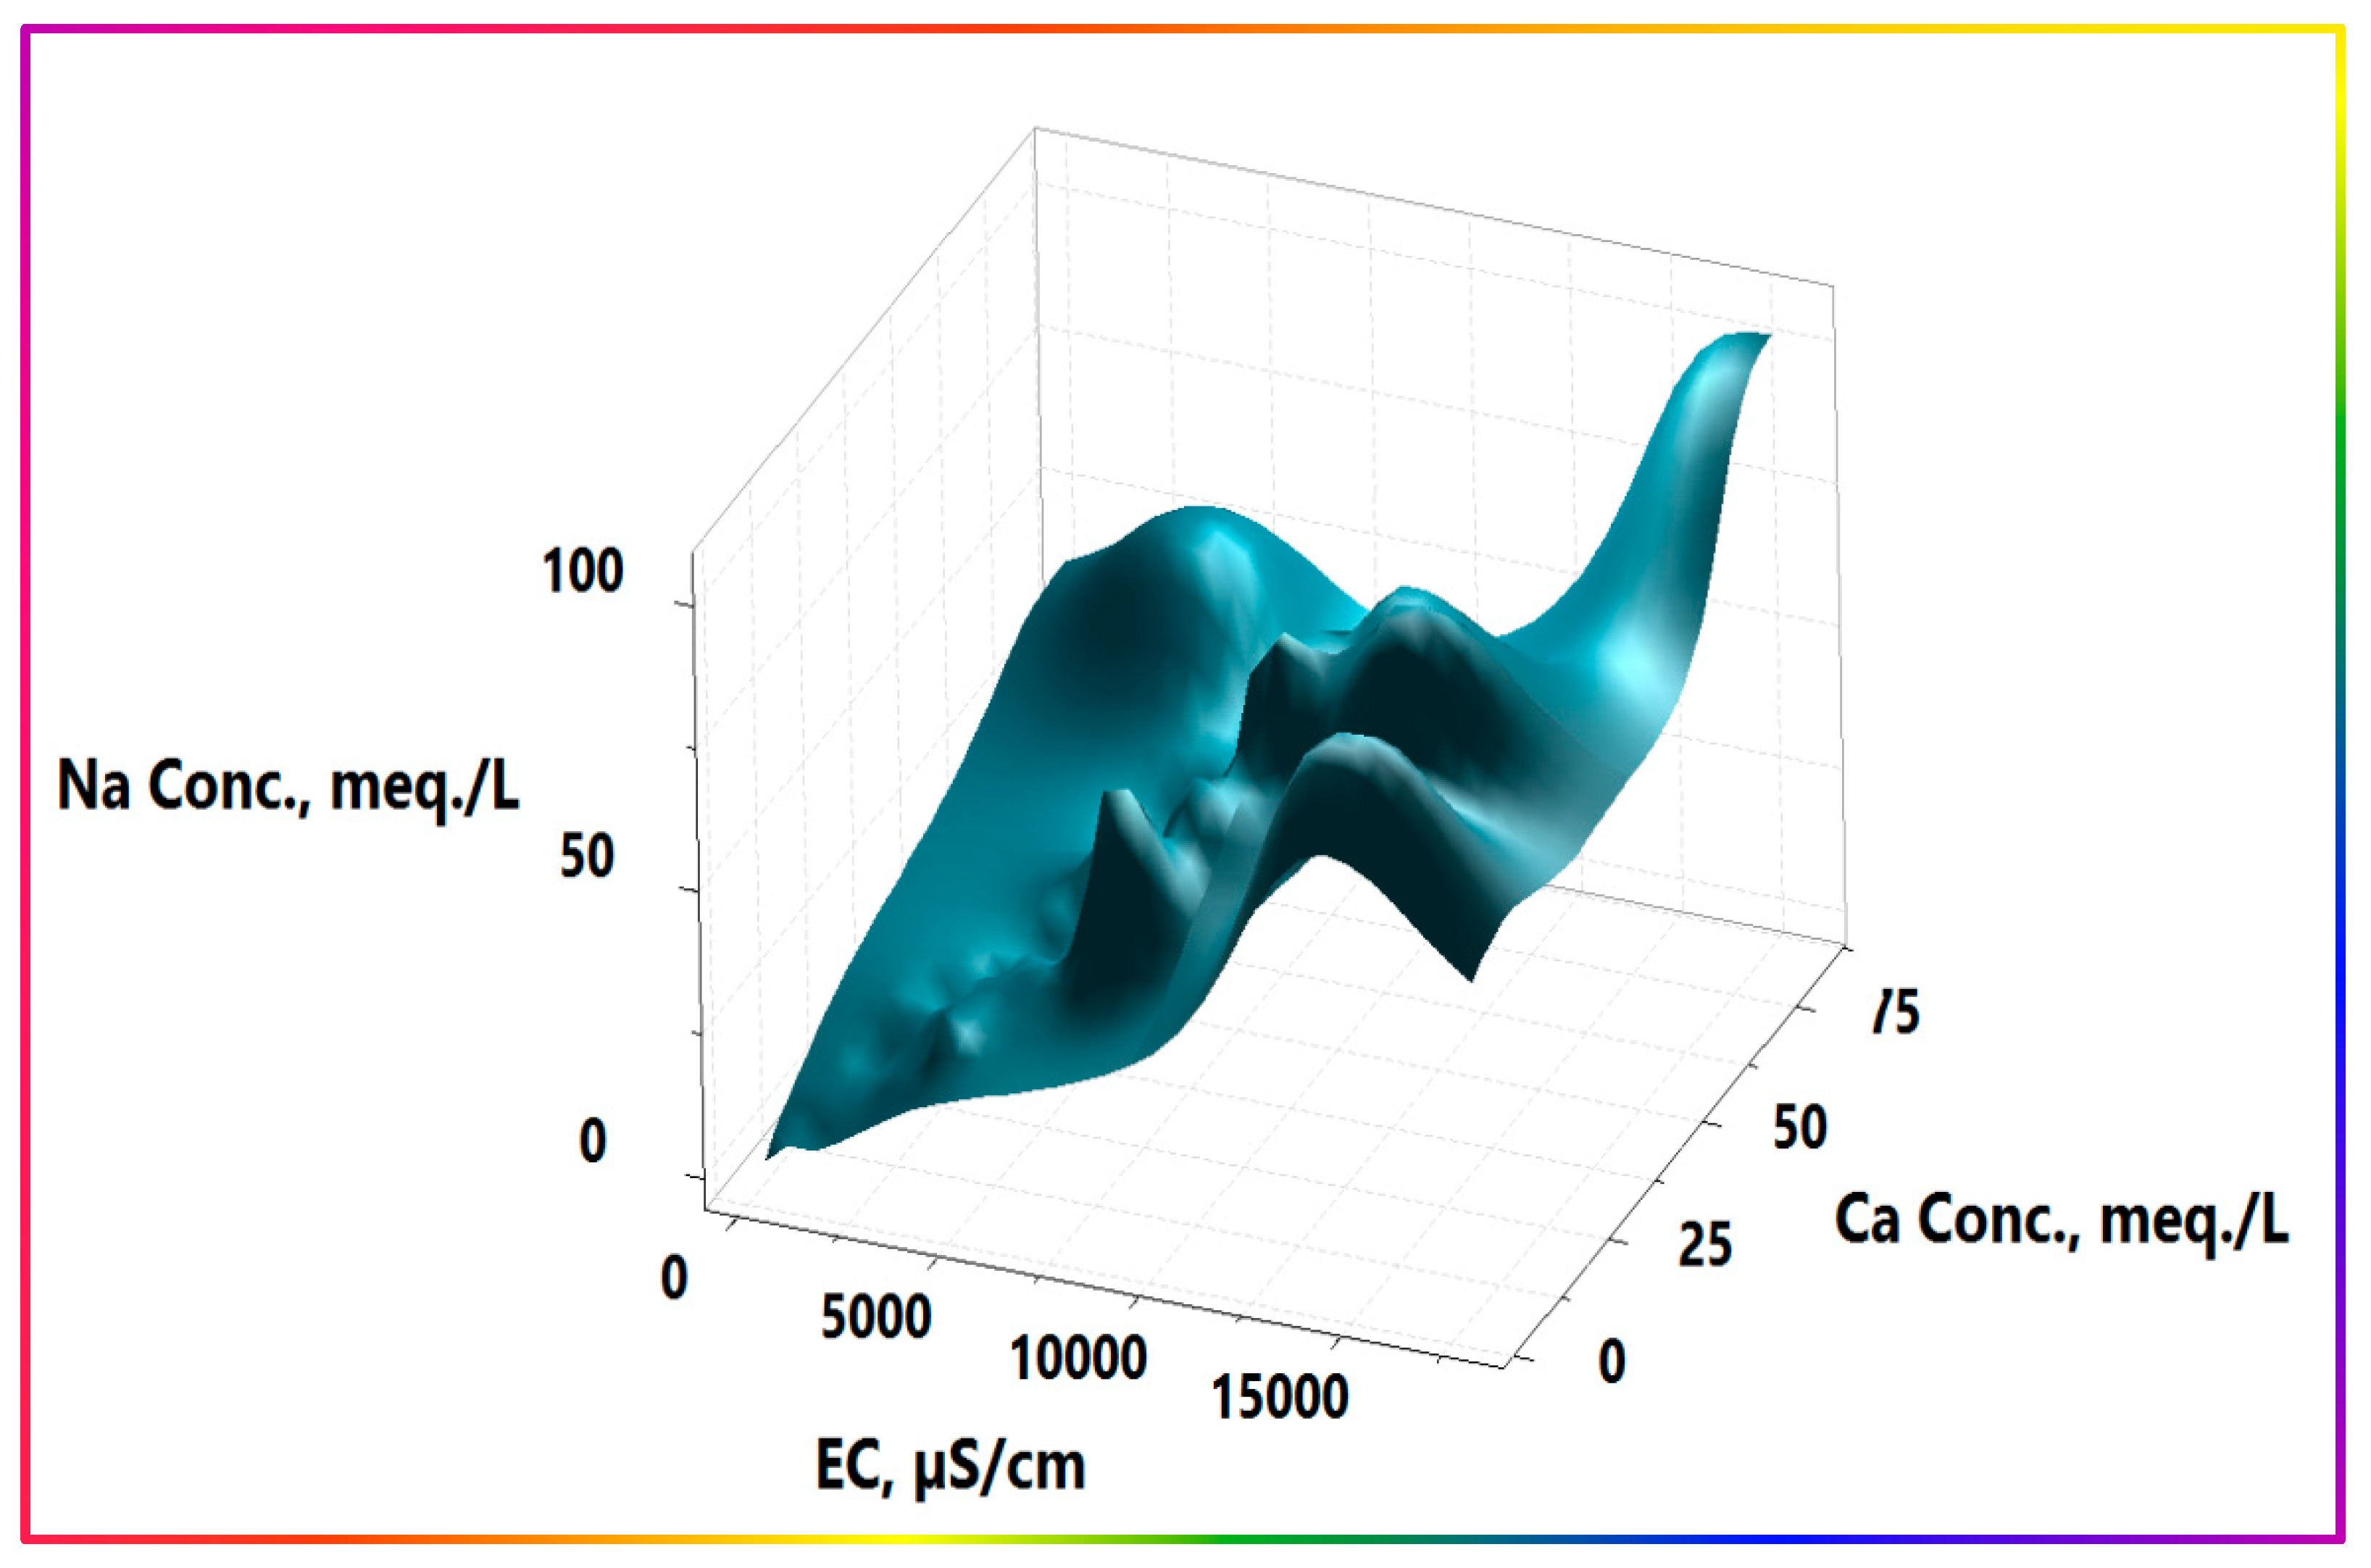
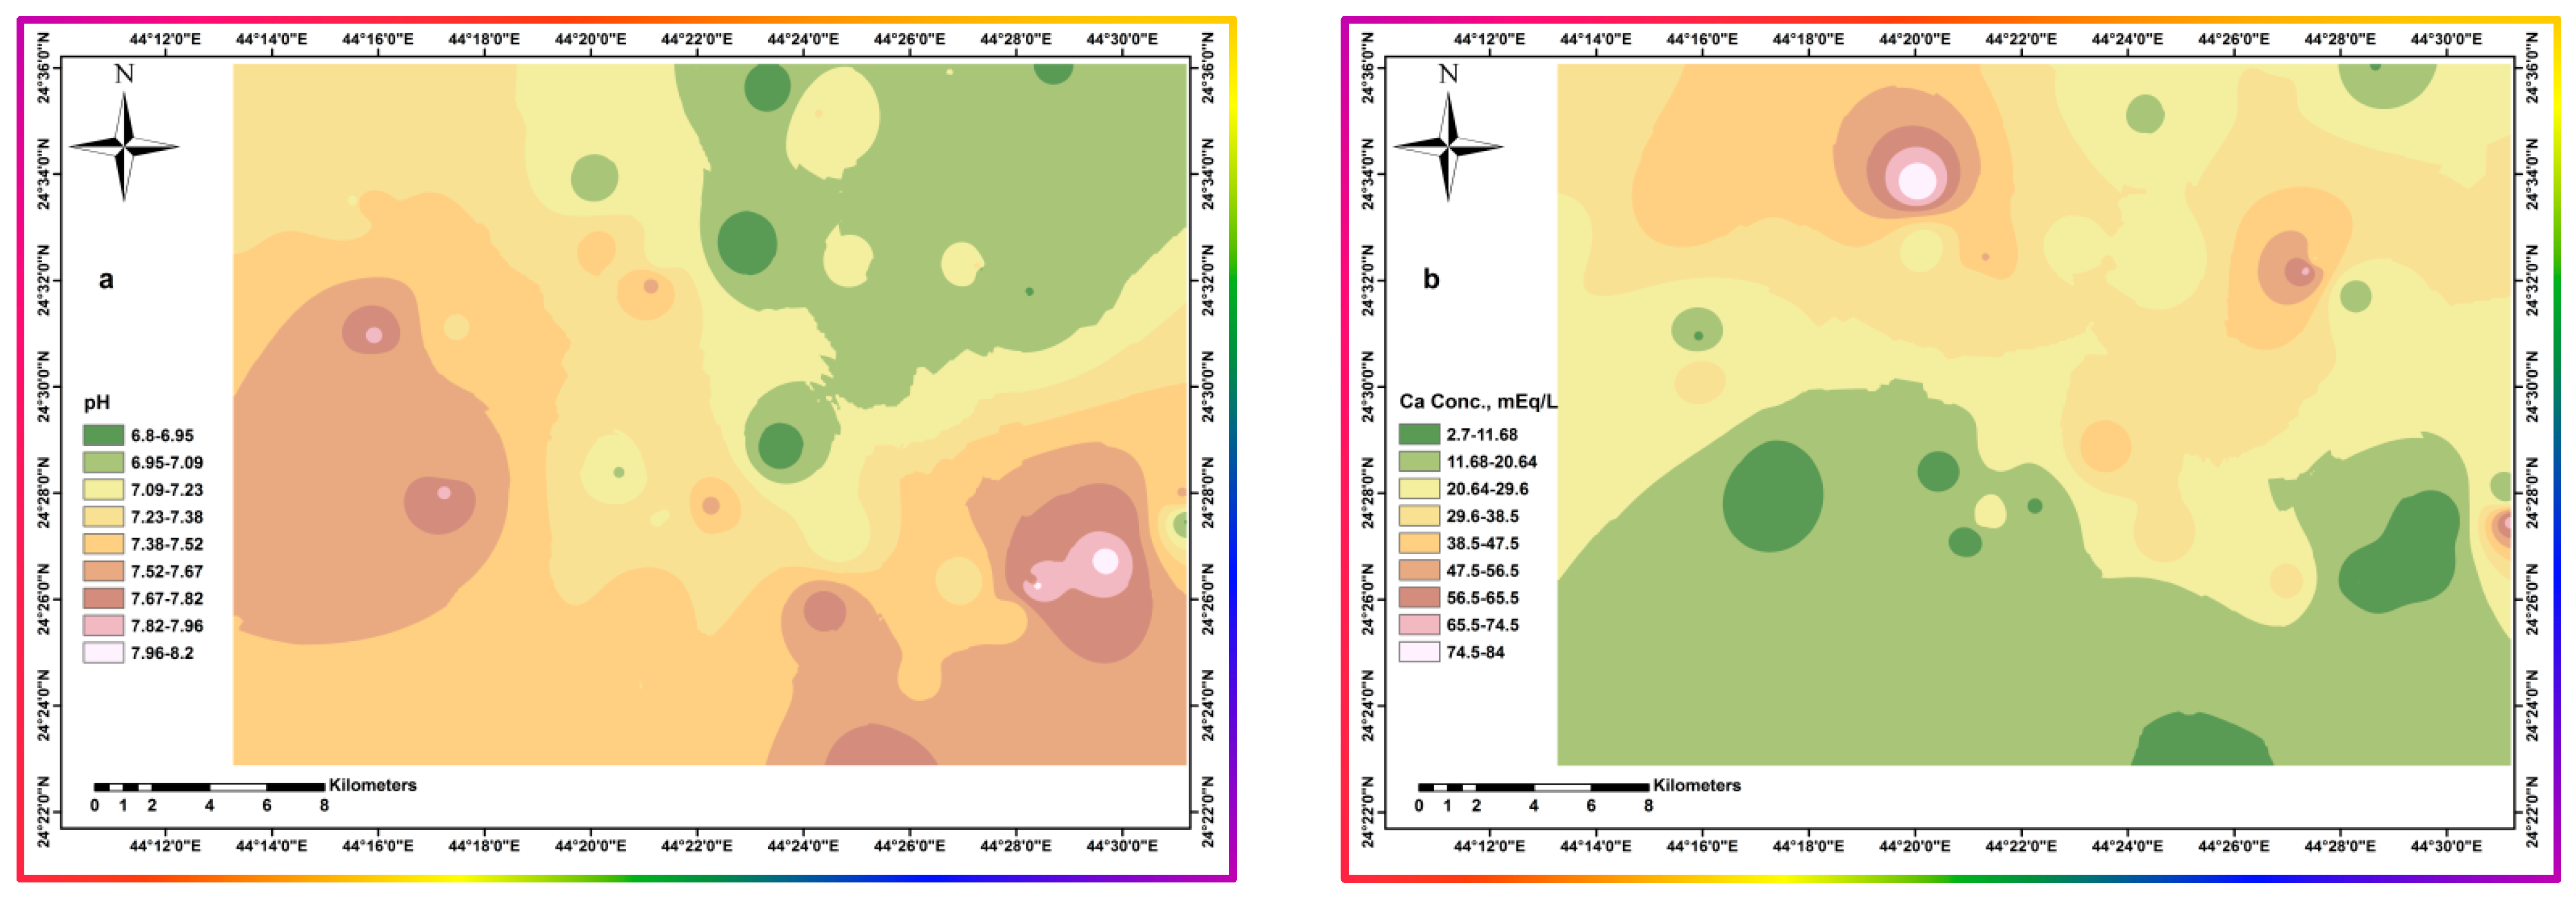
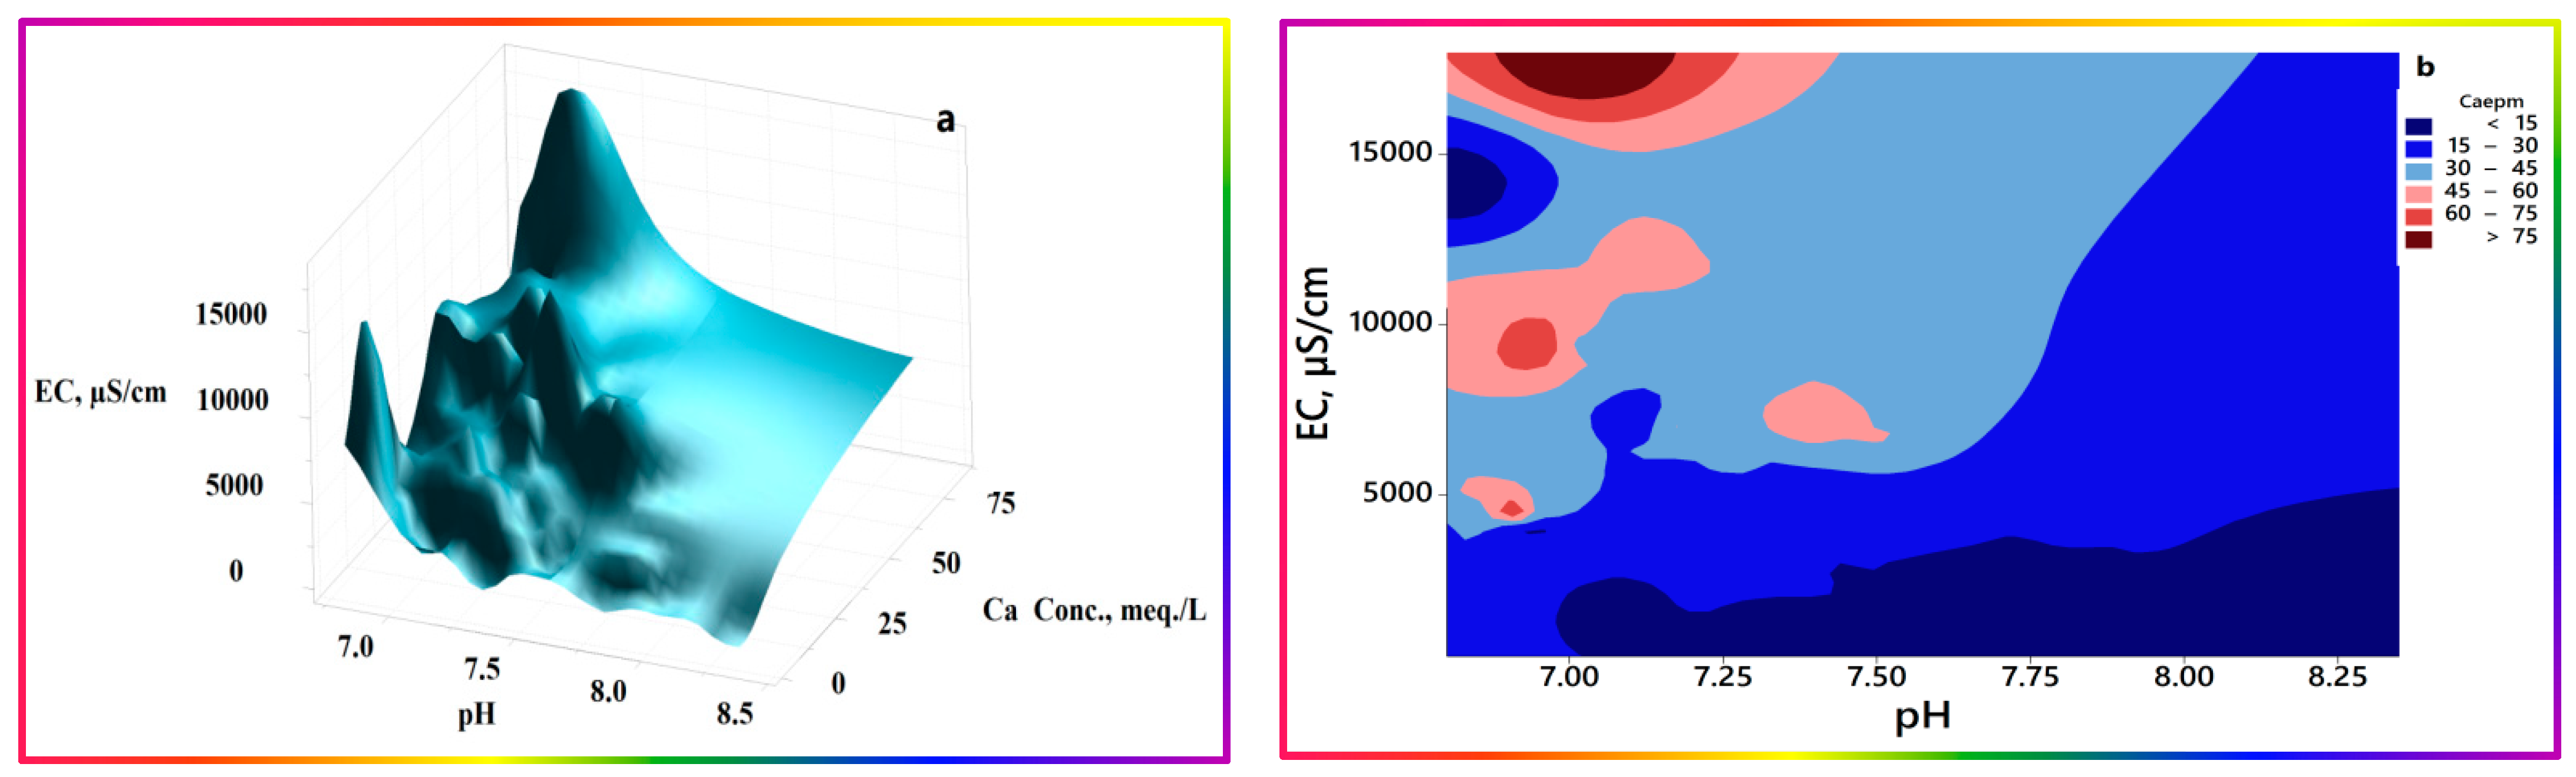
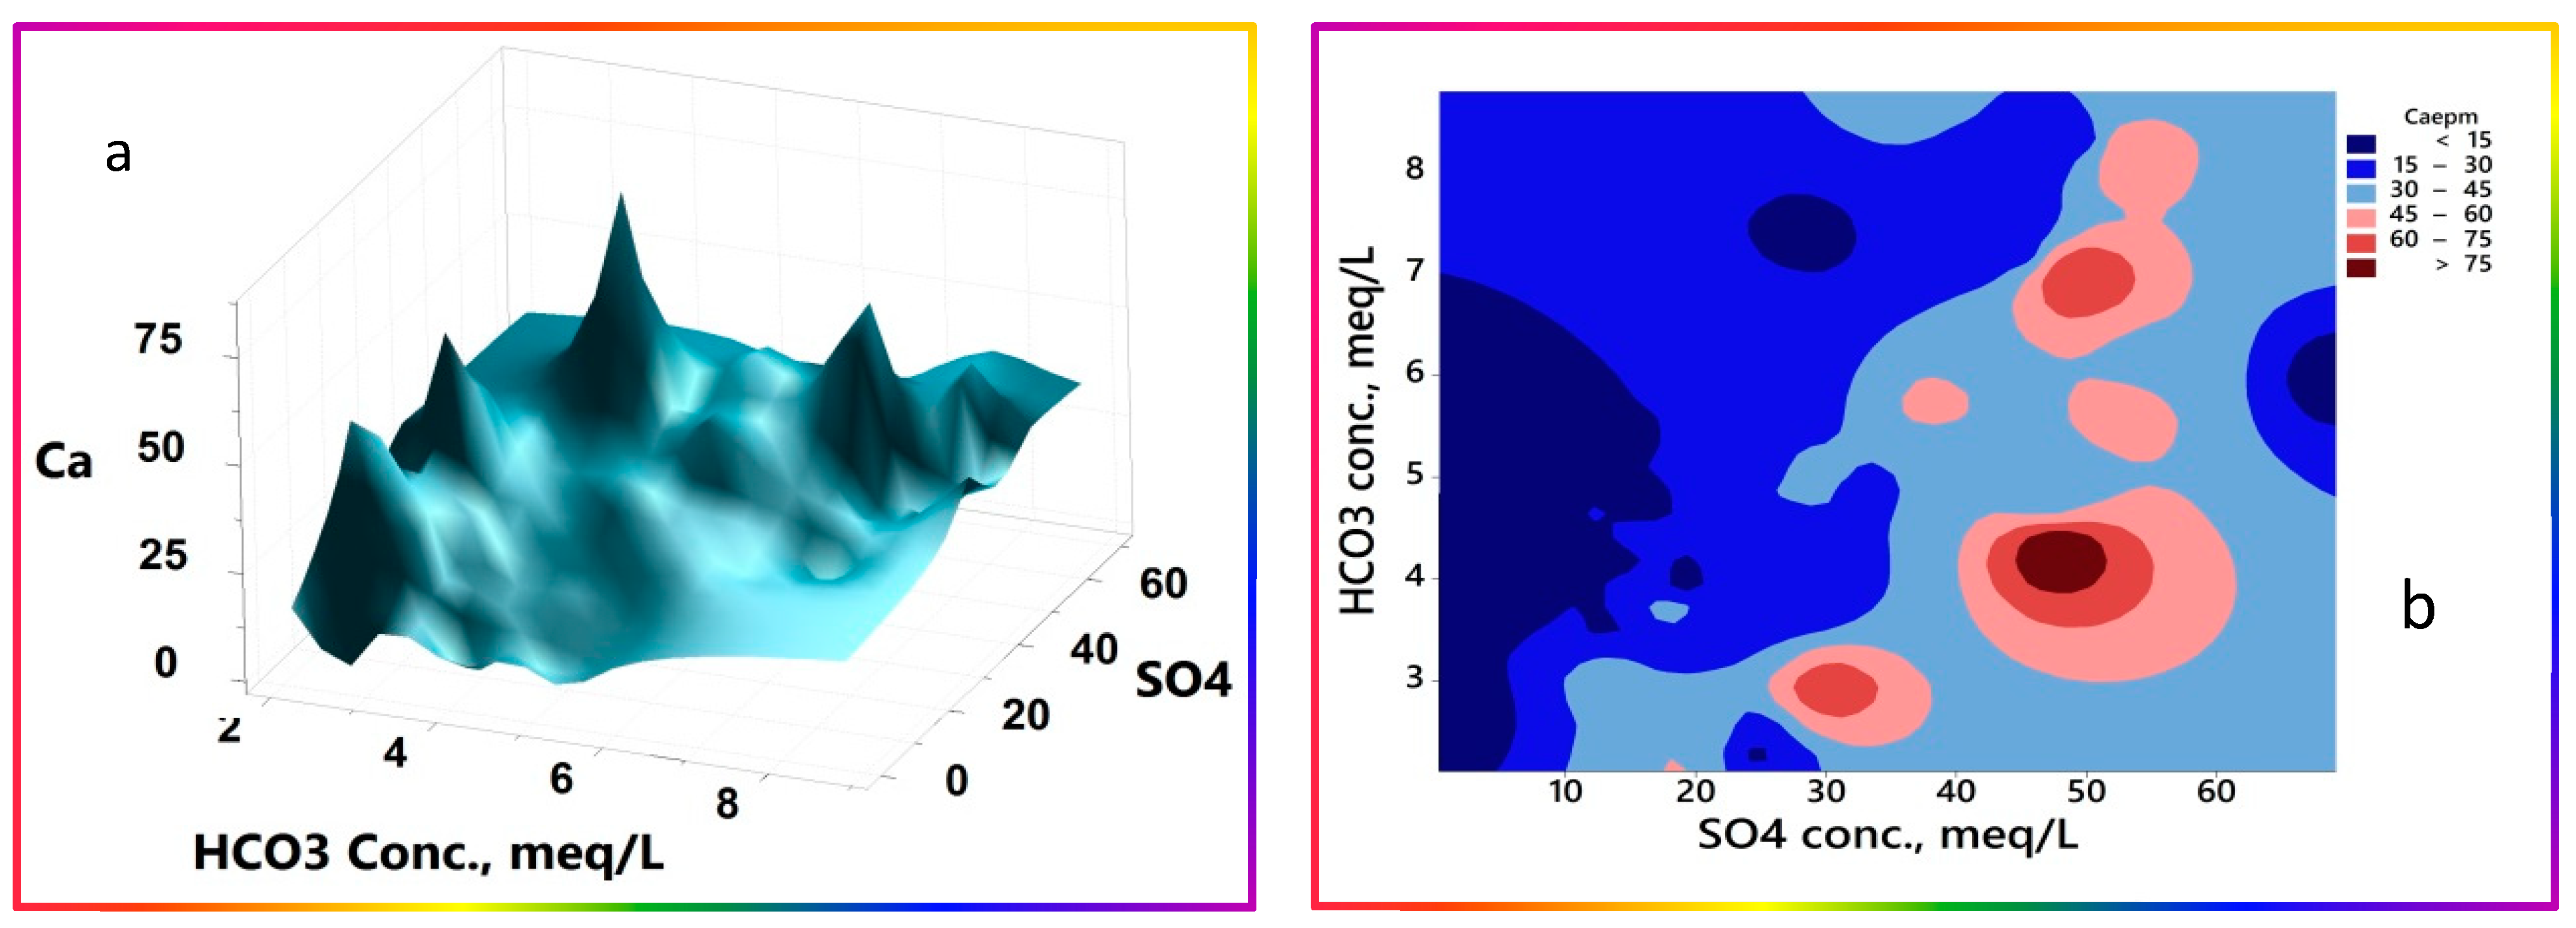
- pH has a different theme to EC, as expected. It trends inversely with Ca2+ and SO42− ion concentration, whereas HCO3− fluctuates sinusoidally as it repeatedly goes up and down. The normality test for pH passed with a p-value of 0.321, as it fluctuates with no ultimate sink or source terms, leading to net accumulation in a particular portion of the system. A 3D surface plot delineating this trend is portrayed in Figure 14a. The plot corroborates the finding of the scatter box plot matrix, namely, that calcium inversely fluctuates with pH in net semi-exponential growth at higher EC and lower pH values, as evidenced by the repeated peaks and troughs, with the highest vertex occurring at lower pH values. This trend seems logical according to known higher solubilities of calcium salts at lower pH values, coupled to reduced Ca2+ ion activities at higher concentrations of other soluble ions. At pH values higher than 7.5, a smoother correlation of Ca2+ ion concentrations with EC is evidenced, supporting the linearity portion in the scatter box plot matrix. The contour plot (Figure 14b) indicates the existence of pockets representing the highest calcium levels occurring at lower pH values and higher EC values.
- NO3− has no geogenic or even known atmospheric sources in the region under study. NO3− exhibits a direct linear relationship with all other constituents at low levels, except HCO3−, which has inherent fluctuation pathways. Moreover, NO3− exhibits no trend for exchange or precipitation processes. Normality testing failed, with a p-value < 0.005, indicating the occurrence of unbalanced and localized accumulation processes. The probable processes include evaporation concentration, soil flush-out additions with subsequent nitrification, and seepages. The other additive process, nitrification, implies no direct, definite relationship with the other constituents, which may enable its basis for making judgements or comments. Evaporation concentration remains the most probable process to affect nitrate concentration in a localized fashion that impairs its normal distribution.
- SO42−, Cl−, K+, and Mg2+ exhibit similar linear trends in exacerbation, with the normality hypothesis rejected at p-values < 0.005, except that for SO42−, which was retained but at very low p-value = 0.076.
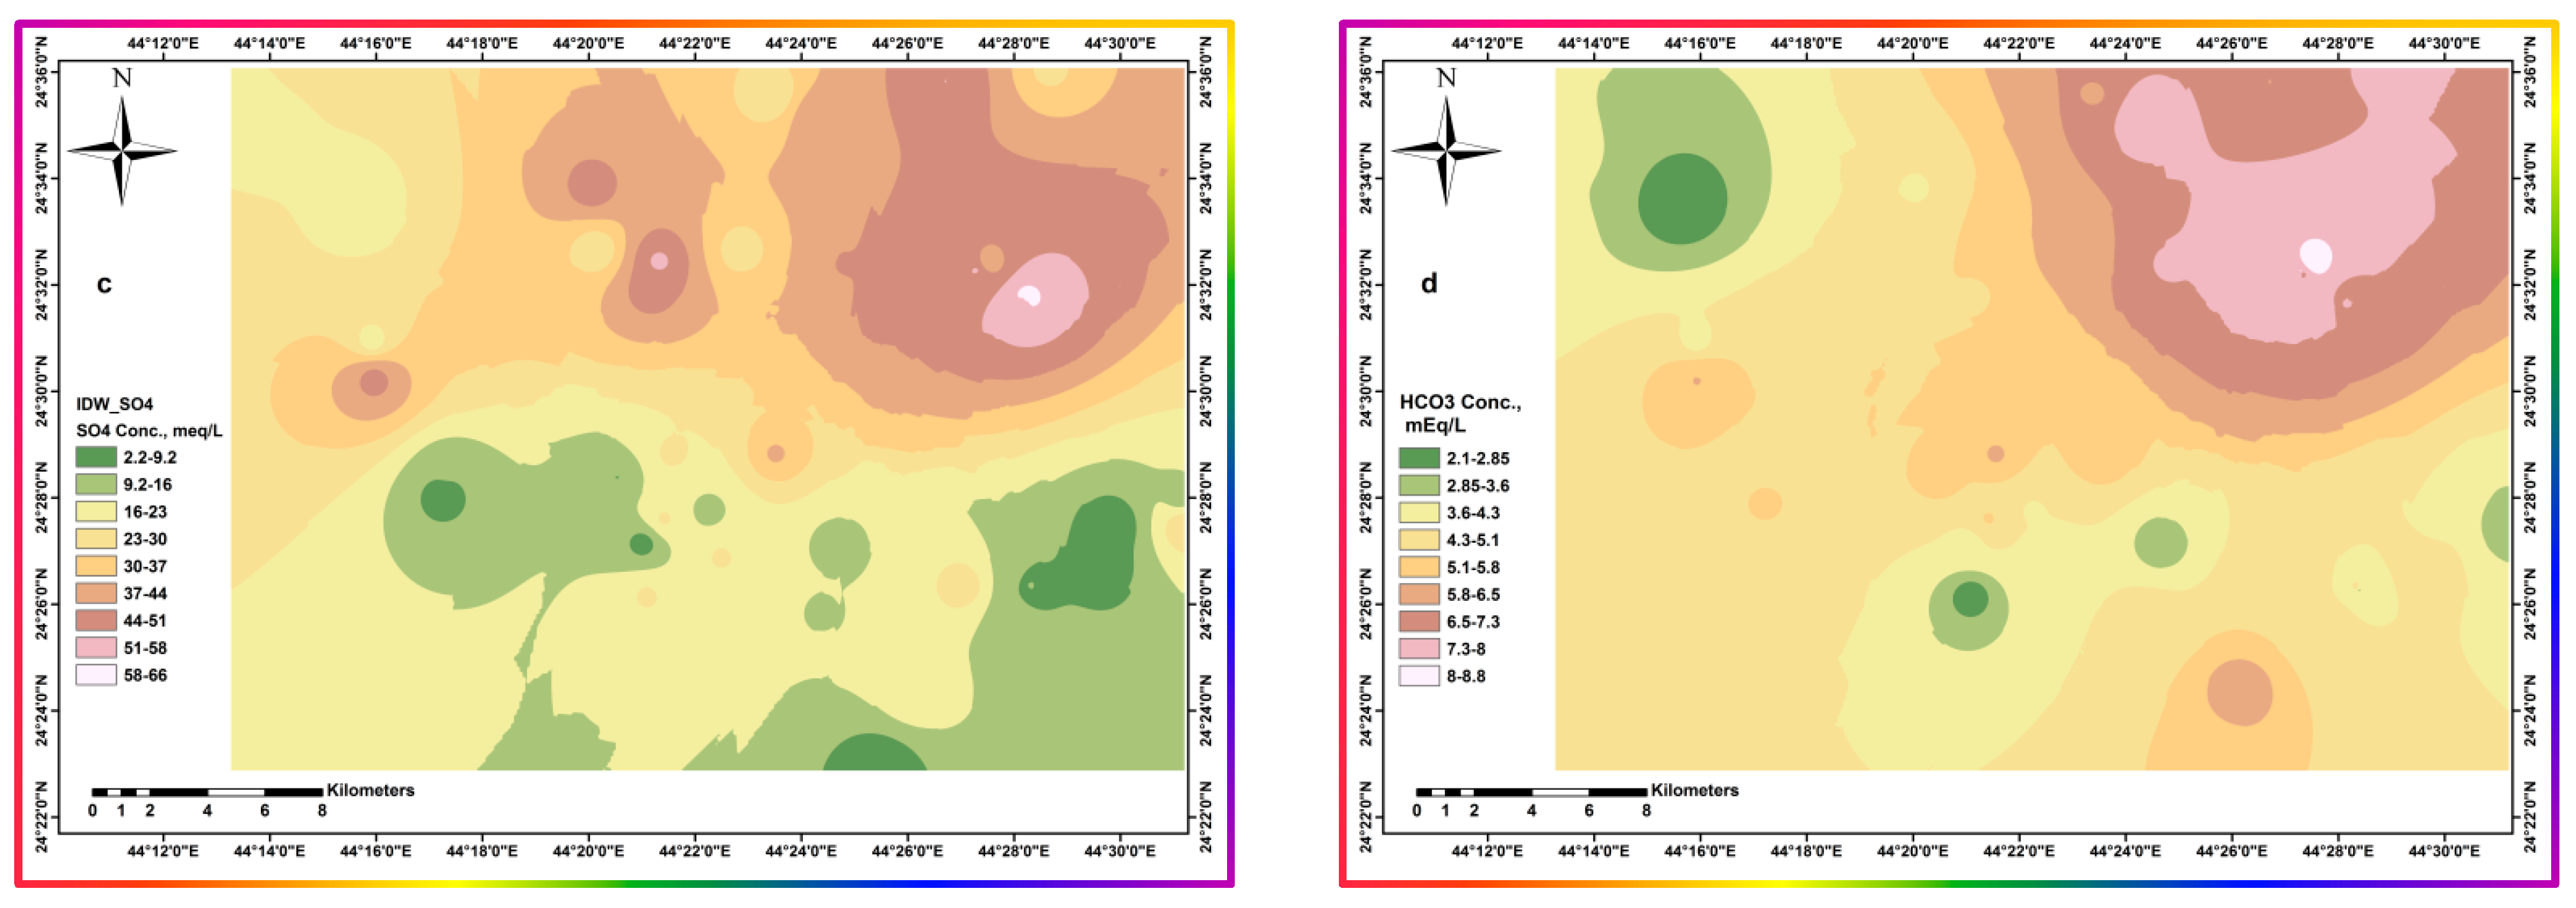
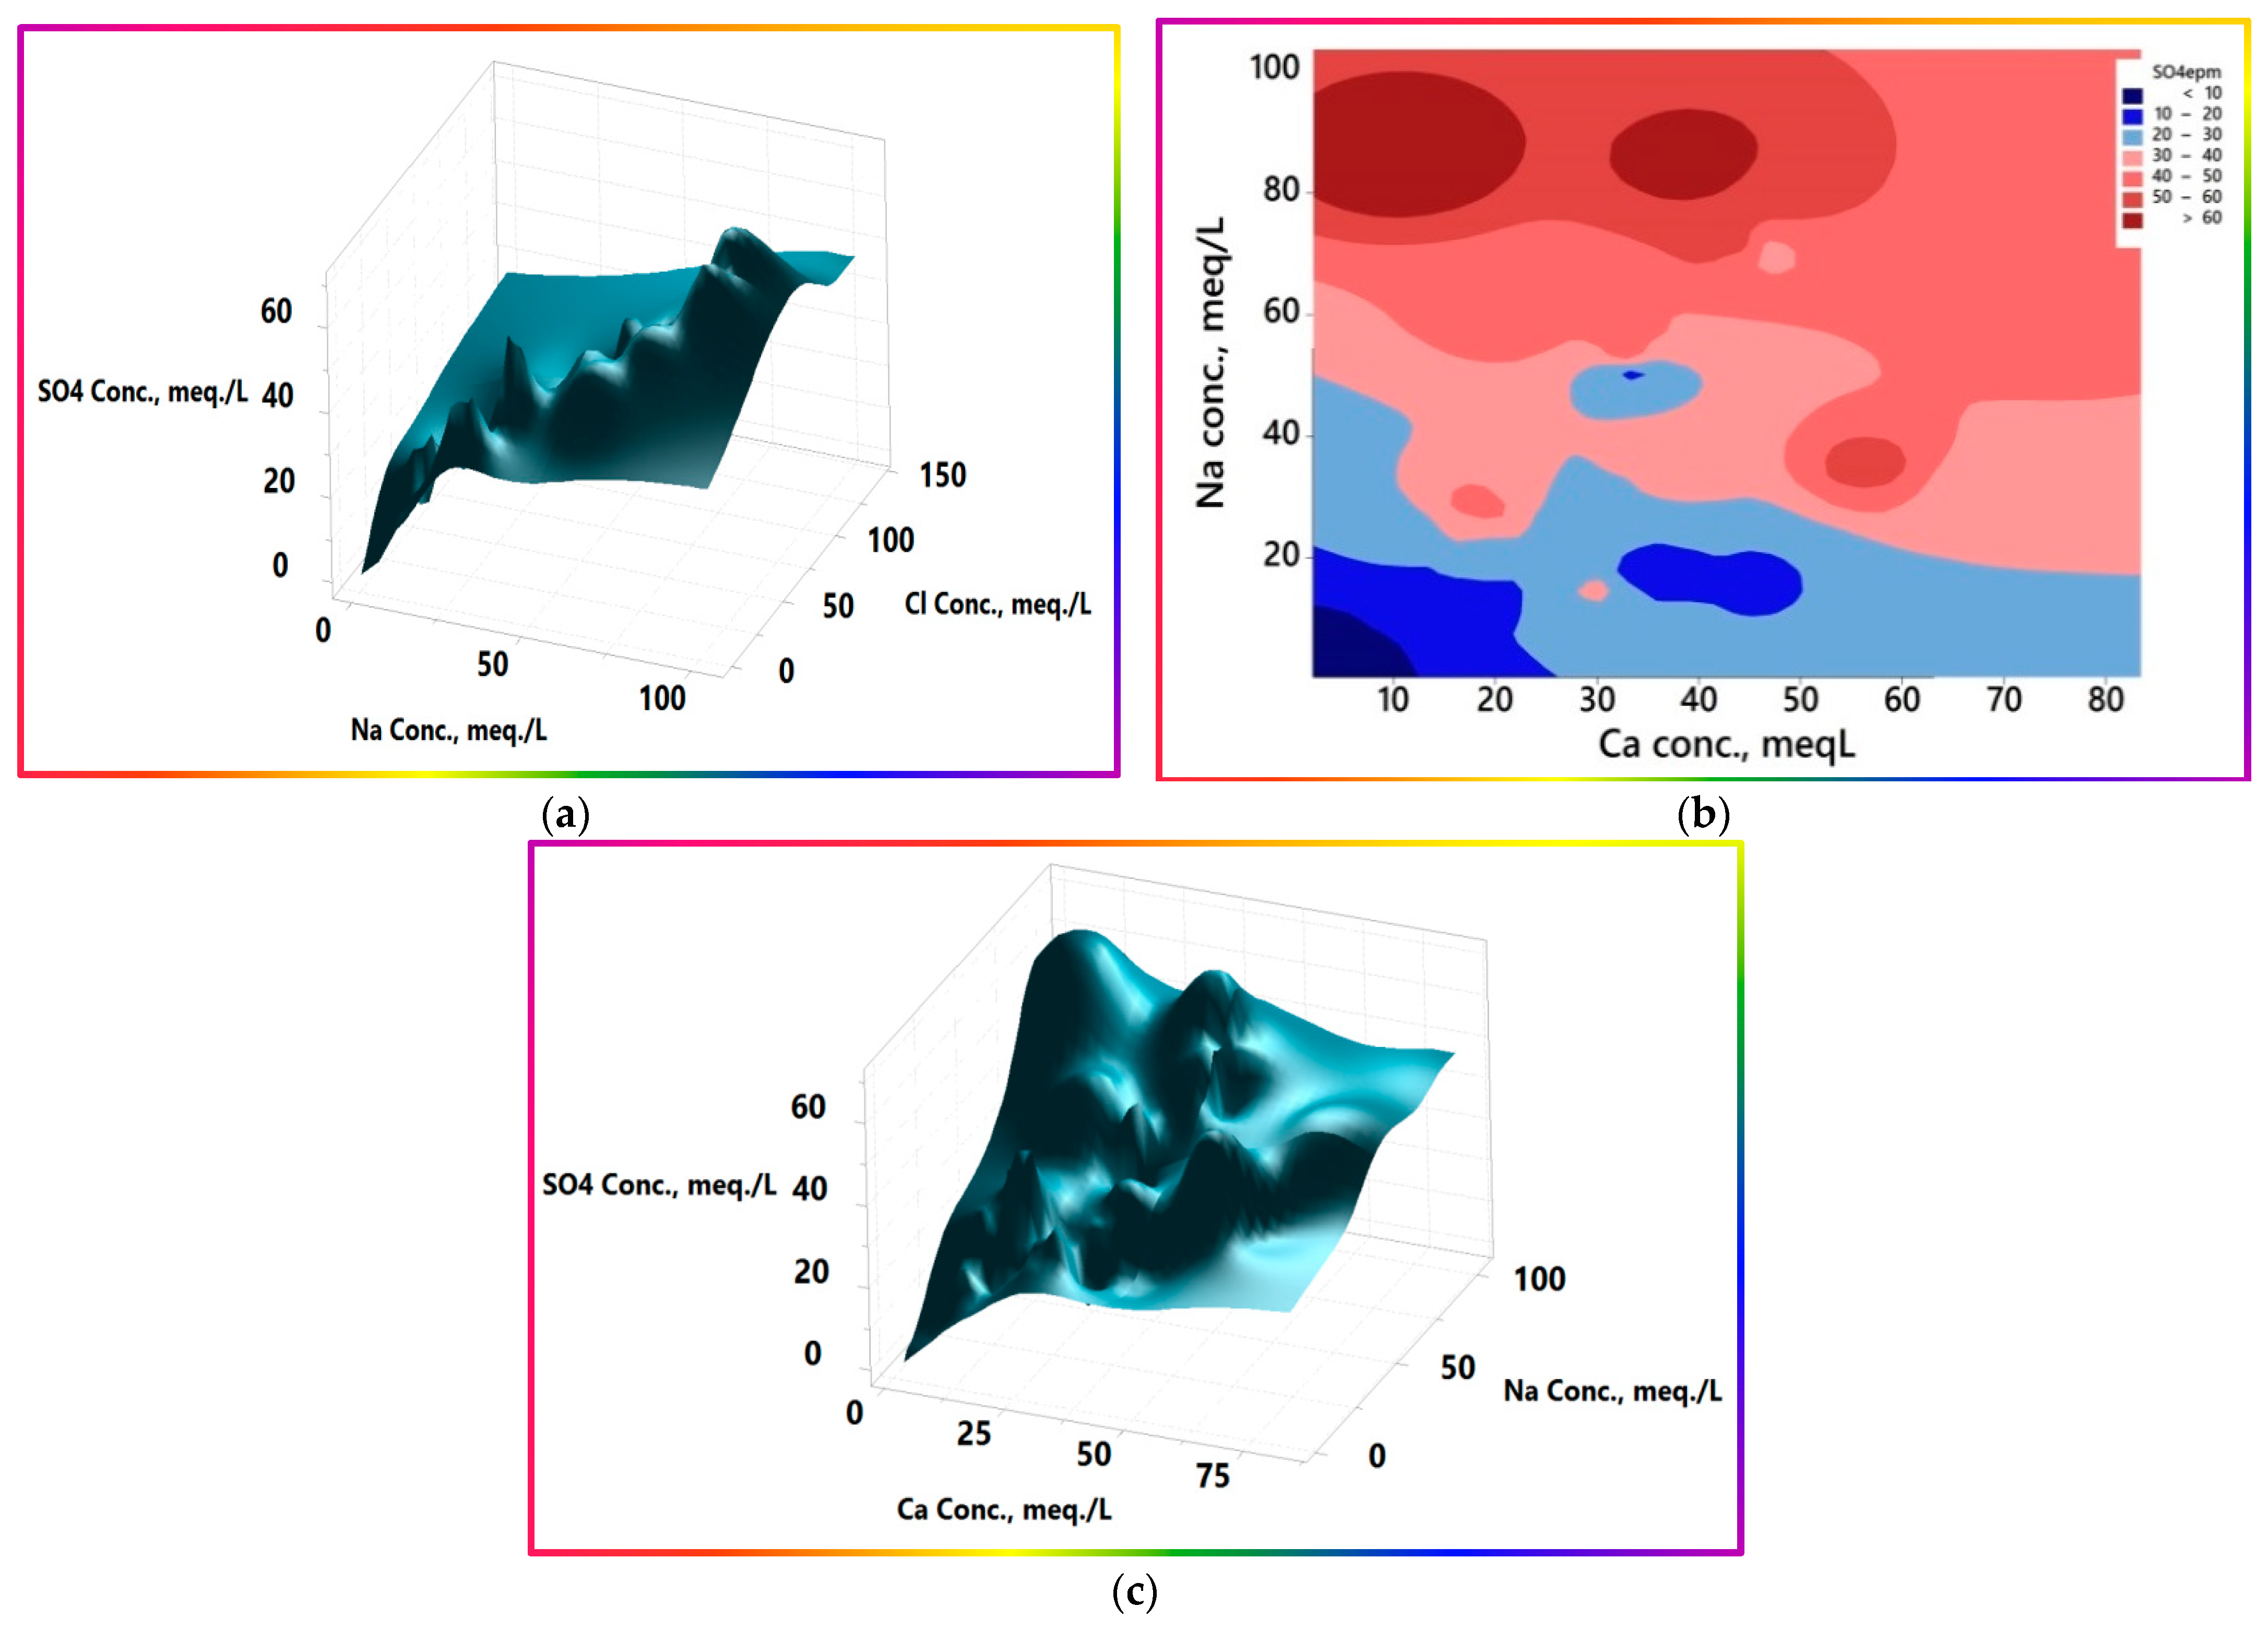
- SO42− loads significantly contribute to the linear change in EC values with all major parameters, and quasi-inversely with pH, except HCO3−. This trend indicates that SO42− was not significantly affected by the potential removal or attenuation processes, namely, ion exchange and precipitation. The study area contains many forms of sulfide minerals, including galena, sphalerite, polybasite, argentite, and pyrargirite, which, in their interaction with water, release SO42− [32,59]. In addition, igneous and sedimentary rock sources, such as gypsum, and the anhydrite dissolution and redissolution of probable previous precipitates, if any, contribute to the load. The distribution map of sulfate ions (Figure 12c) clarifies that the wells saturated with sulfate lie in the northern and northeastern regions, agreeing with the general EC trend and surface morphometric levels. All these sources represent a plausible explanation for high loads of sulfate. However, the smooth trend in sulfate with other constituents indicates that it has a relatively common source and has undergone a co-occurring process, mostly evaporation. The 3D surface plot of its variation coupled with the conservative Cl− ion and quasi-conservative sodium ion, for further investigation of the sulfate distribution, is portrayed in Figure 15b. The curves show that the sulfate ion concentration is directly propagated, i.e., the same as that of chloride and sodium. At the same time, the surface and contour maps of sulfate, calcium, and sodium show that sulfate is relatively inversely proportionate to calcium, especially at higher levels of sulfate. This behavior may be explained by the fact that the calcium precipitates as calcium carbonate, whereas the sulfate ion concentration propagates progressively, leading to the contouring of the semi-independence.
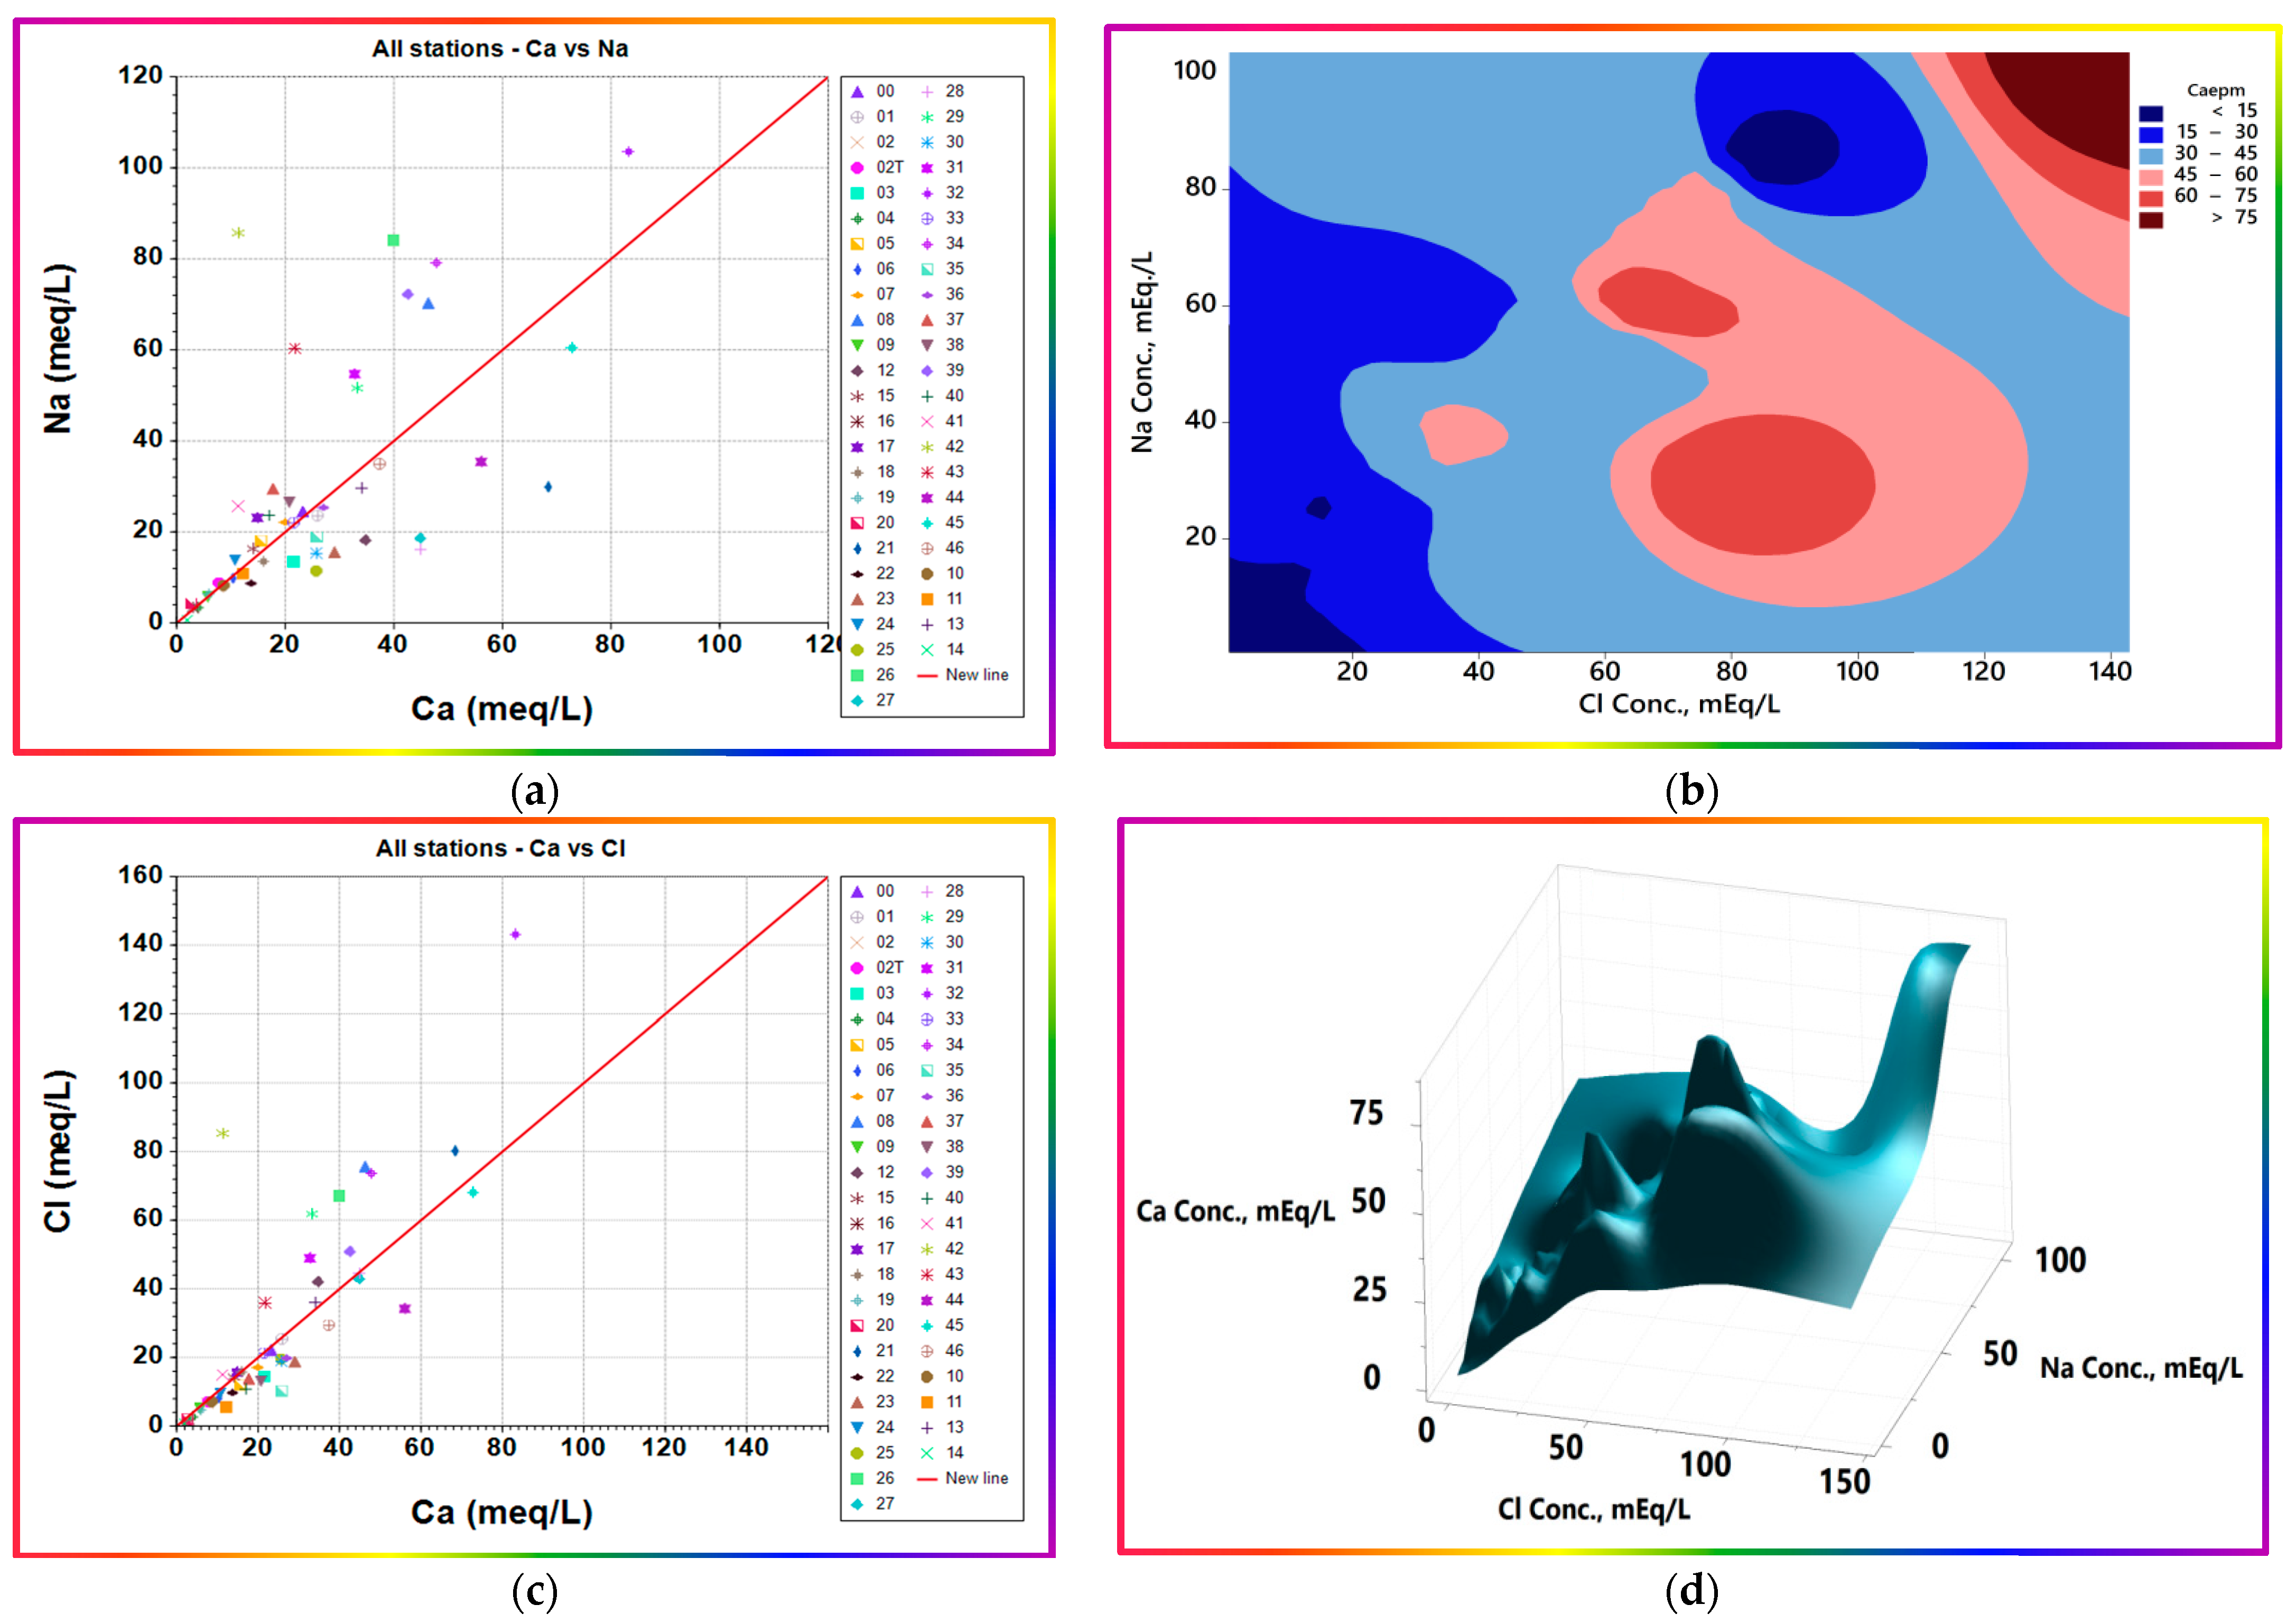
- Low concentrations of sodium and calcium ions: Sodium and calcium ions show notably different themes with their ramping levels. At low concentration levels, up to 15 mEq/L each, a clear linear trend with a slope of ≈1 (Figure 16a) is evident. The chemical composition of the precipitation in the study area is not available; hence, the available average chemical composition of the precipitation in the nearest region with similar conditions, Riyadh, was used. The precipitation had consistent EC values of 300–400 µS/cm, with occasional incidents that had far higher EC values due to dissolution of the aerosol loads [60]. Precipitation chemical composition showed that the content (in epm) of Ca2+ is nearly six-fold that of Na+. The study area samples are positioned on the equimolar line, demarcating a reasonable increase in Na+ relative to, or perhaps at the expense of, Ca2+ ions. The potential pathways for such modifications include the occurrence of the ion exchange process, silicate weathering, and/or calcium salt precipitation. The question to be answered is, which process is the most probable or effective? To answer this question, at least asymptotically or conceptually, the authors looked for samples having similar chemical compositions to that of average precipitation. One sample from the study area, sample No. 14, which is located distant from farms and human activities, was used mainly for drinking; thus, the authors considered that it was only affected by the rock interactions, yielding a somewhat similar chemical composition with a slight increase in Na+ content relative to that of Ca2+. The equivalent ratios of Ca2+/Na+ decreased from 6 to 4.4, with a congruent increase in Cl− confirming weathering of silicates; however, precipitation of calcium salts is still a potential process because the pH is 8.35. The EC value of sample No.14 was 255 µS/cm, which is very close to that of precipitation, corroborating the co-occurrence of potential calcium precipitation to compensate for that added by silicate weathering. The occurrence of ion exchange may lead to the same effects concerning sodium, but not for Cl−, which increases slightly compared to sodium. The average chemical composition of precipitation contains equimolar amounts of Na+ and Cl− (0.269 and 0.267, respectively). Hence, the extent of ion exchange could be ascertained to be the tiny difference between Na+ and Cl− equivalent contents, of 0.07 mEq./L. If this sample is considered to be the baseline or datum, the effects of the processes, namely evaporation and human activities, can be accounted for, imagined, or even estimated quantitatively according to the availability of all other relevant information, to reduce the associated uncertainty budget as reasonably or practically as achievable.
- Medium levels of sodium and calcium ions: At 15–30 mEq/L levels, a different theme to that mentioned in bullet point No. 6 appears to demarcate other relevant affecting processes. The points lie away from the equiline in the upper and lower directions. The lower-lying points represent increased Na+ at the expense of Ca2+ ions due to ion exchange supported by the co-increase in sodium over chloride. On the contrary, the higher-lying points represent increased Ca2+ at the expense of Na+ ions due to probable consecutive calcium concentrating processes. The former may represent calcium precipitation leading to reduced soluble calcium activity supplemented with reverse ion exchange, which yields lower Na+ loads. The latter may be due to evaporation concentration at primarily reduced calcium activities and pH values, leading to an increase in calcium concentration. This trend overlays Cl− and Na+, supporting the fluctuation in Na+ relevant to calcium, as shown in Figure 16a,b.
- At far higher levels, >30 meq/L, the trend is still similar to that at the medium level, except the points are more distant as the height increases. This theme may be due to the rigorous effects of the vicious salinization cycle described in Scheme 1. Such effects require a continuous increase in Cl− content relative to that of Ca2+, as supported in the current findings (Figure 16c), and indicating the probable validity of the presented explanation. Moreover, to look further into the interrelationships among Cl−, Ca2+, and Na+, a 3D surface plot is portrayed in Figure 16d. Calcium shows repeated peaks and troughs, confirming it underwent multiple processes compared to sodium and chloride, which show a relatively continuous increase. The largely peaked tail at the right corner confirms the absence or relief of calcium-lowering processes, such as precipitation, due to its lowered activity at the high concentrations of other ions. Additionally, the ion exchange may cease, reach a dynamic equilibrium state, or reverse due to high sodium levels.
- HCO3− exhibits no definite pattern with all parameters, except with pH, which fluctuates sinusoidally. The normality test passed with the most significant p-value of 0.474, indicating no ultimate sink or source terms lead to net accumulation in a particular portion of the system. As pointed out and explained throughout this demonstration in different sections, HCO3− is continuously replenished and consumed at each irrigation cycle. There was no net input of HCO3− due to the prevailing prolonged drought conditions. These trends are shown in Figure 17. As shown in Figure 17a, calcium shows an inverse relationship with HCO3−, denoting precipitation of calcium at higher HCO3−, or a less-affected well with irrigation water return flow, as in the case of low-EC water, and shown by the lower-right part of the 3D surface plot (Figure 17a). Ca2+ pockets appear at low levels of HCO3− and moderate to high levels of SO42−, and become milder at higher HCO3− levels, as portrayed in the contour map (Figure 17b).
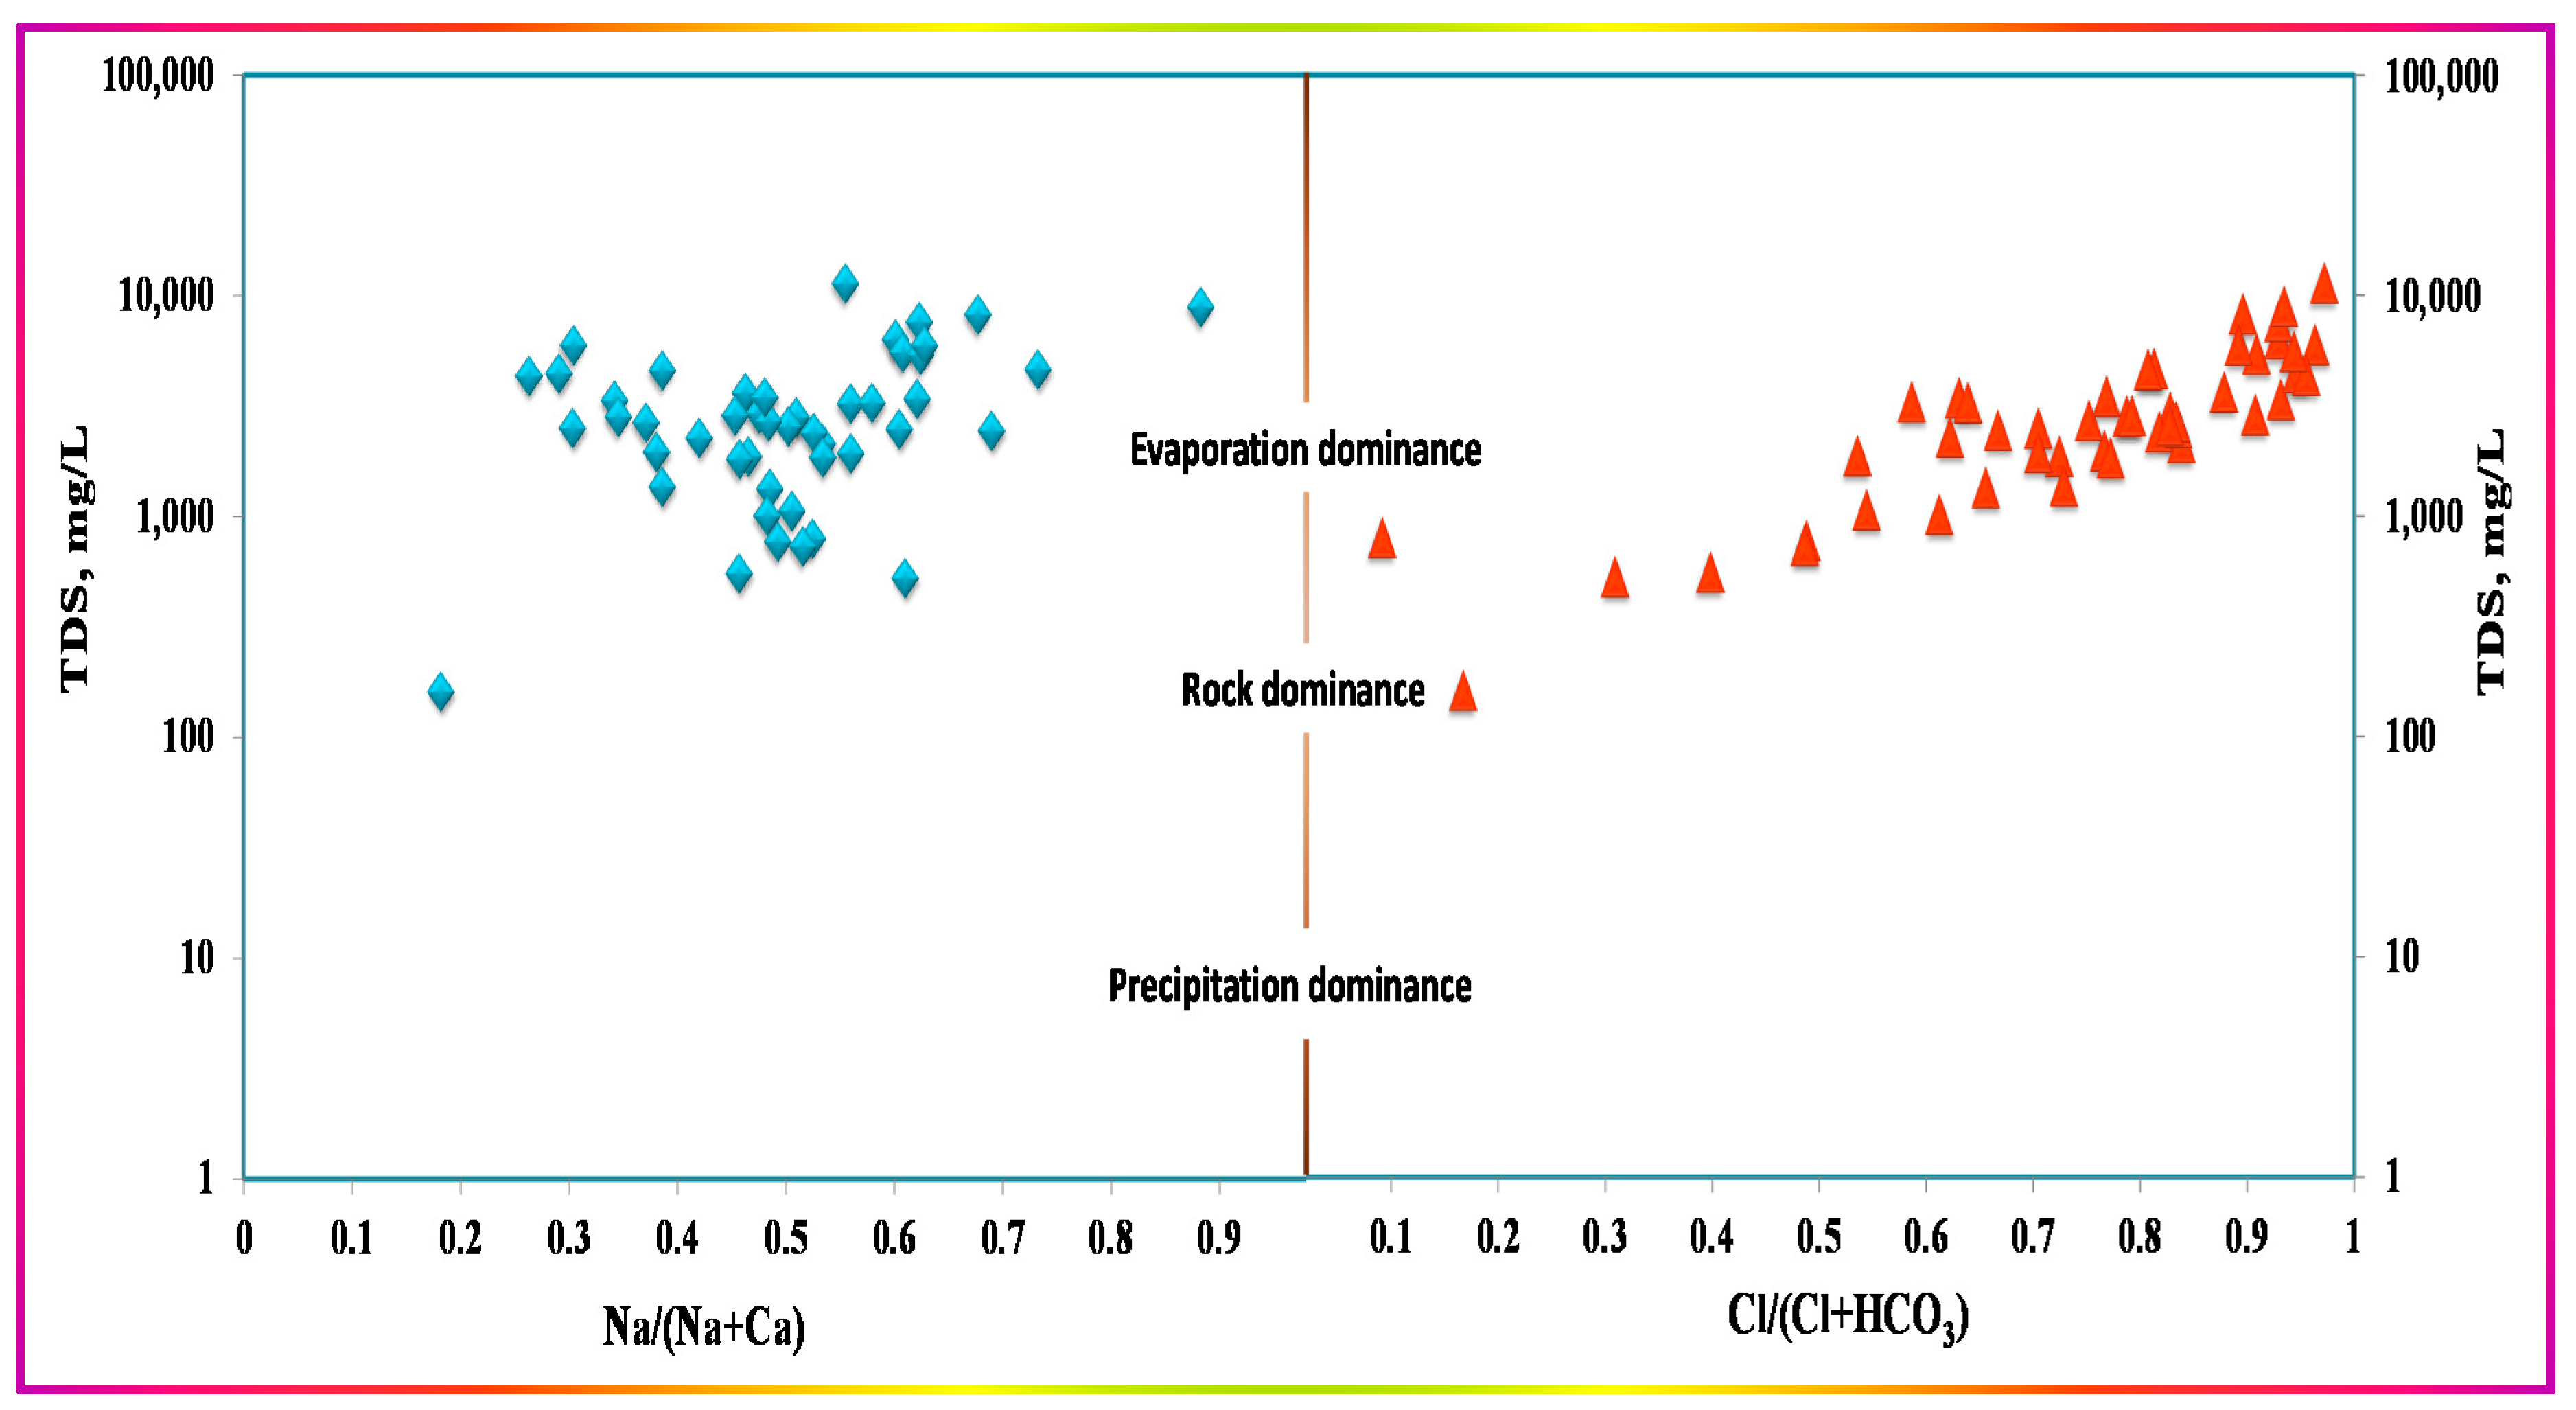
3.5. Comparison with Gibbs Diagram
4. Conclusions
- Overall, the evolution of the GW system in the Ad-Dawadmi study area is controlled by many co-occurring processes: aerosol dissolution, evaporation, direct and reverse ion exchange, precipitation of calcium salts, flushing out of soil-bounded salts, and rock weathering.
- The major factors controlling the studied GW geochemistry are fluctuations in pH and HCO3− levels, coupled with evaporation.
- The effects of prolonged drought and intensive human activities are the most severe factors responsible for the deterioration in the quality of the sole precious GW reserve in the study area.
- Truncating the study area yielded helpful insights into major constituents’ variation trends. In conclusion, the salinity increases from south to north and northeast, and from west to east, with remarkable changes in the distribution of major constituents, particularly sulfate, chloride, sodium, and calcium, in terms of both amount and proportion.
- Essential processes recognized by the visualization-based representations, such as direct and reverse ion exchange, precipitation of calcium salts, flushing out of soil-bounded salts, the role of HCO3− and pH fluctuations, and solution ion activities of calcium, cannot be inferred from the Gibbs diagram.
- The integration of different visualizations that relate three parameters—bubble diagrams, 3D surface plots, and contour maps—was found to provide multiple lines of evidence, constrained interpretations, and insights that otherwise might be masked.
- The scatter box plot matrix was found to be very useful, having the advantages of the collective representation of the whole spectrum of major ions on one plot, simplicity of production, presentation of extensive datasets on one graph, and direct readability.
- Large SD values denote the significant variability within the area, which may be due to significant influencing parameters that are localized in nature, rather than effects of lithology, catchment-wise, or basin-wise processes.
- Pockets of higher EC values, NO3−, SO42−, Cl−, Na+, and Ca2+ are remarkable, indicating the effects of point source activities, primarily agriculture and livestock farming.
- The vicious salinization cycle was devised and illustrated in the simplified Scheme 1, and is thought to be the process causing the worst deterioration in the GW quality and the salinity within the study area.
Author Contributions
Funding
Institutional Review Board Statement
Informed Consent Statement
Data Availability Statement
Conflicts of Interest
References
- Silva, M.I.; Gonçalves, A.M.L.; Lopes, W.A.; Lima, M.T.V.; Costa, C.T.F.; Paris, M.; Firmino, P.R.A.; De Paula Filho, F.J. Assessment of Groundwater Quality in a Brazilian Semiarid Basin Using an Integration of GIS, Water Quality Index, and Multivariate Statistical Techniques. J. Hydrol. 2021, 598, 126346. [Google Scholar] [CrossRef]
- Bozdağ, A. Assessment of the Hydrogeochemical Characteristics of Groundwater in Two Aquifer Systems in Çumra Plain, Central Anatolia. Environ. Earth Sci. 2016, 75, 674. [Google Scholar] [CrossRef]
- Benaafi, M.; Al-shaibani, A. Hydrochemical and Isotopic Investigation of the Groundwater from Wajid Aquifer in Wadi Al-Dawasir, Southern Saudi Arabia. Water 2021, 13, 1855. [Google Scholar] [CrossRef]
- Ren, C.; Zhang, Q. Groundwater Chemical Characteristics and Controlling Factors in a Region of Northern China with Intensive Human Activity. Int. J. Environ. Res. Public Health 2020, 17, 9126. [Google Scholar] [CrossRef] [PubMed]
- Jha, M.K.; Shekhar, A.; Jenifer, M.A. Assessing Groundwater Quality for Drinking Water Supply Using Hybrid Fuzzy-GIS-Based Water Quality Index. Water Res. 2020, 179, 115867. [Google Scholar] [CrossRef]
- Saleem, Q.M.; Algamal, Y. Assessment of Physico-Chemical and Biological Properties of Ground Water of Khulais, Province, Kingdom of Saudi Arabia. Int. J. Sci. Res. Methodol. 2016, 5, 504–521. [Google Scholar]
- Su, Y.-H.; Feng, Q.; Zhu, G.-F.; Si, J.-H.; Zhang, Y.-W. Identification and Evolution of Groundwater Chemistry in the Ejin Sub-Basin of the Heihe River, Northwest China. Pedosphere 2007, 17, 331–342. [Google Scholar] [CrossRef]
- Kumar, P.; Mahajan, A.K.; Kumar, A. Groundwater Geochemical Facie: Implications of Rock-Water Interaction at the Chamba City (HP), Northwest Himalaya, India. Environ. Sci. Pollut. Res. 2020, 27, 9012–9026. [Google Scholar] [CrossRef]
- Dehnavi, A.; Sarikhani, R.; Nagaraju, D. Hydro Geochemical and Rock Water Interaction Studies in East of Kurdistan, NW of Iran. Int. J. Environ. Sci. Res. 2011, 1, 16–22. [Google Scholar]
- Subramani, T.; Rajmohan, N.; Elango, L. Groundwater Geochemistry and Identification of Hydrogeochemical Processes in a Hard Rock Region, Southern India. Environ. Monit. Assess. 2010, 162, 123–137. [Google Scholar] [CrossRef]
- Hanshaw, B.B.; Back, W. Major geochemical processes in the evolution of carbonate—Aquifer systems. J. Hydrol. 1979, 43, 287–312. [Google Scholar] [CrossRef]
- Ahmed, M.A. Study of Genesis and Quality of Groundwater in The Northern Part of Upper Egypt Using Chemical and Environmental Isotopes Techniques; Cairo University: Cairo, Egypt, 2002. [Google Scholar]
- Dohare, D.; Deshpande, S.; Kotiya, A. Analysis of Ground Water Quality Parameters: A Review. Res. J. Eng. Sci. ISSN 2014, 2278, 9472. [Google Scholar]
- Kachroud, M.; Trolard, F.; Kefi, M.; Jebari, S.; Bourrié, G. Water Quality Indices: Challenges and Application Limits in the Literature. Water 2019, 11, 361. [Google Scholar] [CrossRef] [Green Version]
- Pourcq, K.D. Elements for a Methodology to Interpret Hydrochemichal Data. 2008. Available online: https://upcommons.upc.edu/handle/2099.1/6434 (accessed on 9 May 2022).
- Herczeg, A.L.; Dogramaci, S.S.; Leaney, F.W.J. Origin of Dissolved Salts in a Large, Semi-Arid Groundwater System: Murray Basin, Australia. Mar. Freshw. Res. 2001, 52, 41–52. [Google Scholar] [CrossRef]
- Glynn, P.D.; Plummer, L.N. Geochemistry and the Understanding of Ground-Water Systems. Hydrogeol. J. 2005, 13, 263–287. [Google Scholar] [CrossRef]
- Chandrasekaran, S.; Sankaran Pillai, G.; Venkatraman, B. Spatial and Heavy Metal Assessment in Beach Sands of East Coast of Tamil Nadu, India. Environ. Nanotechnol. Monit. Manag. 2020, 14, 100324. [Google Scholar] [CrossRef]
- Lu, W.; Sarkar, A.; Hou, M.; Liu, W.; Guo, X.; Zhao, K.; Zhao, M. The Impacts of Urbanization to Improve Agriculture Water Use Efficiency—An Empirical Analysis Based on Spatial Perspective of Panel Data of 30 Provinces of China. Land 2022, 11, 80. [Google Scholar] [CrossRef]
- Joodavi, A.; Aghlmand, R.; Podgorski, J.; Dehbandi, R.; Abbasi, A. Characterization, Geostatistical Modeling, and Health Risk Assessment of Potentially Toxic Elements in Groundwater Resources of Northeastern Iran. J. Hydrol. Reg. Stud. 2021, 37, 100885. [Google Scholar] [CrossRef]
- Zakaria, N.; Anornu, G.; Adomako, D.; Owusu-Nimo, F.; Gibrilla, A. Evolution of Groundwater Hydrogeochemistry and Assessment of Groundwater Quality in the Anayari Catchment. Groundw. Sustain. Dev. 2021, 12, 100489. [Google Scholar] [CrossRef]
- Elmeknassi, M.; El Mandour, A.; Elgettafi, M.; Himi, M.; Tijani, R.; El Khantouri, F.A.; Casas, A. A GIS-Based Approach for Geospatial Modeling of Groundwater Vulnerability and Pollution Risk Mapping in Bou-Areg and Gareb Aquifers, Northeastern Morocco. Environ. Sci. Pollut. Res. 2021, 28, 51612–51631. [Google Scholar] [CrossRef]
- Liaqat, M.U.; Mohamed, M.M.; Chowdhury, R.; Elmahdy, S.I.; Khan, Q.; Ansari, R. Impact of Land Use/Land Cover Changes on Groundwater Resources in Al Ain Region of the United Arab Emirates Using Remote Sensing and GIS Techniques. Groundw. Sustain. Dev. 2021, 14, 100587. [Google Scholar] [CrossRef]
- Mandel, S.; Shiftam, Z.L.; Hamill, L.; Bell, F.G.; Ingraham, N.L.; Caldwell, E.A.; Verhagen, B.T.; Finkelman, R.B.; Orem, W.H.; Plumlee, G.S.; et al. Sustainability of Morocco’s Groundwater Resources in Response to Natural and Anthropogenic Forces. J. Hydrol. 2021, 603, 106795. [Google Scholar] [CrossRef]
- Khan, A.; Khan, H.H.; Umar, R.; Khan, M.H. An Integrated Approach for Aquifer Vulnerability Mapping Using GIS and Rough Sets: Study from an Alluvial Aquifer in North India. Hydrogeol. J. 2014, 22, 1561–1572. [Google Scholar] [CrossRef]
- Gibbs, R.J.; Feth, J.H. Mechanisms Controlling World Water Chemistry: Evaporation-Crystallization Process. Am. Assoc. Adv. Sci. Stable 1971, 172, 870–872. [Google Scholar] [CrossRef]
- AdDawadmi_Gover. Available online: https://ar.wikipedia.org/wiki/محافظة_الدوادمي (accessed on 12 March 2022).
- SSYB. Annual Yearbook|General Authority for Statistics. 2010. Available online: https://www.stats.gov.sa/en/46 (accessed on 9 May 2022).
- Al-Zaidi, A.A.; Elhag, E.A.; Al-Otaibi, S.H.; Baig, M.B. Negative Effects of Pesticides on the Environment and the Farmers Awareness in Saudi Arabia: A Case Study. J. Anim. Plant Sci. 2011, 21, 605–611. [Google Scholar]
- El-Didy, S. Evaluation of The Proposed Drainage Network for Lowering the Groundwater Levels in Al-Dawadmi Town. J. King Abdulaziz Univ. Environ. Arid L. Agric. Sci. 1997, 8, 111–123. [Google Scholar] [CrossRef]
- Johnson, P.R. Explanatory Notes To the Map of Proterozoic Geology of Western Saudi Arabia; 2006. Available online: https://instruct.uwo.ca/earth-sci/fieldlog/pan_african/Nubian/saudi/Explanatory%20notes%20for%20the%20shield%20SGS-TR-2006-4.pdf (accessed on 9 May 2022).
- Al Shanti, M.S. The Geology and Mineralization of the AdDawadmi District of Saudi Arabia. Ph.D. Thesis, Imperial College London, London, UK, 1973. [Google Scholar]
- Timeanddate Climate and Weather Averages in Ad Dawadmi, Saudi Arabia. Available online: https://www.timeanddate.com/weather/saudi-arabia/dawadmi/climate (accessed on 12 March 2022).
- Quevauviller, P.; Thompson, K.C. Analytical Methods for Drinking Water; John Wiley & Sons: New York, NY, USA, 2005; ISBN 9780470094938. [Google Scholar]
- DPIR. Methodology for the Sampling of Surface Water. North. Territ. Gov. 1998, 11, 1–11. [Google Scholar]
- USGS. National Field Manual for the Collection of Water-Quality Data. U.S. Geological Survey Techniques of Water-Resources Investigations, Book 9; USGS: Preston, VA, USA, 2015. [Google Scholar]
- APHA. Standard Methods: For the Examination of Water and Waste Water, 23rd ed.; Baird, R., Eaton, A., Rice, E., Eds.; American Public Health Association: Washington, DC, USA, 2017. [Google Scholar]
- Hussein, R.A. Study on Some Sources of Nitrate Pollution in Water Using Nitrogen-15 Isotope Technique; Ain Shams University: Cairo, Egypt, 2005. [Google Scholar]
- Middleton, K.R. A New Procedure for Rapid Determination of Nitrate and a Study of the Preparation of the Phenol-Sulphonic Acid Reagent. J. Appl. Chem. 1958, 8, 505–509. [Google Scholar] [CrossRef]
- Ahmed, M.A.; Aly, A.I.; Gomaa, H.E.; Bastaweesy, A.M. Modified Low-Priced Ammonia Diffusion Method for the Analysis of Nitrogen Isotopic Composition of Ammonium and Nitrate in Different Water Matrices. Egypt. J. Radiat. Sci. Appl. 2008, 21, 257–281. [Google Scholar]
- Paul Bourke Interpolation Methods. Available online: http://paulbourke.net/miscellaneous/interpolation/ (accessed on 14 March 2022).
- Will Kenton Interpolation Definition. Available online: https://www.investopedia.com/terms/i/interpolation.asp (accessed on 14 March 2022).
- Ahmad, A.Y.; Al-Ghouti, M.A.; Khraisheh, M.; Zouari, N. Hydrogeochemical Characterization and Quality Evaluation of Groundwater Suitability for Domestic and Agricultural Uses in the State of Qatar. Groundw. Sustain. Dev. 2020, 11, 100467. [Google Scholar] [CrossRef]
- Komisarek, J. Groundwater Chemistry and Hydrogeochemical Processes in a soil catena of the poznań lakeland. J. Elem. 2017, 22, 681–695. [Google Scholar] [CrossRef]
- Mallick, J.; Singh, C.K.; Al Mesfer, M.K.; Kumar, A.; Khan, R.A.; Islam, S.; Rahman, A. Hydro-Geochemical Assessment of Groundwater Quality in Aseer Region, Saudi Arabia. Water 2018, 10, 1847. [Google Scholar] [CrossRef] [Green Version]
- Arslan, A.; Dutt, G.R. Solubility of Gypsum and Its Prediction in Aqueous Solutions of Mixed Electrolytes. Soil Sci. 1993, 155, 37–47. [Google Scholar] [CrossRef]
- Azaza, H.; Mechi, L.; Doggaz, A.; Optasanu, V.; Tlili, M.; Amor, M. Ben Calcite and Barite Precipitation in CaCO3-BaSO4-NaCl and BaSO4-NaCl-CaCl2 Aqueous Systems: Kinetic and Microstructural Study. Arab. J. Geosci. 2017, 10, 1–9. [Google Scholar] [CrossRef]
- Azimi, G.; Papangelakis, V.G. Chemical Modelling of Calcium Sulphate Phase Equilibria in Multicomponent Electrolyte Solutions. AIChE Annu. Meet. Conf. Proc. 2008, 4, 1–12. [Google Scholar]
- Van Driessche, A.E.S.; Stawski, T.M.; Benning, L.G.; Kellermeier, M. Calcium Sulfate Precipitation Throughout Its Phase Diagram. New Perspect. Miner. Nucleation Growth 2017, 227–256. [Google Scholar] [CrossRef]
- Al Suhaimi, A.O.; Al Mohaimidi, K.M.; Momani, K.A. Preliminary Assessment for Physicochemical Quality Parameters of Groundwater in Oqdus Area, Saudi Arabia. J. Saudi Soc. Agric. Sci. 2019, 18, 22–31. [Google Scholar] [CrossRef]
- Hwang, J.Y.; Park, S.; Kim, H.-K.; Kim, M.-S.; Jo, H.-J.; Kim, J.-I.; Lee, G.-M.; Shin, I.-K.; Kim, T.-S. Hydrochemistry for the Assessment of Groundwater Quality in Korea. J. Agric. Chem. Environ. 2017, 6, 1–29. [Google Scholar] [CrossRef] [Green Version]
- Rezaei, A.; Hassani, H. Hydrogeochemistry Study and Groundwater Quality Assessment in the North of Isfahan, Iran. Environ. Geochem. Health 2018, 40, 583–608. [Google Scholar] [CrossRef]
- Elnazer, A.A.; Seleem, E.M.M.; Zeid, S.A.M.; Ismail, I.S.A.; Bahlol, H.A.; Salman, S.A. Hydrochemical Evaluation of the Quaternary Aquifer and Its Suitability for Different Purposes at South Al Waqf City, Qena, Upper Egypt. Groundw. Sustain. Dev. 2021, 12, 100517. [Google Scholar] [CrossRef]
- Sutadian, A.D.; Muttil, N.; Yilmaz, A.G.; Perera, B.J.C. Development of River Water Quality Indices—A Review. Environ. Monit. Assess. 2016, 188, 58. [Google Scholar] [CrossRef] [PubMed] [Green Version]
- Gurunadha Rao, V.V.S.; Tamma Rao, G.; Surinaidu, L.; Mahesh, J.; Mallikharjuna Rao, S.T.; Mangaraja Rao, B. Assessment of Geochemical Processes Occurring in Groundwaters in the Coastal Alluvial Aquifer. Environ. Monit. Assess. 2013, 185, 8259–8272. [Google Scholar] [CrossRef] [PubMed]
- Minitab Support System The Anderson-Darling Statistic—Minitab. Available online: https://support.minitab.com/en-us/minitab/18/help-and-how-to/statistics/basic-statistics/supporting-topics/normality/the-anderson-darling-statistic/ (accessed on 17 March 2022).
- Anderson-Darling Normality Test. Available online: https://variation.com/wp-content/distribution_analyzer_help/hs140.htm (accessed on 15 March 2022).
- Anderson-Darling Test for Normality|BPI Consulting. Available online: https://www.spcforexcel.com/knowledge/basic-statistics/anderson-darling-test-for-normality (accessed on 15 March 2022).
- Moore, J.M.; Shanti, A.M.A.L. The Use of Stress Trajectory Analysis in the Elucidation of Part of the Najd Fault System, Saudi Arabia. Proc. Geol. Assoc. 1973, 84, 383–403. [Google Scholar] [CrossRef]
- Michelsen, N.; Reshid, M.; Siebert, C.; Schulz, S.; Knöller, K.; Weise, S.M.; Rausch, R.; Al-Saud, M.; Schüth, C. Isotopic and Chemical Composition of Precipitation in Riyadh, Saudi Arabia. Chem. Geol. 2015, 413, 51–62. [Google Scholar] [CrossRef]
- Marandi, A.; Shand, P. Groundwater Chemistry and the Gibbs Diagram. Appl. Geochem. 2018, 97, 209–212. [Google Scholar] [CrossRef]
- Lakshmanan, E.; Kannan, R.; Senthil Kumar, M. Major Ion Chemistry and Identification of Hydrogeochemical Processes of Ground Water in a Part of Kancheepuram District, Tamil Nadu, India. Environ. Geosci. 2003, 10, 157–166. [Google Scholar] [CrossRef]
- Masoud, A.A.; Aldosari, A.A. Groundwater Quality Assessment of a Multi-Layered Aquifer in a Desert Environment: A Case Study in Wadi Ad-Dawasir, Saudi Arabia. Water 2020, 12, 3020. [Google Scholar] [CrossRef]
- Subba Rao, N.; Marghade, D.; Dinakar, A.; Chandana, I.; Sunitha, B.; Ravindra, B.; Balaji, T. Geochemical Characteristics and Controlling Factors of Chemical Composition of Groundwater in a Part of Guntur District, Andhra Pradesh, India. Environ. Earth Sci. 2017, 76, 747. [Google Scholar] [CrossRef]


| Variable | Mean | SE Mean | StDev | Minimum | Q1 | Median | Q3 | Maximum | Range | IQR | Anderson–Darling Normality Test | |
|---|---|---|---|---|---|---|---|---|---|---|---|---|
| p-Value | Decision | |||||||||||
| Temp. (°C) | 27.321 | 0.316 | 2.168 | 21.5 | 25 | 27.5 | 29 | 31.8 | 10.3 | 4 | 0.011 | fail |
| pH | 7.3372 | 0.0504 | 0.3454 | 6.8 | 7.1 | 7.33 | 7.54 | 8.35 | 1.55 | 0.44 | 0.321 | pass |
| EC, microS/cm | 5227 | 546 | 3745 | 255 | 2939 | 4280 | 7050 | 17990 | 17735 | 4111 | <0.005 | fail |
| TDS (ppm) | 3293 | 344 | 2359 | 161 | 1852 | 2696 | 4442 | 11334 | 11173 | 2590 | <0.005 | fail |
| Na (epm) | 28.77 | 3.68 | 25.22 | 0.47 | 11.3 | 21.91 | 34.83 | 103.48 | 103.01 | 23.53 | <0.005 | fail |
| K (epm) | 0.1694 | 0.0145 | 0.0991 | 0.04 | 0.1 | 0.15 | 0.22 | 0.5 | 0.46 | 0.12 | <0.005 | fail |
| Ca (epm) | 25.9 | 2.74 | 18.81 | 2.09 | 11.47 | 21.69 | 34.93 | 83.41 | 81.32 | 23.46 | <0.005 | fail |
| Mg (epm) | 7 | 1.26 | 8.62 | 0.04 | 1.89 | 5.04 | 10.5 | 55.65 | 55.61 | 8.61 | <0.005 | fail |
| NH4 (epm) | 0.0006 | 0.0004 | 0.002 | 0 | 0 | 0 | 0 | 0.01 | 0.01 | 0 | <0.005 | fail |
| TC (epm) | 61.84 | 6.58 | 45.09 | 3.02 | 29.42 | 51.71 | 91.74 | 208.39 | 205.37 | 62.32 | <0.005 | fail |
| HCO3 (epm) | 5.162 | 0.246 | 1.685 | 2.11 | 3.97 | 4.96 | 6.14 | 8.79 | 6.68 | 2.17 | 0.474 | pass |
| Cl (epm) | 29.25 | 4.22 | 28.94 | 0.54 | 9.67 | 18.6 | 42.77 | 142.92 | 142.38 | 33.1 | <0.005 | fail |
| SO4 (epm) | 27.14 | 2.52 | 17.29 | 0.26 | 13.43 | 24.22 | 41.25 | 69.21 | 68.95 | 27.82 | 0.072 | pass |
| NO3 (epm) | 1.172 | 0.159 | 1.092 | 0 | 0.47 | 0.83 | 1.88 | 4.34 | 4.34 | 1.41 | <0.005 | fail |
| TA (epm) | 62.72 | 6.3 | 43.21 | 3.49 | 33.06 | 52.82 | 84.03 | 196.01 | 192.52 | 50.97 | <0.005 | fail |
| Alt. (m AMSL) | 976.23 | 4.17 | 28.6 | 911 | 947 | 985 | 996 | 1034 | 123 | 49 | 0.007 | fail |
| Well Depth (m BGL) | 38.43 | 1.21 | 8.28 | 25 | 30 | 40 | 45 | 52 | 27 | 15 | <0.005 | fail |
| Water table (m BGL) | 23.979 | 0.77 | 5.277 | 12 | 20 | 25 | 26 | 40 | 28 | 6 | <0.005 | fail |
| Discharge, m3/day | 37.77 | 2.31 | 15.84 | 15 | 30 | 40 | 40 | 80 | 65 | 10 | <0.005 | fail |
Publisher’s Note: MDPI stays neutral with regard to jurisdictional claims in published maps and institutional affiliations. |
© 2022 by the authors. Licensee MDPI, Basel, Switzerland. This article is an open access article distributed under the terms and conditions of the Creative Commons Attribution (CC BY) license (https://creativecommons.org/licenses/by/4.0/).
Share and Cite
Gomaa, H.E.; Alotibi, A.A.; Charni, M.; AlMarri, A.H.; Gomaa, F.A. Conceptual Evaluation of Factors Controlling Groundwater Chemistry in Ad-Dawadmi, Saudi Arabia, Using Visualization and Multiple Lines of Evidence. Water 2022, 14, 1857. https://doi.org/10.3390/w14121857
Gomaa HE, Alotibi AA, Charni M, AlMarri AH, Gomaa FA. Conceptual Evaluation of Factors Controlling Groundwater Chemistry in Ad-Dawadmi, Saudi Arabia, Using Visualization and Multiple Lines of Evidence. Water. 2022; 14(12):1857. https://doi.org/10.3390/w14121857
Chicago/Turabian StyleGomaa, Hassan E., AbdAllah A. Alotibi, Mohamed Charni, Abdulhadi H. AlMarri, and Fatma A. Gomaa. 2022. "Conceptual Evaluation of Factors Controlling Groundwater Chemistry in Ad-Dawadmi, Saudi Arabia, Using Visualization and Multiple Lines of Evidence" Water 14, no. 12: 1857. https://doi.org/10.3390/w14121857
APA StyleGomaa, H. E., Alotibi, A. A., Charni, M., AlMarri, A. H., & Gomaa, F. A. (2022). Conceptual Evaluation of Factors Controlling Groundwater Chemistry in Ad-Dawadmi, Saudi Arabia, Using Visualization and Multiple Lines of Evidence. Water, 14(12), 1857. https://doi.org/10.3390/w14121857