Article

Effects of Light-Emitting Diode Illumination on Sediment Surface Biological Activities and Releases of Nutrients and Metals to Overlying Water in Eutrophic Lake Microcosms

1
College of Life and Environmental Sciences, Wenzhou University, Wenzhou 325035, China
2
National and Local Joint Engineering Research Center of Ecological Treatment Technology for Urban Water Pollution, Wenzhou University, Wenzhou 325035, China
*
Authors to whom correspondence should be addressed.
Water 2022, 14(12), 1839; https://doi.org/10.3390/w14121839
Submission received: 10 May 2022 / Revised: 1 June 2022 / Accepted: 2 June 2022 / Published: 7 June 2022

Abstract

:
The release of nutrients and metals from the sediment to the overlying water induced by oxygen depletion is an important issue in eutrophic aquatic systems. Effects of light-emitting diode (LED) illumination on oxygen conditions and release of nutrients and metals from the sediment were examined by comparing with those effects of aeration in microcosms using water and sediment of Lake Taihu, China. Periphyton with filamentous algae developed on the sediment surface in the LED (blue wavelength) treatment. Dissolved oxygen became rapidly saturated and gradually supersaturated in the aeration and LED treatments, respectively, but remained low in the control. A thicker oxic layer developed on the sediment for the LED than aeration but was poorly developed with a blackened surface in the control. Invertebrate burrows were distributed deeper and the bacterial community was more dominated by aerobic species in the LED, indicating deeper penetration of oxygen into the sediment. Nutrients (e.g., N and P) and some metals (e.g., Hg, As, and Mn) in water were lower for the LED and aeration than in the control; nutrients and other solutes that increased electric conductivity (e.g., Ca, Mg) were lower for the LED than aeration. These results suggest that LED can effectively oxygenate the bottom water by stimulating algal photosynthesis and benthic invertebrate activity, resulting in greater retention of nutrients and metals in/on sediment compared to aeration.

Graphical Abstract

1. Introduction

Eutrophication due to excessive organic and nutrient inputs from urban, industrial, and agricultural areas has deteriorated the biodiversity and ecosystem in aquatic systems worldwide [1,2,3,4]. Owing to the prolonged external inputs and subsequent accumulations, the bottom sediment is a major source of nutrients and other pollutants (e.g., heavy metals) in these ecosystems [5,6]. Various physical (e.g., dredging and aeration), chemical (addition of coagulants, flocculants, and sediment capping by geochemical agents), and biological measures (introduction of macrophytes) have been employed to improve sediment quality and mitigate the release of nutrients from the sediment to overlying water (e.g., reviewed by [7,8]).
Oxygen depletion at the bottom of ponds and lakes due to eutrophication is a key problem in these systems. Release of nutrients and some metals from the sediment into the overlying water increases when the bottom water is depleted of dissolved oxygen (DO) and the redox potential is negative. For example, the inorganic phosphorus (P), which is bound to the metals (e.g., Fe and Mn) accumulated in sediments under oxic conditions, dissociates from the metal-P complexes in the absence of oxygen [5,9]. Inorganic nitrogen (N), especially NH4+, released during the mineralization of organic matter by bacteria, increases as the processes that remove NH4+ (i.e., nitrification and denitrification) are inhibited in the absence of oxygen [10]. Additionally, the reduction of the metal oxides (e.g., Fe-Mn oxy-hydroxides) releases previously bound metals as solutes into the water [11]. Meanwhile, metals such as Cu, Cd, and Zn form stable and insoluble metal-sulfides (metal-S) in the absence of oxygen, while oxidation removes S and releases these metals [12]. Hence, the internal loads of nutrients and some metals can be mitigated by solving oxygen depletion.
Various microorganisms are concentrated within a thin layer at the sediment–water interface and their activities significantly affect nutrient fluxes [13]. Benthic biofilms are complex associations of autotrophic and heterotrophic microbes with extracellular organic matrix on substrates [14]. With adequate light at the bottom, periphytic biofilms can play critical roles in nutrient uptake and saturation of oxygen associated with photosynthetic activities [15,16,17]. Furthermore, the presence of an oxic layer (or oxidized microzone) on the sediment surface influences redox reactions and nutrient fluxes between sediment and water [13,18,19]. Although downward molecular diffusion of oxygen from water into sediment is usually limited, the oxic layer can be extended deeper by photosynthesis of the periphyton [20,21] and feeding activities of burrowing invertebrates [22,23]; however, our knowledge is limited on the effect of the overlying water and sediment conditions on the depth of the oxic layer, activities of benthic organisms, and nutrient fluxes at the sediment–water interfaces.
Increased availability of light at the bottom may effectively improve oxygen and redox conditions at the sediment–water interfaces. Aeration or chemical additions have been widely applied in aquatic systems to increase bottom oxygen [24,25,26]. Benthic periphyton mats or macrophyte stands can provide good amounts of oxygen that supersaturate in waters owing to their photosynthetic activities; however, natural light is usually limited at the bottom of eutrophic ponds and lakes due to steep light attenuation because of highly turbid water or surface cyanobacterial bloom [27,28,29]. Light-emitting diodes (LEDs) are energy-efficient, durable, provide light wavelengths conducive to algal growth, and have attracted attention in biofuel and bioremediation studies in aquatic systems [30,31]. Notably, blue LEDs are more beneficial for the growth of green algae and diatoms than that of cyanobacteria [31] and the physiological status of fish [32,33]; however, few studies have applied LEDs in the remediation of freshwater environments to date [34].
This study was conducted to examine the effects of LED lighting on improving the oxygen condition at the bottom of a eutrophic lake, biological activities at the sediment–water interface, and the release of nutrients and metals from the sediment to the overlying water using a microcosm. The LED with blue wavelength, which was inferred to be suitable for stimulating algal activities [31,34], was used in this study. Water quality was monitored periodically during the experiment and comparisons were drawn between control, aeration treatment, and LED treatment. For biological activity, we analyzed phytoplankton originating from sediments, tunnels of burrowing invertebrates, and bacterial communities in the water and sediment by a high-throughput DNA sequencing.

2. Materials and Methods

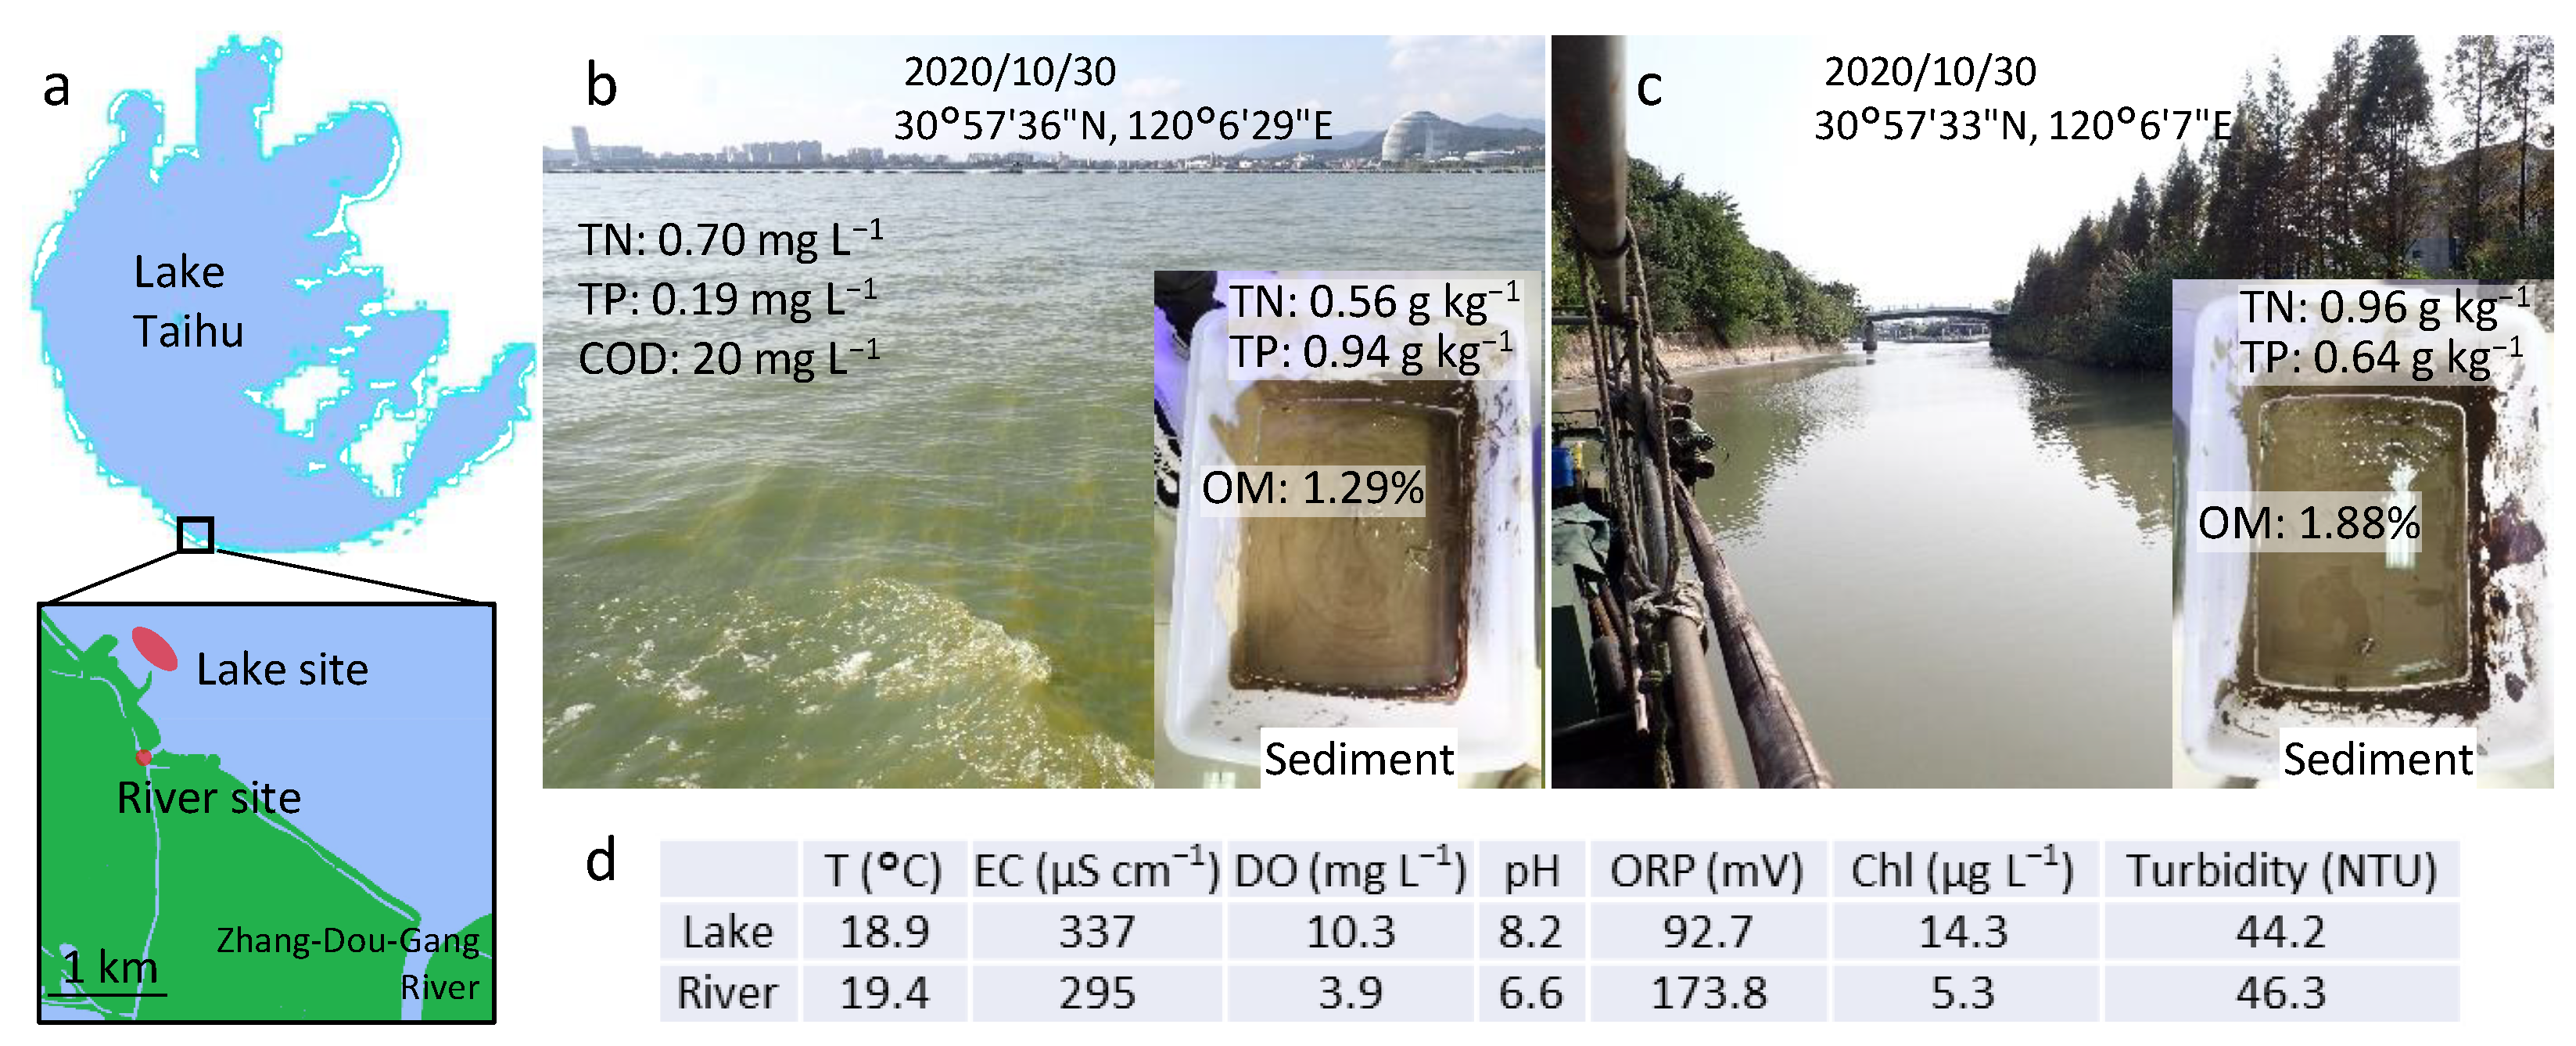
2.1. Material Collection

Lake Taihu was the third-largest shallow freshwater lake in China. It was an important area for recreation, tourism, drinking water, and other freshwater resources. The lake and the inlet rivers have been undergoing eutrophication for more than 40 years due to rapid economic development and urbanization of the catchments. According to our preliminary survey, the bottom water and sediment tended to be short in oxygen in the rivers rather than in the lake, probably because of the greater depth and stagnant nature of water in the former. Water and sediments were sampled in a south part of the lake and a nearby river at the end of October 2020 (Figure 1a), when cyanobacterial bloom occurred sparsely. The sediment was sampled from areas where the depth was about 2 m and 3 m in the lake and river, respectively (Figure 1b,c). DO concentration of water was lower and sediment was darker in the river than the lake (Figure 1b–d). An Ekman–Birge grab sampler was used to collect sediment. In this study, to clarify the responses of different sediments to treatments, water collected at the lake site was used in all microcosms.

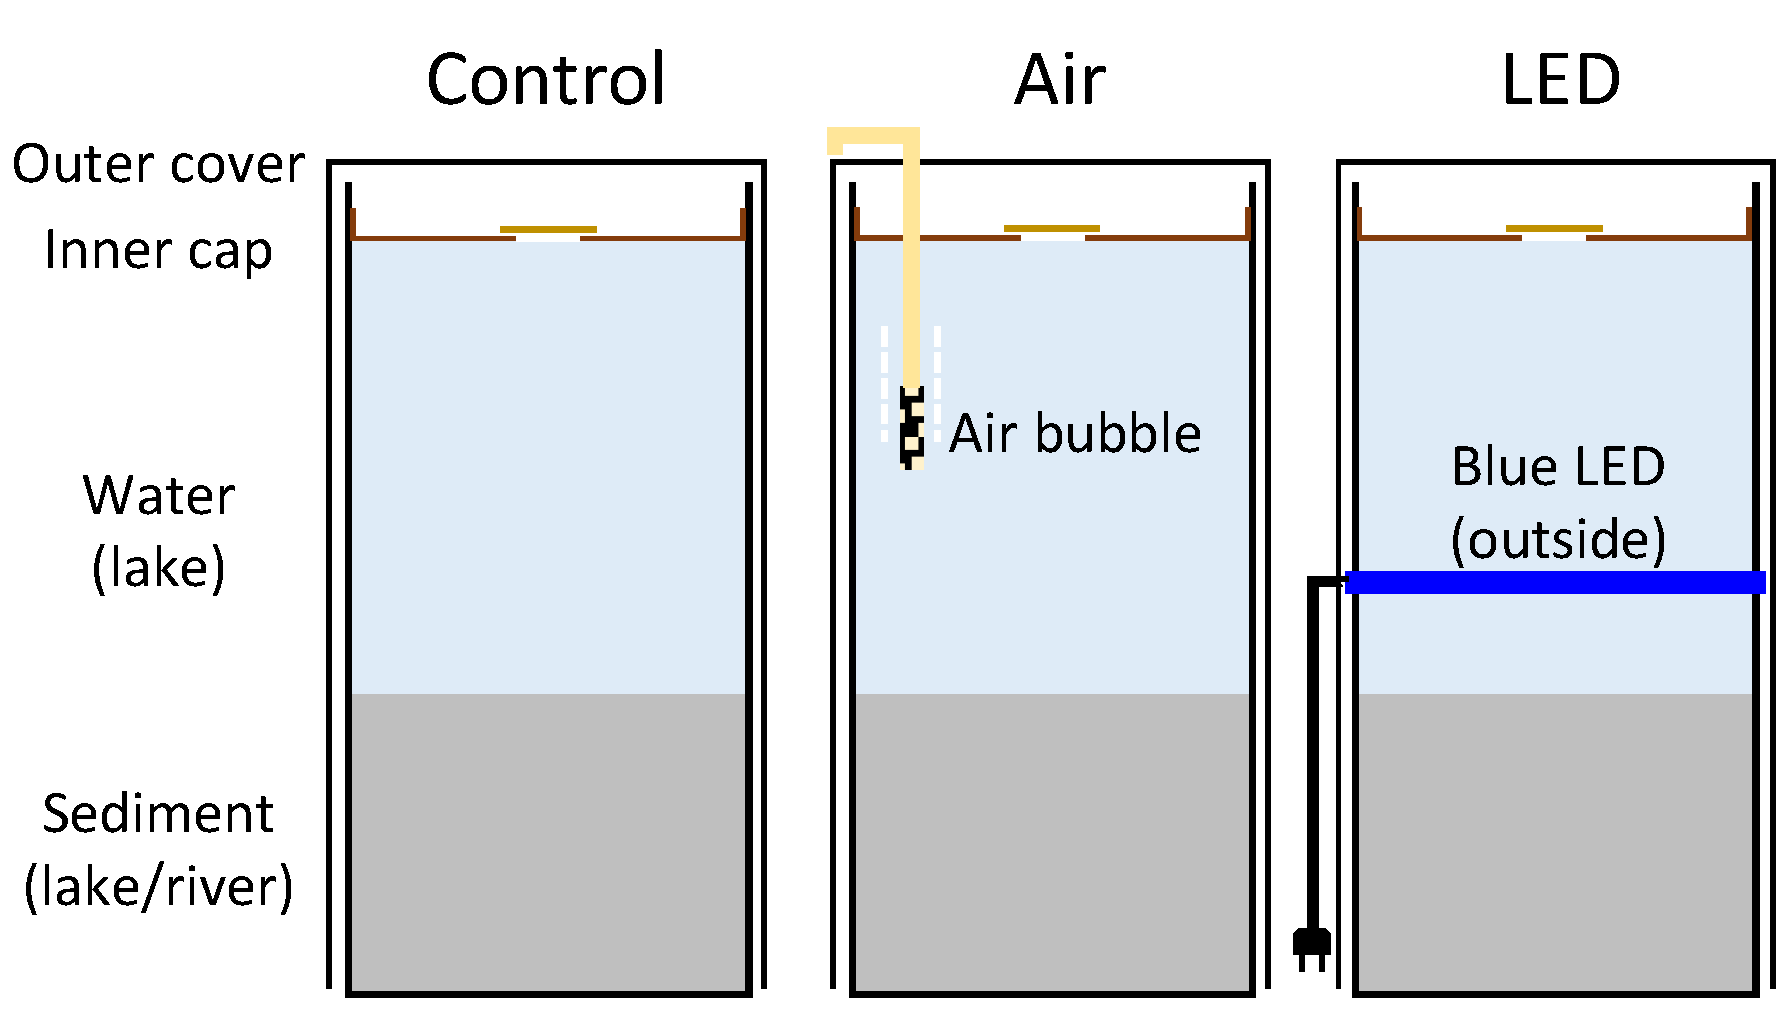
2.2. Microcosm Experimental Design

The microcosm experiment was conducted at Wenzhou University (Zhejiang, China) one week after the sampling in Lake Taihu. Glass beakers (3000 mL, diameter: 135 mm, height: 280 mm) were filled with 1000 mL of homogenized sediment (about 8 cm deep) from the lake or river and 2000 mL water from the lake with a plastic cap on the water surface. Control and two treatments (aeration, LED) were set up in triplicate for each lake and river sediment (Figure 2), resulting in a total of 18 microcosms. For the aeration treatment, air bubbles were supplied by a pump with an aeration rate of 40 L min−1 (ACO-002; RESUN, Shenzhen, China) via a rubber tube and airstone inserted near the water surface to minimize its sediment disturbance. For the LED treatment, a flexible 10 mm wide LED strip with an LED unit spacing of 17 mm (220 V, ACLED, New Taipei City, China) was attached around the beaker 5 cm above the sediment surface. The LED light source had a blue wavelength (460–500 nm) and light intensity of 120 μmol m−2 s−1. The experiment was conducted in an incubator at 25 °C. The LED light was operated with a 12:12 h light/dark cycle, while the control and aeration treatment were kept in the dark. To minimize LED light on the other microcosms, all microcosms were covered by a black polyethylene bag.

2.3. Measurements

The experiment was started one day after setting up the microcosm and continued for 28 days. Water quality variables (DO, pH, electrical conductivity: EC, oxidation-reduction potential: ORP, and turbidity) were measured for each microcosm on days 0 (4–6 h after start), 4, 7, 14, 21, and 28 using portable water quality meters (HQ40D and 2100Q; Hach, Loveland, OH, USA) by inserting sensors from a small window at the center of the cap (Figure 2). A 100 mL water sample was taken from each microcosm on days 0, 7, 14, 21, and 28 for chlorophyll and nutrient concentration analyses. Additionally, 100–300 mL water samples were taken at the beginning and end of the experiment. Samples from the triplicate microcosms were pooled into one. These samples were used to analyze metals (beginning, end), phytoplankton, and bacterial community (end).
The sediment was partially sampled before the experiment as the initial condition for analyses of sediment quality and bacterial community. The sediment was also sampled at the end of the experiment after gently removing as much water as possible. Half of the sediment was sampled by dividing it into the light-colored surface oxic layer and the dark-colored bottom layer. The other half of the sediment was sampled after homogenizing the surface and bottom layers. For each type of sediment, samples from the triplicate microcosms were pooled into one. These samples were used to analyze sediment quality (beginning, end) and bacterial community (end).
At the end of the experiment, the color and texture of the sediment surface were variable among microcosms. Photographs of each microcosm were captured from four sides and top view with a ruler prior to the sampling. The thickness (mm) of the top oxic layer was determined from the side-view images using ImageJ 1.52a [35].
Burrowing tunnels or galleries of benthic invertebrates were visible on the walls of microcosms. Several invertebrate taxa, including polychaete (lake sediment) and oligochaete (river sediment) worms, were recognized in the sediment during the experiment. The number of tunnels was determined from three vertical positions (near surface, middle, and near bottom) on the four sides of each microcosm. At each position, the number of tunnels that crossed a 2-cm vertical or horizontal line were counted and averaged among six (three vertical and three horizontal) lines.
Chlorophyll-a (Chl-a) concentration of water samples was determined using the Phyto-PAM chlorophyll fluorometer (Walz, Effeltrich, Germany). Total nitrogen (TN), total phosphorus (TP), ammonia (NH3-N), nitrite (NO2-N), nitrate (NO3-N), phosphate (PO43−-P), and silicate (SiO44−) were determined (Table S1) using a Skalar autoanalyzer (San++ continuous flow analyzer, Skalar Analytical B.V., Breda, The Netherlands). The proportion of TN and TP apart from these inorganic-N and -P was treated as organic-N and -P, respectively. Concentrations of 15 metals (Cr, Ni, Cu, Zn, Fe, Hg, As, Se, Bi, Sb, Ca, Mg, Cd, Pb, Mn) were quantified in the water samples by an inductively coupled plasma mass spectrometer (NexION® 2000, PerkinElmer, Inc., Waltham, MA, USA) after digestion using a concentrated HNO3 mixture following a national standard method (GB/T 5750.6-2006). Organic content, TN, and TP in the sediment samples were quantified by ultraviolet spectrophotometry after alkaline potassium persulfate digestion following national standard methods of alkali fusion Mo-Sb Anti spectrophotometer (GB 9834-88, CJ/T221-2005, HJ 632-2011). The analyses of sediment samples were all performed by Zhejiang Ouhuan Test Technology Co., Ltd. (Wenzhou, China).
For phytoplankton analysis, water samples were fixed by adding formaldehyde (2%). The samples were then centrifuged at 3000 rpm for 30 min, and 10- to 15-fold concentrated solutes were extracted. Identification and cell counting were performed using a 0.1 mL gridded slide glass under a microscope (phase contrast) at ×100 to ×600 magnification.
The composition of the bacterial community in water and sediment samples was determined by high-throughput paired-end sequencing of the V3–V4 regions in 16S rRNA genes using the universal primers 338F (5′-ACTCCTACGGGAGGCAGCA-3′) and 806R (5′-GGACTACHVGGGTWTCTAAT-3′). Bacterial DNA extraction, purification, PCR amplification, library constructions, and DNA sequencing were conducted by Illumina HiSeq 2500 (Illumina Trading Co., Ltd., Beijing, China) to obtain high-quality reads (sequence) using open-source software Trimmomatic v0.33 (USADELLAB.org), FLASH v1.2.7 (Center for Computational Biology), and UCHIME v4.2 (drive5). Operational taxonomic unit (OTU) and phylogenic analyses were performed using USEARCH (drive5) and QIIME (QIIME development team) with a reference database SILVA (The SILVA ribosomal RNA database project). All these procedures were performed by Biomarker Technologies Corporation (Beijing, China).

2.4. Data Treatments and Analyses

Effects of the treatments on water quality at the end of the experiment were tested by analysis of variance (ANOVA). Two-way ANOVA with treatment (control, aeration, LED) and sediment source (lake, river) as fixed factors were conducted for each water quality variable (n = 3 for each treatment × sediment combination) (DO, pH, EC, ORP, Chl-a, TN, TP, NH3-N, NO2-N, NO3-N, PO43−-P, and SiO44−) and for the depth of the oxic layer. Invertebrate tunnel abundance in the sediment was examined by three-way ANOVA with treatment, sediment source, and vertical depth of sediment (surface, middle, bottom) as fixed factors. If the effect of treatment was significant, then Tukey’s multiple comparison test was performed to determine the difference between the two treatments. An α value of 0.05 was used to determine the significance of effects using R software (version 4.0.3; R Development Core Team, Vienna, Austria) with the “multcomp” package.

3. Results

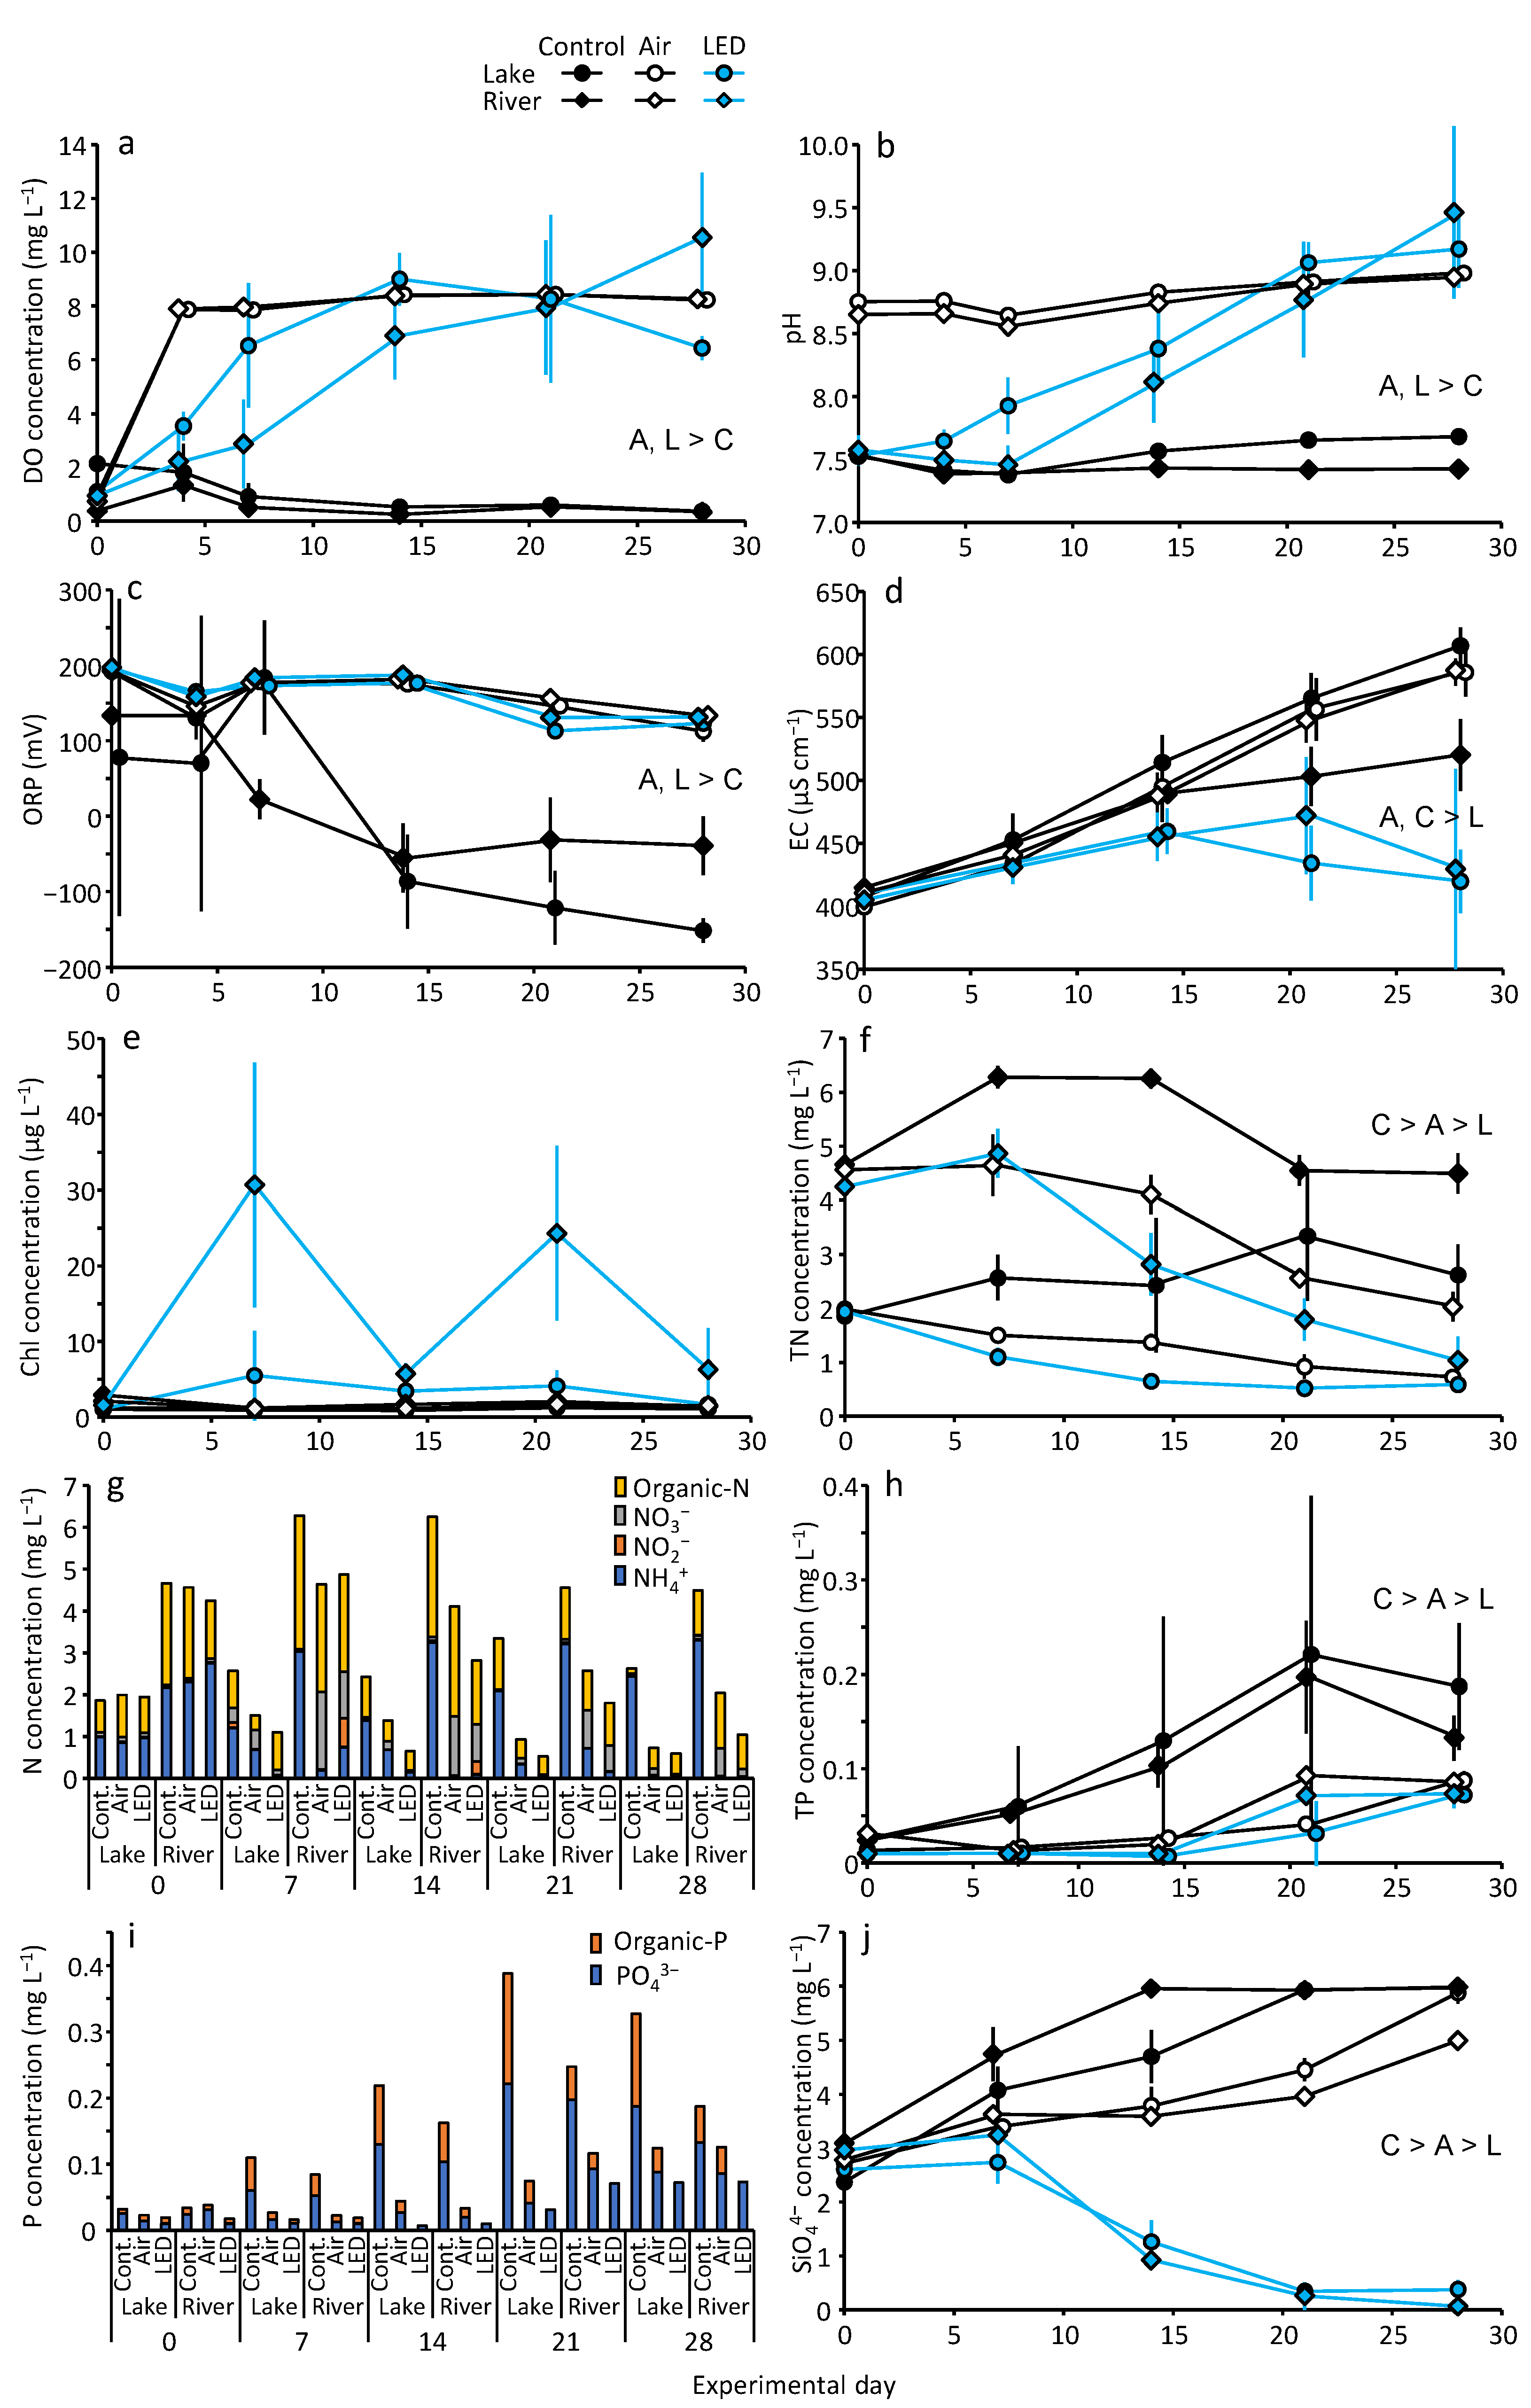
3.1. DO and Water Quality Variables

DO was 0.4–2.1 mg L−1 at the beginning of the experiment (day 0, Figure 3a). It sharply increased in the aeration treatment with lake and river sediments to about 8 mg L−1 (the saturation level under 25 °C) by day 4, and was stable afterward. The DO in the LED treatment increased gradually, with the lake sediment showing an earlier rise than the river sediment and supersaturated (up to 9.0 mg L−1 for lake and 10.5 mg L−1 for river) with large variations among the triplicate in the latter half period. In contrast, it decreased to 0.2–0.9 mg L−1 after day 14 in the control for both sediments. At the end of the experiment (day 28), DO was significantly lower for the control than for aeration and LED, with no significant difference between the latter two (Figure 3a).
The aeration treatment had a pH of 8.5–9.0 throughout the experiment from day 0 (4–6 h after the start of aeration), while the control and LED treatment had a pH of 7.5–7.6 on day 0 (Figure 3b). The pH of the LED gradually increased, which was earlier in the lake than in river sediment, and exceeded that of the aeration at the end, while that in the control did not show clear changes. At the end of the experiment, the effect of treatment on pH was significant, and pH was significantly lower for the control than for aeration and LED, with no significant difference between the latter two (Figure 3b).
ORP in the aeration and LED treatments slightly decreased from 192–198 mV at the beginning to 113–134 mV at the end (Figure 3c). ORP was low in the control (78–134 mV) at the beginning with a high variance among the triplicate for lake sediment, and decreased to less than 0 after day 14, indicating a reducing condition. At the end of the experiment, the effect of treatment on ORP was significant, and ORP was significantly lower for the control than for aeration and LED, with no significant difference between the latter two (Figure 3c).
EC increased from 400–415 μS cm−1 at the beginning to 484–514 μS cm−1 on day 14 in the control and aeration (Figure 3d), and continued increasing except the control with river sediment. EC in the LED slightly decreased to 420–430 μS cm−1 in the latter period with a large variation among the triplicate. At the end of the experiment, the effect of treatment on EC was significant, and EC was significantly higher for the control and aeration than LED, with no significant difference between the former two (Figure 3d).
Chl-a concentration increased only in the LED treatment and was always higher for river than for the lake sediment but varied irregularly among the triplicate (Figure 3e). The effect of treatment on Chl-a was not significant at the end of the experiment, though it was significant on days 7, 14, and 21.

3.2. Nutrient Concentrations in Water

TN concentration at the beginning of the experiment was higher for the river (4.2–4.7 mg L−1) than for the lake (1.8–2.0 mg L−1) sediment (Figure 3f), indicating that more TN dissolved into the water from the river sediment than from the lake sediment. TN decreased from day 0 or 4 in the aeration and LED treatments with a steeper decrease in the LED for both sediment sources. TN of the LED was almost half of that of the aeration on day 14 (lake) and day 28 (river). In contrast, the TN in the control increased in the early half of the experiment (river) or gradually throughout it (lake). At the end of the experiment, the effect of treatment on TN was significant, and it was significantly higher for the control than for aeration and LED and higher for the aeration than LED (Figure 3f).
TN was dominated by NH3-N followed by organic-N at the beginning (Figure 3g). The proportion of NH3-N increased in the control during the experiment, while NO3-N dominated in the latter period in the aeration and LED. The effect of treatment on NH3-N concentration was significant at the end of the experiment (ANOVA, df = 2, F-value = 389, p < 0.001), being significantly higher for the control than aeration and LED. Effect of treatment on NO2-N concentration was marginally significant (df = 2, F-value = 3.43, p = 0.066). Effect of treatment on NO3-N concentration was significant (ANOVA, df = 2, F-value = 25, p < 0.001), being significantly higher for the aeration than control and LED.
TP concentrations at the beginning were similar between the sediment sources (lake: 0.01–0.02 mg L−1, river: 0.01–0.03 mg L−1) across the treatments (Figure 3h). TP in the control increased almost ten-fold by day 21 (0.20–0.22 mg L−1) with a large variation among the triplicate for the lake sediment. In contrast, it changed little by day 14 in the aeration and LED, after which it increased to 0.07–0.09 mg L−1. A difference in TP between the aeration and LED was evident after day 14. At the end of the experiment, the effect of treatment on TP was significant, and it was significantly higher for the control than aeration and LED, and for the aeration than LED (Figure 3h). TP was dominated by PO43−-P at the beginning and organic-P increased in the latter half of the experiment, especially in the control, followed by the aeration (Figure 3i). At the end of the experiment, the effect of treatment on PO43−-P was significant (ANOVA, df = 2, F-value = 25, p < 0.001), being significantly higher for the control than for the aeration and LED and for the aeration than LED.
SiO44− concentration at the beginning of the experiment was slightly higher for the river (2.8–3.1 mg L−1) than for the lake (2.4–2.7 mg L−1) sediment (Figure 3j). SiO44− increased in the early and latter half in the control and aeration treatment, respectively. In contrast, SiO44− in the LED treatment decreased after day 7 to 0.06 mg L−1 (lake) and 0.37 mg L−1 (river) by the end of the experiment. SiO44− was also lower for the river than lake sediment after day 14 in the aeration and LED. At the end of the experiment, the effect of treatment on SiO44− was significant, and it was significantly higher for the control than aeration and LED, and for the aeration than LED (Figure 3j).

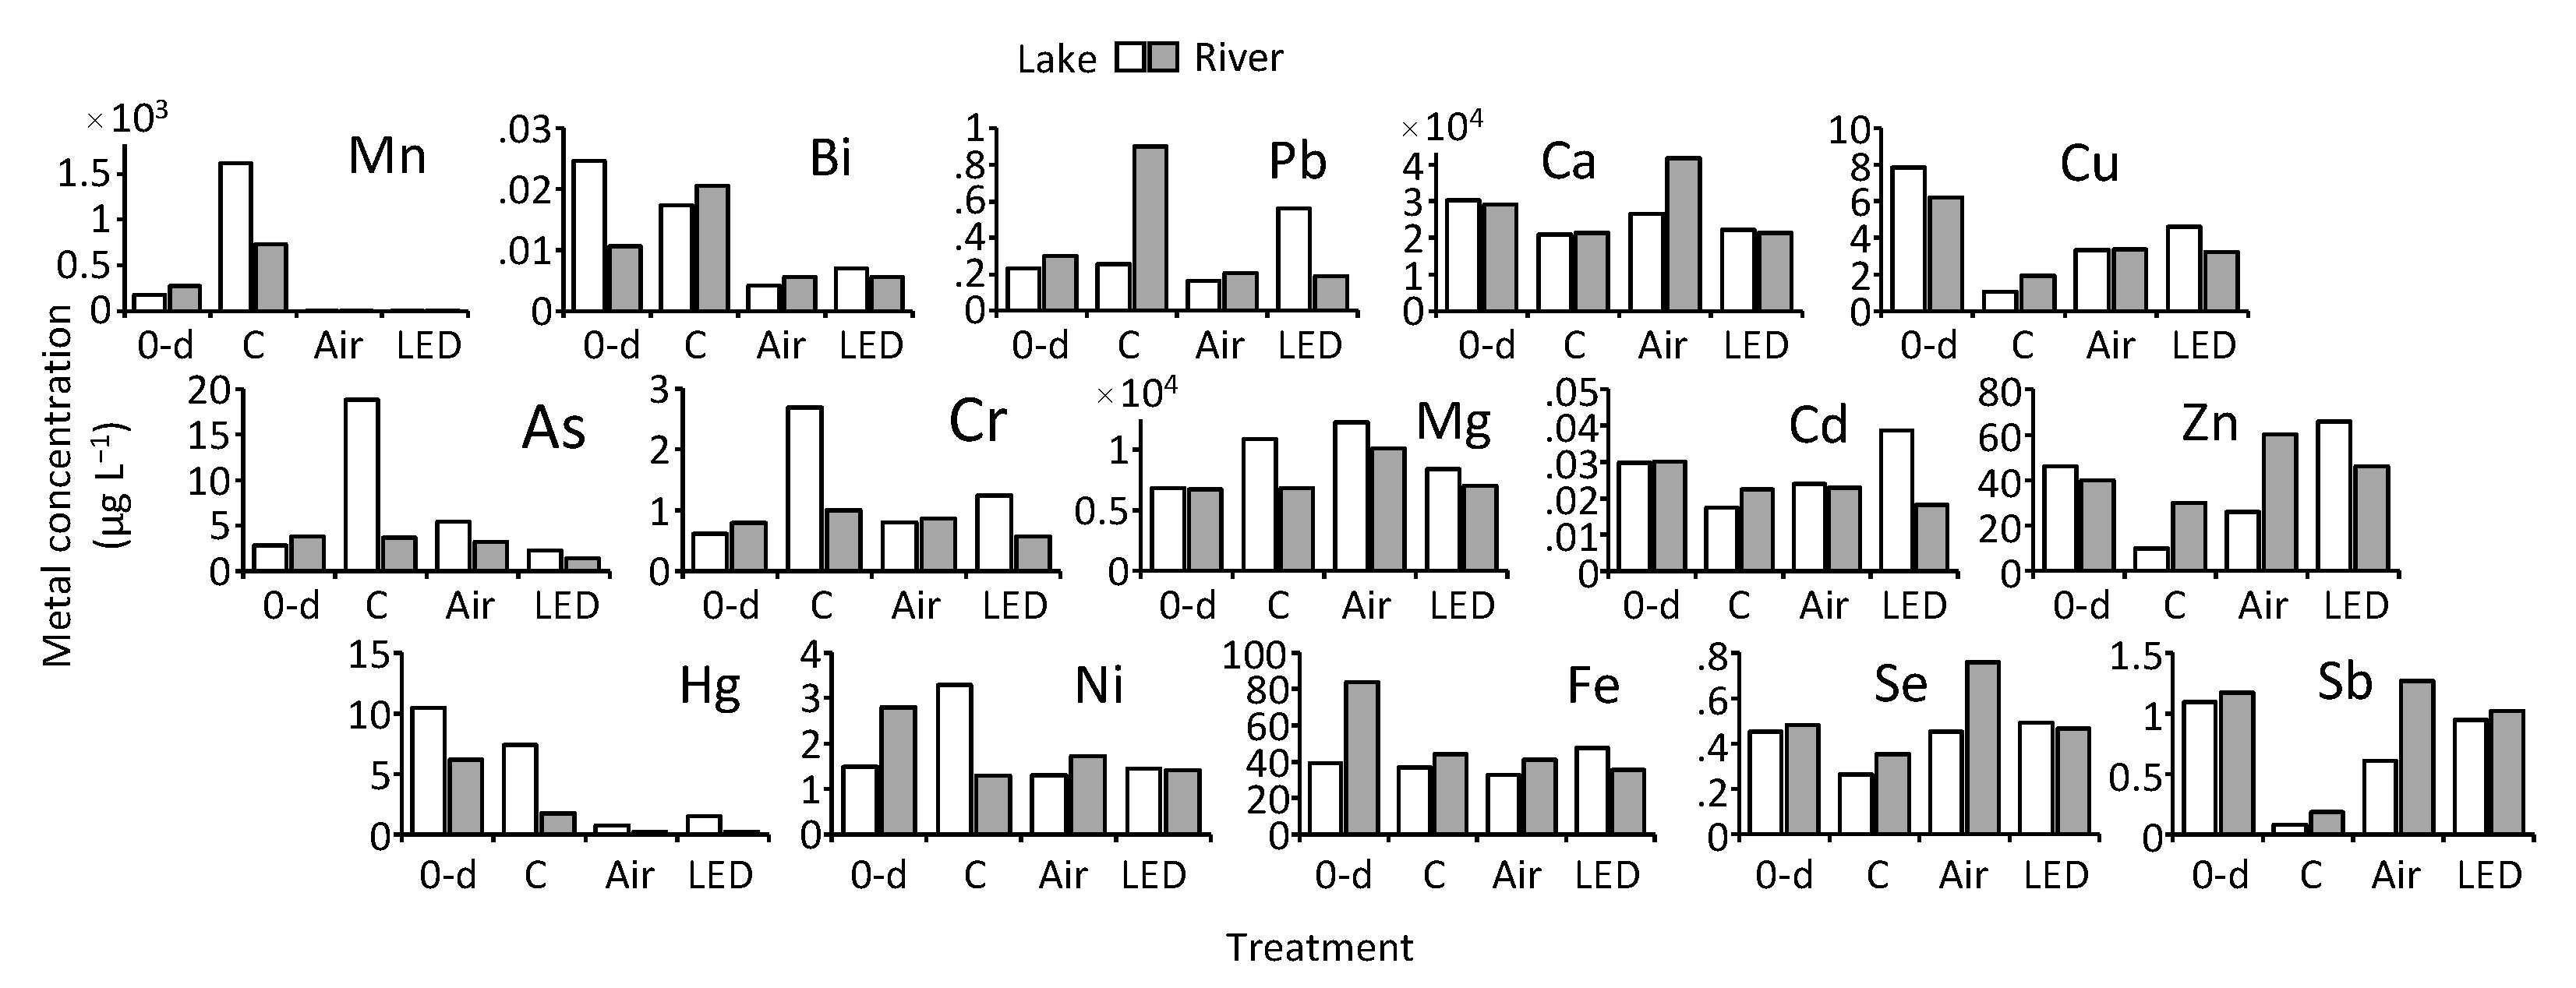
3.3. Metal Concentrations in Water

Concentration in water varied by 6–7 orders of magnitude among metals from 0.01 μg L−1 (Bi) to 10,000 μg L−1 (Ca, Mg) (metals are shown in the decreasing order of the control to LED ratio from left to right, Figure 4). Ca and Mg were the most abundant metals, followed by Mn, and Zn and Fe showed the third-highest concentrations. (Figure 4). Mn, As, Hg, Bi, and Cr concentrations in the control were higher than those in the aeration and LED and those at the beginning (except Hg) for both sediment sources (Figure 4), suggesting that these metals were released from the sediment in the control during the experiment. Mn concentration was 400–3000-fold higher in the control than the others. In contrast, Se, Cu, Zn, and Sb concentrations were higher for the aeration and LED than for the control (Figure 4). Ca and Mg concentrations were higher in the aeration than in the control and LED, with 1.1–2.0-fold differences.

3.4. Phytoplankton Occurrence in Water

Phytoplankton in water was not observed in the control and aeration treatment at the end of the experiment. In the LED treatment, 11 and 8 phytoplankton taxa occurred for the lake and river sediments, respectively (Table A1). Cyanobacterium Chroococcus was dominant for the lake sediment, while green alga Eudrina was dominant for the river sediment. Owing to its volume being 100 times more than Eudrina, Chroococcus dominated both the lake and river sediments in terms of volume. Filamentous cyanobacteria Arthrospira and Pseudanabena occurred in the lake sediment.

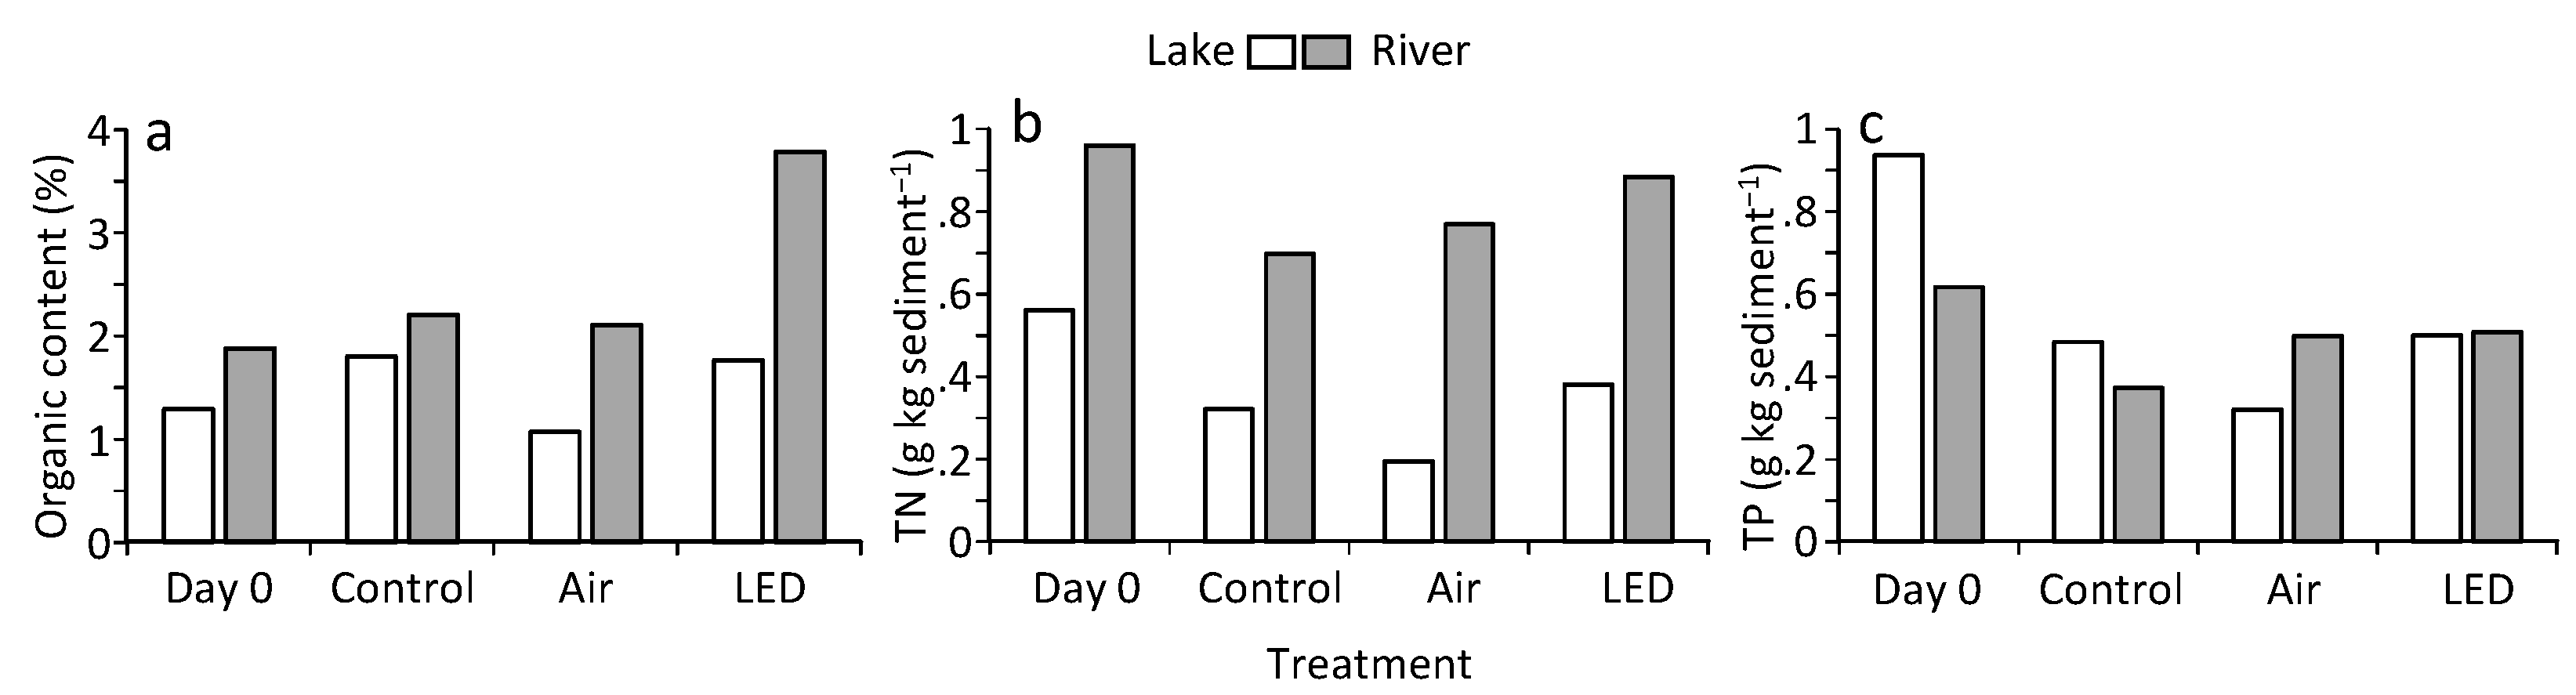
3.5. Nutrient and Organic Content in Sediment

Organic content in sediment increased during the experiment in most treatment × sediment combinations, while TN and TP in sediment decreased (Figure A1a–c). The increase in organic content, which is due to biological production (e.g., algal growth) and/or deposition of organic matter from water, was most conspicuous for the LED treatment with river sediment (about a two-fold increase). TN and TP concentrations decreased for all treatments during the experiment, indicating their release from the sediment into the water. TN and TP were highest in the LED for both sediment sources and lowest in the control (river) or aeration (lake).

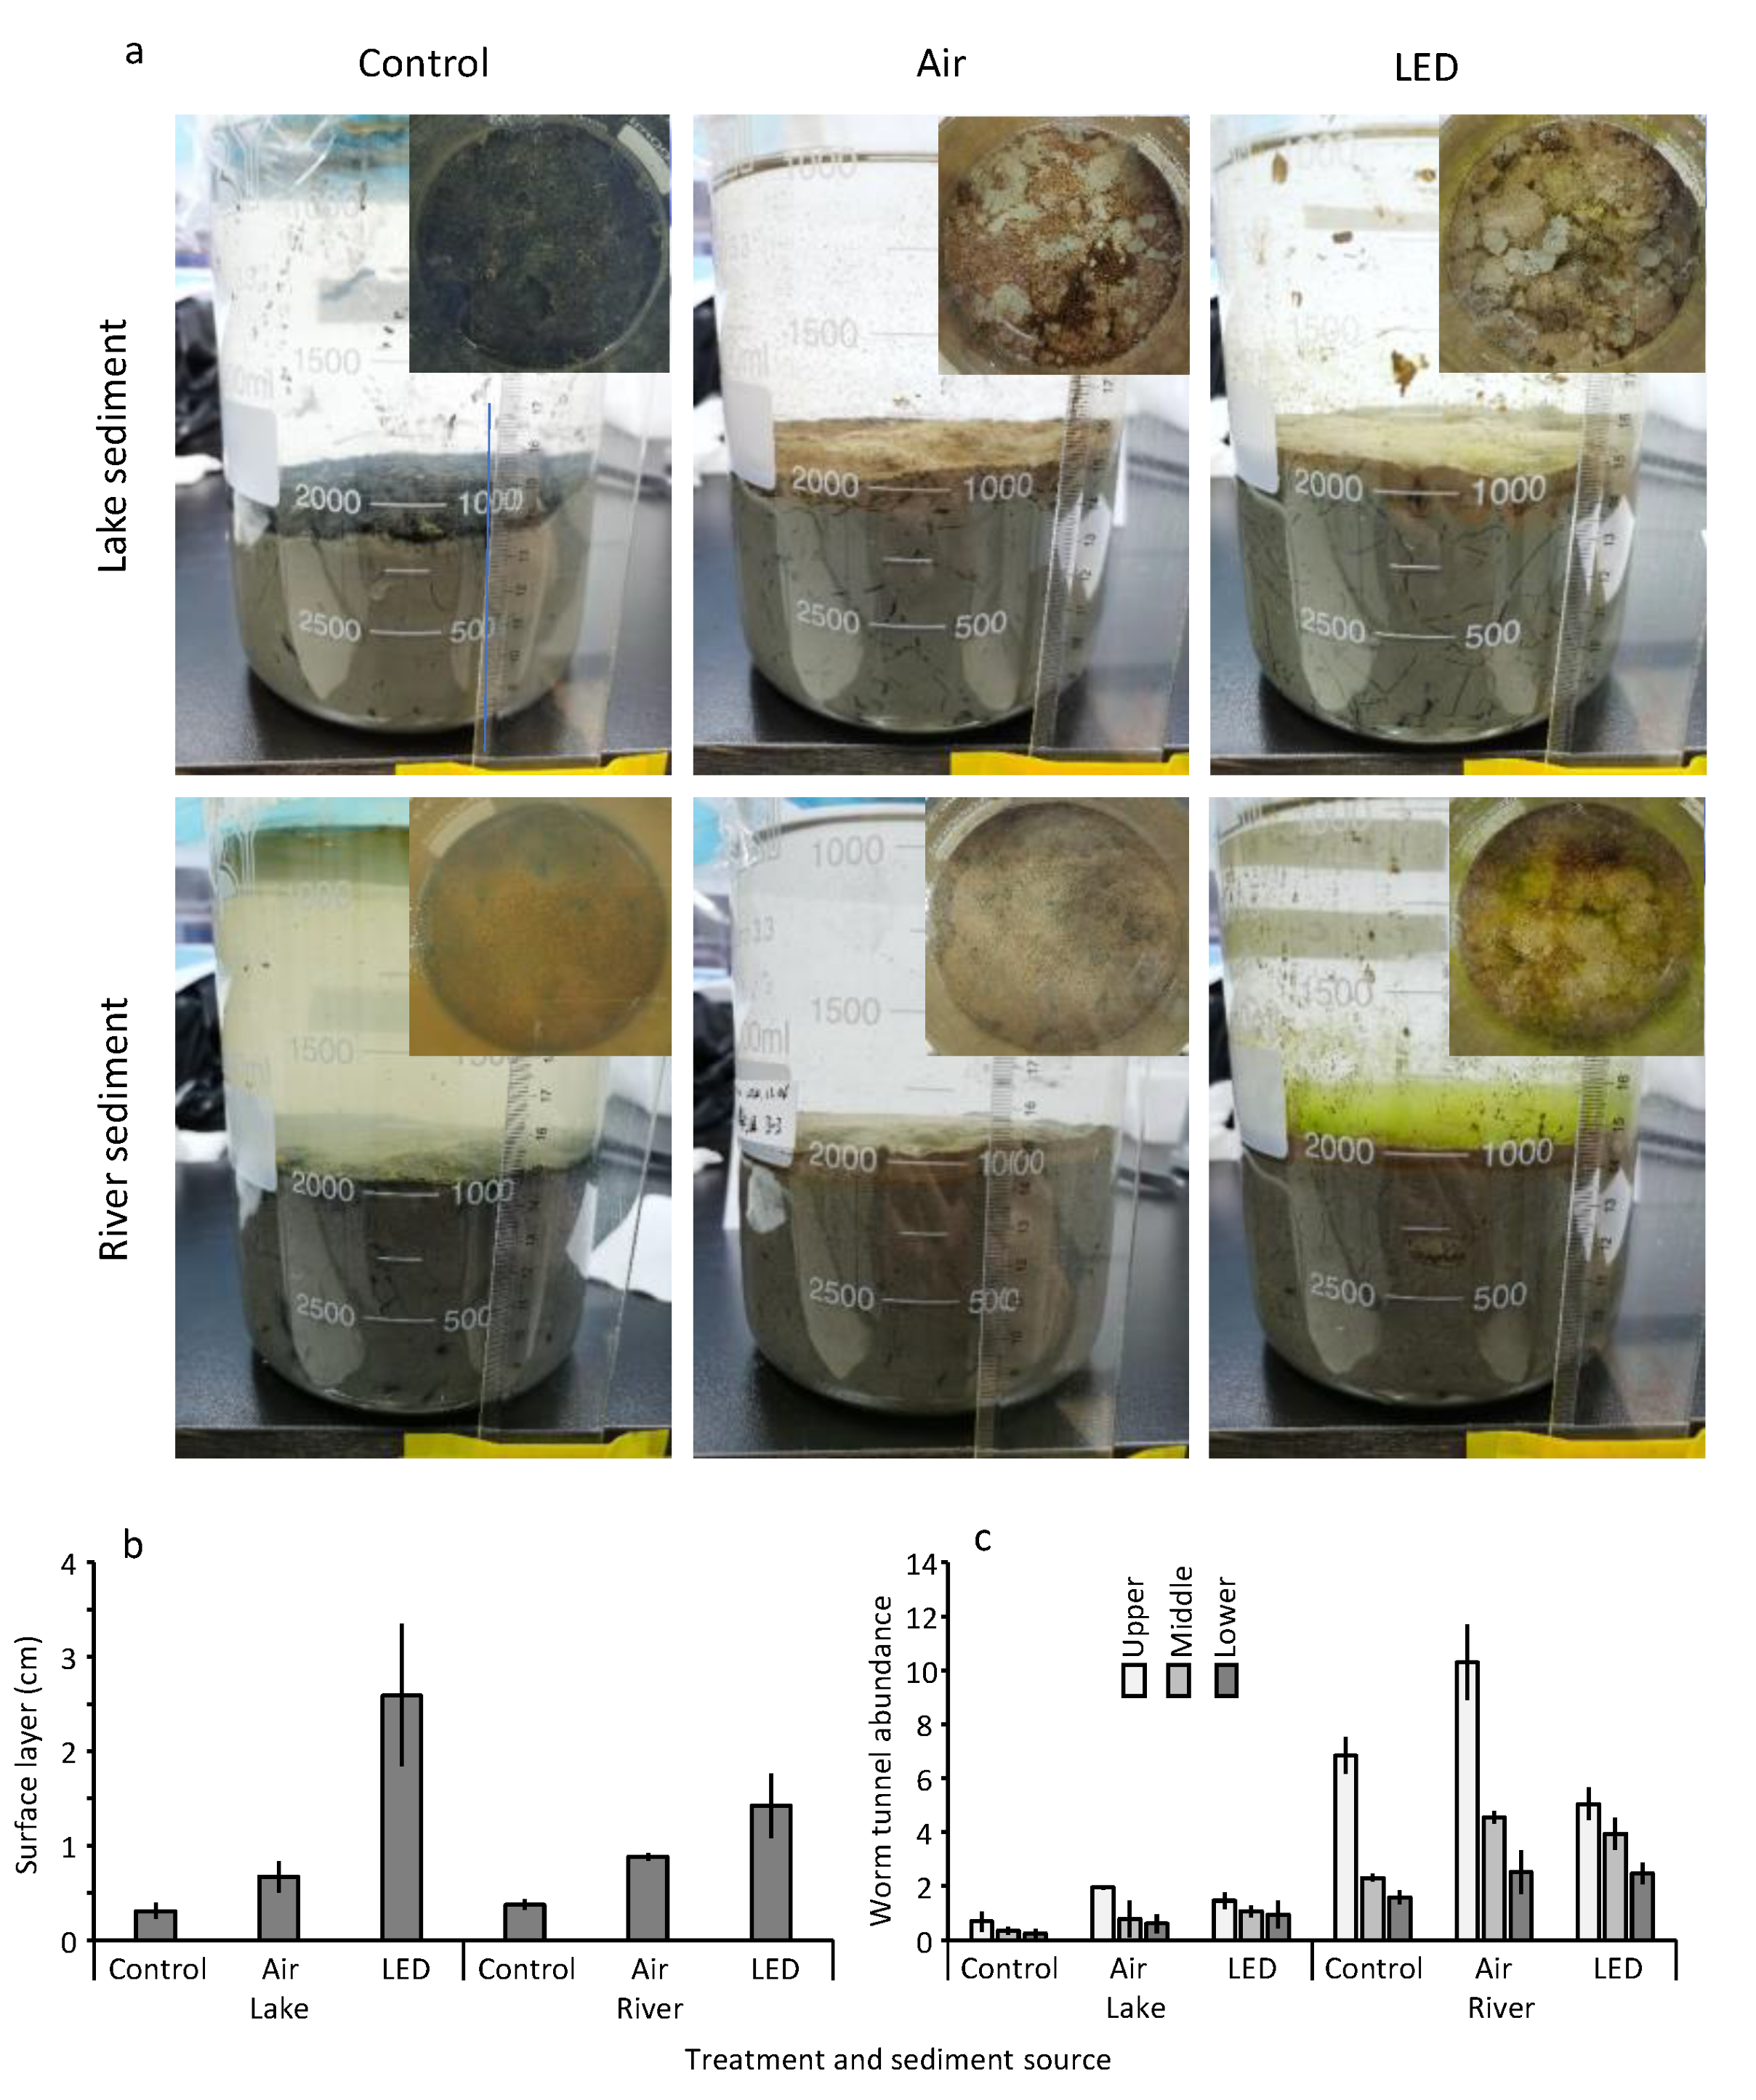
3.6. Oxic Layer and Worm Tunnels in the Sediment

Differences in sediment surface characteristics among the three treatments and two sediment sources were remarkable at the end of the experiment (Figure 5a). The surface was completely black or a black and orange combination for all microcosms of the control (the water was also black in some microcosms). In contrast, the surface of the aeration and LED treatments were brown with irregularly dispersed whitish circular patches, assumed to be the fecal mounds of worms. The fecal patches were more in the lake than river sediment and more in the LED than control and aeration. Additionally, filamentous algae occurred on the sediment surface of the LED treatment for both sediment sources, with variable abundance among the triplicate.
The depth of the oxic layer was a few millimeters in the control, while it exceeded 1 cm for the LED treatment (Figure 5b). The effect of treatment on depth was significant (ANOVA, df = 2, F-value = 25, p < 0.001), and the layer was significantly deeper for the aeration and LED than control, and for the LED than aeration. The effect of treatment and sediment source interaction on depth was also significant (ANOVA, df = 2, F-value = 4.77, p = 0.03), and the difference between the lake and river sediments was most conspicuous in the LED (almost two-fold difference, Figure 5b).
Different types of burrow tunnels were observed for the lake and river sediments. Slender and dense horizontal tunnels with occasional vertical connections in the river sediment were presumably burrows of oligochaete L. hoffmeisteri and L. grandisetosus, while sparse tunnels in variable directions in the lake sediment were presumably the burrows of polychaete Nephtys. The abundance of invertebrate burrowing tunnels varied by the vertical position of the microcosms, sediment source, and treatment (Figure 5c). The effect of vertical position on tunnels was significant (ANOVA, df = 2, F-value = 22, p < 0.001), and more tunnels were observed at the surface than at the middle and bottom. Effect of sediment source on tunnels was significant (ANOVA, df = 1, F-value = 151, p < 0.001) with greater abundance for the river than lake sediment. The effect of treatment on tunnels was significant (ANOVA, df = 2, F-value = 11, p < 0.001), being higher for the aeration and LED than control. In addition, the tunnels were concentrated at the surface in the control and aeration (i.e., tunnels were more than double at the surface than the middle and bottom), while the difference among vertical positions was relatively small in the LED (Figure 5c).

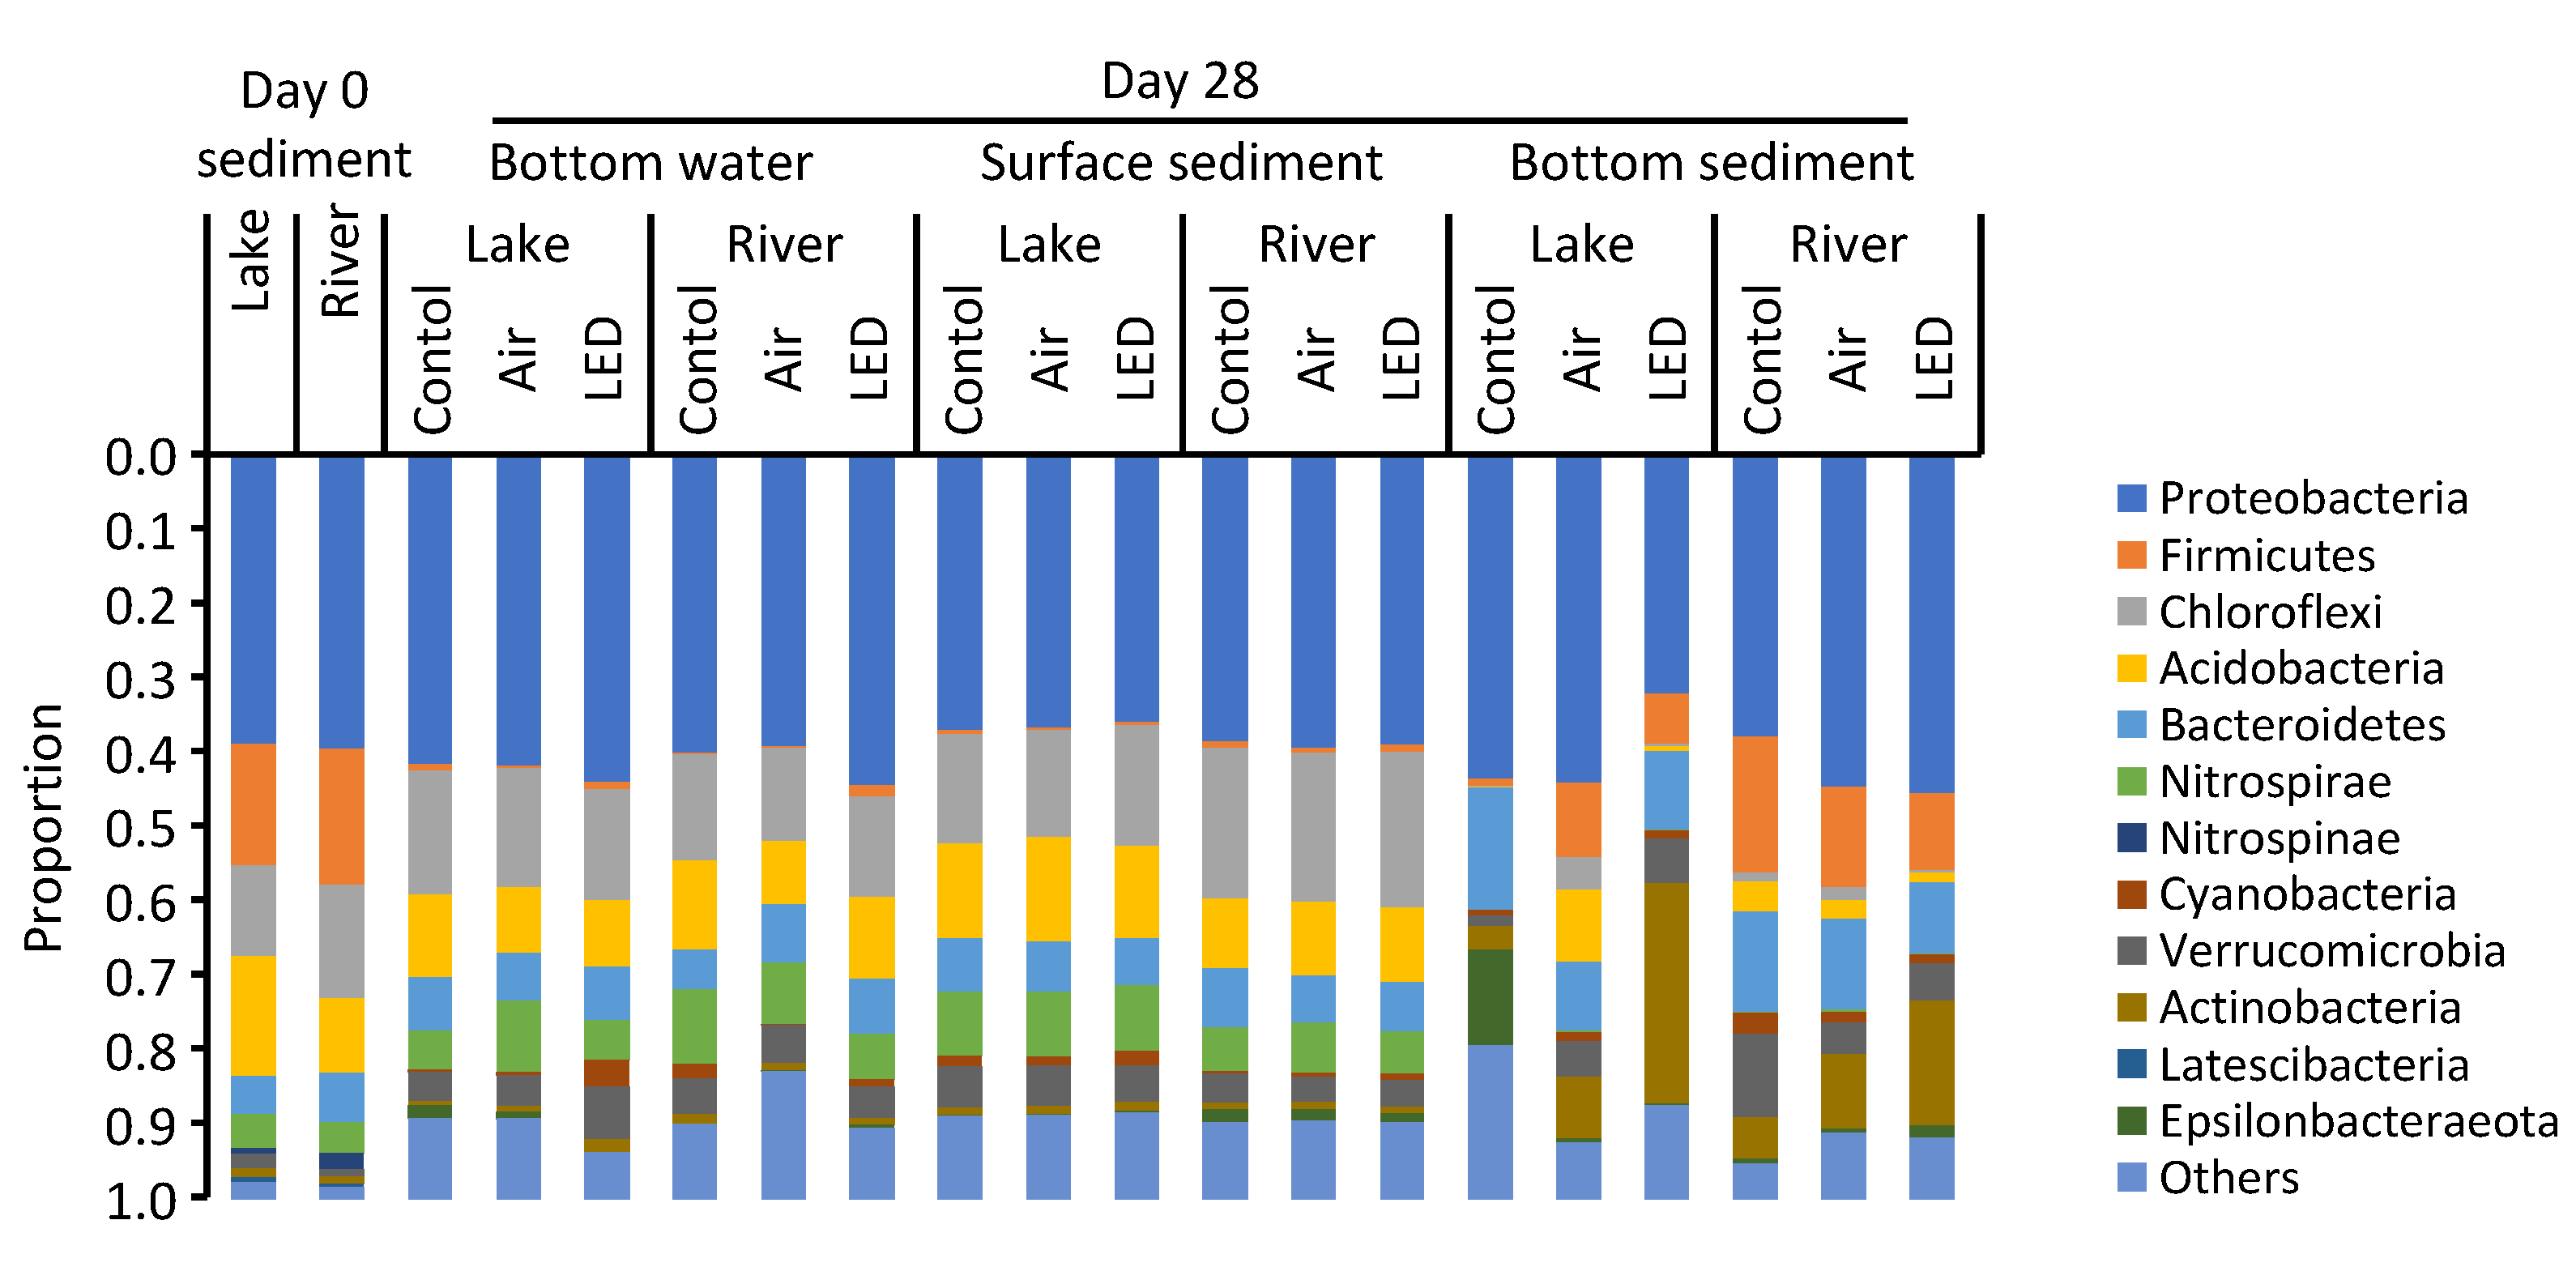
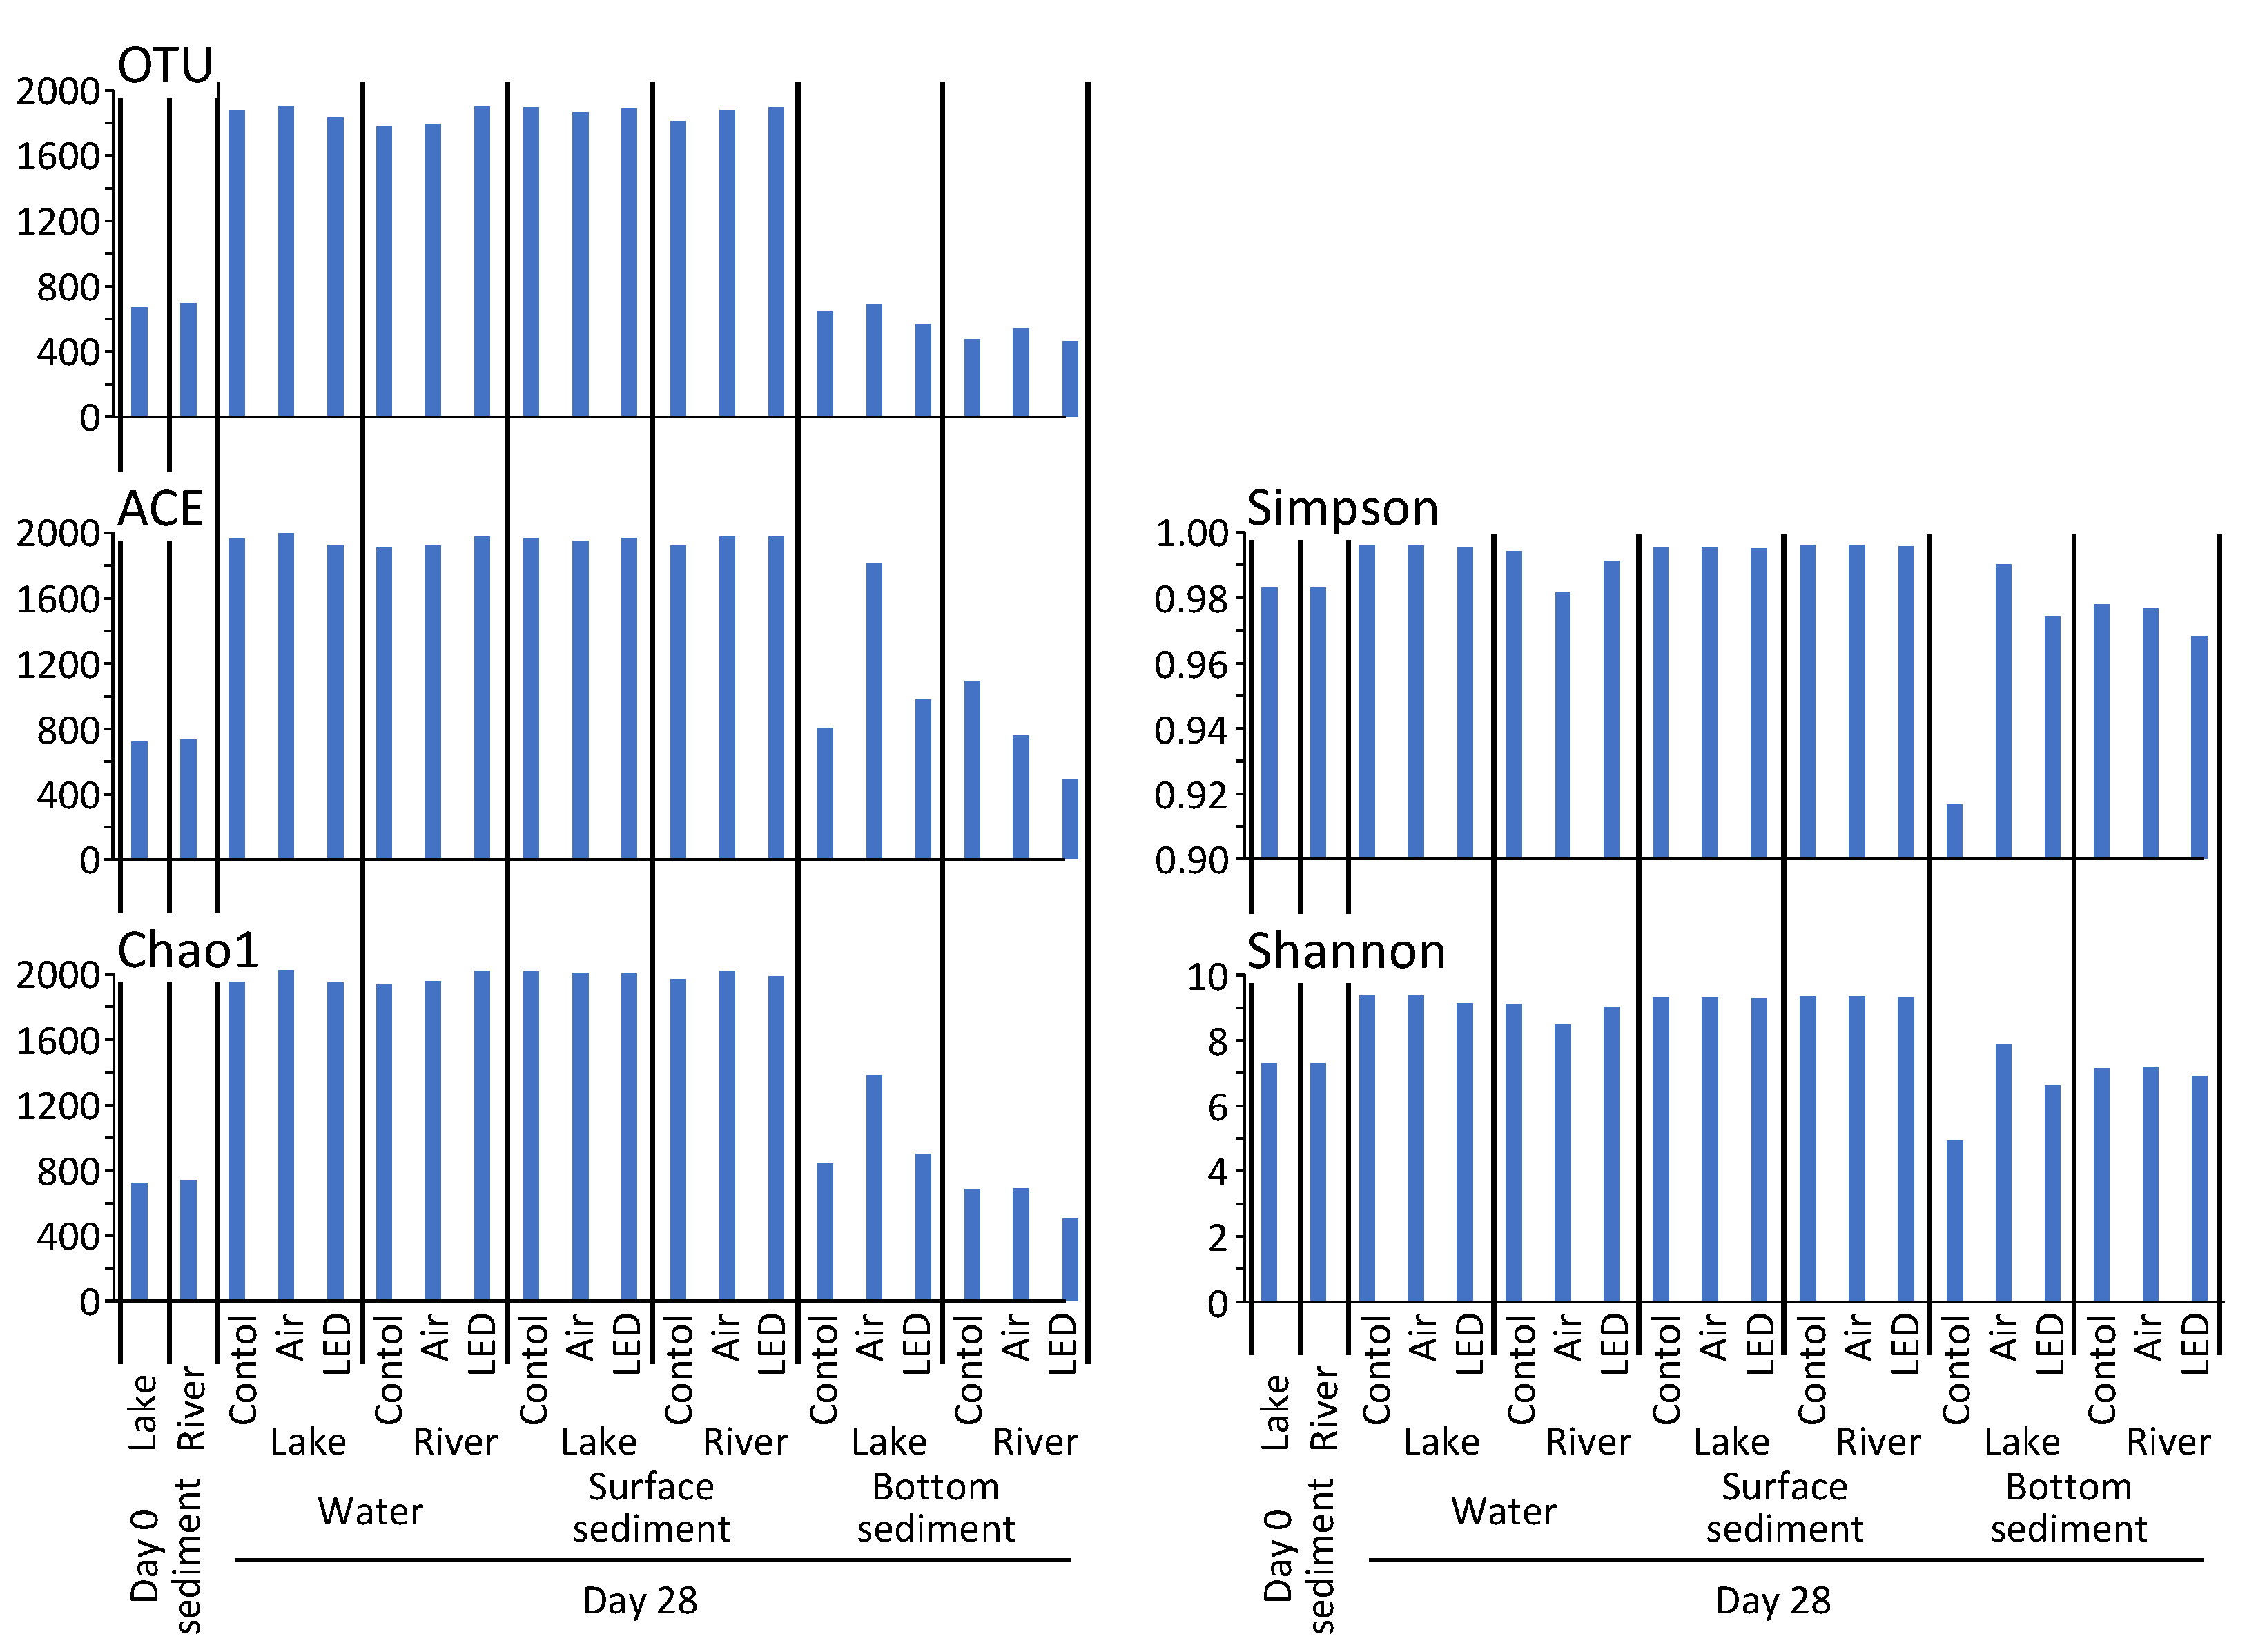
3.7. Composition of the Microbial Community in Water and Sediment
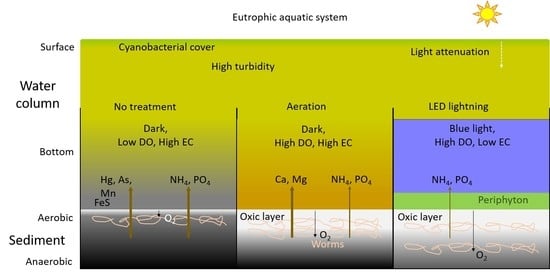
By bacterial DNA sequencing, a total of 1,417,840 pairs of reads and 1,400,825 clean reads were obtained after the quality control, with an average of 77,824 for each sample. By clustering the reads at the 97.0% similarity level, 461–1903 OTUs were obtained in each sample (Figure A2). The number of OTUs was substantially higher for water and surface sediment samples (day 28) than for the initial (day 0) and bottom sediment (day 28) samples. Chao1 and Ace, which are the indices of species richness, were also higher in water and surface sediment samples than in the bottom sediment samples, with the aeration-lake sample being relatively higher within the bottom sediment. Shannon and Simpson diversity, which are the indices of species diversity and community evenness, were also higher for water and surface sediment than bottom sediment, with the lowest values being the control lake sample. In summary, species diversity indices were relatively uniform across treatments and between sediment sources for the water and surface sediment but were remarkably low and varied among samples of the bottom sediment.
A total of 48 phyla, 129 classes, 277 orders, 438 families, 735 genera, and 787 species were annotated using the reference database (SILVA). At the phylum level, Proteobacteria was the most dominant across all samples (32–46%) (Figure 6). Within Proteobacteria, classes Alphaproteobacteria and Gammaproteobacteria were dominant in the water and surface sediment, while Deltaproteobacteria and Gammaproteobacteria were dominant in the bottom sediment. Bacteroidetes constantly occurred across samples (6–16%) with a dominance of the families Bacteroidales (water and surface sediment) and Kryptoniales (bottom sediment). Following Proteobacteria, Chloroflexi (mostly class Anaerolineae), Acidobacteria (mostly class Aminicenantia and unknown groups), and Nitrospirae (mostly classes Thermodesulfovibrionia and Nitrospira) were dominant in the water and surface sediment, while Firmicutes (mostly Enterococcus and Lactobacillus) and Actinobacteria (mostly families Sporichthyaceae and Microbacteriaceae) were dominant in the bottom sediment. Epsilonbacteria (mostly Sulfuricurvum) was dominant only in the control with lake sediment. In summary, by the end of the experiment, different species compositions among water, surface sediment, and bottom sediment were observed, with significant differences between the former two and the latter.
The treatment-related difference in bacterial species composition was unclear for the water and surface sediment at phylum (Figure 6) and lower taxonomic levels. In contrast, the treatment-related difference was observed for the bottom sediment, where Actinobacteria (mostly in the family Sporichthyaceae and Microbacteriaceae) was more dominant for the LED treatment than the others. Sediment-source-related differences were evident for surface sediment, including the dominance of Acidobacteria and Nitrospirae species with lake sediment and the dominance of Chloroflexi species with river sediment. Several species of cyanobacteria (e.g., Cyanobium, Microcystis, Monoraphidium neglectum, and Nannochloropsis gaditana) occurred in all samples, but their relative abundance was unrelated to neither treatment nor sediment source.

4. Discussion

This study examined the effects of LED illumination on the bottom water and sediment of eutrophic lakes, where light is limited for photosynthesis due to a high turbidity or surface cyanobacterial bloom, using laboratory microcosms. Periphyton (filamentous algae) successfully developed on the sediment surface in the LED treatment but not in the aeration treatment and control. The DO quickly reached saturation in the aeration but gradually supersaturated in the LED, and remained low in the control. A thick oxic layer developed on the surface of sediment in the aeration and LED with greater thickness in the latter, while it was poorly developed and the surface turned to black in the control. Oxygen penetrated more deeply into the sediment with the LED, as indicated by the vertical distribution of worm tunnels and bacterial community. EC and concentrations of nutrients and metals at the end of the experiment suggest that the release of solutes from the sediment to the overlying water was limited most efficiently in the LED. In the following, redox conditions and biological activities relevant to the effects of LED are discussed.

4.1. Effects of Aeration and LED on Increasing Oxygen and Biological Activities

DO became saturated and supersaturated in the aeration and LED treatments, respectively, with differing rates of increase between these treatments. DO increased sharply and stabilized by day 4 in the aeration, while it increased gradually and peaked on day 14 or later in the LED. pH increased together with DO in both treatments, being prior to and after the DO increase in the aeration and LED, respectively. The pH increase is considered to be promoted by outgassing of CO2 in the aeration, and by utilization of CO2 or HCO3 in algal photosynthesis [36] in the LED.
Periphyton, especially filamentous algae, which was visibly confirmed on the sediment surface, probably played major roles in the photosynthesis in the LED treatment. Photosynthesis by periphyton (i.e., its growth) was also supported by the increase in sediment organic content in the LED (Figure A1a). The filamentous algae might be cyanobacterium Pseudanabena, which was found in the phytoplankton (but not in the bacterial community of water and sediment) and is known as the functional filamentous algae that removes nutrients and carbon in wastewater treatments [37,38]. Alternatively, the filamentous algae might be green algae, which are more benefitted from blue LEDs than cyanobacteria [31], or a mix of various species. The occurrence of various species of phytoplankton in the LED but their total absence in the aeration and control also supports that algal growth occurred only in the LED. The maximum level of DO during the experiment was larger for the LED than aeration, suggesting a higher potential of LEDs to increase DO by photosynthesis. DO fluctuated more in the LED than aeration, probably due to spatiotemporal variations in algal activity.
The thickness of the oxic layer, abundance and distribution of worm tunnels, and bacterial community suggest that oxygen penetrated deeply in the LED treatment. In each microcosm, a thin oxic layer was visible on the surface at the beginning of the experiment. At the end of the experiment, the change in the thickness was negligible in the control, but showed a significant increase in the aeration and LED by overlaying a different-colored layer (light-brown) on the initial layer. According to the whitish patches (presumably fecal mounds) observed on the top of sediment, the overlaid layer is assumed to be sediment particles conveyed upward by feeding activities of polychaete and oligochaete worms abundant in the collected sediment. These worms are known as upward conveyors or gallery diffusors (i.e., bioturbation groups according to [22]) that actively transport particles from deep horizons to the sediment surface [39,40,41,42,43]. Thicker oxic layers in the LED than aeration suggest that greater amounts of sediment were reworked and exposed to oxygen by these worms.
Activities of these worms were also evident from the abundance of tunnels, though their patterns were partially controversial to the pattern of the oxic layer depth. More tunnels were observed in the aeration than LED; however, the tunnels in the aeration and control were concentrated in the upper layer of sediment, near or inside the oxic layer, but were distributed much evenly in the LED. Because these worms burrow vertically during feeding and reworking of sediment, abundant horizontal tunnels in the river sediment may be movement traces by oligochaete worms that sought places for feeding [44]. Despite the greater abundance of tunnels in the aeration, fecal mounds were more in the LED (Figure 5a). The feeding activities of these worms were probably stimulated more in the LED than aeration because of the higher availability of oxygen in the sediment of the former. Alternatively, the blue LED light, which is also known to improve the physiological status of fish [32,33] and urchins [45], might have directly stimulated their activities.
Oxygen penetration into the sediment by LED also appeared to have affected the bacterial community, especially in the bottom sediment. For the water and surface sediment samples, taxonomic composition at the phylum level was surprisingly very similar among the treatments for each of the lake and river sediment (Figure 6). All samples were dominated by Proteobacteria (Alpha- and Gamma-Proteobacteria), followed by Chloroflexi, Acidobacteria, Nitrospirae, and Bacteroidetes, among which Alpha- and Gamma-Proteobacteria, Acidobacteria, and Bacteroidetes were generally dominant in the surface sediment of lakes (assigned as oxic group according to [46]). Firmicutes, which are usually distributed in anoxic conditions [46], were a dominant group in the initial sediment and bottom sediment, but negligible in the water and surface sediment samples. It is inferred that a certain bacterial composition was maintained during the experiment with the same original water and sediment under oxic to sub-oxic conditions irrespective of the changes in water quality. In contrast, LED treatment significantly affected the bacterial composition of the bottom sediment, which was more dominated by Actinobacteria than that in the aeration and control for both lake and river sediments. Sporichthyaceae and Microbacteriaceae were the dominant groups in Actinobacteria, and are known as aerobic bacteria [47,48]. Additionally, Epsilonbacteria (mostly Sulfuricurvum, a facultatively anaerobic, [49]) was dominant only in the control of the lake sediment. The bacterial composition also varied between the control and aeration in the bottom sediment; thus, the bacterial community may be more sensitive to the surrounding environment under sub-oxic to anoxic conditions [50] and with low bacterial species richness (Figure A2).

4.2. Effects of Aeration and LED on Nutrient Release

Less nutrient was released from the sediment under the LED treatment than the aeration treatment. TP and PO43− concentrations were considerably greater in the control with limited DO than in the aeration and LED throughout the experiment. Phosphates can be bound to minerals (e.g., Fe, Mn, Ca), mineral–organic complexes, and other inorganics in sediment in the presence of oxygen, while they are easily released from the sediment in its absence [5,9]. TN and NH3 were also considerably greater in the control than aeration and LED. In the absence of oxygen, nitrification and denitrification are inhibited, which results in ammonia accumulation by mineralization of organic matter [10]. The concentrations of these nutrients were also lower in the LED than in aeration, especially in the latter half of the experiment. Periphyton is known to retain N and P by assimilation and storage during its growth in aquatic ecosystems [16,17,51]; thus, the periphyton developed under LED illumination was assumed to have retained N and P in the water, which was also supported by the decrease in SiO44−, another important nutrient for algae, only in the LED. The deeper penetration of oxygen into the sediment in the LED can also reduce the release of NH3 and PO43− from deeper sediment.
TP slightly increased in the latter half of the experiment in the aeration and LED treatments. Such a small increase in TP has also been observed in our previous study of LED and aeration in field mesocosms [34]. Based on the continuous decrease in NH3 in these treatments, oxygen depletion (which can trigger PO43− releases from the sediment) was unlikely throughout the experiment. The availability of soluble P on sediment surface might have increased due to mineralization of organic matter by aerobic microbes and defecation and excretion of worms [43,52] and finally exceeding the binding capacity of the sediment.

4.3. Effects of Aeration and LED on Metal Release

Oxygen and redox conditions are assumed to be the major controls on the differences in metal concentrations in the water among the treatments. At the end of the experiment, the control had greater Cr, Hg, As, Bi, and Mn concentrations, while the aeration and LED had greater Cu, Zn, Se, and Sb concentrations (Figure 4). The control had an especially high Mn concentration, which is consistent with a general recognition of dissolution of Fe and Mn under anaerobic conditions by reduction of these oxides [53,54]. The absence of high Fe concentration in the control can be attributed to its precipitation with sulfide as iron sulfide (FeS) in anaerobic conditions [14], which is supported by the observation of black- or orange-colored substances (i.e., FeS, [14,55]) on the sediment surface of the control (Figure 5a). Metals bound to Fe–Mn oxy-hydroxides are known to be released under anaerobic conditions [11], and Hg and As have a high affinity for the oxides [53,56,57]. Furthermore, Methyl-Hg is known to be produced by methylation of Hg and diffuse under anaerobic conditions [53,58]. In contrast, metal sulfides formed in reduced sediment, including CuS, PbS, and ZnS, are highly insoluble and serve as the sink for some heavy metals in anaerobic conditions [59,60]; thus, the effects of the aeration and LED on limiting the release of metals from the sediment depends on the metal species, and on their affinity to Fe–Mn oxy-hydroxides or sulfide, which needs further examinations for a proper understanding.
The LED treatment limited surplus releases of Ca and Mg and other metals that increase EC of water, which was observed in the aeration treatment. Ca and Mg were the most abundant metals in water, and their concentrations were greater in the aeration than in LED and control (1.1–2.0-fold differences, Figure 4). Ca and Mg probably contributed to the increasing EC in the aeration (Figure 3d), presumably together with K and Na (ubiquitous and essential elements of organisms). The increase in Ca and Mg in the aeration was less associated with the availability of oxygen as they were lower both in the LED and control. The circulation of water by aeration might have affected the flow of pore water within the sediment, which then promoted the movement and release of labile ions from the sediment to the overlying water. Ca and Mg can also be actively released from sediment in aerobic conditions by feeding activities of worms and mineralization of dead organisms [61,62], which can be quickly assimilated and retained by the periphyton in the LED. Irrespective of the process, upward fluxes (i.e., from sediment to overlying water) of nutrients and metals at the sediment–water interface appeared to be significantly limited in the LED than aeration.
Although the effects of LED illumination of sediment on stimulating benthic algae and improving the water quality of aquatic systems have been demonstrated by previous studies [30,34,63,64,65], to our knowledge, no study had explicitly shown the effects on metal releases from the sediment, on bacterial and invertebrate communities, and on various ecosystem components (i.e., nutrients, metals, algae, bacteria, and invertebrates) simultaneously. In addition, no study had compared the effects between LED illumination and aeration. Running cost of LED (e.g., 20–30 W for 10-m strip LED) is usually substantially lower than that of aerator (e.g., >1 kW for paddle wheel or surging aerator), while our understanding is still limited on the spatial and temporal extent of their effects.
LED can be easily installed in park ponds where existing electricity is available (e.g., for the light decoration or fountain-type aerators). Waterproof and strip-type LED, which is flexible and can extend for 10 m or more, was successfully used in the pond in our previous study [34]. Bamboo poles, which are flexible, nature-friendly, and suitable substrate for stimulating the growth of indigenous preferred algae (e.g., diatoms) [66] are recommended to spatially arrange LED near the bottom to develop an effective periphyton on sediment. Furthermore, a combination of LED and water circulation by aeration can increase the spatial and temporal extent of the LED effects [34]. Such LED treatment could be a short-term solution if water transparency and availability of natural light (i.e., solar radiation) at the bottom are recovered by the treatment [34]. In Lake Taihu, the target places for the LED application are bottom-excavated inflow rivers and local shore areas protected from waves by dykes/fences, in which water stagnation and oxygen depletion are more likely to occur than in offshore areas with wave exposure and vertical mixing of water.

5. Conclusions

This study examined the effects of LED (blue wavelength) illumination of sediment surface on improving water and sediment quality of eutrophic lakes and ponds using microcosms. Periphyton with mainly filamentous algae was developed on sediment surface by LED treatment. Oxygen condition was improved by the aeration and LED treatments, with a rapid increase in DO up to saturation in the aeration and a gradual increase up to supersaturation in the LED. The DO was less stable and varied among microcosms in the LED due to the spatiotemporal variation in algal photosynthesis. The thicker oxic layer, which was associated with feeding activities of burrowing worms, was more developed on the sediment of the LED than of the aeration but was poorly developed and sediment was black in the control with low DO. The distribution of worm tunnels and dominance of aerobic bacteria in the sediment suggest that oxygen penetrated deeper into the sediment in the LED than aeration. The release of nutrients (N, P) and some metals (e.g., Hg, As, Mn) from the sediment to the water were dramatically limited by the aeration and LED, with more effective limitation in the latter for the release of N, P, Ca, Mg, and other solutes affecting EC. These results demonstrate a difference in the aerobic condition generated by the two treatments; LED stimulated algal growth and bioturbation by worms, resulting in greater retention of nutrients and metals in and on the sediment.

Supplementary Materials

The following supporting information can be downloaded at: https://www.mdpi.com/article/10.3390/w14121839/s1, Table S1: Analysis of nutrient concentration by Skalar method.

Author Contributions

Conceptualization, A.H., S.K. and Y.I.; methodology, A.H., H.Y., D.X. and Y.I.; formal analysis, S.K.; investigation, H.Y., D.X. and A.H.; writing—original draft preparation, H.Y.; writing—review and editing, S.K. and Y.I.; visualization, S.K.; supervision, A.H. and Y.I.; project administration, A.H. and M.Z.; funding acquisition, M.Z. All authors have read and agreed to the published version of the manuscript.

Funding

This research was funded by the National Key Research and Development Program of China, Grant No. 2018YFE0103700.

Data Availability Statement

The data supporting the findings of this study are available within the article and https://figshare.com/articles/dataset/LED_effects_on_mud_and_water_quality/19919179 (accessed on 9 May 2022).

Acknowledgments

We thank the students of Aquatic Ecology and Symbiology, College of Life and Environmental Sciences, Wenzhou University for helping with the laboratory and field surveys. The earlier version of the manuscript was greatly improved after the comments by two anonymous reviewers.

Conflicts of Interest

The authors declare no conflict of interest.

Appendix A

Table A1. Density (cell mL−1) of phytoplankton cells in each condition on day 28. No phytoplankton was found in the control and aeration treatment.
TaxonControlAerationLED
LakeRiverLakeRiverLakeRiver
Cyanobacteria
Arthrospira * 1
Chroococcus 475016
Dactylococcopsis 11
Pseudanabena * 1
Green algae
Ankistrodesmus 1
Cosmarium 1
Eudrina 117
Scenedesmus 8
Oocystaceae 2
Diatoms
Aulacoseira 11
Cyclotella 203
Navicula 1
Nitzschia 91
Synedra 2
Other
Dinoflagellate 2
*: Filamentous algae (count for filament).
Figure A1. Sediment quality ((a): organic content, (b): TN, (c): TP) at the beginning and end of the experiment.
Water 14 01839 g0a1
Figure A2. Diversity indices of the bacterial community in water and sediment samples.
Water 14 01839 g0a2

References

  1. Harper, D.M. Eutrophication of Freshwaters: Principles, Problems and Restoration; Springer: Dordrecht, The Netherlands, 1992; p. 327. [Google Scholar]
  2. Dodds, W.K.; Bouska, W.W.; Eitzmann, J.L.; Pilger, T.J.; Pitts, K.L.; Riley, A.J.; Schloesser, J.T.; Thornbrugh, D.J. Eutrophication of US freshwaters: Analysis of potential economic damages. Environ. Sci. Technol. 2009, 43, 12–19. [Google Scholar] [CrossRef] [Green Version]
  3. Smith, V.H.; Schindler, D.W. Eutrophication science: Where do we go from here? Trends Ecol. Evol. 2009, 24, 201–207. [Google Scholar] [CrossRef] [PubMed]
  4. Rabalais, N.N.; Diaz, R.J.; Levin, L.A.; Turner, R.E.; Gilbert, D.; Zhang, J. Dynamics and distribution of natural and human-caused hypoxia. Biogeosciences 2010, 7, 585–619. [Google Scholar] [CrossRef] [Green Version]
  5. Søndergaard, M.; Jensen, J.P.; Jeppesen, E. Role of sediment and internal loading of phosphorus in shallow lakes. Hydrobiologia 2003, 506, 135–145. [Google Scholar] [CrossRef]
  6. Zamparas, M.; Zacharias, I. Restoration of eutrophic freshwater by managing internal nutrient loads. A review. Sci. Total Environ. 2014, 496, 551–562. [Google Scholar] [CrossRef]
  7. Kibuye, F.A.; Zamyadi, A.; Wert, E.C. A critical review on operation and performance of source water control strategies for cyanobacterial blooms: Part I-chemical control methods. Harmful Algae 2021, 109, 102099. [Google Scholar] [CrossRef] [PubMed]
  8. Kibuye, F.A.; Zamyadi, A.; Wert, E.C. A critical review on operation and performance of source water control strategies for cyanobacterial blooms: Part II-mechanical and biological control methods. Harmful Algae 2021, 109, 102119. [Google Scholar] [CrossRef] [PubMed]
  9. Boström, B.; Andersen, J.M.; Fleischer, S.; Jansson, M. Exchange of phosphorus across the sediment-water interface. In Phosphorus in Freshwater Ecosystems; Persson, G., Jansson, M., Eds.; Springer: Dordrecht, The Netherlands, 1988; pp. 229–244. [Google Scholar]
  10. Beutel, M.W. Inhibition of ammonia release from anoxic profundal sediments in lakes using hypolimnetic oxygenation. Ecol. Eng. 2006, 28, 271–279. [Google Scholar] [CrossRef]
  11. Kang, M.; Tian, Y.; Peng, S.; Wang, M. Effect of dissolved oxygen and nutrient levels on heavy metal contents and fractions in river surface sediments. Sci. Total Environ. 2019, 648, 861–870. [Google Scholar] [CrossRef]
  12. Wang, L.; Long, X.; Chong, Y.; Yu, G. Potential risk assessment of heavy metals in sediments during the denitrification process enhanced by calcium nitrate addition: Effect of AVS residual. Ecol. Eng. 2016, 87, 333–339. [Google Scholar] [CrossRef]
  13. Brune, A.; Frenzel, P.; Cypionka, H. Life at the oxic–anoxic interface: Microbial activities and adaptations. FEMS Microbiol. Rev. 2000, 24, 691–710. [Google Scholar] [CrossRef]
  14. Meyer-Reil, L.A.; Köster, M. Eutrophication of marine waters: Effects on benthic microbial communities. Mar. Pollut. Bull. 2000, 41, 255–263. [Google Scholar] [CrossRef]
  15. Dodds, W.K. The role of periphyton in phosphorus retention in shallow freshwater aquatic systems. J. Phycol. 2003, 39, 840–849. [Google Scholar] [CrossRef] [Green Version]
  16. Lu, H.; Wan, J.; Li, J.; Shao, H.; Wu, Y. Periphytic biofilm: A buffer for phosphorus precipitation and release between sediments and water. Chemosphere 2016, 144, 2058–2064. [Google Scholar] [CrossRef] [PubMed]
  17. Wu, Y.; Liu, J.; Rene, E.R. Periphytic biofilms: A promising nutrient utilization regulator in wetlands. Bioresour. Technol. 2018, 248, 44–48. [Google Scholar] [CrossRef]
  18. Kristensen, E. Organic matter diagenesis at the oxic/anoxic interface in coastal marine sediments, with emphasis on the role of burrowing animals. In Life at Interfaces and under Extreme Conditions; Liebezeit, G., Dittmann, S., Kröncke, I., Eds.; Springer: Dordrecht, The Netherlands, 2000; pp. 1–24. [Google Scholar]
  19. Wetzel, R.G. (Ed.) The phosphorus cycle. In Limnology, 3rd ed.; Academic Press: Cambridge, MA, USA, 2001; pp. 239–288. [Google Scholar]
  20. Carlton, R.G.; Wetzel, R.G. Phosphorus flux from lake sediments: Effect of epipelic algal oxygen production. Limnol. Oceanogr. 1988, 33, 562–570. [Google Scholar] [CrossRef]
  21. Zhang, X.F.; Mei, X.Y. Effects of benthic algae on release of soluble reactive phosphorus from sediments: A radioisotope tracing study. Water Sci. Eng. 2015, 8, 127–131. [Google Scholar] [CrossRef] [Green Version]
  22. Kristensen, E.; Penha-Lopes, G.; Delefosse, M.; Valdemarsen, T.; Quintana, C.O.; Banta, G.T. What is bioturbation the need for a precise definition for fauna in aquatic sciences. Mar. Ecol. Prog. Ser. 2012, 446, 285–302. [Google Scholar] [CrossRef] [Green Version]
  23. Yan, W.; Chen, M.; Liu, L.; Wu, T.; Zhang, Y.; Wang, H.; Xing, X.; Fan, K. Mechanism of phosphorus mobility in sediments with larval (Propsilocerus akamusi) bioturbation. Environ. Sci. Pollut. Res. 2020, 27, 7538–7548. [Google Scholar] [CrossRef]
  24. Lürling, M.; van Oosterhout, F. Controlling eutrophication by combined bloom precipitation and sediment phosphorus inactivation. Water Res. 2013, 47, 6527–6537. [Google Scholar] [CrossRef] [PubMed]
  25. Visser, P.M.; Ibelings, B.W.; Bormans, M.; Huisman, J. Artificial mixing to control cyanobacterial blooms: A review. Aquat. Ecol. 2016, 50, 423–441. [Google Scholar] [CrossRef] [Green Version]
  26. Hao, A.; Kobayashi, S.; Xia, D.; Mi, Q.; Yan, N.; Su, M.; Lin, A.; Zhao, M.; Iseri, Y. Controlling eutrophication via surface aerators in irregular-shaped urban ponds. Water 2021, 13, 3360. [Google Scholar] [CrossRef]
  27. Scheffer, M.; Rinaldi, S.; Gragnani, A.; Mur, L.R.; van Nes, E.H. On the dominance of filamentous cyanobacteria in shallow, turbid lakes. Ecology 1997, 78, 272–282. [Google Scholar] [CrossRef]
  28. Han, Z.; Cui, B. Performance of macrophyte indicators to eutrophication pressure in ponds. Ecol. Eng. 2016, 96, 8–19. [Google Scholar] [CrossRef] [Green Version]
  29. Hao, A.; Kobayashi, S.; Huang, H.; Mi, Q.; Iseri, Y. Effects of substrate and water depth of a eutrophic pond on the physiological status of a submerged plant, Vallisneria natans. PeerJ 2020, 8, e10273. [Google Scholar] [CrossRef] [PubMed]
  30. Kwon, H.K.; Oh, S.J.; Yang, H.S. Growth and uptake kinetics of nitrate and phosphate by benthic microalgae for phytoremediation of eutrophic coastal sediments. Bioresour. Technol. 2013, 129, 387–395. [Google Scholar] [CrossRef]
  31. Schulze, P.S.; Barreira, L.A.; Pereira, H.G.; Perales, J.A.; Varela, J.C. Light emitting diodes (LEDs) applied to microalgal production. Trends Biotechnol. 2014, 32, 422–430. [Google Scholar] [CrossRef]
  32. Roh, H.J.; Kang, G.S.; Kim, A.; Kim, N.E.; Nguyen, T.L.; Kim, D.H. Blue light-emitting diode photoinactivation inhibits edwardsiellosis in fancy carp (Cyprinus carpio). Aquaculture 2018, 483, 1–7. [Google Scholar] [CrossRef]
  33. Ho, D.T.; Kim, A.; Kim, N.; Roh, H.J.; Chun, W.K.; Lee, Y.; Kim, D.H. Effect of blue light emitting diode on viral hemorrhagic septicemia in olive flounder (Paralichthys olivaceus). Aquaculture 2020, 521, 735019. [Google Scholar] [CrossRef]
  34. Hao, A.; Kobayashi, S.; Yan, N.; Xia, D.; Zhao, M.; Iseri, Y. Improvement of water quality using a circulation device equipped with oxidation carriers and light emitting diodes in eutrophic pond mesocosms. J. Environ. Chem. Eng. 2021, 9, 105075. [Google Scholar] [CrossRef]
  35. Rasband, W.S. ImageJ. U. S. National Institutes of Health, Bethesda, Maryland, USA. 1997–2018. Available online: https://imagej.nih.gov/ij/ (accessed on 1 May 2022).
  36. Spalding, M.H. Photosynthesis and photorespiration in freshwater green algae. Aquat. Bot. 1989, 34, 181–209. [Google Scholar] [CrossRef]
  37. Liu, J.; Vyverman, W. Differences in nutrient uptake capacity of the benthic filamentous algae Cladophora sp., Klebsormidium sp. and Pseudanabaena sp. under varying N/P conditions. Bioresour. Technol. 2015, 179, 234–242. [Google Scholar] [CrossRef] [PubMed]
  38. Ouhsassi, M.; Bouyahya, A.; El Ouahrani, A.; El Harsal, A.; Abrini, J. Evaluation of self-purifying power of cyanobacteria Pseudanabaena galeata: Case of dairy factory effluents. Appl. Water Sci. 2020, 10, 181. [Google Scholar] [CrossRef]
  39. Wang, X.; Matisoff, G. Solute transport in sediments by a large freshwater oligochaete, Branchiura sowerbyi. Environ. Sci. Technol. 1997, 31, 1926–1933. [Google Scholar] [CrossRef]
  40. Matisoff, G.; Wang, X.; McCall, P.L. Biological redistribution of lake sediments by tubificid oligochaetes: Branchiura sowerbyi and Limnodrilus hoffmeisteri/Tubifex tubifex. J. Gt. Lakes Res. 1999, 25, 205–219. [Google Scholar] [CrossRef]
  41. Piot, A.; Rochon, A.; Stora, G.; Desrosiers, G. Experimental study on the influence of bioturbation performed by Nephtys caeca (Fabricius) and Nereis virens (Sars) annelidae on the distribution of dinoflagellate cysts in the sediment. J. Exp. Mar. Biol. Ecol. 2008, 359, 92–101. [Google Scholar] [CrossRef]
  42. Bouchet, V.M.; Sauriau, P.G.; Debenay, J.P.; Mermillod-Blondin, F.; Schmidt, S.; Amiard, J.C.; Dupas, B. Influence of the mode of macrofauna-mediated bioturbation on the vertical distribution of living benthic foraminifera: First insight from axial tomodensitometry. J. Exp. Mar. Biol. Ecol. 2009, 371, 20–33. [Google Scholar] [CrossRef] [Green Version]
  43. Chen, M.; Ding, S.; Liu, L.; Wang, Y.; Xing, X.; Wang, D.; Gong, M.; Zhang, C. Fine-scale bioturbation effects of tubificid worm (Limnodrilus hoffmeisteri) on the lability of phosphorus in sediments. Environ. Pollut. 2016, 219, 604–611. [Google Scholar] [CrossRef]
  44. Fischer, J.A.; Beeton, A.M. The effect of dissolved oxygen on the burrowing behavior of Limnodrilus hoffmeisteri (Oligochaeta). Hydrobiologia 1975, 47, 273–290. [Google Scholar] [CrossRef]
  45. Li, Y.Y.; Su, F.J.; Hsieh, Y.J.; Huang, T.C.; Wang, Y.S. Embryo Development and Behavior in Sea Urchin (Tripneustes gratilla) Under Different Light Emitting Diodes Condition. Front. Mar. Sci. 2021, 8, 785. [Google Scholar] [CrossRef]
  46. Han, X.; Schubert, C.J.; Fiskal, A.; Dubois, N.; Lever, M.A. Eutrophication as a driver of microbial community structure in lake sediments. Environ. Microbiol. 2020, 22, 3446–3462. [Google Scholar] [CrossRef]
  47. Qin, F.; He, W.X.; Zhang, D.C. Marinisubtilis pacificus gen. nov., sp. nov., a Member of the Family Microbacteriaceae Isolated from a Deep-Sea Seamount. Curr. Microbiol. 2021, 78, 2136–2142. [Google Scholar] [CrossRef]
  48. He, Q.; Xiao, Q.; Fan, J.; Zhao, H.; Cao, M.; Zhang, C.; Jiang, Y. The impact of heterotrophic bacteria on recalcitrant dissolved organic carbon formation in a typical karstic river. Sci. Total Environ. 2022, 815, 152576. [Google Scholar] [CrossRef] [PubMed]
  49. Zhao, Y.; Bai, Y.; Guo, Q.; Li, Z.; Qi, M.; Ma, X.; Wang, H.; Kong, D.; Wang, A.; Liang, B. Bioremediation of contaminated urban river sediment with methanol stimulation: Metabolic processes accompanied with microbial community changes. Sci. Total Environ. 2019, 653, 649–657. [Google Scholar] [CrossRef]
  50. Xia, D.; Zhao, H.; Kobayashi, S.; Mi, Q.; Hao, A.; Iseri, Y. Effect of remediation reagents on bacterial composition and ecological function in black-odorous water sediments. Arch. Microbiol. 2022, 204, 280. [Google Scholar] [CrossRef]
  51. Pei, G.; Wang, Q.; Liu, G. The role of periphyton in phosphorus retention in shallow lakes with different trophic status, China. Aquat. Bot. 2015, 125, 17–22. [Google Scholar] [CrossRef] [Green Version]
  52. Hölker, F.; Vanni, M.J.; Kuiper, J.J.; Meile, C.; Grossart, H.P.; Stief, P.; Adrian, R.; Lorke, A.; Dellwig, O.; Brand, A.; et al. Tube-dwelling invertebrates: Tiny ecosystem engineers have large effects in lake ecosystems. Ecol. Monogr. 2015, 85, 333–351. [Google Scholar] [CrossRef] [Green Version]
  53. Beutel, M.W.; Leonard, T.M.; Dent, S.R.; Moore, B.C. Effects of aerobic and anaerobic conditions on P, N, Fe, Mn, and Hg accumulation in waters overlaying profundal sediments of an oligo-mesotrophic lake. Water Res. 2008, 42, 1953–1962. [Google Scholar] [CrossRef] [PubMed]
  54. Chen, M.; Ding, S.; Wu, Y.; Fan, X.; Jin, Z.; Tsang, D.C.W.; Wang, Y.; Zhang, C. Phosphorus mobilization in lake sediments: Experimental evidence of strong control by iron and negligible influences of manganese redox reactions. Environ. Pollut. 2019, 246, 472–481. [Google Scholar] [CrossRef] [PubMed]
  55. Leslie, A.W.; Lamp, W.O. Burrowing macroinvertebrates alter phosphorus dynamics in drainage ditch sediments. Aquat. Sci. 2019, 81, 23. [Google Scholar] [CrossRef]
  56. McArthur, J.M.; Ravenscroft, P.; Safiulla, S.; Thirlwall, M.F. Arsenic in groundwater: Testing pollution mechanisms for sedimentary aquifers in Bangladesh. Water Resour. Res. 2001, 37, 109–117. [Google Scholar] [CrossRef]
  57. Arsic, M.; Teasdale, P.R.; Welsh, D.T.; Johnston, S.G.; Burton, E.D.; Hockmann, K.; Bennett, W.W. Diffusive gradients in thin films reveals differences in antimony and arsenic mobility in a contaminated wetland sediment during an oxic-anoxic transition. Environ. Sci. Technol. 2018, 52, 1118–1127. [Google Scholar] [CrossRef]
  58. Liem-Nguyen, V.; Skyllberg, U.; Björn, E. Thermodynamic modeling of the solubility and chemical speciation of mercury and methylmercury driven by organic thiols and micromolar sulfide concentrations in boreal wetland soils. Environ. Sci. Technol. 2017, 51, 3678–3686. [Google Scholar] [CrossRef] [PubMed]
  59. Caille, N.; Tiffreau, C.; Leyval, C.; Morel, J.L. Solubility of metals in an anoxic sediment during prolonged aeration. Sci. Total Environ. 2003, 301, 239–250. [Google Scholar] [CrossRef]
  60. Chou, P.I.; Ng, D.Q.; Li, I.C.; Lin, Y.P. Effects of dissolved oxygen, pH, salinity and humic acid on the release of metal ions from PbS, CuS and ZnS during a simulated storm event. Sci. Total Environ. 2018, 624, 1401–1410. [Google Scholar] [CrossRef]
  61. Luquet, G. Biomineralizations: Insights and prospects from crustaceans. Zookeys 2012, 176, 103. [Google Scholar] [CrossRef] [PubMed] [Green Version]
  62. Nagasawa, H. The crustacean cuticle: Structure, composition and mineralization. Front. Biosci. 2012, 4, 711–720. [Google Scholar] [CrossRef]
  63. Kwon, H.K.; Oh, S.J.; Yang, H.S.; Kim, P.J. Phytoremediation by benthic microalgae (BMA) and light emitting diode (LED) in eutrophic coastal sediments. Ocean. Sci. J. 2015, 50, 87–96. [Google Scholar] [CrossRef]
  64. Kwon, H.K.; Jeon, J.Y.; Oh, S.J. Potential for heavy metal (copper and zinc) removal from contaminated marine sediments using microalgae and light emitting diodes. Ocean. Sci. J. 2017, 52, 57–66. [Google Scholar] [CrossRef]
  65. Honglikith, D.; Harada, M.; Hiramatsu, K.; Tabata, T.; Ozaki, A. Anoxification recovery using underwater LED irradiation and influence of its optical spectrum on water quality improvement. Paddy Water Environ. 2022, 20, 153–175. [Google Scholar] [CrossRef]
  66. Hao, A.; Su, M.; Kobayashi, S.; Zhao, M.; Iseri, Y. Multiple roles of bamboo as a regulator of cyanobacterial bloom in aquatic systems. Sci. Rep. 2022, 12, 1605. [Google Scholar] [CrossRef] [PubMed]
Figure 1. Water and sediment sampling locations in south Lake Taihu, China and an inflow river ((a) map, (b) lake site, (c) river site, (d) water quality at sampling time). TN: total nitrogen, TP: total phosphorus, COD: chemical oxygen demand, OM: organic matter, T: temperature, EC: electrical conductivity, DO: dissolved oxygen, ORP: oxidation-reduction potential, Chl-a: chlorophyll a.
Water 14 01839 g001
Figure 2. Schema of the three types of microcosms.
Water 14 01839 g002
Figure 3. Changes in water quality ((a) DO, (b) pH, (c) ORP, (d) EC, (e) Chl-a, (f) TN, (g) form of N, (h) TP, (i) form of P, (j) silicate) of microcosms with different treatments and sediment sources during the experiment. Significant difference among treatments at the end of the experiment is shown by > sign and the first character of treatment.
Water 14 01839 g003
Figure 4. Concentrations of 15 metals in the water of the microcosms with lake or river sediment. Metals were arrayed in the decreasing order of the control to LED ratio from left to right. 0-d: day 0, C: control.
Water 14 01839 g004
Figure 5. Lateral and top view of the microcosm (one of triplicate) with different treatments (control, aeration, LED) and sediment sources (lake, river) at the end of experiment (a), depth of the oxic layer (b), and abundance of invertebrate tunnels at different vertical positions of sediment (upper, middle, and lower) (c). Error bars show 1 SD.
Water 14 01839 g005
Figure 6. Relative abundance of bacterial species at the phylum level (a sequencing result of V3–V4 regions in 16S rRNA genes) in 18 water and sediment samples.
Water 14 01839 g006
Publisher’s Note: MDPI stays neutral with regard to jurisdictional claims in published maps and institutional affiliations.

