
The 21st August 2020 Flood in Douala (Cameroon): A Major Urban Flood Investigated with 2D HEC-RAS Modeling

 ,
,  , ,
, , 
Abstract
1. Introduction
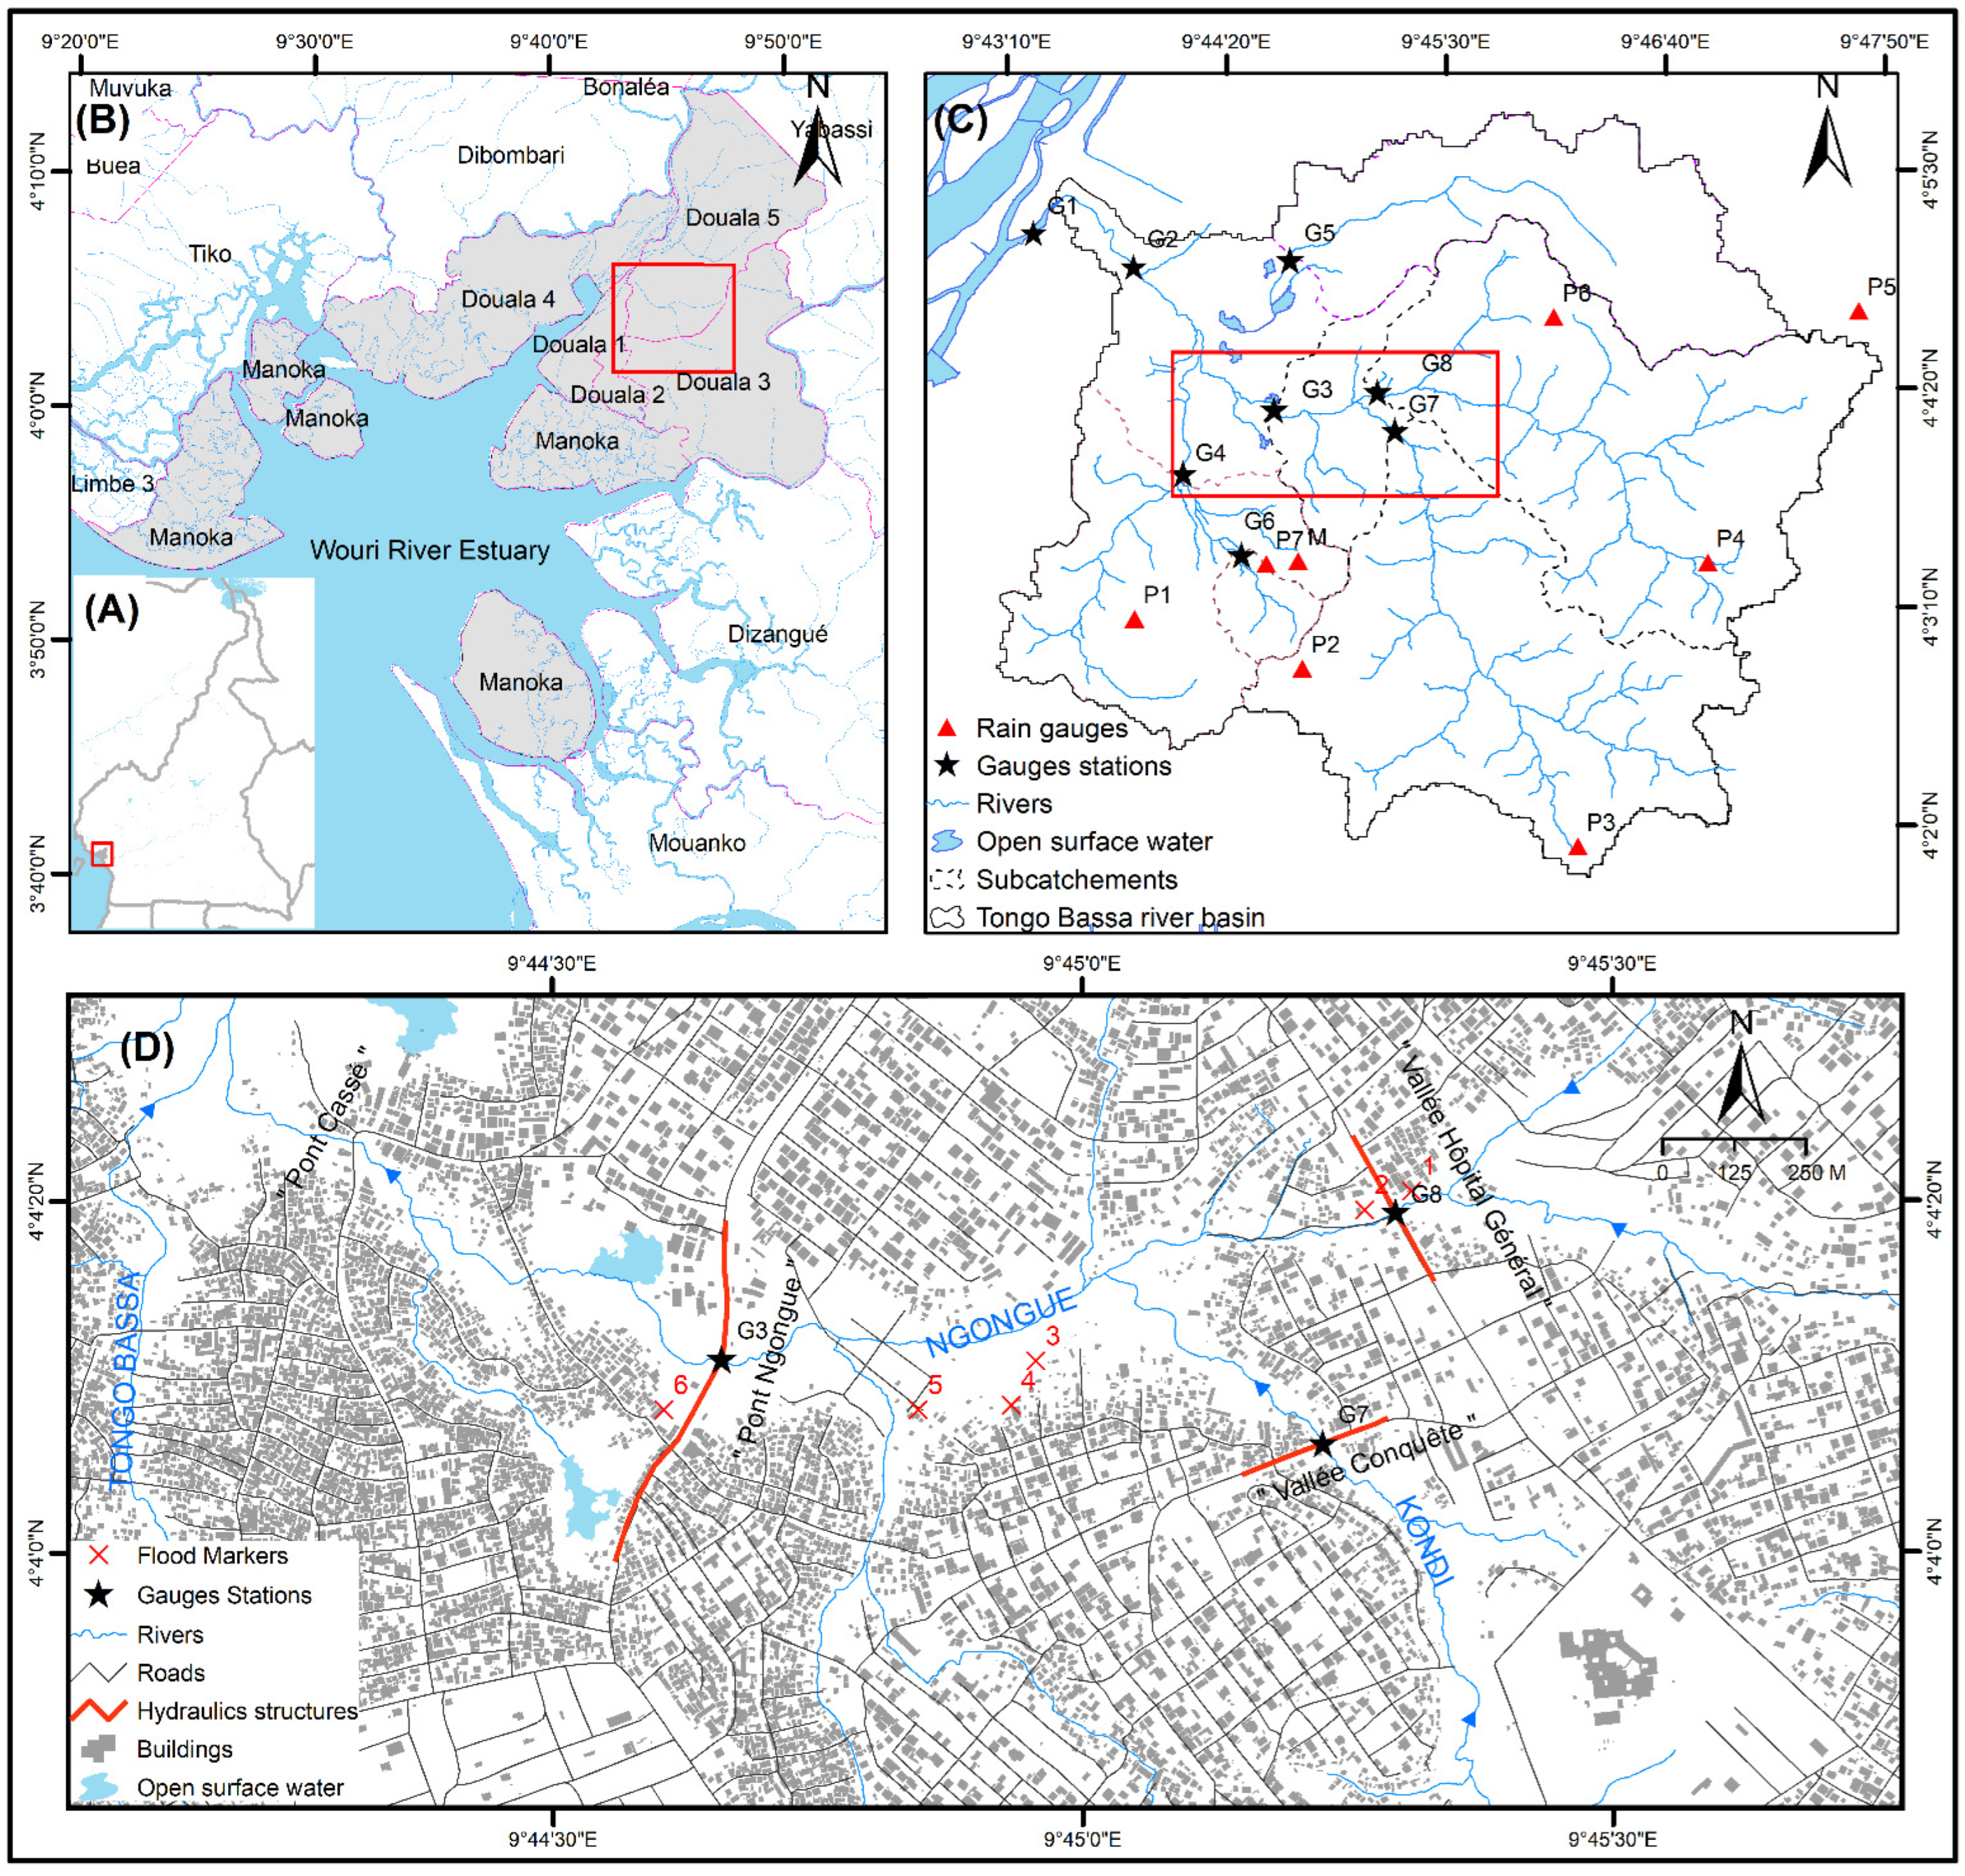
2. Study Area
3. Data Acquisition
3.1. Topographic Data
3.2. Hydrological and Hydraulic Data
3.3. Land-Use and Built-Up Data
4. Methodology
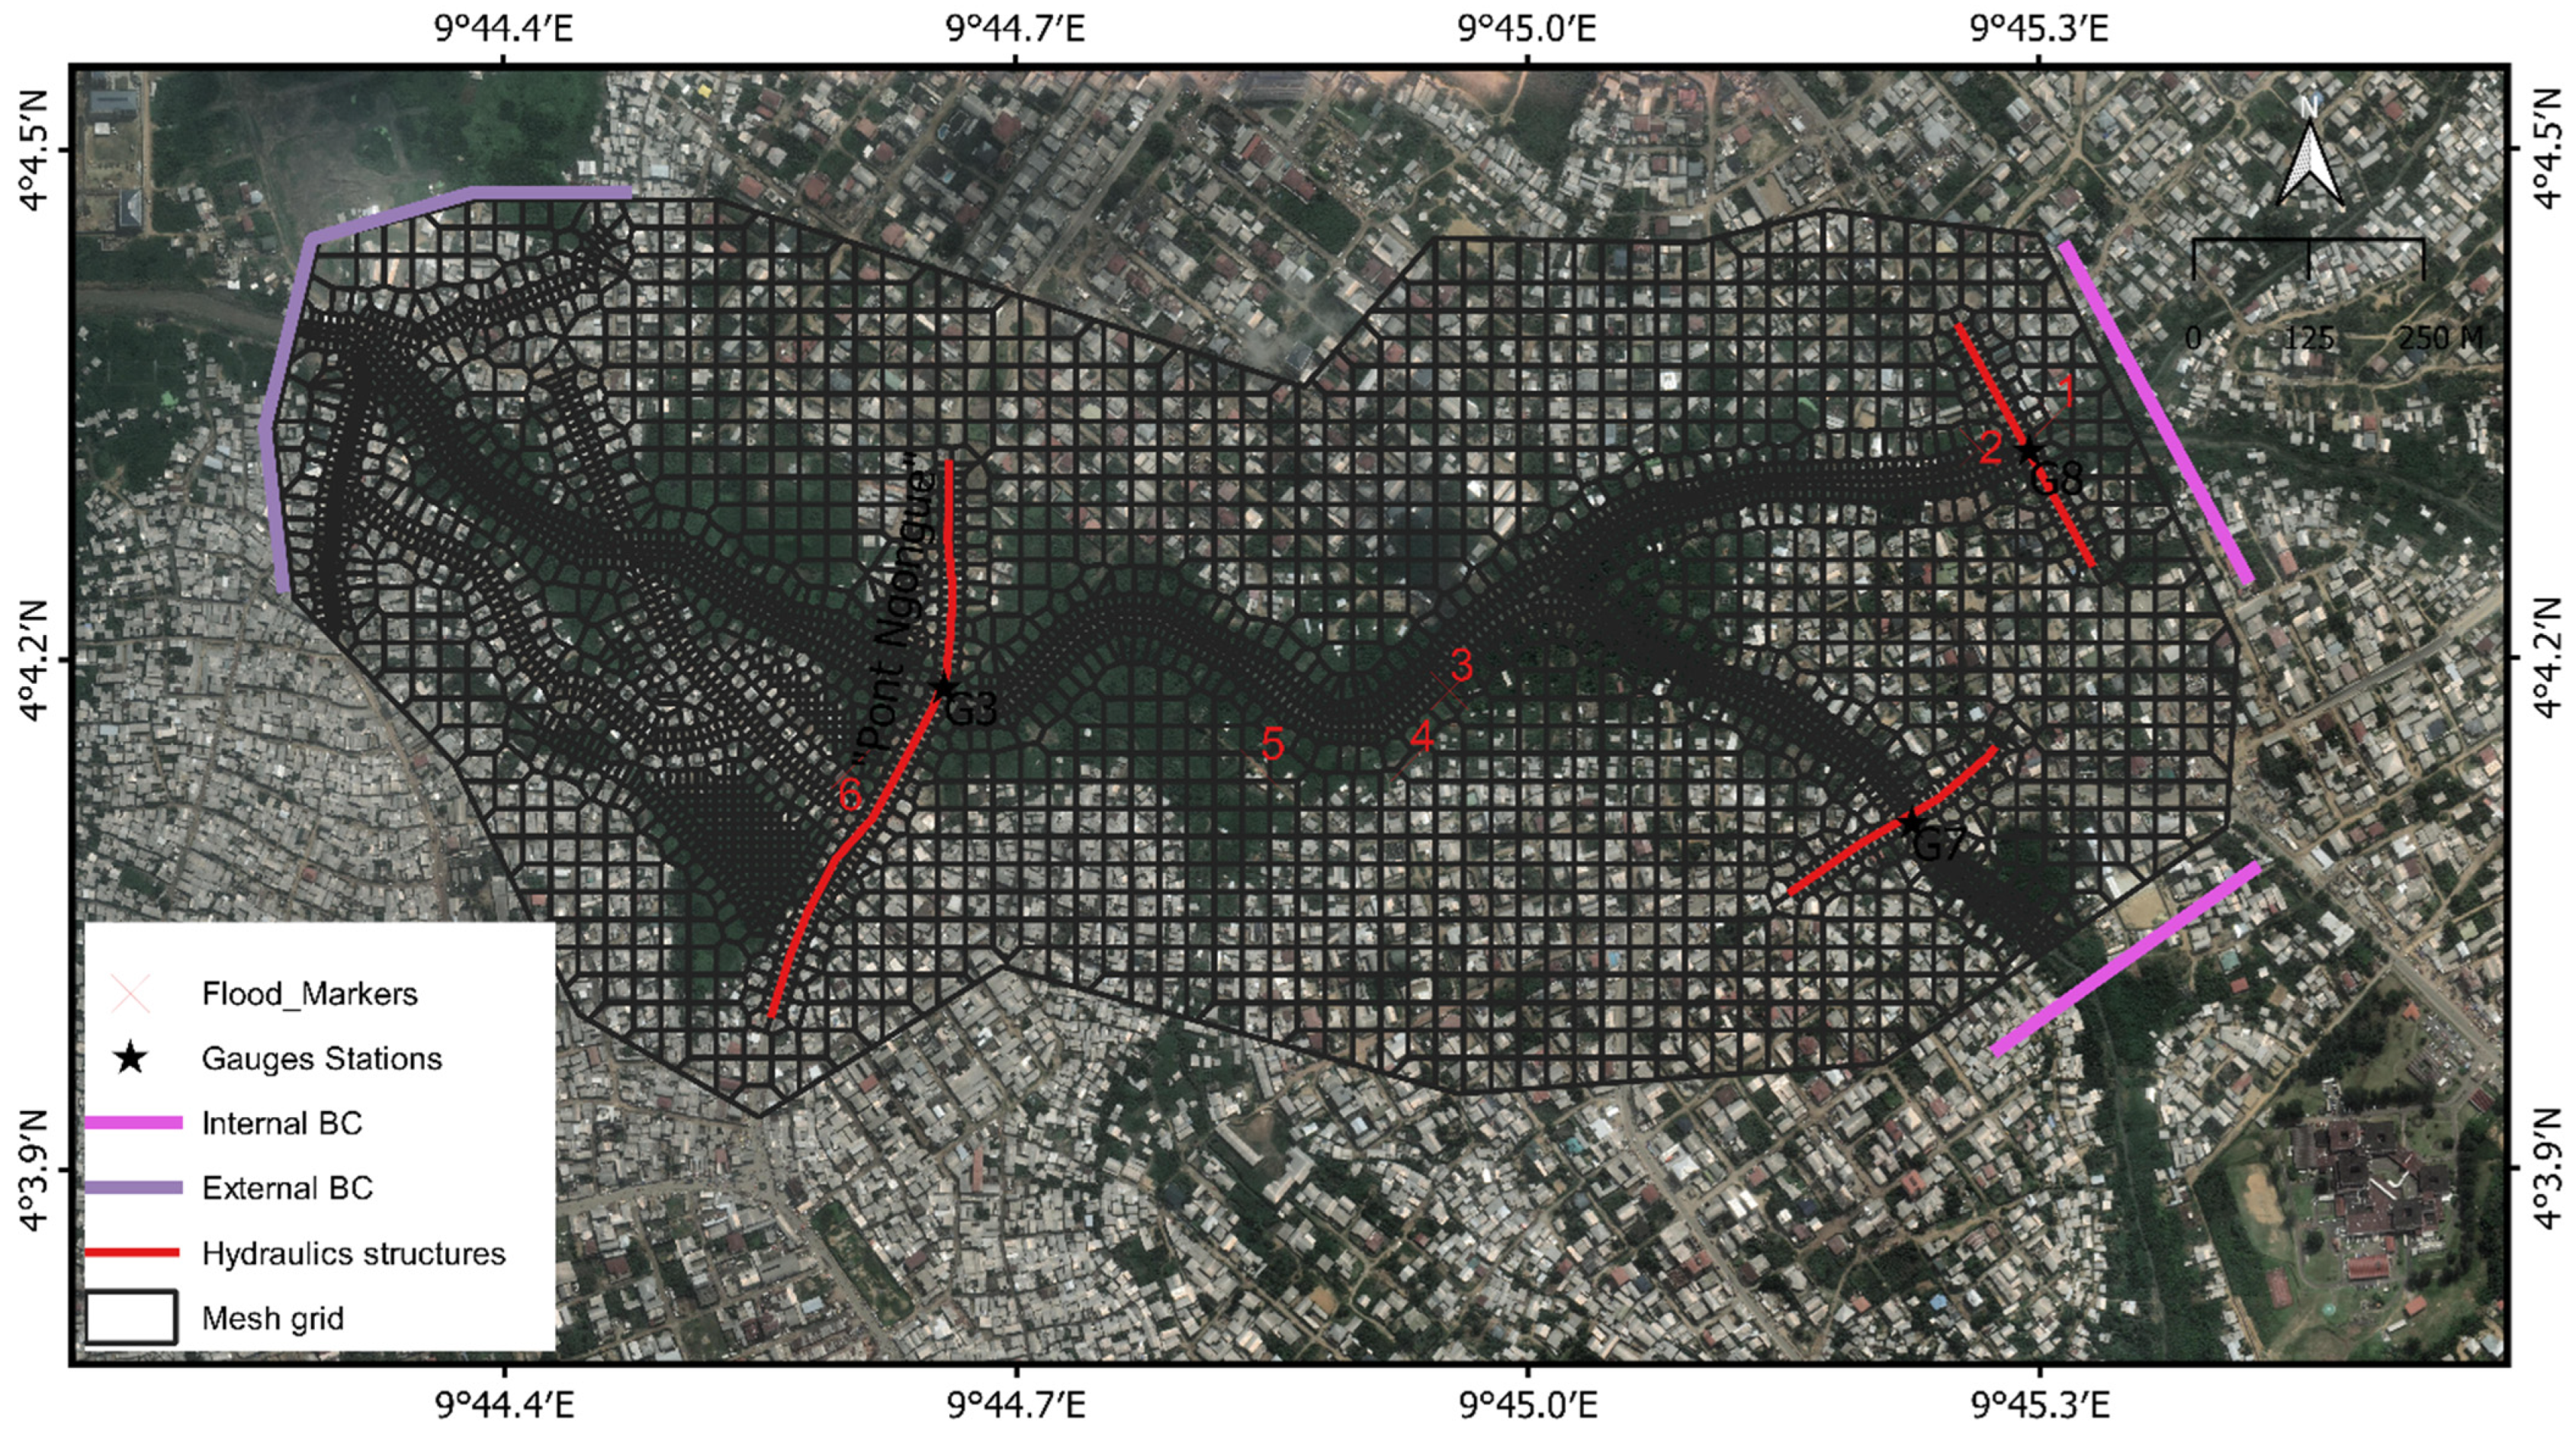
4.1. HEC-RAS Modeling
4.2. HEC-RAS Model Calibration
4.3. Flood Hazard Assessment
5. Results
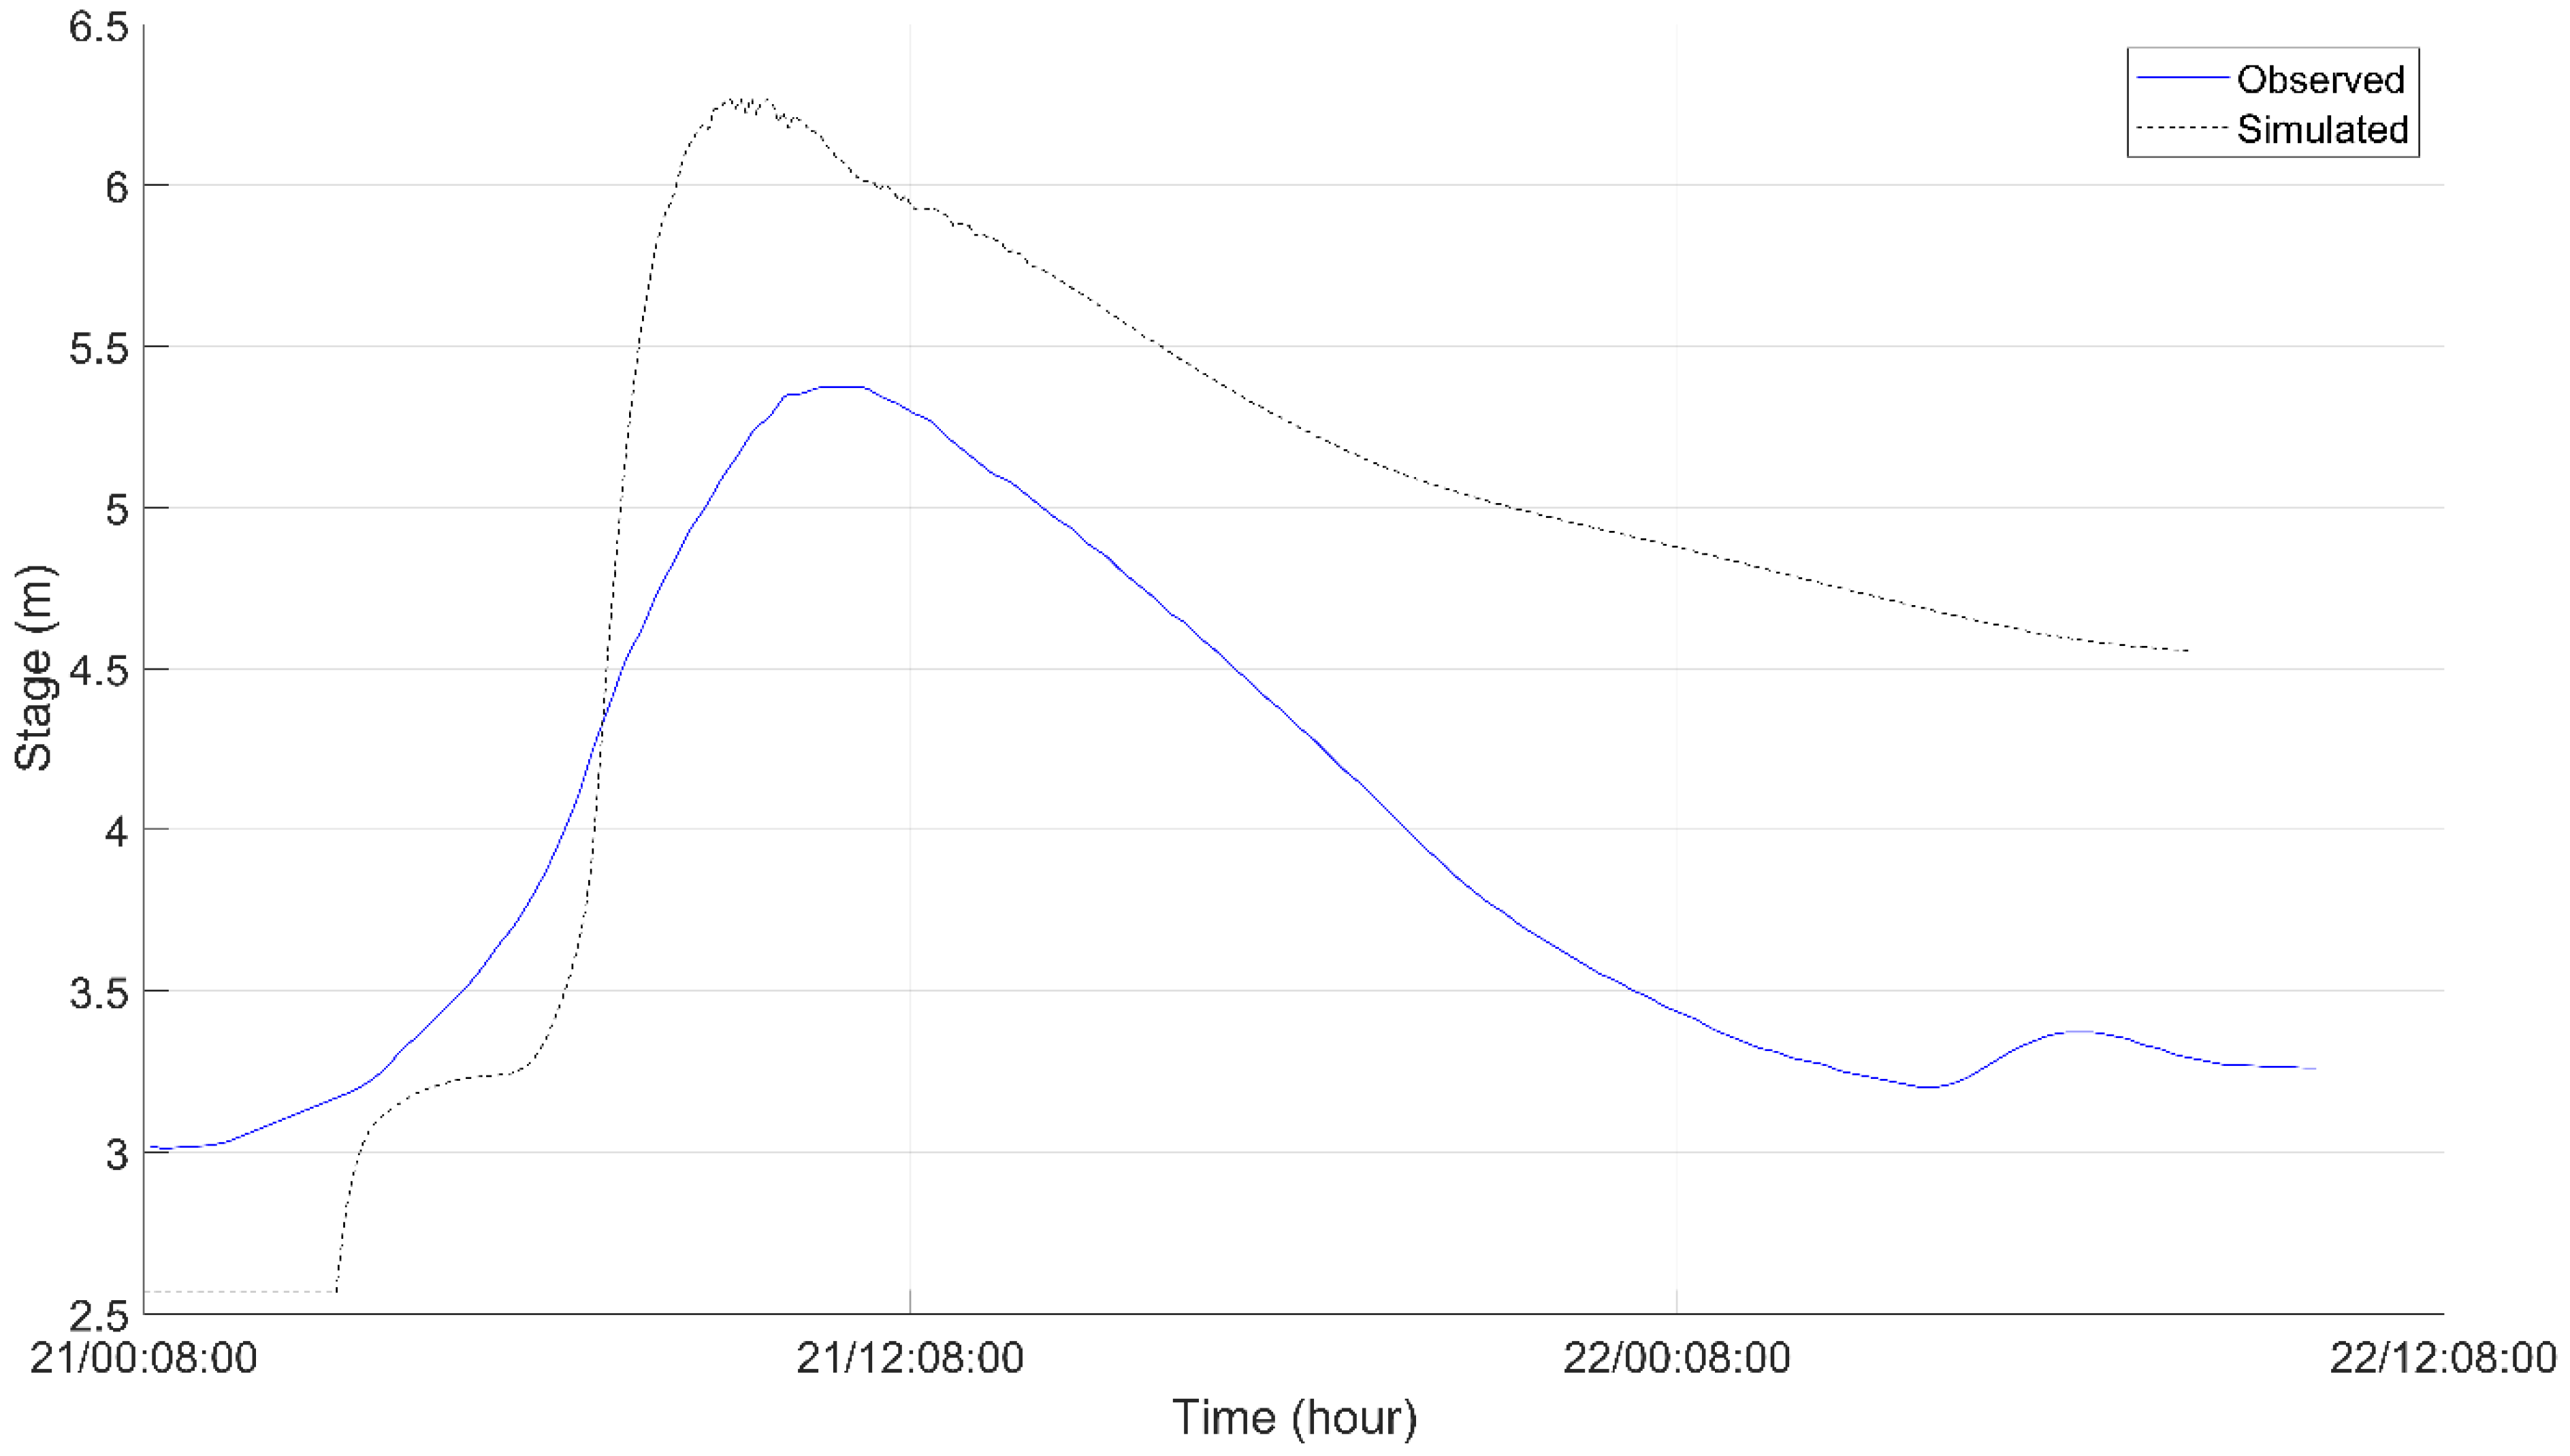
5.1. Calibration of the 2D HEC-RAS Model
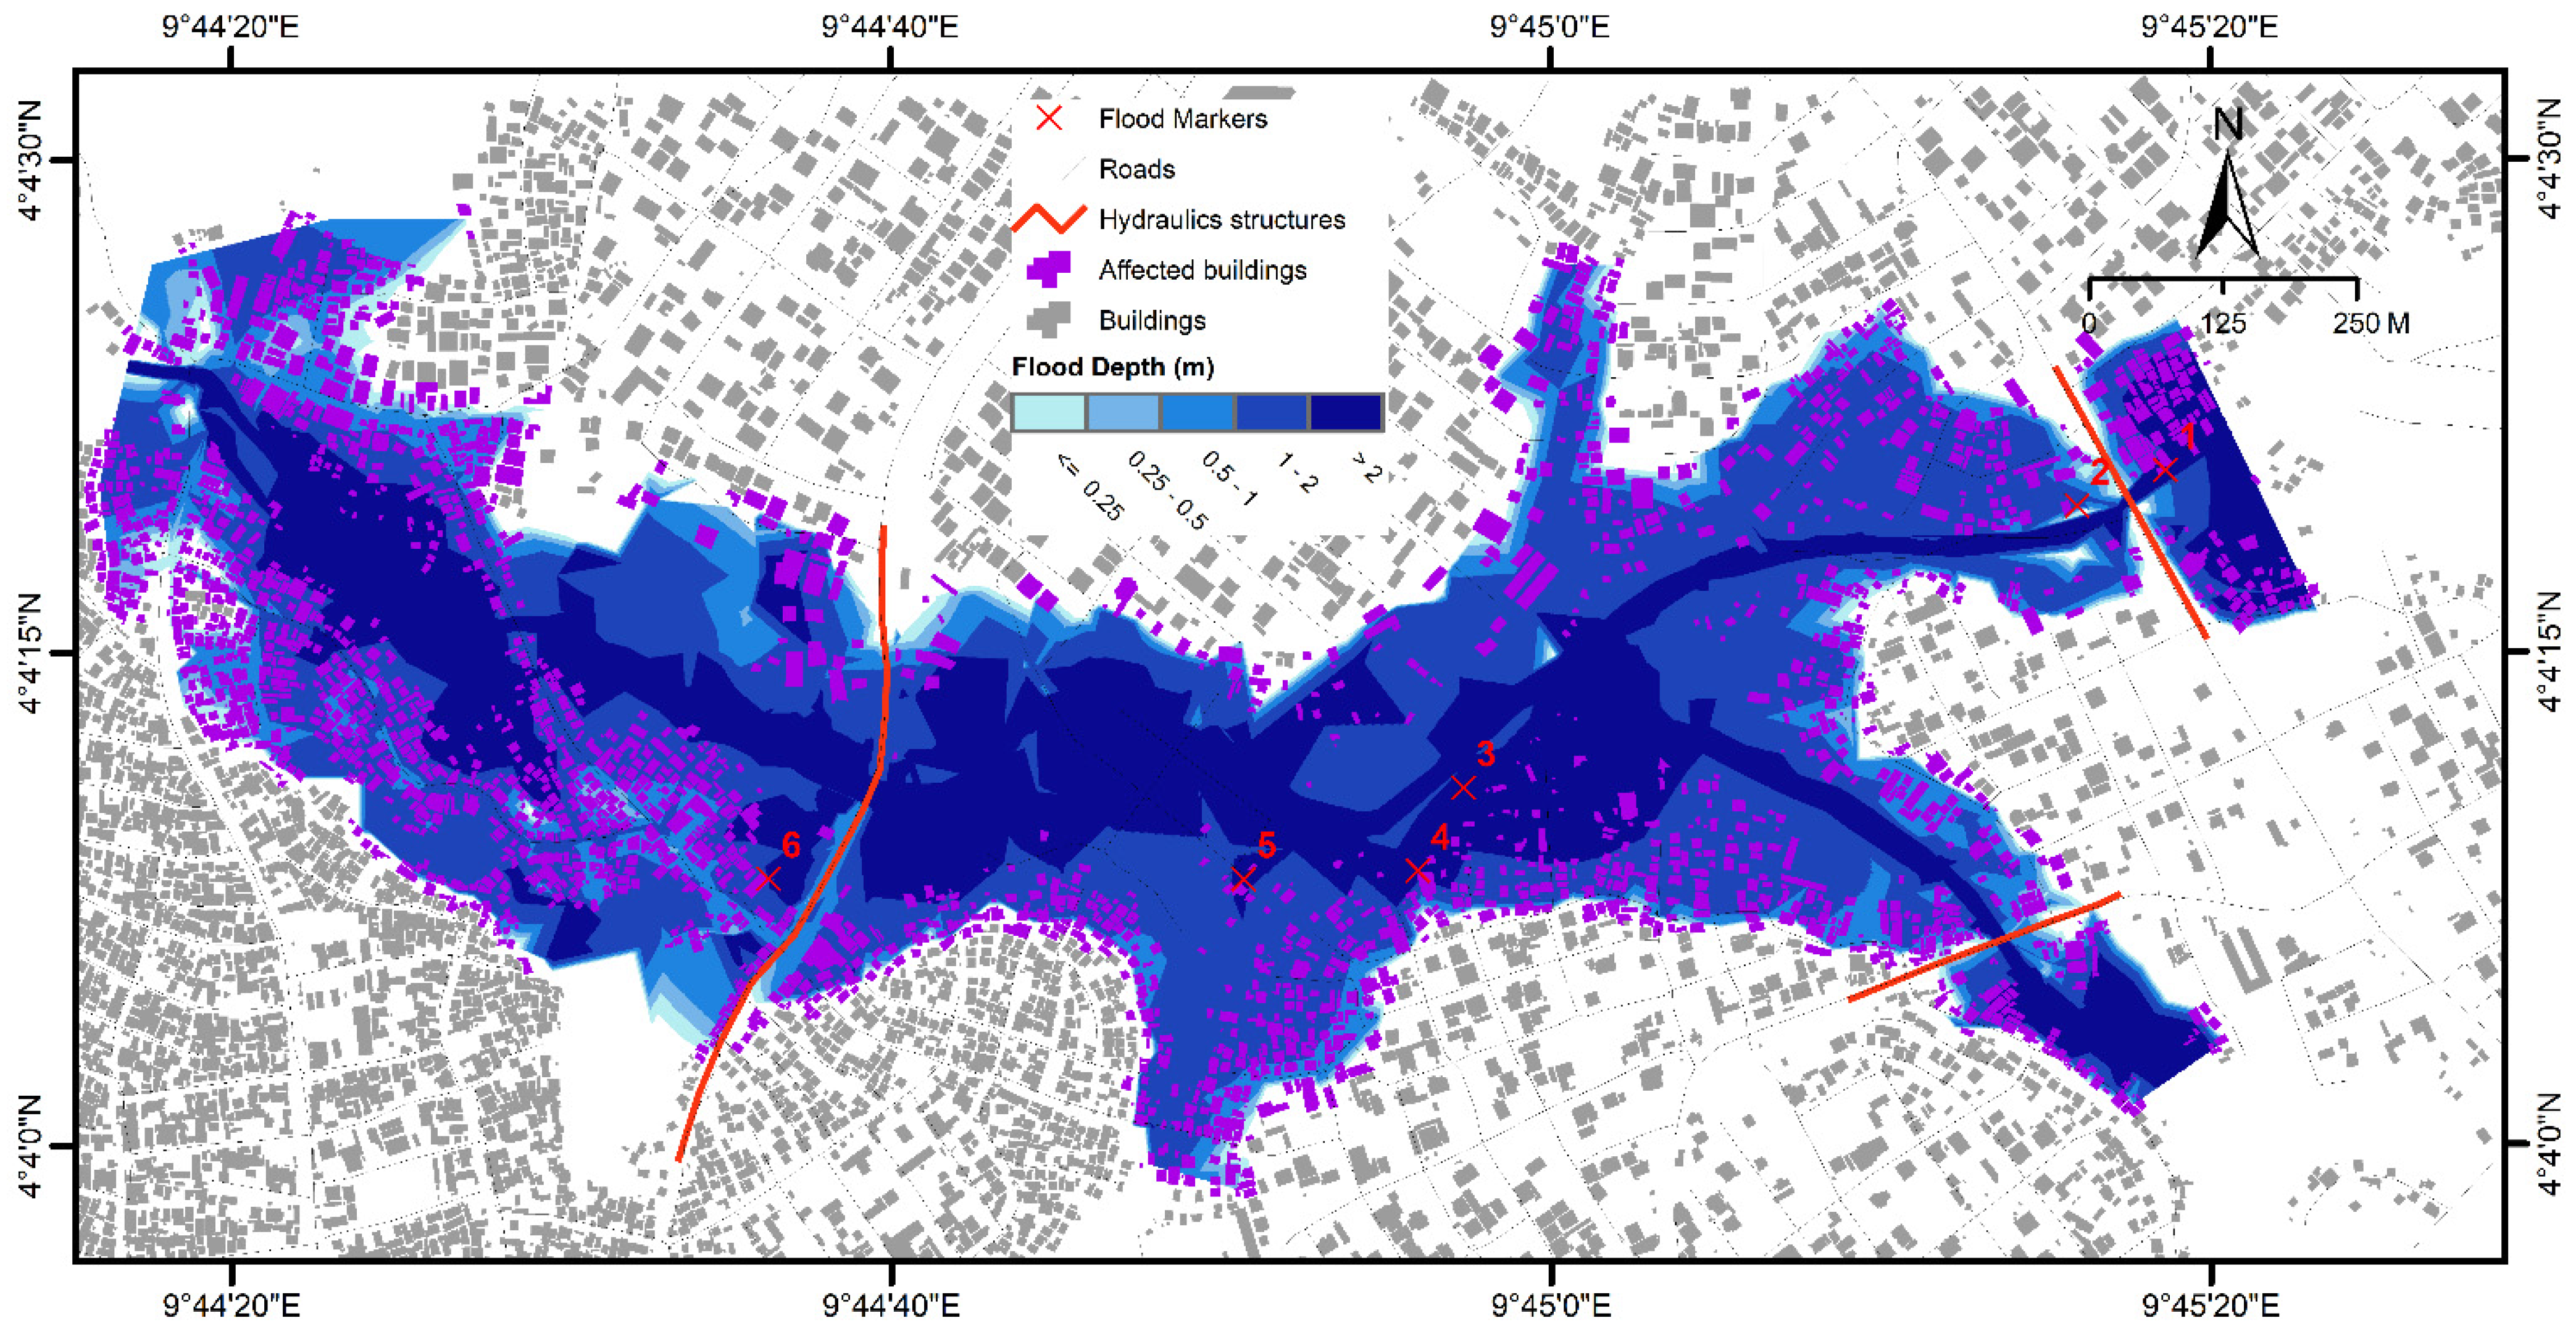
5.2. Flood Extent and Flood Depth
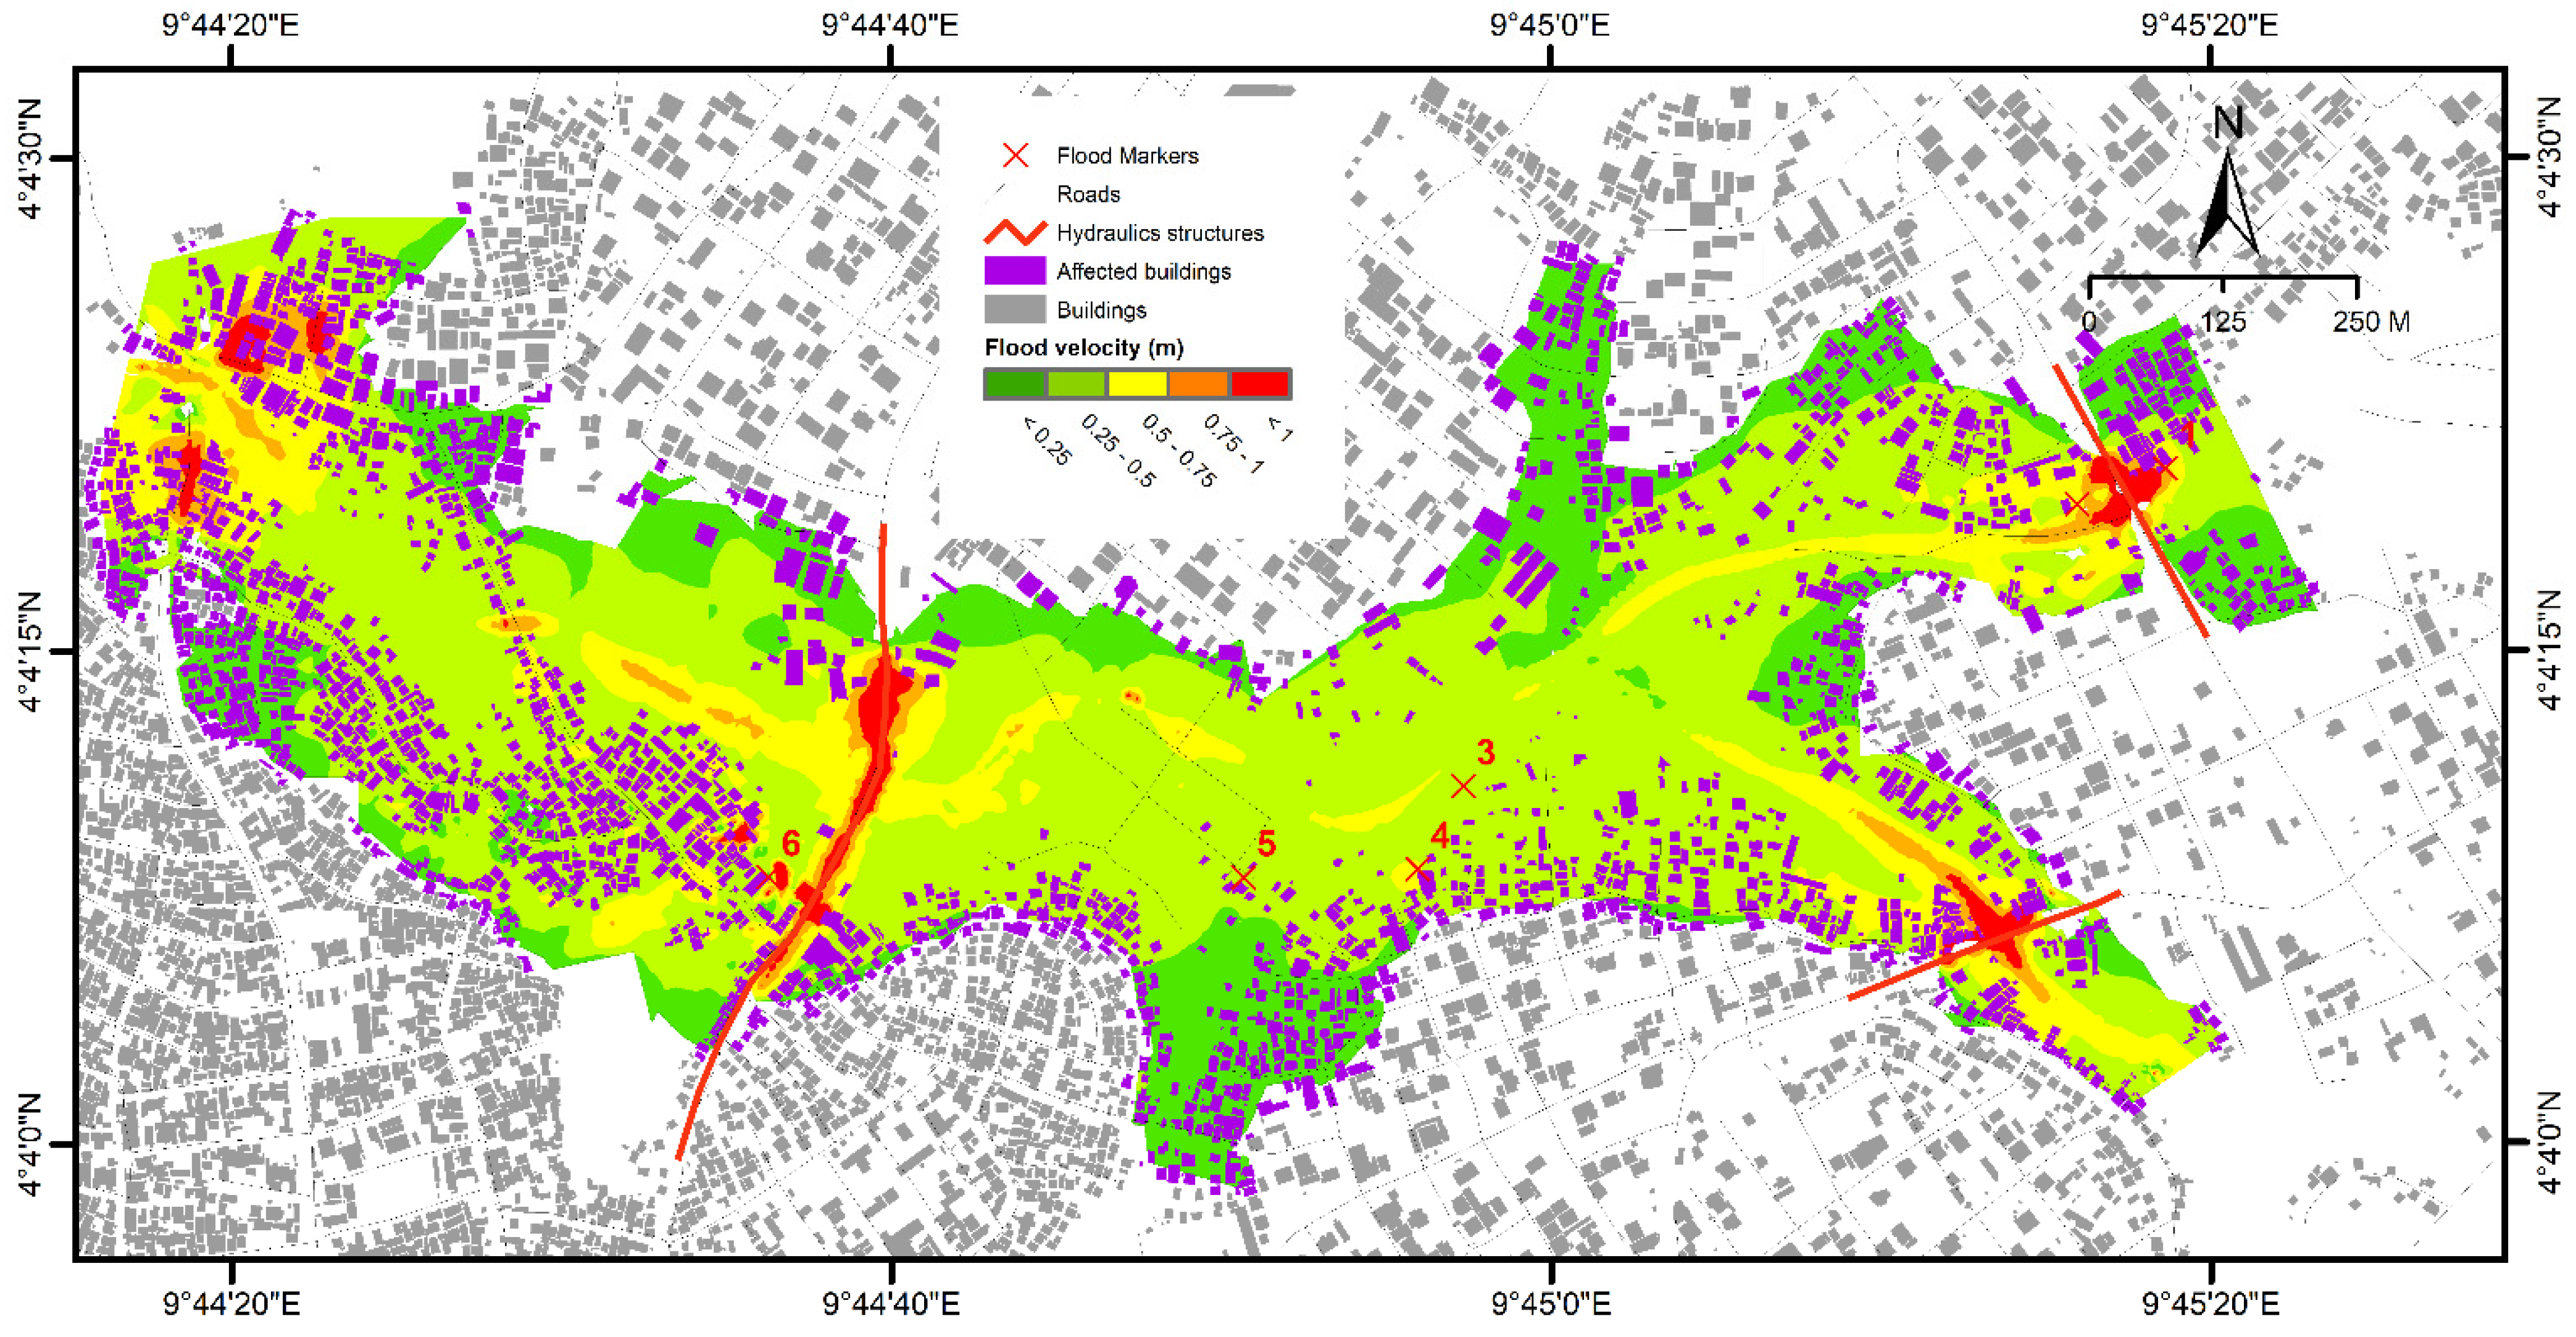
5.3. Flood Velocity
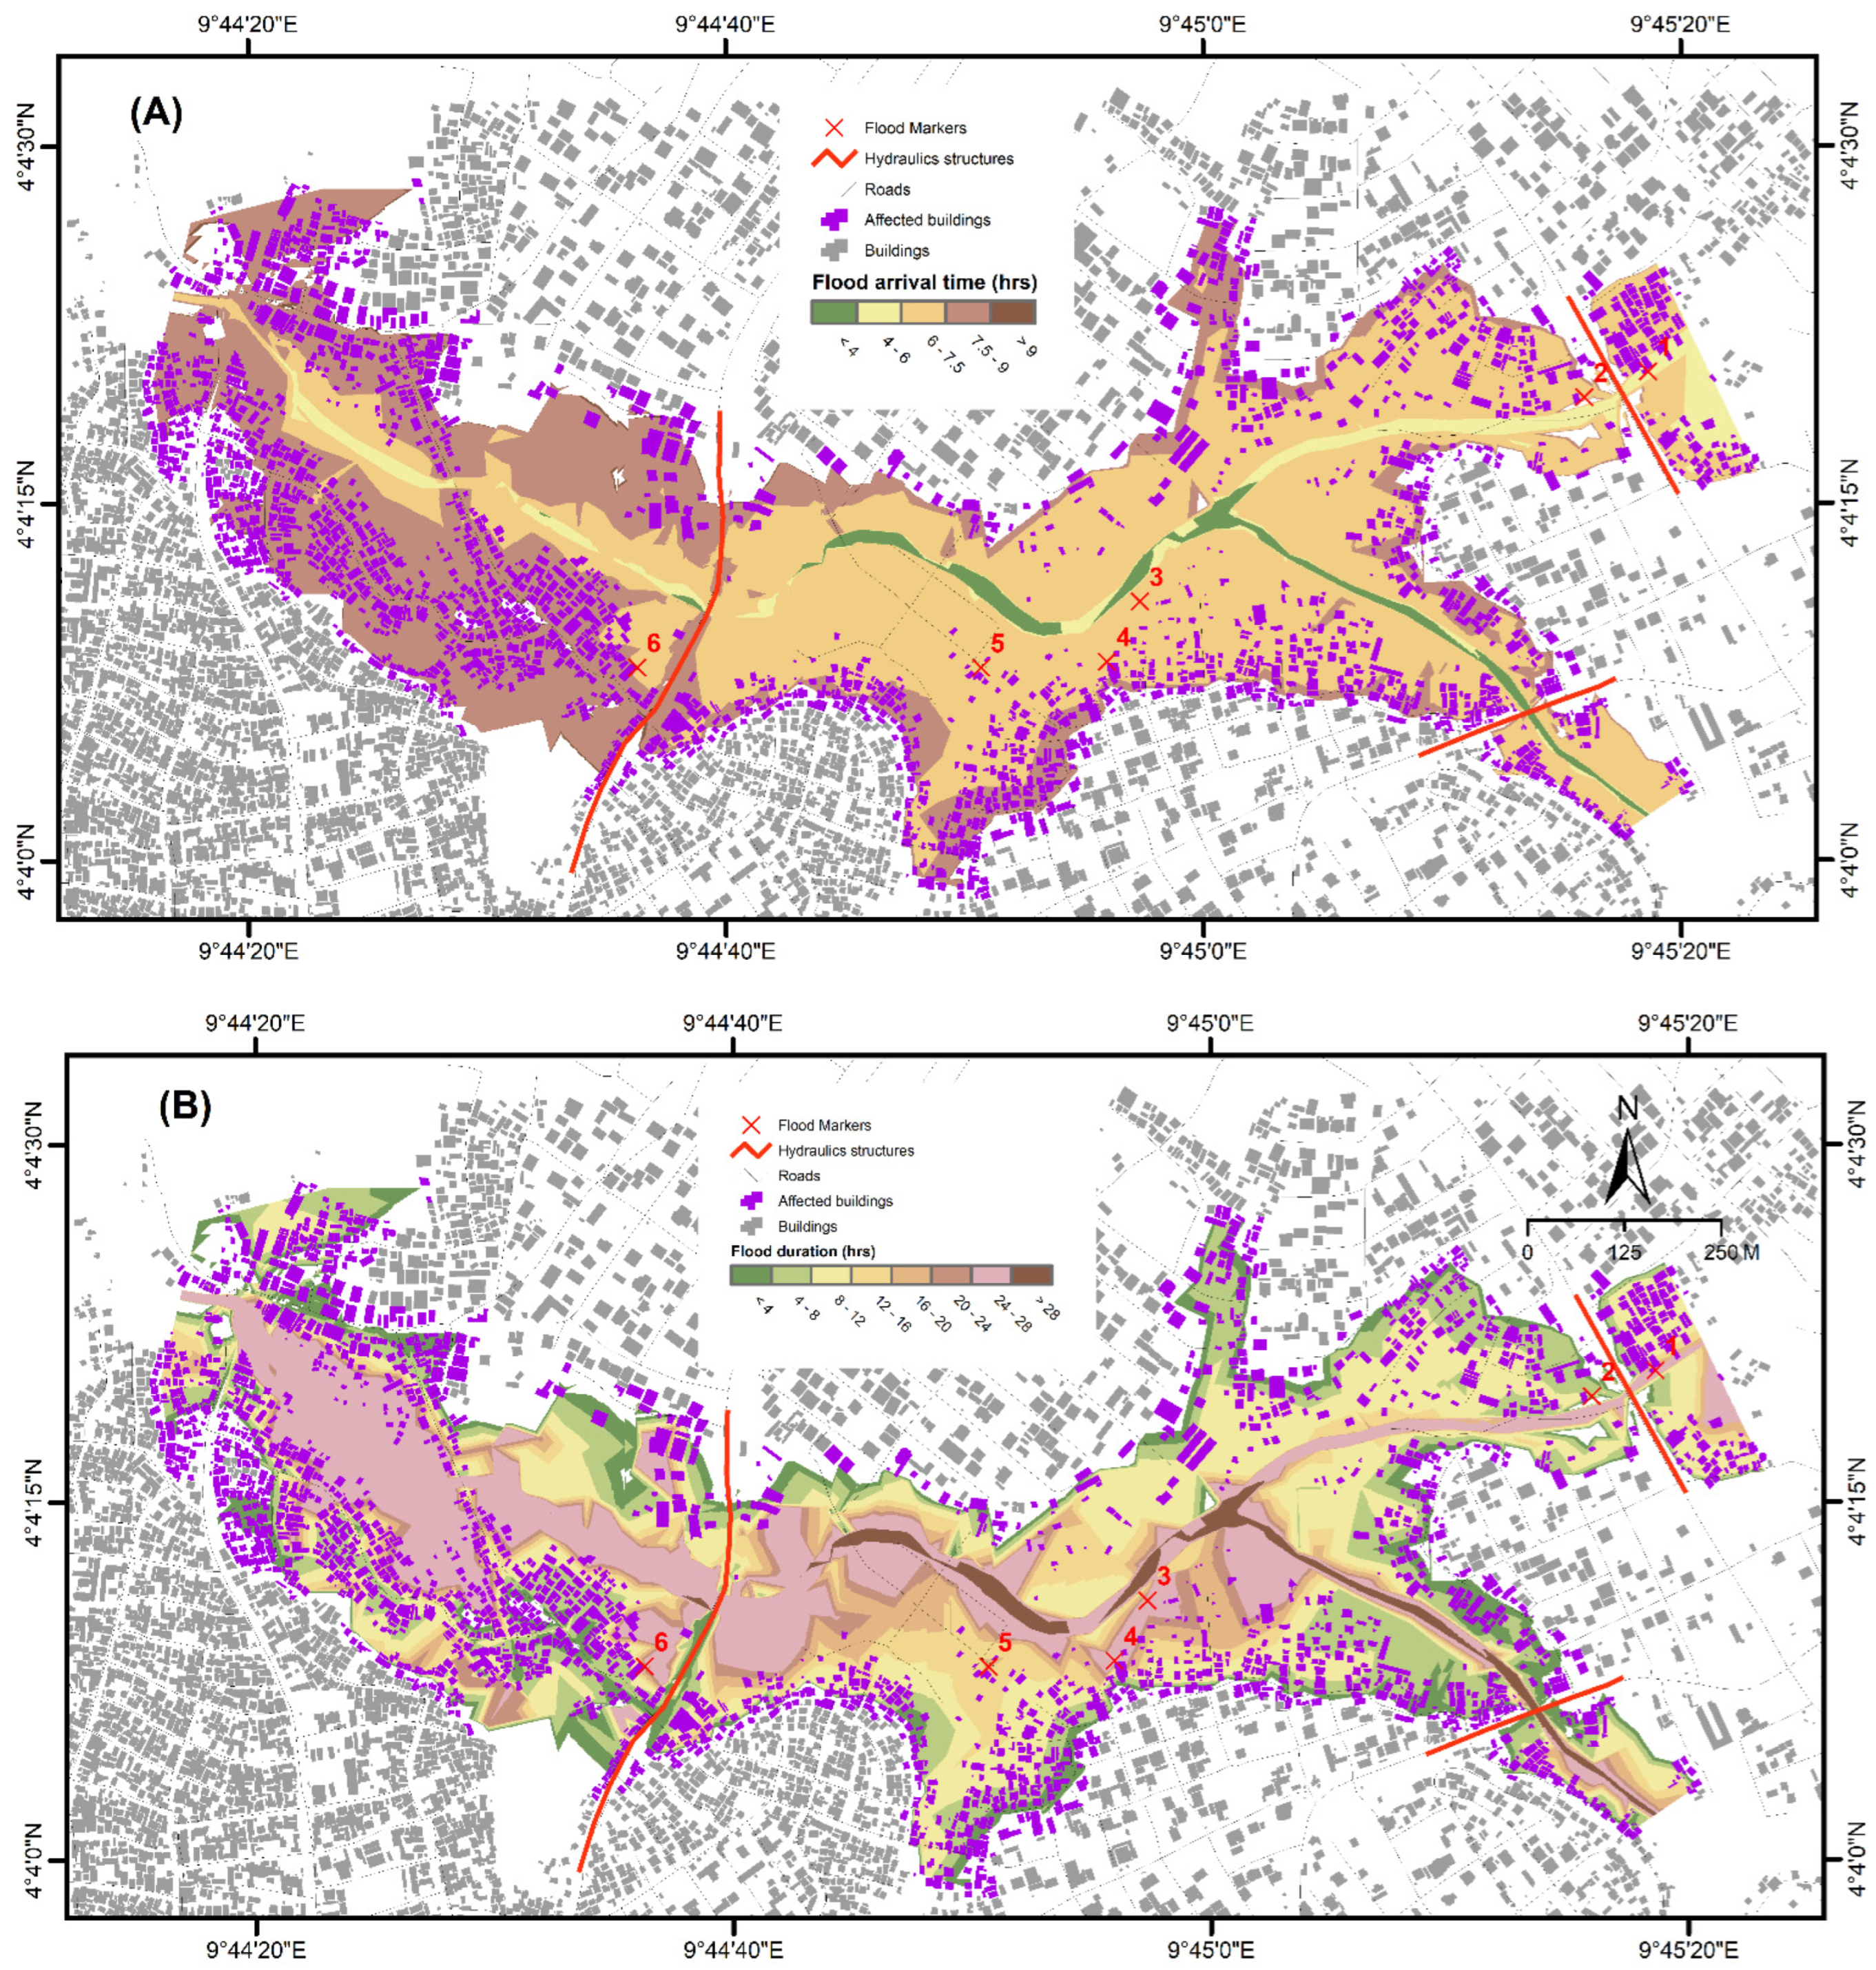
5.4. Flood Arrival Times and Duration
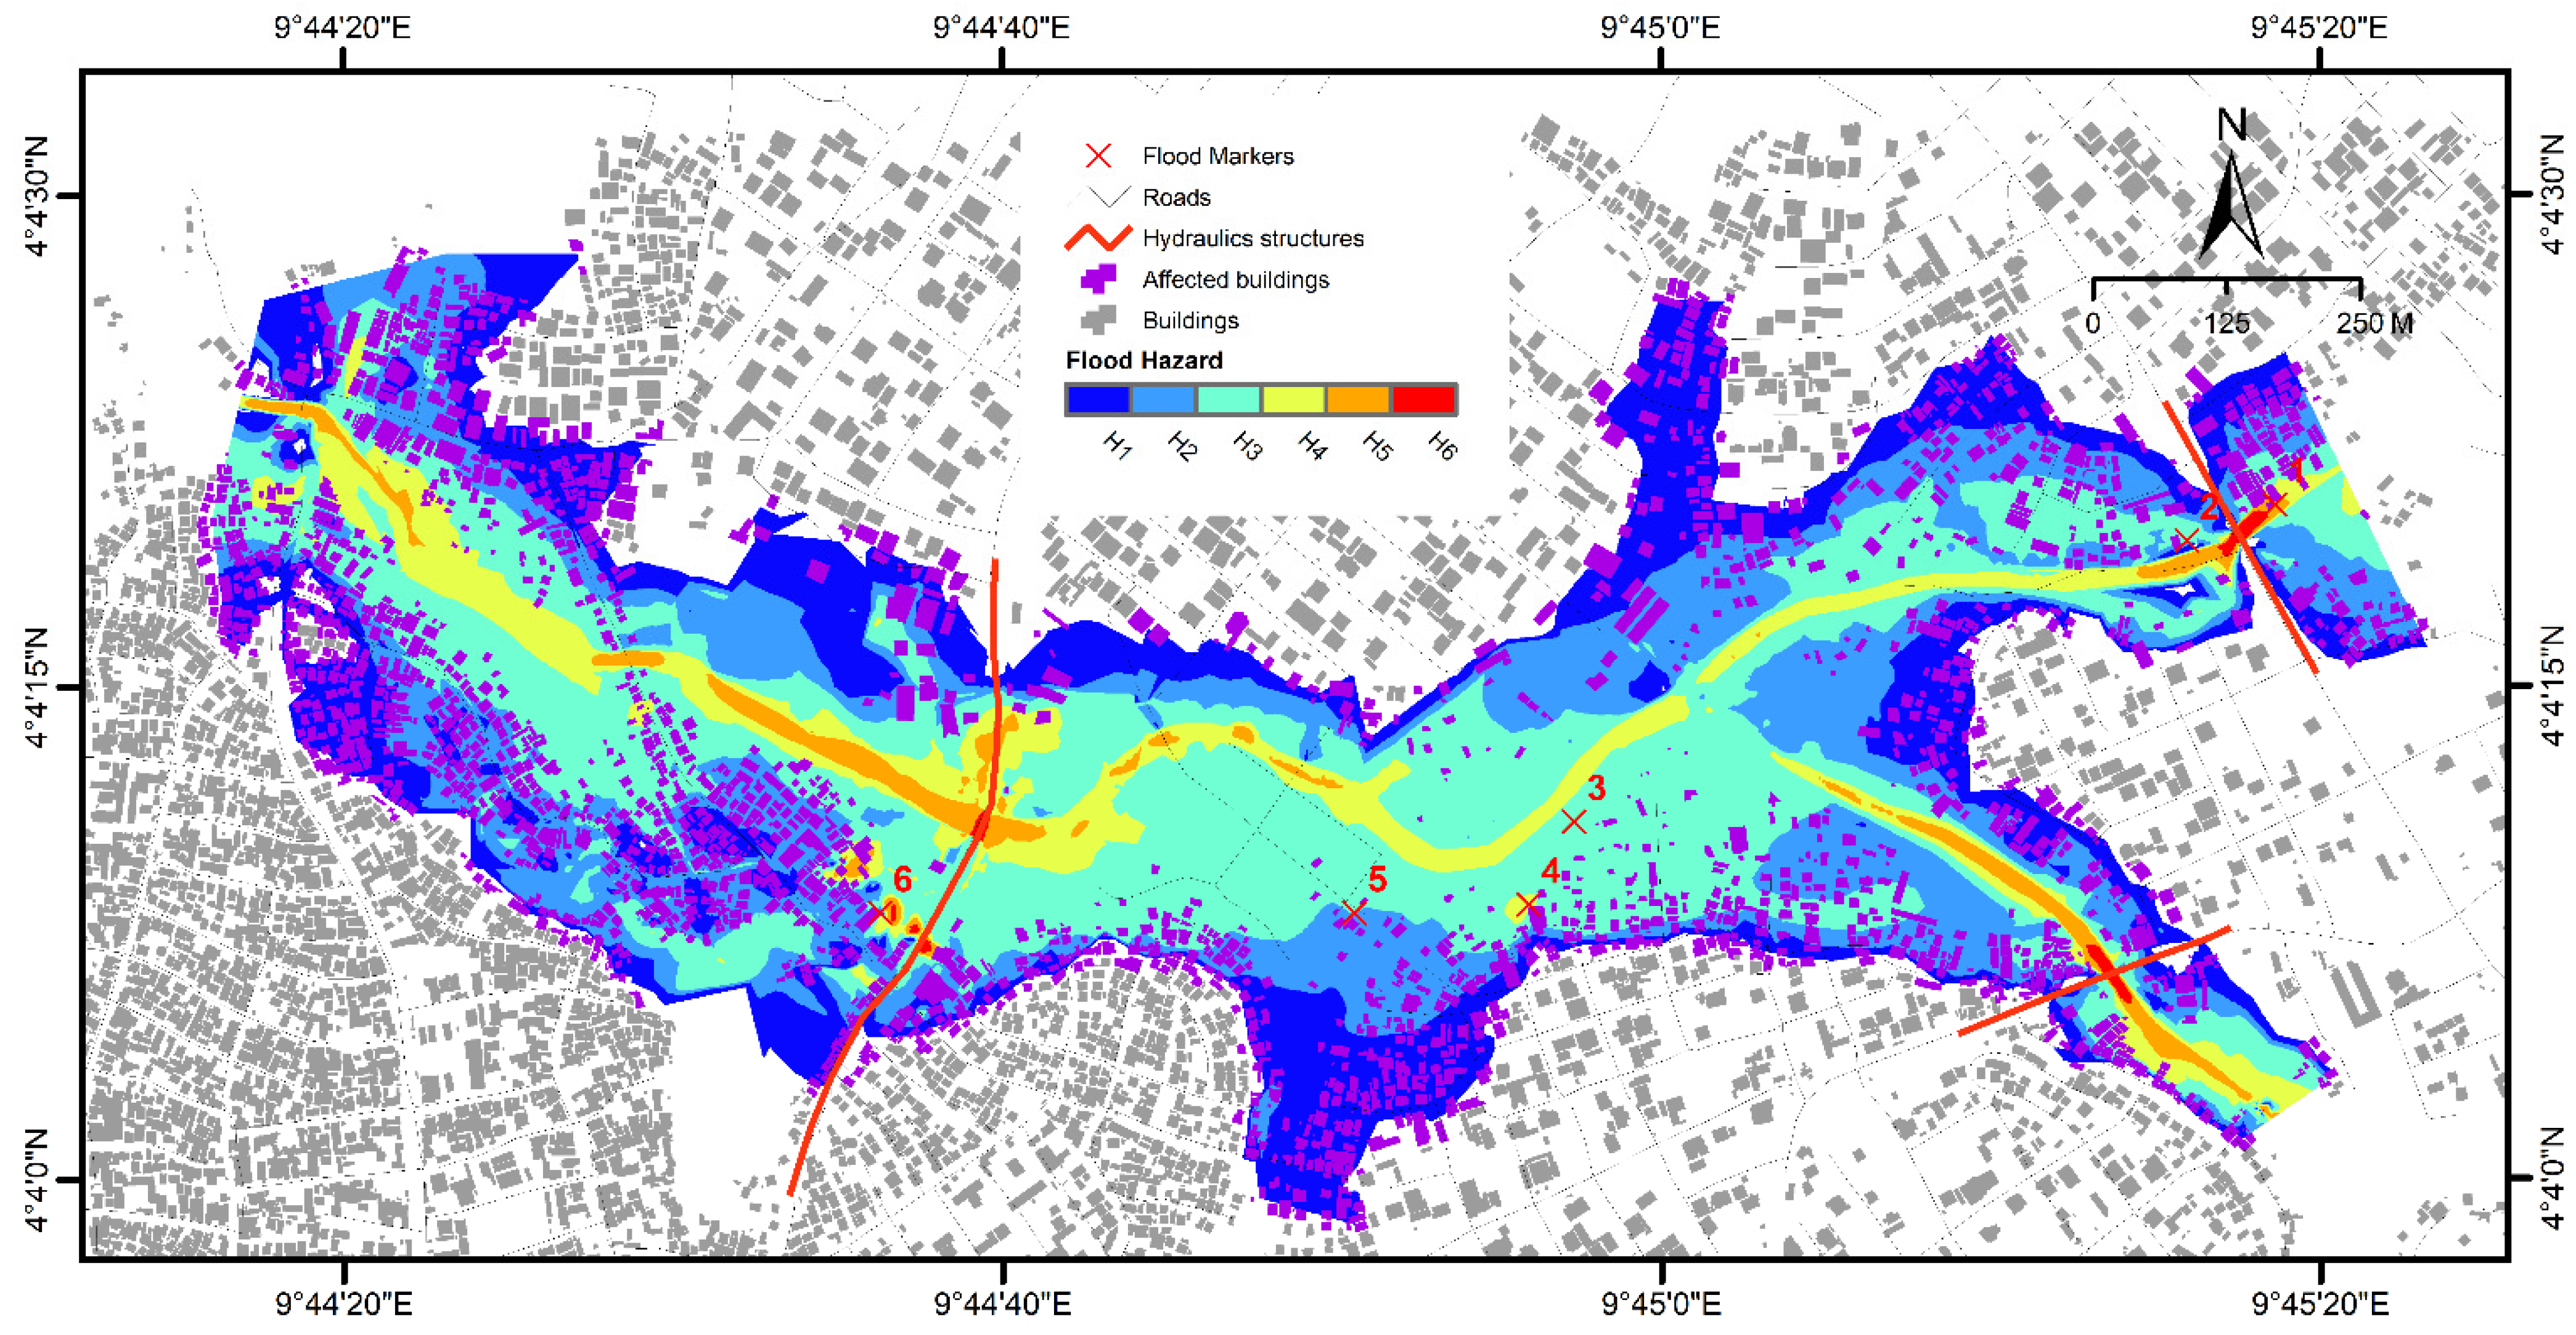
5.5. Flood Hazard Assessment
6. Discussions
7. Conclusions
Author Contributions
Funding
Data Availability Statement
Acknowledgments
Conflicts of Interest
References
- Mann, M.E.; Emanuel, K.A. Atlantic Hurricane Trends Linked to Climate Change. Eos Trans. Am. Geophys. Union 2006, 87, 233. [Google Scholar] [CrossRef]
- Knutson, T.R.; McBride, J.L.; Chan, J.; Emanuel, K.; Holland, G.; Landsea, C.; Held, I.; Kossin, J.P.; Srivastava, A.K.; Sugi, M. Tropical Cyclones and Climate Change. Nat. Geosci. 2010, 3, 157–163. [Google Scholar] [CrossRef]
- Diaconu, D.C.; Costache, R.; Popa, M.C. An Overview of Flood Risk Analysis Methods. Water 2021, 13, 474. [Google Scholar] [CrossRef]
- Nematchoua, M.K.; Orosa, J.A.; Reiter, S. Climate Change: Variabilities, Vulnerabilities and Adaptation Analysis—A Case of Seven Cities Located in Seven Countries of Central Africa. Urban Clim. 2019, 29, 100486. [Google Scholar] [CrossRef]
- Saha, F.; Nkemta, D.T.; Tchindjang, M.; Voundi, É.; Fendoung, P.M. Production des risques dits «naturels» dans les grands centres urbains du Cameroun. Nat. Sci. Soc. 2018, 26, 418–433. [Google Scholar] [CrossRef]
- Tchindjang, M.; Fendoung, P.M. Une Afrique Atlantique avec des Villes sous L’eau! Construire des Villes Côtières Sans Inon-dations? 2019, p. 30. Available online: http://hdl.handle.net/2268/238401 (accessed on 12 July 2021).
- Vedeld, T.; Kombe, W.J.; Kweka-Msale, C.; Ndour, N.M.; Coly, A.; Hellevik, S. Multi-Level Governance, Resilience to Flood Risks and Coproduction in Urban Africa. In Urban Vulnerability and Climate Change in Africa: A Multidisciplinary Approach; Pauleit, S., Coly, A., Fohlmeister, S., Gasparini, P., Jørgensen, G., Kabisch, S., Kombe, W.J., Lindley, S., Simonis, I., Yeshitela, K., Eds.; Future City; Springer International Publishing: Cham, Switzerland, 2015; pp. 287–318. ISBN 978-3-319-03982-4. [Google Scholar]
- Wambo, E.M.N. Hygiène Du Cadre de Vie et Action Communautaire à Nylon–Douala. In Visages et Défis des Principales Villes Camerounaises; Université de Montréal: Montréal, QB, Canada, 2008; Volume 7, ISBN 978-2-921903-01-1. [Google Scholar]
- Fonteh, M.; Esteves, L.S.; Gehrels, W.R. Mapping and Valuation of Ecosystems and Economic Activities along the Coast of Cameroon: Implications of Future Sea Level Rise. Coastline Rep. EUCC Int. Approaches Coast. Res. Theory Pract. 2009, 13, 47–63. [Google Scholar]
- Nji Fogwe, Z. Mitigating and Managing Regional Geo-Environmental Hazards within a Decentralisation Transition in Cameroon. J. Hum. Ecol. 2010, 30, 187–195. [Google Scholar] [CrossRef]
- Bang, H.N. General Overview of the Disaster Management Framework in Cameroon. Disasters 2014, 38, 562–586. [Google Scholar] [CrossRef]
- Munji, C.A.; Bele, M.Y.; Nkwatoh, A.F.; Idinoba, M.E.; Somorin, O.A.; Sonwa, D.J. Vulnerability to Coastal Flooding and Response Strategies: The Case of Settlements in Cameroon Mangrove Forests. Environ. Dev. 2013, 5, 54–72. [Google Scholar] [CrossRef]
- Meva’a Abomo, D.; Fouda, M.; Siméon Nguehan, B.; Ebana, A.A.; Pola, G.M. Vulnérabilité de l’agriculture urbaine aux inondations dans le bassin versant du Mbanya à Douala (Cameroun). Ann. Rech. Urb. 2015, 110, 164–173. [Google Scholar] [CrossRef]
- Ndongo, B.; Mbouendeu, S.L.; Tirmou, A.A.; Njila, R.N.; Dalle, J.D.M. Tendances pluviométriques et impact de la marée sur le drainage en zone d’estuaire: Cas du Wouri au Cameroun. Afr. Sci. Rev. Int. Sci. Technol. 2015, 11, 173–182. [Google Scholar] [CrossRef]
- Yengoh, G.T.; Fogwe, Z.N.; Armah, F.A. Floods in the Douala Metropolis, Cameroon: Attribution to Changes in Rainfall Characteristics or Planning Failures? J. Environ. Plan. Manag. 2017, 60, 204–230. [Google Scholar] [CrossRef]
- Tanessong, R.S.; Vondou, D.A.; Djomou, Z.Y.; Igri, P.M. WRF High Resolution Simulation of an Extreme Rainfall Event over Douala (Cameroon): A Case Study. Model. Earth Syst. Environ. 2017, 3, 927–942. [Google Scholar] [CrossRef]
- CUD (2012)—Plan Directeur d'Urbanisme de Douala à l'horizon 2025. Édit. République du Cameroun/Communauté Urbaine de Douala. 239 pages. Available online: http://www.cldocs.bianguenetworks.info/cudxmedia2014/PDU_Plan%20Horizon%202025.pdf (accessed on 12 July 2021).
- Ministère de l’Administration Territoriale et de la Décentralisation (MINATD). Plan National de Contingence du Cameroun, 2011. Available online: https://plateformecholera.info/attachments/article/450/Cameroune_%20Plan_%20contingence_2011.pdf (accessed on 12 July 2021).
- Bruckmann, L.; Amanejieu, A.; Moffo, M.O.Z.; Ozer, P. Analyse géohistorique de l’évolution spatio-temporelle du risque d’inondation et de sa gestion dans la zone urbaine de Douala (Cameroun). Physio-Géo Géogr. Phys. Environ. 2019, XIII, 91–113. [Google Scholar] [CrossRef]
- Tchiadeu, G.; Olinga, O.J.M. La ville de Douala: Entre baisse des précipitations et hausse des températures. In Les Climats Régionaux: Observation et Modélisation, 25ème Colloque de l'Association Internationale de Climatologie (Grenoble); Bigot, S., Rome, S., Eds.; Université Joseph Fourier: Grenoble, France, 2012; pp. 727–732. [Google Scholar]
- Assako, R.J.A.; Nsegbe, A.; Bley, D. Proposition d’un Modèle de Restructuration d’un Front d’urbanisation Anarchique: Le Cas de Song-Mahop, Un Quartier Périphérique de Douala (Cameroun). Gabonica 2008, 2, 5–22. [Google Scholar]
- Bang, H.N. Governance of Disaster Risk Reduction in Cameroon: The Need to Empower Local Government. Jàmbá J. Disaster Risk Stud. 2013, 5, 10. [Google Scholar] [CrossRef]
- Ngoran, S.D.; Xue, X. Addressing Urban Sprawl in Douala, Cameroon: Lessons from Xiamen Integrated Coastal Management. J. Urban Manag. 2015, 4, 53–72. [Google Scholar] [CrossRef]
- Mbaha, J.P.; Tchounga, G.B. Caractérisation de l’urbanisation dans les zones littorales des pays tropicaux: Exemple du Wouri. Espace Géogr. Soc. Maroc. 2020, 33–34, 215–226. [Google Scholar] [CrossRef]
- Zogning, M.M.O.; Tonye, E.; Ambara, G.; Tsalefack, M. Cartography of flood prone areas and assessment of flooding housing in Douala (Cameroon). In Proceedings of the United Nations International Conference on Space-based Technologies for Disaster Management—“Disaster risk identification, assessment and monitoring”, Beijing, China, 7–9 November 2012; Available online: https://www.researchgate.net/publication/273321869 (accessed on 12 July 2021).
- Metzger, A.; David, F.; Valette, P.; Rode, S.; Martin, B.; Desarthe, J.; Linton, J. Entretenir la mémoire des inondations via les repères de crue? Dév. Durable Territ. Économie Géogr. Polit. Droit Sociol. 2018, 9, 28. [Google Scholar] [CrossRef]
- Coeur, D.; Lang, M. L’information Historique Des Inondations: L’histoire Ne Donne-t-Elle Que Des Leçons? Houille Blanche 2000, 2, 79–84. [Google Scholar] [CrossRef]
- Is New Orleans Safer Today Than When Katrina Hit 10 Years Ago?—Scientific American. Available online: https://www.scientificamerican.com/article/is-new-orleans-safer-today-than-when-katrina-hit-10-years-ago/ (accessed on 12 July 2021).
- Tsalefac, M.; Ngoufo, R.; Nkwambi, W.; Tatsangue, E.D.; Fobissie, B.L. Fréquences et quantités des préci-pitations journalières sur le territoire camerounais. Publ. AIC 2003, 15, 359–367. [Google Scholar]
- Ndille, R.; Belle, J.A. Managing the Limbe Floods: Considerations for Disaster Risk Reduction in Cameroon. Int. J. Disaster Risk Sci. 2014, 5, 147–156. [Google Scholar] [CrossRef]
- Fogwe, Z.N.; Tchotsoua, M. Evaluation géographique de deux décennies de lutte contre les inondations dans la ville de Douala (Cameroun). In Proceedings of the Actes des Journées Scientifiques Inter-réseaux de l’Agence Universitaire de la Francophonie (JSI-RAUF), Hanoï, Viêtnam, 6–9 November 2007; pp. 6–9. [Google Scholar]
- Mbaha, J.P.; Olinga, J.M.; Tchiadeu, G. Cinquante ans de conquête spatiale à Douala: D’héritage colonial en construction à patrimoine socio-spatial vulnérable aux risques naturels. In Actes du Colloque du Cinquantenaire de la Réunification du Cameroun; 2013; pp. 13–14. Available online: https://catalog.ihsn.org/index.php/citations/77657 (accessed on 12 July 2021).
- Bang, H.; Miles, L.; Gordon, R. Evaluating Local Vulnerability and Organizational Resilience to Frequent Flooding in Africa: The Case of Northern Cameroon. foresight 2019, 21, 266–284. [Google Scholar] [CrossRef]
- Napi Wouapi, H. Framework for Municipal Adaptation Plan Case Study of Douala V Municipality Missokè Site, a Floods Hot Spot in Douala V Municipality; Konrad-Adenauer-Stiftung, Yaoundé, Cameroon. December 2018.
- Meva a Abomo, D.; Fouda, M.; Bonglam Chofor, Z.; Kamwo, M. Analyse Spatiale Du Risque d’Inondation Dans Le Bassin Versant Du Mbanya à Douala, Capitale Économique Du Cameroun. In Proceedings of the Novatech 2010—7ème Conférence internationale sur les techniques et stratégies durables pour la gestion des eaux urbaines par temps de pluie/7th International Conference on sustainable techniques and strategies for urban water management, Lyon, France, 27 June–1 July 2010; pp. 1–10. [Google Scholar]
- Munji, C.A.; Bele, M.Y.; Idinoba, M.E.; Sonwa, D.J. Floods and Mangrove Forests, Friends or Foes? Perceptions of Relationships and Risks in Cameroon Coastal Mangroves. Estuar. Coast. Shelf Sci. 2014, 140, 67–75. [Google Scholar] [CrossRef]
- Nguh, B.S.; Anumveh, N.N. Endemic Hydro Climatic Flood Hazards in Some Cameroonian Coastal Cities: The Hand of Man or the Work of Nature? Mod. Concepts Dev. Agron. 2018, 2, 155–165. [Google Scholar] [CrossRef]
- Fute, E.; Steve, T. Analysis and Implementation of a Platform for Natural Disaster Management: Case of Flood in Douala Town. Master’s Thesis, University of Buea, Buea, Cameroon, 2019. [Google Scholar] [CrossRef]
- Nojang, E.N.; Jensen, J. Conceptualizing Individual and Household Disaster Preparedness: The Perspective from Cameroon. Int. J. Disaster Risk Sci. 2020, 11, 333–346. [Google Scholar] [CrossRef]
- Niba, M.L.F.; Gideon, S. Evaluation of the Impacts of Sea Level Rise Hazards in Douala-Cameroon. OALib 2021, 8, e7427. [Google Scholar] [CrossRef]
- Bladé, E.; Cea, L.; Corestein, G.; Escolano, E.; Puertas, J.; Vázquez-Cendón, E.; Dolz, J.; Coll, A. Iber: Herramienta de simulación numérica del flujo en ríos. Rev. Int. Métod. Numér. Cálculo Diseño Ing. 2014, 30, 1–10. [Google Scholar] [CrossRef]
- Manfreda, S.; Samela, C.; Gioia, A.; Consoli, G.G.; Iacobellis, V.; Giuzio, L.; Cantisani, A.; Sole, A. Flood-Prone Areas Assessment Using Linear Binary Classifiers Based on Flood Maps Obtained from 1D and 2D Hydraulic Models. Nat. Hazards 2015, 79, 735–754. [Google Scholar] [CrossRef]
- Dasallas, L.; Kim, Y.; An, H. Case Study of HEC-RAS 1D–2D Coupling Simulation: 2002 Baeksan Flood Event in Korea. Water 2019, 11, 2048. [Google Scholar] [CrossRef]
- Chomba, I.C.; Banda, K.E.; Winsemius, H.C.; Chomba, M.J.; Mataa, M.; Ngwenya, V.; Sichingabula, H.M.; Nyambe, I.A.; Ellender, B. A Review of Coupled Hydrologic-Hydraulic Models for Floodplain Assessments in Africa: Opportunities and Challenges for Floodplain Wetland Management. Hydrology 2021, 8, 44. [Google Scholar] [CrossRef]
- Nkwunonwo, U.C.; Whitworth, M.; Baily, B. A Review of the Current Status of Flood Modelling for Urban Flood Risk Management in the Developing Countries. Sci. Afr. 2020, 7, e00269. [Google Scholar] [CrossRef]
- Fernández, A.; Najafi, M.R.; Durand, M.; Mark, B.G.; Moritz, M.; Jung, H.C.; Neal, J.; Shastry, A.; Laborde, S.; Phang, S.C.; et al. Testing the Skill of Numerical Hydraulic Modeling to Simulate Spatiotemporal Flooding Patterns in the Logone Floodplain, Cameroon. J. Hydrol. 2016, 539, 265–280. [Google Scholar] [CrossRef]
- Dimitriadis, P.; Tegos, A.; Oikonomou, A.; Pagana, V.; Koukouvinos, A.; Mamassis, N.; Koutsoyiannis, D.; Efstratiadis, A. Comparative Evaluation of 1D and Quasi-2D Hydraulic Models Based on Benchmark and Real-World Applications for Uncertainty Assessment in Flood Mapping. J. Hydrol. 2016, 534, 478–492. [Google Scholar] [CrossRef]
- Zhang, Y.; Wang, Y.; Zhang, Y.; Luan, Q.; Liu, H. Multi-Scenario Flash Flood Hazard Assessment Based on Rainfall–Runoff Modeling and Flood Inundation Modeling: A Case Study. Nat. Hazards 2021, 105, 967–981. [Google Scholar] [CrossRef]
- Jamali, B.; Bach, P.M.; Deletic, A. Rainwater Harvesting for Urban Flood Management—An Integrated Modelling Framework. Water Res. 2020, 171, 115372. [Google Scholar] [CrossRef]
- Knebl, M.R.; Yang, Z.-L.; Hutchison, K.; Maidment, D.R. Regional Scale Flood Modeling Using NEXRAD Rainfall, GIS, and HEC-HMS/RAS: A Case Study for the San Antonio River Basin Summer 2002 Storm Event. J. Environ. Manag. 2005, 75, 325–336. [Google Scholar] [CrossRef]
- Patel, D.P.; Ramirez, J.A.; Srivastava, P.K.; Bray, M.; Han, D. Assessment of Flood Inundation Mapping of Surat City by Coupled 1D/2D Hydrodynamic Modeling: A Case Application of the New HEC-RAS 5. Nat. Hazards 2017, 89, 93–130. [Google Scholar] [CrossRef]
- Ben Khalfallah, C.; Saidi, S. Spatiotemporal Floodplain Mapping and Prediction Using HEC-RAS—GIS Tools: Case of the Mejerda River, Tunisia. J. Afr. Earth Sci. 2018, 142, 44–51. [Google Scholar] [CrossRef]
- Rangari, V.A.; Sridhar, V.; Umamahesh, N.V.; Patel, A.K. Floodplain Mapping and Management of Urban Catchment Using HEC-RAS: A Case Study of Hyderabad City. J. Inst. Eng. India Ser. A 2019, 100, 49–63. [Google Scholar] [CrossRef]
- Chen, Y.-H.; Mossa, J.; Singh, K.K. Floodplain Response to Varied Flows in a Large Coastal Plain River. Geomorphology 2020, 354, 107035. [Google Scholar] [CrossRef]
- Mihu-Pintilie, A.; Cîmpianu, C.I.; Stoleriu, C.C.; Pérez, M.N.; Paveluc, L.E. Using High-Density LiDAR Data and 2D Streamflow Hydraulic Modeling to Improve Urban Flood Hazard Maps: A HEC-RAS Multi-Scenario Approach. Water 2019, 11, 1832. [Google Scholar] [CrossRef]
- Arseni, M.; Rosu, A.; Calmuc, M.; Calmuc, V.A.; Iticescu, C.; Georgescu, L.P. Development of Flood Risk and Hazard Maps for the Lower Course of the Siret River, Romania. Sustainability 2020, 12, 6588. [Google Scholar] [CrossRef]
- Mai, D.T.; De Smedt, F. A Combined Hydrological and Hydraulic Model for Flood Prediction in Vietnam Applied to the Huong River Basin as a Test Case Study. Water 2017, 9, 879. [Google Scholar] [CrossRef]
- Huţanu, E.; Mihu-Pintilie, A.; Urzica, A.; Paveluc, L.E.; Stoleriu, C.C.; Grozavu, A. Using 1D HEC-RAS Modeling and LiDAR Data to Improve Flood Hazard Maps Accuracy: A Case Study from Jijia Floodplain (NE Romania). Water 2020, 12, 1624. [Google Scholar] [CrossRef]
- Quirogaa, V.M.; Kurea, S.; Udoa, K.; Manoa, A. Application of 2D Numerical Simulation for the Analysis of the February 2014 Bolivian Amazonia Flood: Application of the New HEC-RAS Version 5. Ribagua 2016, 3, 25–33. [Google Scholar] [CrossRef]
- Zeiger, S.J.; Hubbart, J.A. Measuring and Modeling Event-Based Environmental Flows: An Assessment of HEC-RAS 2D Rain-on-Grid Simulations. J. Environ. Manag. 2021, 285, 112125. [Google Scholar] [CrossRef]
- Baldassarre, G.D.; Montanari, A. Uncertainty in River Discharge Observations: A Quantitative Analysis. Hydrol. Earth Syst. Sci. 2009, 13, 913–921. [Google Scholar] [CrossRef]
- Reistad, S.K.; Petersen-Øverleir, A.; Bogetveit, L.J. Setting up Rating Curves Using HEC-RAS. J. Korea Water Resour. Assoc. 2007, 3, 20–30. [Google Scholar]
- Spada, E.; Sinagra, M.; Tucciarelli, T.; Biondi, D. Unsteady State Water Level Analysis for Discharge Hydrograph Estimation in Rivers with Torrential Regime: The Case Study of the February 2016 Flood Event in the Crati River, South Italy. Water 2017, 9, 288. [Google Scholar] [CrossRef]
- Iroume, J.Y.-A.; Sone Essoh, W.; Onguéné, R.; Colmet-Daage, A.; Stieglitz, T.; Bogning, S.; et Braun, J.-J. Réalisation d’un Modèle hydraulique et hydrologique calibré et validé sur l’ensemble du bassin versant du Tongo Bassa, Douala-Cameroun. 2021; Unpublish report. [Google Scholar]
- Urzică, A.; Mihu-Pintilie, A.; Stoleriu, C.C.; Cîmpianu, C.I.; Huţanu, E.; Pricop, C.I.; Grozavu, A. Using 2D HEC-RAS Modeling and Embankment Dam Break Scenario for Assessing the Flood Control Capacity of a Multi-Reservoir System (NE Romania). Water 2021, 13, 57. [Google Scholar] [CrossRef]
- Psomiadis, E.; Tomanis, L.; Kavvadias, A.; Soulis, K.X.; Charizopoulos, N.; Michas, S. Potential Dam Breach Analysis and Flood Wave Risk Assessment Using HEC-RAS and Remote Sensing Data: A Multicriteria Approach. Water 2021, 13, 364. [Google Scholar] [CrossRef]
- Naeem, B.; Azmat, M.; Tao, H.; Ahmad, S.; Khattak, M.; Haider, S.; Ahmad, S.; Khero, Z.; Goodell, C. Flood Hazard Assessment for the Tori Levee Breach of the Indus River Basin, Pakistan. Water 2021, 13, 604. [Google Scholar] [CrossRef]
- Zeleňáková, M.; Fijko, R.; Labant, S.; Weiss, E.; Markovič, G.; Weiss, R. Flood Risk Modelling of the Slatvinec Stream in Kružlov Village, Slovakia. J. Clean. Prod. 2019, 212, 109–118. [Google Scholar] [CrossRef]
- Yalcin, E. Assessing the Impact of Topography and Land Cover Data Resolutions on Two-Dimensional HEC-RAS Hydrodynamic Model Simulations for Urban Flood Hazard Analysis. Nat. Hazards 2020, 101, 995–1017. [Google Scholar] [CrossRef]
- Dysarz, T.; Szałkiewicz, E.; Wicher-Dysarz, J. Long-Term Impact of Sediment Deposition and Erosion on Water Surface Profiles in the Ner River. Water 2017, 9, 168. [Google Scholar] [CrossRef]
- Tarar, Z.R.; Ahmad, S.R.; Ahmad, I.; Hasson, S.; Khan, Z.M.; Washakh, R.M.A.; Ateeq-Ur-Rehman, S.; Bui, M.D. Effect of Sediment Load Boundary Conditions in Predicting Sediment Delta of Tarbela Reservoir in Pakistan. Water 2019, 11, 1716. [Google Scholar] [CrossRef]
- Boum-Nkot, S.N.; Ketchemen-Tandia, B.; Ndje, Y.; Emvouttou, H.; Ebonji, C.R.; Huneau, F. Origin of Mineralization of Groundwater in the Tongo Bassa Watershed (Douala-Cameroon). Res. J. Environ. Earth Sci. 2015, 7, 29–41. [Google Scholar] [CrossRef]
- Onguene, R.; Pemha, E.; Lyard, F.; Du-Penhoat, Y.; Nkoue, G.; Duhaut, T.; Njeugna, E.; Marsaleix, P.; Mbiake, R.; Jombe, S.; et al. Overview of Tide Characteristics in Cameroon Coastal Areas Using Recent Observations. Open J. Mar. Sci. 2014, 5, 81–98. [Google Scholar] [CrossRef]
- Din, N.; Ngo-Massou, V.M.; Essomè-Koum, G.L.; Ndema-Nsombo, E.; Kottè-Mapoko, E.; Nyamsi-Moussian, L. Impact of Urbanization on the Evolution of Mangrove Ecosystems in the Wouri River Estuary (Douala Cameroon). In Coastal Wetlands: Alteration and Remediation; Finkl, C.W., Makowski, C., Eds.; Coastal Research Library; Springer International Publishing: Cham, Switzerland, 2017; Volume 21, pp. 81–131. ISBN 978-3-319-56178-3. [Google Scholar]
- Djuikom, E.; Temgoua, E.; Jugnia, L.; Nola, M.; Baane, M. Pollution Bactériologique Des Puits d’eau Utilisés Par Les Populations Dans La Communauté Urbaine de Douala—Cameroun. Int. J. Biol. Chem. Sci. 2009, 3, 967–978. [Google Scholar] [CrossRef][Green Version]
- Njueya, A.; Likeng, J.; Nono, A. Hydrodynamique et qualité des eaux souterraines dans le bassin sédimentaire de Douala (Cameroun): Cas des aquifères sur formations Quaternaires et Tertiaires. Int. J. Biol. Chem. Sci. 2012, 6, 1874–1894. [Google Scholar] [CrossRef]
- Akoachere, J.-F.T.K.; Mbuntcha, C.K.P. Water Sources as Reservoirs of Vibrio CholeraeO1 and Non-O1 Strains in Bepanda, Douala (Cameroon): Relationship between Isolation and Physico-Chemical Factors. BMC Infect. Dis. 2014, 14, 421. [Google Scholar] [CrossRef] [PubMed]
- Ketchemen-Tandia, B.; Boum-Nkot, S.N.; Ebondji, S.R.; Nlend, B.Y.; Emvoutou, H.; Nzegue, O. Factors Influencing the Shallow Groundwater Quality in Four Districts with Different Characteristics in Urban Area (Douala, Cameroon). J. Geosci. Environ. Prot. 2017, 5, 99–120. [Google Scholar] [CrossRef]
- Ndo, C.; Menze-Djantio, B.; Antonio-Nkondjio, C. Awareness, Attitudes and Prevention of Malaria in the Cities of Douala and Yaoundé (Cameroon). Parasit. Vectors 2011, 4, 181. [Google Scholar] [CrossRef]
- Farr, T.G.; Rosen, P.A.; Caro, E.; Crippen, R.; Duren, R.; Hensley, S.; Kobrick, M.; Paller, M.; Rodriguez, E.; Roth, L.; et al. The Shuttle Radar Topography Mission. Rev. Geophys. 2007, 45. [Google Scholar] [CrossRef]
- Yan, K.; Di Baldassarre, G.; Solomatine, D.P. Exploring the Potential of SRTM Topographic Data for Flood Inundation Modelling under Uncertainty. J. Hydroinform. 2013, 15, 849–861. [Google Scholar] [CrossRef]
- Pangali Sharma, T.P.; Zhang, J.; Khanal, N.R.; Prodhan, F.A.; Nanzad, L.; Zhang, D.; Nepal, P. A Geomorphic Approach for Identifying Flash Flood Potential Areas in the East Rapti River Basin of Nepal. IJGI 2021, 10, 247. [Google Scholar] [CrossRef]
- Nasiri, V.; Deljouei, A.; Moradi, F.; Sadeghi, S.M.M.; Borz, S.A. Land Use and Land Cover Mapping Using Sentinel-2, Landsat-8 Satellite Images, and Google Earth Engine: A Comparison of Two Composition Methods. Remote Sens. 2022, 14, 1977. [Google Scholar] [CrossRef]
- Arcement, G.J.; Schneider, V.R. Guide for Selecting Manning’s Roughness Coefficients for Natural Channels and Flood Plains; Water Supply Paper; U.S. G.P.O.; For sale by the Books and Open-File Reports Section; U.S. Geological Survey: Denver, CO, USA, 1989; Volume 2339. [CrossRef]
- Chow, V.T. Open-Channel Hydraulics; McGraw-Hill: New York, NY, USA, 1959; ISBN 978-0-07-085906-7. [Google Scholar]
- Legates, D.; McCabe, G. Evaluating the Use of “Goodness-of-fit” Measures in Hydrologic and Hydroclimatic Model Validation. Water Resour. Res. 1999, 35, 233–241. [Google Scholar] [CrossRef]
- AIDR (Australian Institute for Disaster Resilience). Australian Disaster Resilience Handbook 7 Managing the Floodplain: A Guide to Best Practice in Flood Risk Management in Australia (AIDR 2017). Available online: https://www.preventionweb.net/publications/view/55084 (accessed on 12 July 2021).


| Flood Hazard | D × V (m2/s) | Hazard Description |
|---|---|---|
| H1 | ≤0.3 | Generally safe for vehicles, people, and buildings |
| H2 | ≤0.6 | Unsafe for small vehicles |
| H3 | ≤1.2 | Unsafe for vehicles, children, and the elderly |
| H4 | ≤2 | Unsafe for vehicles and people |
| H5 | ≤4 | Unsafe for vehicles and people. All the building types are vulnerable to structural damage. Some less robust building types are vulnerable to failure. |
| H6 | >4 | Unsafe for vehicles and people. All building types considered vulnerable to failure |
| Calibration | Water Levels (m) Flood 2020 | Difference = S − O | |
|---|---|---|---|
| N° | (O) Observed | (S) Simulated | |
| 1 | 8.64 | 8.84 | 0.2 |
| 2 | 7.51 | 7.54 | 0.03 |
| 3 | 6.82 | 6.8 | −0.02 |
| 4 | 6.56 | 6.75 | 0.19 |
| 5 | 6.65 | 6.62 | −0.03 |
| 6 | 5.78 | 6.22 | 0.44 |
| NSE | 0.94 | ||
| Erel | 0.92 | ||
| RMSE | 0.21 | ||
Publisher’s Note: MDPI stays neutral with regard to jurisdictional claims in published maps and institutional affiliations. |
© 2022 by the authors. Licensee MDPI, Basel, Switzerland. This article is an open access article distributed under the terms and conditions of the Creative Commons Attribution (CC BY) license (https://creativecommons.org/licenses/by/4.0/).
Share and Cite
Iroume, J.Y.-A.; Onguéné, R.; Djanna Koffi, F.; Colmet-Daage, A.; Stieglitz, T.; Essoh Sone, W.; Bogning, S.; Olinga Olinga, J.M.; Ntchantcho, R.; Ntonga, J.-C.; et al. The 21st August 2020 Flood in Douala (Cameroon): A Major Urban Flood Investigated with 2D HEC-RAS Modeling. Water 2022, 14, 1768. https://doi.org/10.3390/w14111768
Iroume JY-A, Onguéné R, Djanna Koffi F, Colmet-Daage A, Stieglitz T, Essoh Sone W, Bogning S, Olinga Olinga JM, Ntchantcho R, Ntonga J-C, et al. The 21st August 2020 Flood in Douala (Cameroon): A Major Urban Flood Investigated with 2D HEC-RAS Modeling. Water. 2022; 14(11):1768. https://doi.org/10.3390/w14111768
Chicago/Turabian StyleIroume, Junior Yves-Audrey, Raphaël Onguéné, Francis Djanna Koffi, Antoine Colmet-Daage, Thomas Stieglitz, Willy Essoh Sone, Sakaros Bogning, Joseph Magloire Olinga Olinga, Romaric Ntchantcho, Jean-Claude Ntonga, and et al. 2022. "The 21st August 2020 Flood in Douala (Cameroon): A Major Urban Flood Investigated with 2D HEC-RAS Modeling" Water 14, no. 11: 1768. https://doi.org/10.3390/w14111768
APA StyleIroume, J. Y.-A., Onguéné, R., Djanna Koffi, F., Colmet-Daage, A., Stieglitz, T., Essoh Sone, W., Bogning, S., Olinga Olinga, J. M., Ntchantcho, R., Ntonga, J.-C., Braun, J.-J., Briquet, J.-P., & Etame, J. (2022). The 21st August 2020 Flood in Douala (Cameroon): A Major Urban Flood Investigated with 2D HEC-RAS Modeling. Water, 14(11), 1768. https://doi.org/10.3390/w14111768