Article

The Effects of a Typhoon on the Dynamic of Microbial Community Structure and Water Quality of the Marine Bathing Beach

1
State Environmental Protection Key Laboratory of Coastal Ecosystem, National Marine Environmental Monitoring Center, Dalian 116023, China
2
College of Fisheries and Life Science, Dalian Ocean University, Dalian 116023, China
3
College of Marine Ecology and Environment, Shanghai Ocean University, Shanghai 201306, China
*
Author to whom correspondence should be addressed.
These authors contributed equally to this work.
Water 2022, 14(10), 1631; https://doi.org/10.3390/w14101631
Submission received: 13 April 2022 / Revised: 15 May 2022 / Accepted: 16 May 2022 / Published: 19 May 2022
(This article belongs to the Special Issue Diversity and Dynamics of Microbial Communities in Marine Ecosystems)

Abstract

:
Dalian Jinshitan beach was chosen to evaluate the impact of a typhoon on the bacterial community structure and water quality of a marine bathing beach. The concentration of enterococci was determined by the cultivation method. The bacterial community structure and abundance were analyzed using the 16S rDNA next-generation sequencing and qPCR methods. Results showed that the abundance of cultivable enterococci both in alongshore and offshore seawater increased, while it decreased in dry, wet and submerged sand. The water quality deteriorated immediately after the typhoon, and nearly recovered one month after the typhoon. The typhoon event also decreased the bacterial abundance and changed the bacterial community of the beach. Sphingomonadaceae and Rhodobacteraceae significantly increased in seawater and decreased in dry sand immediately after the typhoon. Human and other fecal taxa increased in water and sand. One month after the typhoon, the diversity and many dominant bacterial taxa nearly recovered in seawater and wet sand. Our work shows that the typhoon changed the bacterial dynamics, deteriorated the water quality and proved the transportation of bacterial taxa and input of fecal pollution between water and beach sand or land. Apart from the impact of the typhoon, the geographical location was another important factor in the changed bacterial community.

1. Introduction

About 80% of global tourism and 50% of international tourism is located around coastal areas [1]. International travel, especially coastal tourism, has skyrocketed during the past half-century, and public health risk events caused by pathogenic microorganisms have increased year by year. Human exposure to polluted bathing beach environments by pathogenic bacteria can increase the risk of relevant gastroenteritis. The illness rate of tourists in seawater is about two times higher than in freshwater [2]. An epidemiological survey showed that considerable numbers of gastroenteritis and respiratory diseases are related to the contamination of pathogens in seawater [3]. The risk of infectious diseases caused by bacterial pollution on coastal bathing beaches has become a significant global problem [4].
Recently, reports have shown that pathogenic bacteria abundance in the beach sand is commonly much higher than in seawater [4,5]. The beach can provide shelter for pathogens [6], resulting from moderate moisture, temperature, biofilm formation [7], and relatively few predations and competition effects [8]. Epidemiological surveys show that tourists exposed to the beach have a greater risk (20–50%) of suffering from gastrointestinal diseases compared with non-beachgoers and are significantly associated with concentrations of Enterococci (fecal indicator bacteria of seawater) in beach sand [9]. Furthermore, beach sand as a reservoir of pathogenic bacteria causes transmission of non-fecal origin pathogens into the seawater, which may impact water quality and public health [10].
However, the current understanding of bacterial contamination and transportation between beach sand and water is lacking. Extreme weather such as typhoon and rainstorm accelerate the interaction between beach sand and seawater interface, which provides an excellent opportunity to study the impact of beaches on seawater quality [11]. Heavy rainfall can also increase land-based pollution inputs (nutrients and fecal pathogens) [12] and change the transport pathways of fecal indicator bacteria (FIB) and pathogens [8]. Furthermore, the rapid influx of freshwater can change the bacterial community composition of beach sand and seawater, which could be a potential water quality monitoring tool [13]. High-throughput sequencing approaches have observed the restructure of an aquatic bacterial community caused by superstorm sand in stream water [12] and the bacterial restoration of a surfing beach caused by a strong typhoon event in the United States and Japan [4]. However, bacterial pollution on different beaches has pronounced geographical heterogeneity, and the reconstruction process of bacterial community structure depends on hydrological and topographic features.
In order to evaluate the effects of beach sand on the water quality in China, Dalian Jinshitan bathing beach, the largest bathing beach in north China, was chosen and a typical typhoon event was followed to (1) analyze if the pathogenic transformation happened between the beach and seawater using enterococci quantification; (2) evaluate the potential impact of the typhoon on water quality by bacterial community structure; (3) assess the restructure of normal bacterial flora in the seawater and beach.

2. Materials and Methods

2.1. Sample Collection

Jinshitan bathing beach is located in the North Yellow Sea of China, the largest and only natural light bath in northern China, and attracts nearly 30,000 to 100,000 visitors each day during peak tourist season. This beach is separate from the city of Dalian and easily impacted by typhoons. On 20 August 2018, typhoon “Wombia” of the international number 1818 passed through Dalian (CMA 25 m/s), accompanied by torrential rains (rainfall ranged from 100 to 250 mm). The survey started immediately after the typhoon (21 August 2018) and lasted nearly one month (15 September 2018). Samples were collected on 11 August as a reference before the typhoon.
The sampling site was set in the west area of the beach because there was no sewage outlet, and only the Putaogou river located upstream of this area (W3 station) was used for storm drainage. Therefore, when there was no rainfall, this beach experienced little or no influence from urbanized pollution on water quality. Three stations (W1, W2, and W3) were evenly distributed (about 650 m apart) and covered the area of routinely gathered bathers (Figure 1). During the typhoon event, two water depths were set, alongshore (AS) (0.5 m) and offshore sites (OS) (1.0 m). Three different beach sand zones were chosen: dry sand, wet sand, and submerged sand. In detail, dry sand (DS) (5–15 cm) was collected at 2 m above the high tide line (backshore sand) and wet sand (WS) (5–15 cm) from the intertidal zone (foreshore sand), while submerged sand (SS) (0–10 cm) was collected at 0.5 m water depth (nearshore sand). Four samples of the surrounding beach sand and seawater were set within a 0.5 m radius; 500 g surface sand and 5 L surface seawater (from the depth of 30 cm) were collected and mixed.

2.2. Physical, Chemical, Meteorological, and Hydrological Parameters Analysis in Water and Beach Sand

Physical, chemical, meteorological, and hydrological parameters were measured. The water temperature, dissolved oxygen, conductivity, salinity, pH, and redox potential were measured by ProQuatro Multiparameter Meter (YSI, Rye Brook, NY, USA) in situ. The sand particle size was analyzed using the LS13320 laser diffraction particle size analyzer (BECKMAN COULTER, Brea, CA, USA) according to the Youden-Windworth equal ratio φ value particle level standard, and the particle size parameters were calculated using the Fokker–Ward graphical formula. The sediment particle size was determined according to the marine monitoring code of China [14]. Ammonium nitrogen (NH4+), nitrate (NO3) and nitrite (NO2) were analyzed according to the soil monitoring specification of environment of China [15]. Total nitrogen (TN) and total phosphorus (TP) were analyzed according to previous methods [16,17]. Total organic carbon (TOC) and the water content of the sand were analyzed according to the marine monitoring specification of China [18].

2.3. Enterococci Cultivation

All seawater and beach sand samples were analyzed for cultivable enterococci by membrane filtration method according to ISO 7899–2–2000 (E) and further identified according to the patent [19]. Briefly, 10 g sand samples were mixed with 90 mL sterilized phosphate balanced solution (PBS) and filtered using a 0.45 µm nitrocellulose membrane filter, and 100 mL seawater samples were filtered directly. The filter membrane was attached to Slanetz and Bartley medium (Hopebio Biotechnology Co., Ltd., Qingdao, China) and incubated at 37 °C for 44 ± 4 h. The membrane was transferred to 44 °C pre-heated enterococci agar plate with sterile forceps and incubated at 44 °C for 2 h. Typical black or brown colony on the back of the counting plate was identified using the contact enzyme experiment, and the bacteria with a negative contact enzyme was enterococci. All samples were tested in triplicate.

2.4. 16S rRNA Gene Quantification

The bacterial abundance in seawater and beach sand samples was quantified using the qPCR method. The 16S rRNA gene V4 region and primers 515F 5’-GTGCCAGCMGCCGCGGTAA-3′ and 806R 5’-GGACTACCAGGGTATCTAAT-3’ were chosen, and a standard curve was created. The qPCR reaction system was 20 µL and consisted of 10 µL TB Green Premix, 0.4 µL upstream and downstream primers, 0.4 µL ROX II, 6.8 µL ddH2O, 2 µL template DNA. The PCR reaction conditions were set as follows: pre-denaturation at 94 °C for 5 min, denaturation at 94 °C for 30 s, annealing at 62 °C for 30 s, extension at 72 °C for 32 s, for 30 cycles, collecting fluorescent signals.

2.5. 16S rRNA Gene Sequencing

The V4-V5 region of the 16S rRNA gene in each sample was amplified using the primers 515F: 5′-GTGCCAGCMGCCGCGG-3′ and 907R: 5′-CCGTCAATTCMTTTRAGTTT-3′. The PCR reaction solution consisted of 4 µL of 5× fastpfu buffer, 2 µL of 2.5 mmol Deoxynucleotide Triphosphates (dNTPs), 0.8 µL of 5 µm primers, 0.4 µL of FastPfu DNA Polymerase, 10 ng template DNA, and double-distilled water (ddH2O) was supplemented to 20 µL. The PCR reaction conditions were as follows: pre-denaturation at 95 °C for 5 min, denaturation at 95 °C for 30 s, annealing at 55 °C for 30 s, extension at 72 °C for 45 s, 30 cycles, and final elongation at 72 °C for 10 min. The PCR products were purified using AxyPrepDNA Purification Kit (AXYGEN (Hangzhou) Biotech Co., Ltd., Hangzhou, Zhejiang, China), detected using QuantiFluor™-ST blue fluorescence quantitative system (PROMEGA, Promega (Beijing) Biotech Co., Ltd., Beijing, China), and mixed in proportion according to the sequencing requirements. The Illumina PE250 library was constructed, sequenced, and the raw sequences in seawater and beach sand samples were deposited in the Sequence Read Archive of the National Center for Biotechnology Information under the accession number srr10177426-srr10177449.

2.6. Data Analysis

The concentration of enterococci was transformed to log 10 (X + 1) to achieve normality. SPSS software V21.0 (IBM, New Orchard Road, Armonk, NY, USA) was used to process the data, including ANOVA and Pearson’s correlation analysis between the different groups, where p ≤ 0.05 was considered significant. The distribution of enterococci and fecal flora were shown using Origin 9.1 (OriginLab 2019b, Northampton, MA, USA).
Sequences with 97% similarity were clustered into a single operational taxonomic unit (OTU) using Ultra-fast sequence analysis (USEARCH) software V10 (Robert Edgar). The taxonomy of each OTU by alpha diversity indices (Chao1, Shannon, Simpson) and beta diversity was assigned against the Silva database using the Quantitative Insights into Microbial Ecology (QIIME) V1.9.1. Principal coordinate analysis (PCoA) and unweighted pair group method with non-metric multidimensional scaling (NMDS) were applied to present the distance among different samples, Redundancy analysis (RDA) was conducted to analyze the relationship between samples and environmental factors, and analysis of similarities (ANOSIM) was used to analyze the differences in the microbial community structure using the ‘vegan’ packages in R version v4.0.2 (R Foundation for Statistical Computing, Vienna, Austria).
Fecal flora was analyzed to evaluate the impact of the typhoon on the water quality. OTUs classified as Bacteroidaceae, Porphyromonadaceae, Clostridiaceae, Lachnospiraceae, Ruminococceae, Rikenellaceae, or Prevotellaceae [20,21] were considered as human fecal taxa. OTUs classified as Erysipelotrichaceae, Peptostreptoococcaceae, Enterobacteriaceae, Enterococcaceae [22] were considered other fecal taxa (OFT). Total fecal taxa were human plus other fecal taxa.

3. Results

3.1. The Physical-Chemical Factors of the Beach during the Typhoon Event

Water quality parameters, physical properties of seawater, and beach samples of Jinshitan bathing beach were shown in Table 1 and Table 2. Water temperature ranged from 23.4 to 29.4 °C, DO from 6.18 to 10.26 mg/L, conductivity ranged from 27,905 to 52,546 µS/m, salinity ranged from 16.95 to 31.52, pH ranged from 7.87 to 8.22, and oxidative redox potential (ORP) ranged from 67 to 265 mV. During the typhoon event, salinity, pH, and ORP (p < 0.05) decreased in all three stations, and the salinity and conductivity in the W3 station changed significantly (p < 0.01), from 31.47 to 16.95.

3.2. The Effect of the Typhoon Event on Water Quality According to Enterococci Concentration

Jinshitan bathing beach was not an urban beach, and there was no pollution source point in the west area except for the heavy storm. Therefore, the nutrient concentration was relatively low, as shown in Table 2. Nitrate, ammonium, total phosphorus, total nitrogen, and TOC were (0.90~2.54) × 10–3 µg/g, (7.34~39.20) × 10–3 µg/g, 0.10~0.27 µg/g, (8.13~45.90) × 10–3 µg/g, and (0~0.593) × 10–3 µg/g, respectively, with nitrite concentration below the minimum detection limit. ANOVA analysis showed that only ammonium concentration in submerged sand was significantly higher than in wet sand (p < 0.05). In addition, there was no significant difference in the nutrients during the typhoon event (p > 0.05).
There were some differences in the particle size of beach sand at different regions of the same station, and the particle size changed after the typhoon. Before the typhoon, the particle size of dry sand and submerged sand were sand. However, the particle size of wet sand was different: W1 and W2 stations were sand (>50%) and gravel (>25%), while the W3 station was gravel (>50%) and sand (>25%). Immediately after the typhoon, wet sand of W2 changed into sand (>75%); the submerged sand of W1 changed into gravel (>50%) and sand (>25%). Until one month after the typhoon, this trend did not change, except for the dry sand of the W1 station.
The abundance of cultivable enterococci was estimated to assess the microbiological water quality during the typhoon event, and the average concentrations of cultivable enterococci were 162 CFU/100 mL and 21,134 CFU/100 g in seawater and sand samples, respectively (Figure 2). However, the concentration of cultivable enterococci between alongshore and offshore seawater had no significant difference (p > 0.05). The concentration of cultivable enterococci in beach sand was significantly higher (10–100 fold) than in seawater samples (p < 0.05). The cultivable enterococci in alongshore and offshore seawater (p < 0.01), dry and wet sand (p < 0.05), submerged sand and seawater (alongshore and offshore) (p < 0.05), as well as submerged and wet sand (p < 0.01), all showed significant correlations with each other.
Immediately after the typhoon, the abundance of cultivable enterococci in alongshore (p > 0.05) and offshore seawater (p < 0.05) increased, while it decreased in the dry sand (p < 0.01), wet sand and submerged sediment samples (p > 0.05). In addition, its abundance in alongshore seawater of W1 and W2 stations decreased immediately after the typhoon while it significantly increased in the W3 station (p < 0.01). The enterococci abundances increased immediately after the typhoon in offshore seawater samples, which was also evident in the W3 station. About 33.3%, 66.7%, and 33.3% of samples exceeded the US EPA recreation criterion before, immediately after, and one month after the typhoon (>104 CFU/100 mL). However, the abundance of enterococci in dry sand, wet sand, and submerged sand decreased, except for the W3 submerged station. After one month of the typhoon, enterococci abundance decreased to lower than before the typhoon, except at the W2 seawater station.

3.3. Abundance and Diversity of the Bacterial Community on the Beach

Real-time PCR technology was used to analyze the bacterial abundance of the beach using the 16S rDNA gene. The results showed that the bacterial abundance was 3.3 × 10³~8.9 × 10⁶ copies/ mL and 2.4 × 10⁷~3.5 × 10⁹ copies/g in seawater and sand samples (dry sand, wet sand, and submerged sediment), respectively. The bacterial concentration in sand samples was significantly higher (100–1000 fold) than that of seawater samples (p < 0.01), the same as enterococci. The bacterial concentration in seawater and sand samples decreased immediately after the typhoon, especially in the alongshore seawater and dry sand samples (p < 0.01). One month after the typhoon, there was some increase in the bacterial concentration, but it did not recover to the level before the typhoon (Figure S1).
Illumina sequencing was carried out on seawater and sand samples of Jinshitan bathing beach. The sequences of each sample ranged from 30,483 to 53,302. Approximately 17,182 OTUs were obtained from seawater and 76,873 OTUs from sand samples (1220 to 3536 OTUs per sample), respectively (Table S1). Alpha diversity showed that OTUs (p < 0.01), Chao (p < 0.01), and Shannon index in sand samples (p < 0.01) were significantly higher than in the seawater samples, and the Simpson index in beach sand was significantly lower (p < 0.01) (Figure 3). Alpha diversity gradually increased from the dry sand to wet sand and submerged sand (p < 0.05).
By ANOVA, OTUs and Shannon index significantly increased in seawater samples immediately after the typhoon event (p = 0.010, 0.024). In contrast, the Chao index did not significantly increase (p > 0.05), and there was no significant change in the diversity indexes (OTUs, Shannon, and Chao index) one month after the typhoon (p = 0.543, 0.262, 0.957).
All alpha diversity indexes (OTUs, Chao, and Shannon) of the dry sand samples significantly increased immediately after the typhoon (p = 0.004, 0.007, 0.026) and then significantly decreased one month after the typhoon (p = 0.000, 0.000, 0.002), to even lower than before the typhoon event (p = 0.013, 0.003, 0.042). The OTUs and Chao indexes of wet sand samples also significantly increased immediately after the typhoon (p = 0.011, 0.020) but did not change after one month (p = 0.102, 0.106). There was no significant change in alpha diversity indexes in submerged sand before and after the typhoon (p > 0.05).

3.4. Bacterial Community Structure and Composition in Seawater and Sand Samples of the Bathing Beach

All the detected OTUs were classified into 55 phyla, 144 classes, 363 orders, 627 families, and 2256 genera. Although Proteobacteria and Bacteroidetes were dominant in seawater (accounting for 73.21% and 15.18%, respectively) and sand samples (accounting for 41.98% and 17.17%, respectively), the bacterial communities at the phylum level in seawater and sand were different (Figure S2).
NMDS also showed that the seawater samples’ bacterial community was completely separated from beach sand, even experiencing the typhoon event (Figure 4a). In addition, the bacterial community structure in alongshore and offshore seawater samples was clustered at the OTU level. ANOSIM analysis showed no difference in the bacterial communities at the phylum level between alongshore and offshore seawater samples (p > 0.05). In contrast, there was a significant difference between before and immediately after the typhoon (p < 0.05). Nearly one month after the typhoon, the bacterial community in seawater approached the cluster before the typhoon.
NMDS analysis also showed that most bacterial communities in the dry sand were separate from wet and submerged sand, while there was some overlap among dry sand, wet sand, and submerged sand immediately after the typhoon event (Figure 4a). ANOSIM analysis showed no difference between wet sand and submerged sand samples at the phylum level (p > 0.05). Furthermore, the bacterial community structure in dry sand samples was significantly different before, immediately after, and one month after the typhoon event (p < 0.01).
Hcluster_tree was performed to quantify the homologies, which showed that the bacterial community before (11 August 2018) and nearly one month after the typhoon (15 September 2018) clustered in seawater, while most bacterial communities at different stations clustered immediately after the typhoon (21 August 2018), except for W2 station nearly one month after the typhoon (15 September 2018). Most bacterial communities clustered immediately after the typhoon in beach sand (dry, wet, and submerged sand), concordant with the NMDS analysis. Before and one month after the typhoon, the bacterial community in subtidal sediment (SS) clustered, while this trend was not evident in dry sand (DS) and wet sand (WS) (Figure 4b).

3.5. The Bacterial Community Structure Transition Due to the Typhoon Event

In alongshore seawater (AS), before and immediately after the typhoon, the dominant bacteria (more than 10%) did not change at the phylum level, i.e., Proteobacteria and Bacteroidetes. In offshore seawater (OS), before the typhoon, the dominant bacteria were Proteobacteria (73.1%), Bacteroidetes (11.8%), and Cyanobacteria (11.1%), while immediately after the typhoon, the dominant bacteria changed into Proteobacteria (78.4%) and Bacteroidetes (10.7%), and Cyanobacteria decreased to 2.4%. Immediately after the typhoon (21 August 2018), the dominant bacteria in the dry sand changed from Proteobacteria (46.9%) and Bacteroidetes (29.5%) to Proteobacteria (42.1%), Bacteroidetes (15.6%), Acidobacteriota (11.1%) and Planctomycetota (10.5%). In comparison, the dominant bacteria in the wet sand changed from Proteobacteria (46.0%) and Bacteroidetes (25.0%) to Proteobacteria (49.3%), Bacteroidetes (12.4%) and Planctomycetota (10.9%) (Figure 5).
Alphaproteobacteria and Gammaproteobacteria abundance fluctuated during the typhoon. Gammaproteobacteria was highest before the typhoon and further decreased from 61.0% to 44.2% in seawater, while Alphaproteobacteria increased from 15.4% to 44.2% immediately after the typhoon. In dry sand, Alphaproteobacteria decreased from 19.2% to 10.8%, while Gammaproteobacteria increased from 27.6% to 31.3%. In wet sand, Alphaproteobacteria decreased from 14.8% to 8.0%, while Gammaproteobacteria increased from 31.1% to 41.2%.
The dominant Sphingomonadaceae of the class Alphaproteobacteria significantly increased in seawater samples but significantly decreased in dry sand samples immediately after the typhoon and recovered nearly one month after the typhoon event (15 September 2018). Rhodobacteraceae, the largest family of Alphaproteobacteria, decreased in dry sand but increased in seawater. Woeseiaceae and Marinobacteraceae from Gammaproteobacteria increased in dry sand and wet sand, respectively. Flavobacteriaceae from the class Bacteroidetes, the largest family of this phylum, significantly decreased in the beach sand (dry and wet sand) and seawater samples immediately after the typhoon. Saprospiraceae (Bacteroidetes) also decreased. Thermoanaerobaculaceae from Acidobacteroita increased in dry and wet sand. All these taxa nearly returned to the former level or showed a recovery trend nearly one month after the typhoon event.

3.6. Fecal Contamination Based on DNA Sequencing during the Typhoon Event

The fecal taxa were analyzed to evaluate the fecal input caused by typhoon and heavy storm. Sequences associated with human fecal taxa (Bacteroidaceae, Prevotellaceae, and Rikenellaceae) and other fecal taxa (Enterococcaceae and Enterobacteriaceae) were found significantly more abundant immediately after the typhoon (Figure 6). Therefore, the total fecal taxa significantly increased at the family level.
The genera of Enterococcus was further analyzed and were not detected using high-throughput sequencing technology in most samples. Enterococcus was mainly detected in sand samples (1–12 OTUs), especially immediately after and one month after the typhoon. Enterococcus was also detected in wet sand after the typhoon event. Only 1 OTU of Enterococcus was detected immediately after the typhoon event, respectively, in the alongshore seawater, offshore seawater, and submerged sand samples.

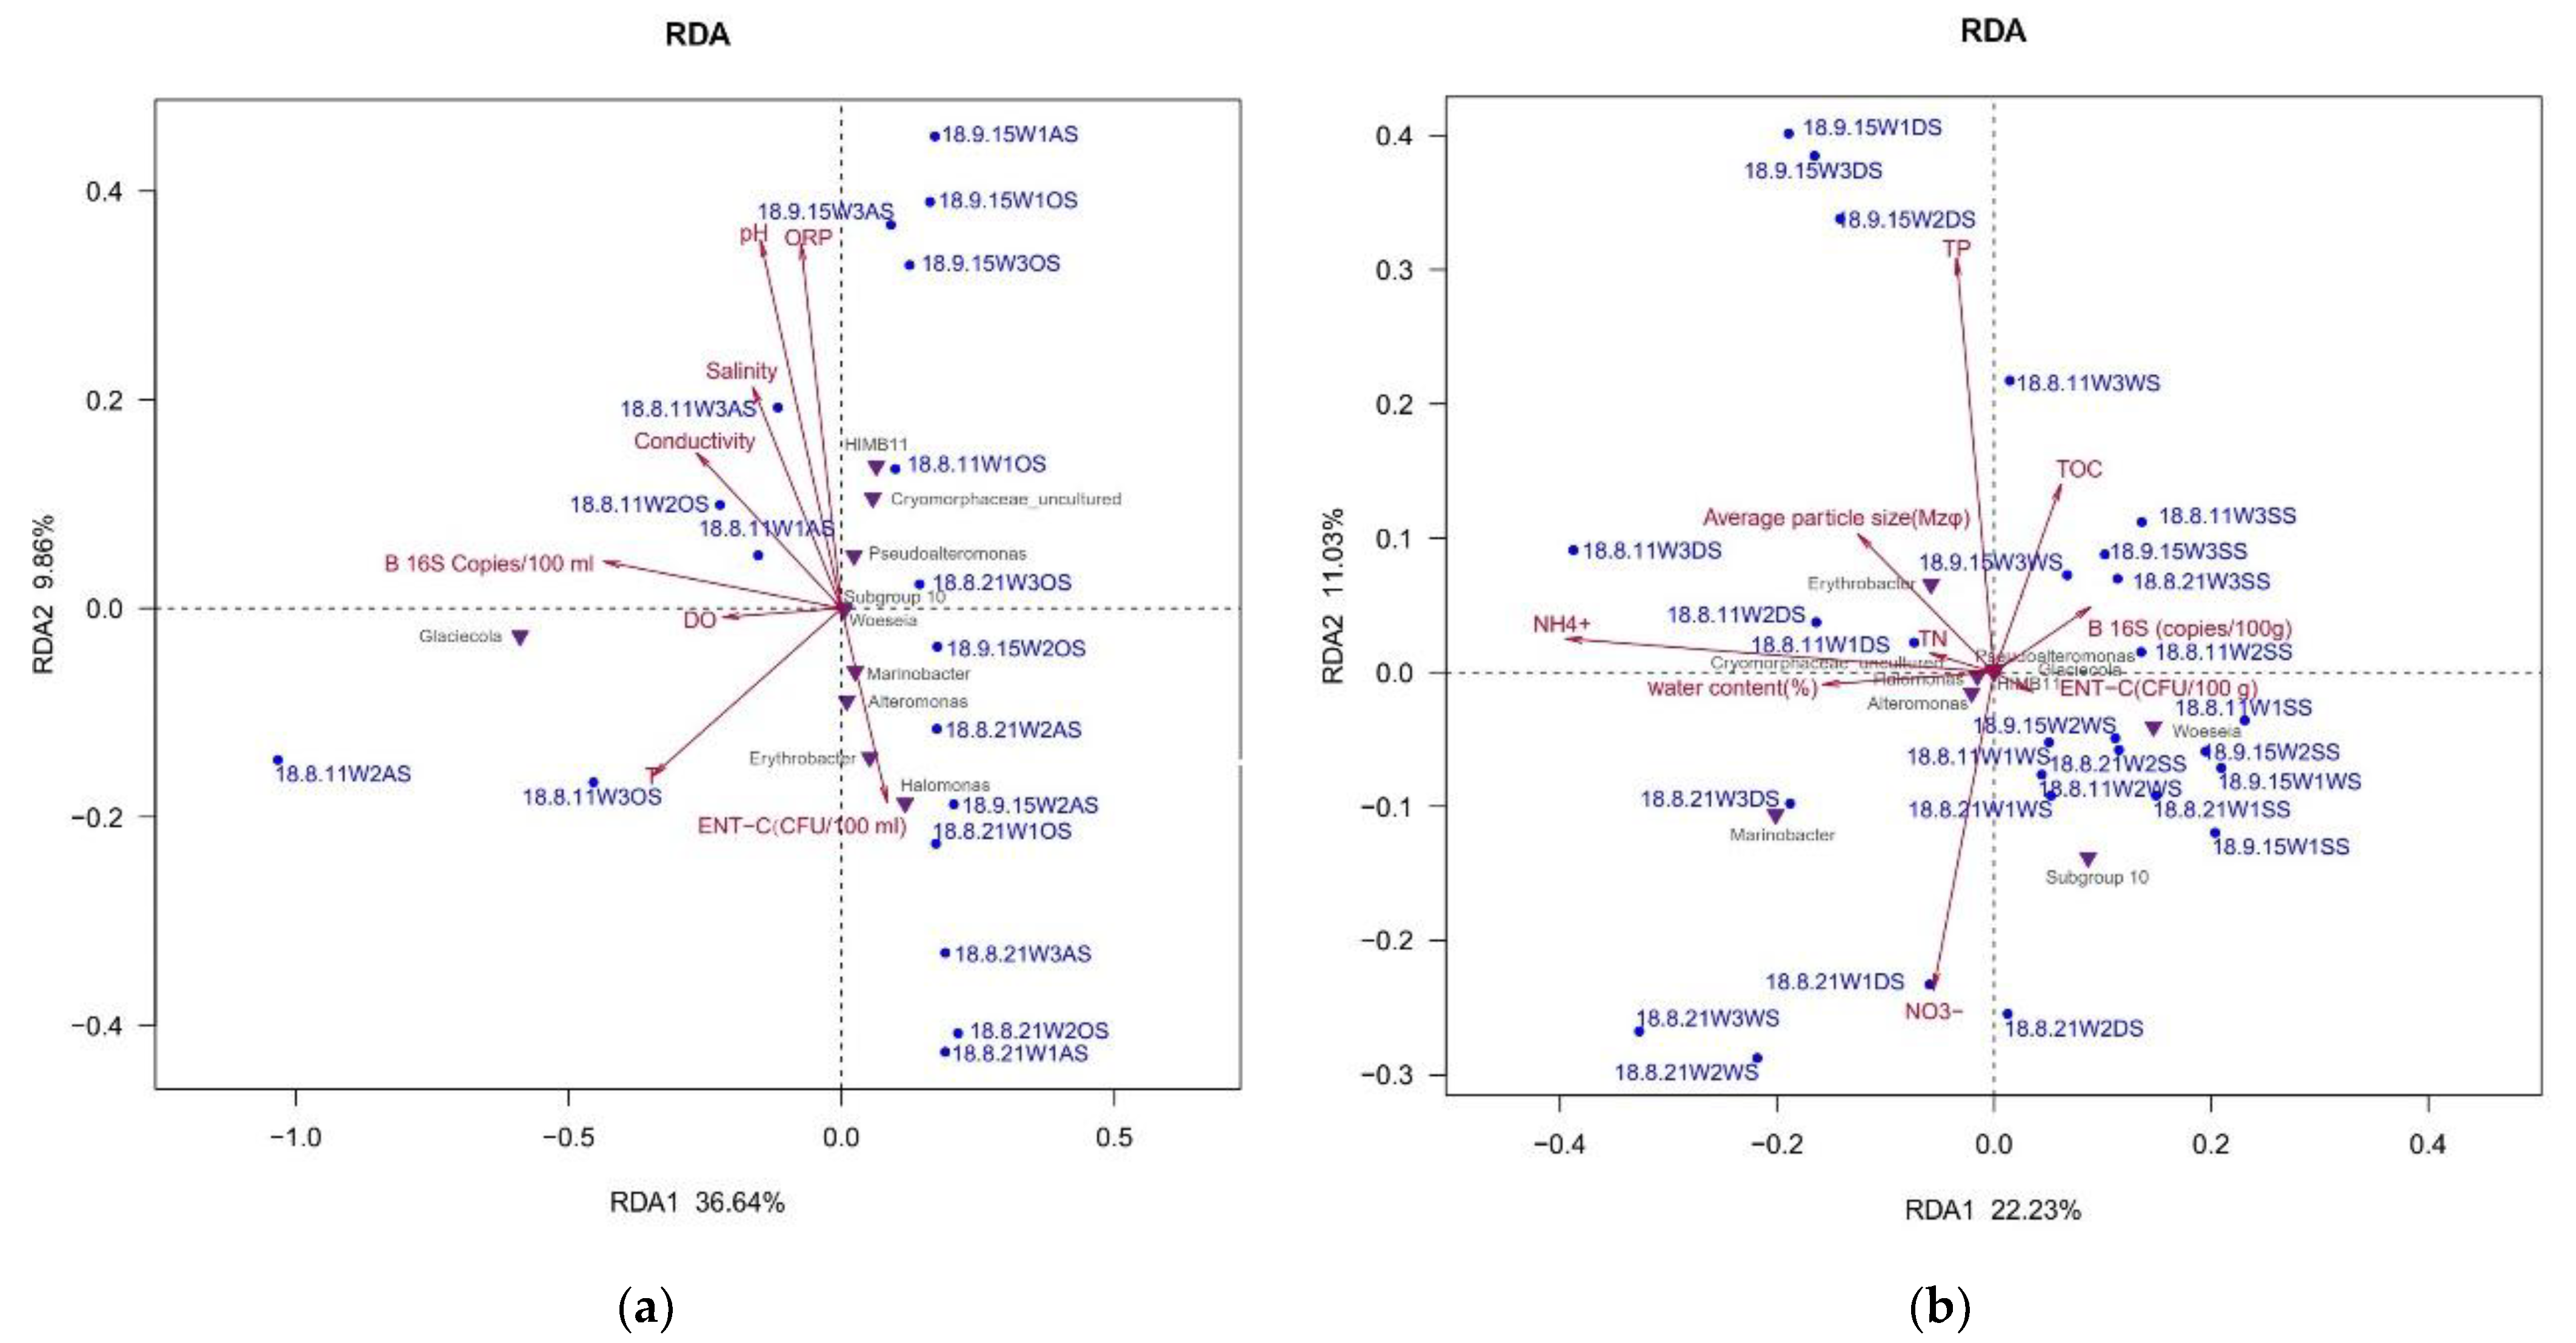
3.7. The Main Environmental Factor Affecting Bacterial Community Structure

RDA was conducted to identify specific environmental drivers of community structure in seawater and sand of Jinshitan bathing beach. The detected water quality parameters explained 46.50% of the total variance (Figure 7a), and the permutation test further showed that pH (p < 0.01) and ORP (p < 0.05) had the highest correlation with microbial community structure, followed by salinity (p > 0.05) and water temperature (p < 0.05). Furthermore, total bacteria (B16S) gene abundance (p < 0.05) and enterococci concentration (ENT-C) (p > 0.05) in seawater were important biological factors for community structure variance.
RDA showed that nutrient and sand particle size explained 33.26% of the total variance of the bacterial community in beach sand (Figure 7b). The permutation test showed that total nitrogen (p > 0.05), NH4+ (p < 0.05), and NO3 (p > 0.05) were the main factors impacting bacterial community structure, followed by TOC and sand particle size (p > 0.05). The abundance of total bacteria and cultivable enterococci contributed little to the bacterial community structure variance in beach sand.

4. Discussions

The impact of typhoon and heavy storm on the water quality of marine bathing beaches has not been well studied due to the apparent geographical heterogeneity of bacterial pollution. In this study, one typical typhoon event in 2018 was tracked, and the change in bacterial community structure, FIB abundance, and specific taxa of fecal pollution was evaluated in seawater and beach sand samples. Furthermore, the restructuring of the bacterial community and driven factors were also assessed.

4.1. Effects of the Typhoon on Water Quality

The different typhoon impacts on water quality were observed based on FIB of enterococci and fecal taxa. The cultivable enterococci increased in seawater (alongshore and offshore seawater) but reduced significantly in dry sand after the typhoon (p < 0.01). Meanwhile, exceeding ratios of recreation water quality (enterococci > 104 CFU/100 mL, US EPA criterion) doubled, from 33.33% to 66.7%. This result may prove the transportation of the enterococci from dry sand into seawater [10,23] or that they were washed deep into the sand beach caused by the surface runoff after the typhoon event. Suzuki proved that enterococci could be detected through the surface to 85 cm deep in dry sand after experiencing a typhoon [4]. Most probably, new land-based fecal pollution was transported during a rainstorm, proved by the increase in human (Bacteroidaceae, Prevotellaceae, and Rikenellaceae) and other fecal taxa (Enterococcaceae and Enterobacteriaceae) after the typhoon (Figure 6), and which posed a potential threat to water quality of the bathing beach and public health [24].
The impact of the typhoon on water quality was different in all stations and metrics. In general, enterococci increased during the typhoon; however, the increase was observed only in alongshore seawater of the W3 station (p < 0.01), while enterococci decreased in W1 and W2 stations immediately after the typhoon. This could be due to the direct input of the Tupaogou river, located upstream of the W3 station. The enterococci also had a slight increase in the sample of W3 submerged sand due to a possible sediment resuspension [25], which decreased in the beach sand (dry sand, wet sand, and submerged sand) of other stations. Correspondingly, the salinity and conductivity in the W3 station declined substantially (p < 0.01), while TOC in beach sand of this station increased, representing a significant influence of terrestrial nutrient flux from river to beach [26]. Rudic et al. proved the strong positive correlations between enterococci and organic matter [27]. Therefore, although the concentration of enterococci both in dry sand and wet sand of W3 station decreased due to the rainstorm, the decline was significantly less than that in W1 and W2 stations. Besides, on the same vertical gradient, the water depth of the W3 station was shallow, and the wave energy was influenced by the beach bottom slope [28]; therefore, it was more easily affected by the typhoon. Except for the input of the river and water depth, the swimmers were another impacting factor of enterococci in bathing beach. The former report showed that for swimmers exposed to seawater for 15 min, 600,000 CFU enterococci would be shed into the water [29]. Therefore, with the sharp decrease of swimmers after the typhoon, the concentration of enterococci decreased in seawater of W1 and W2 stations.

4.2. Typhoon-Induced Redistribution of Bacterial Community

Studies show that dry sand’s richness and diversity in freshwater and seawater beaches are generally higher than in seawater and wet sand [30]. In the absence of severe weather changes, the community structure of dry sand is more stable than wet and submerged sand [31]. In this study, the alpha diversity gradually increased from seawater to dry sand, wet sand, and submerged sand under the influence of typhoons. Cluster results showed that the community structure in the beach sand samples changed drastically due to the impact of the typhoon. NMDS further showed the transportation of the bacteria during the typhoon from dry sand into wet and submerged sand (Figure 4). The evidence showed that many bacterial taxa were washed into the seawater [32] or deep sand [33], which can be proved by the changed sediment particle size. The increase in the nutritional load could increase bacterial richness and diversity in the seawater [34]. Although bacteria’s abundance decreased in seawater and beach sand immediately after the typhoon, richness and diversity significantly increased. The reason for the increase of bacteria richness and diversity was environmental pressure.
The change in the bacterial community during the typhoon was analyzed further. Compared with before the typhoon, Cyanobacteria decreased in seawater after the typhoon, while Acidobacteriota and Planctomycetota increased. Bacteroidetes decreased both in seawater and sand after the typhoon. Although proteobacteria were the dominant bacteria at the phylum level during the typhoon, Alphaproteobacteria and Gammaproteobacteria fluctuated. Sphingomonadaceae (Alphaproteobacteria), probably derived from soils and surface waters, significantly increased in seawater but decreased in dry sand immediately after the typhoon, representing the bacteria’s transportation from land or sand to seawater [35]. Both Woeseiaceae in dry sand and Marinobacteraceae in wet sand within Gammaproteobacteria increased. Flavobacteriaceae from the pyhlum Bacteroidetes significantly decreased in the beach sand and seawater samples immediately after the typhoon, and Saprospiraceae within the phylum Bacteroidetes also decreased. Comparatively, Thermoanaerobaculaceae from Acidobacteroita, mainly sources related to freshwater hot springs and sediments [36], increased in dry and wet sand, which represented the land-based pollution.

4.3. The Recovery of Bacterial Community Structure after the Typhoon

Previous studies showed that heavy storm events significantly restructure instream bacterial communities [12,37]. Our results further confirmed the transportation or exchange of bacterial community in seawater and beach sand after the typhoon, potentially caused by sediment resuspension, surface runoff, and riverine input. Previous reports have observed the restructuring of in-stream bacterial community structure after a storm event [12], and the bacterial community of surface sand recovered within one month on one recreational beach [4]. In this work, cluster analysis showed that the bacterial community was restored in seawater and wet sand after one month of the typhoon. However, the bacterial community of dry sand did not recover. The bacterial community change in dry sand was probably impacted by other factors independent of the typhoon, such as geographical location [12].
Studies showed that the more complex the microbial diversity, the stronger its ability to resist environmental disturbance and pollution [38], thus recovering quickly [4], even if disturbed by force majeure [39]. In this study, the bacterial community in the wet sand showed the highest species richness and diversity; therefore, its bacterial community structure was stable and recovered quickly. The bacterial community in the dry sand was more easily impacted by disturbance than in wet and submerged sand; thus, the bacterial community did not recover in dry sand one month after the typhoon. NH4+ and NO3 were the main factors impacting bacterial community structure in beach sand, while there was no significant nutrient change during the typhoon event. Furthermore, the geographical location and natural properties of the sand were also the impacting factors [40]. Although the bacterial community in seawater had the lowest species richness and diversity, the bacterial community was nearly restored. The seawater possibly had a strong cacheability compared with beach sand, and the change of physical parameters such as temperature was comparably stable. In general, processes of accumulation/transportation of compounds were faster [31]. RDA analysis further showed that pH, ORP, and water temperature were the significant factors of bacterial community structure variance in seawater, followed by bacteria abundance.

5. Conclusions

(1)
The concentration of enterococci in sand samples decreased while it increased in seawater, and the water quality significantly deteriorated after the typhoon and heavy storm. Human and other fecal taxa increased immediately after the typhoon caused by runoff or riverine input. The transportation of fecal bacteria was observed from sand or runoff to seawater on the bathing beach.
(2)
There were significant differences in microbial community structure between seawater and beach sand samples even after the typhoon. Immediately after the typhoon, the bacterial community diversity commonly increased. One month later, the bacterial diversity in seawater and dry sand decreased, while there was a significant difference between before and one month after the typhoon in the dry sand. However, in wet or submerged sand, the diversity nearly recovered.
(3)
The bacterial community in Jinshitan bathing beach changed after the typhoon. Cyanobacteria decreased in seawater, while Acidobacteriota and Planctomycetota increased. Bacteroidetes in seawater and sand decreased. However, Alphaproteobacteria and Gammaproteobacteria fluctuated during the typhoon event.
(4)
The water quality parameters of seawater had a high degree of interpretation for their community structure, among which pH, ORP, and water temperature were the most significant factors. Bacteria abundance was another vital factor. NH4+ was the most driven factor of the bacterial community in the sand. Apart from the impact of the typhoon, the geographical location was another important factor in the changed bacterial community.

Supplementary Materials

The following supporting information can be downloaded at: https://www.mdpi.com/article/10.3390/w14101631/s1, Figure S1: The concentrations of total bacteria in seawater and sand samples of Jinshitan bathing beach. Figure S2: The bacterial community at phylum level in Jinshitan bathing beach during typhoon events of 2018. Table S1: 16S rRNA gene sequencing information of bacteria in beach seawater and sand.

Author Contributions

H.M. designed experiments and wrote the manuscript; Y.W. carried out this experiment and prepared the original draft, who had the same contribution to this article as H.M.; J.S. participated in designing experiments; Y.F. participated in experiments; J.X. analyzed experimental results; T.S. revised the manuscript; K.R. was responsible for formal analysis; Y.J. participated in experiments, J.F. designed and supported the study. All authors have read and agreed to the published version of the manuscript.

Funding

This work was funded by the National Key R&D Program of China (Grant 2017 YFC1404500), Millions of Talent Program of Liaoning Province, China (2020Z201), and People’s Livelihood Science and Technology Program of Liaoning Province, China (2021JH2/10300001).

Institutional Review Board Statement

Not applicable.

Informed Consent Statement

Not applicable.

Data Availability Statement

Not applicable.

Conflicts of Interest

The authors declare no conflict of interest.

References

  1. United Nations. The Ocean Conference. Available online: https://www.un.org/sustainabledevelopment/wp-content/uploads/2017/05/Oceanfact-sheet-package.pdf (accessed on 30 March 2017).
  2. WHO. Chapter 4: Faecal pollution and water quality. In Guidelines for Safe Recreational Water Environments. Volume 1, Coastal and Fresh Water; World Health Organization: Geneva, Switzerland, 2003; pp. 51–101. [Google Scholar]
  3. Ahmed, W.; Zhang, Q.; Lobos, A.; Senkbeil, J.; Sadowsky, M.J.; Harwood, V.J.; Saeidi, N.; Marinoni, O.; Ishii, S. Precipitation influences pathogenic bacteria and antibiotic resistance gene abundance in storm drain outfalls in coastal sub-tropical waters. Environ. Int. 2018, 116, 308–318. [Google Scholar] [CrossRef] [PubMed]
  4. Suzuki, Y.; Teranishi, K.; Matsuwaki, T.; Nukazawa, K.; Ogura, Y. Effects of bacterial pollution caused by a strong typhoon event and the restoration of a recreational beach: Transitions of fecal bacterial counts and bacterial flora in beach sand. Sci. Total Environ. 2018, 640, 52–61. [Google Scholar] [CrossRef] [PubMed]
  5. Abreu, R.; Figueira, C.; Romão, D.; Brandão, J.; Freitas, M.C.; Andrade, C.; Calado, G.; Ferreira, C.; Campos, A.; Prada, S. Sediment characteristics and microbiological contamination of beach sand–A case–study in the archipelago of Madeira. Sci. Total Environ. 2016, 573, 627–638. [Google Scholar] [CrossRef] [PubMed]
  6. Efstratiou, M.A. Microorganisms in beach sand: Health implications. In Encyclopedia of Environmental Health, 2nd ed.; Elsevier: Amsterdam, The Netherlands, 2019; pp. 385–389. [Google Scholar]
  7. Fang, H.; Chen, Y.; Huang, L.; He, G. Analysis of biofilm bacterial communities under different shear stresses using size-fractionated sediment. Sci. Rep. 2017, 7, 1299. [Google Scholar] [CrossRef] [Green Version]
  8. Weiskerger, C.J.; Brandão, J.; Ahmed, W.; Aslan, A.; Avolio, L.; Badgley, B.D.; Boehm, A.B.; Edge, T.A.; Fleisher, J.M.; Heaney, C.D. Impacts of a changing earth on microbial dynamics and human health risks in the continuum between beach water and sand. Water Res. 2019, 162, 456–470. [Google Scholar] [CrossRef]
  9. Korajkic, A.; McMinn, B.R.; Harwood, V.J. Relationships between microbial indicators and pathogens in recreational water settings. Int. J. Environ. Res. Public Health 2018, 15, 2842. [Google Scholar] [CrossRef] [Green Version]
  10. Solo-Gabriele, H.M.; Harwood, V.J.; Kay, D.; Fujioka, R.S.; Sadowsky, M.J.; Whitman, R.L.; Wither, A.; Caniça, M.; Da Fonseca, R.C.; Duarte, A. Beach sand and the potential for infectious disease transmission: Observations and recommendations. J. Mar. Biol. Assoc. UK 2016, 96, 101–120. [Google Scholar] [CrossRef] [Green Version]
  11. Williamson, C.E.; Madronich, S.; Lal, A.; Zepp, R.G.; Lucas, R.M.; Overholt, E.P.; Rose, K.C.; Schladow, S.G.; Lee-Taylor, J. Climate change-induced increases in precipitation are reducing the potential for solar ultraviolet radiation to inactivate pathogens in surface waters. Sci. Rep. 2017, 7, 13033. [Google Scholar] [CrossRef]
  12. Ulrich, N.; Rosenberger, A.; Brislawn, C.; Wright, J.; Kessler, C.; Toole, D.; Solomon, C.; Strutt, S.; McClure, E.; Lamendella, R. Restructuring of the aquatic bacterial community by hydric dynamics associated with superstorm sandy. Appl. Environ. Microbiol. 2016, 82, 3525–3536. [Google Scholar] [CrossRef] [Green Version]
  13. McLellan, S.L.; Eren, A.M. Discovering new indicators of fecal pollution. Trends Microbiol. 2014, 22, 697–706. [Google Scholar] [CrossRef] [Green Version]
  14. National Standard of the People’s Republic of China. GB/T 12763.8; Specifications for Oceangraphic Survey—Part 8: Marine Gclogy and Geophysics Survey. China Standards Press of China National Standardization Administration: Bejing, China, 2007.
  15. National Standard of the People’s Republic of China. HJ 634-2012; Soil Determination of Ammonium, Nitrite and Nitrate by Extraction with Potassium Chloride Solution-Spectrophotometric Methods. China Environmental Science Press: Bejing, China, 2012.
  16. Wang, Z.F.; Hu, C.Y.; Lv, H.Y. A Method for Determining Total Nitrogen in Sea Water and Marine Sediments. J. Ocean Univ. Qingdao China 1999, 161–166. [Google Scholar]
  17. Hu, C.Y.; Wang, Z.F.; Lv, H.Y. A Method for Determining Total Phosphorus in Sea Water and Marine Sediments. Mar. Environ. Sci. China 1999, 8, 48–52. [Google Scholar]
  18. National Standard of the People’s Republic of China. GB 17378.5; The Specification for Marine Monitoring—Part 5: Sediment analysis. China Standards Press of China National Standardization Administration: Bejing, China, 2007.
  19. Ming, H.; Fan, J.; Li, D.; Su, J.; Wang, Y.; Shi, T.; Jin, Y.; Song, J.; Huang, H. A Method for the Identification of Enterococcus in Seawater and Marine Sediments. N202010177272.4, 13 March 2020. [Google Scholar]
  20. Newton, R.J.; McLellan, S.L.; Dila, D.K.; Vineis, J.H.; Morrison, H.G.; Eren, A.M.; Sogin, M.L. Sewage reflects the microbiomes of human populations. MBio 2015, 6, e02574-14. [Google Scholar] [CrossRef] [PubMed] [Green Version]
  21. Shanks, O.C.; Green, H.; Korajkic, A.; Field, K.G. Overview of microbial source tracking methods targeting human fecal pollution sources. In Manual of Environmental Microbiology; John Wiley & Sons, Ltd.: Hoboken, NJ, USA, 2015; pp. 3–4. [Google Scholar]
  22. Brown, K.I.; Graham, K.E.; Boehm, A.B. Risk-based threshold of gull-associated fecal marker concentrations for recreational water. Environ. Sci. Technol. Lett. 2017, 4, 44–48. [Google Scholar] [CrossRef]
  23. Arnaud, E.; Best, A.; Parker, B.L.; Aravena, R.; Dunfield, K. Transport of Escherichia coli through a thick vadose zone. J. Environ. Qual. 2015, 44, 1424–1434. [Google Scholar] [CrossRef] [PubMed]
  24. Bolds, S.A.; Lockaby, B.G.; Ditchkoff, S.S.; Smith, M.D.; Vercauteren, K.C. Impacts of a large invasive mammal on water quality in riparian ecosystems. J. Environ. Qual. 2021, 50, 441–453. [Google Scholar] [CrossRef] [PubMed]
  25. Abia, A.L.K.; Ubomba-Jaswa, E.; Genthe, B.; Momba, M.N.B. Quantitative microbial risk assessment (QMRA) shows increased public health risk associated with exposure to river water under conditions of riverbed sediment resuspension. Sci. Total Environ. 2016, 566, 1143–1151. [Google Scholar] [CrossRef]
  26. Butman, D.E.; Wilson, H.F.; Barnes, R.T.; Xenopoulos, M.A.; Raymond, P.A. Increased mobilization of ages carbon to rivers by human disturbance. Nat. Geosci. 2015, 8, 112–116. [Google Scholar] [CrossRef]
  27. Rudic, E.; Vujovi, B.; Boi, M.; Arizanović, T. Relationships between water and sediment quality parameters and faecal bacteria content in the Palic-Ludas canal, Serbia. Int. J. Environ. Res. Public Health 2018, 64, 292. [Google Scholar]
  28. Wu, M.Z.; O’Carroll, D.M.; Vogel, L.J.; Robinson, C.E. Effect of low energy waves on the accumulation and transport of fecal indicator bacteria in sand and pore water at freshwater beaches. Environ. Sci. Technol. 2017, 51, 2786–2794. [Google Scholar] [CrossRef]
  29. Elmir, S.M.; Wright, M.E.; Abdelzaher, A.; Solo-Gabriele, H.M.; Fleming, L.E.; Miller, G.; Rybolowik, M.; Shih, M.T.P.; Pillai, S.P.; Cooper, J.A. Quantitative evaluation of bacteria released by bathers in a marine water. Water Res. 2007, 41, 3–10. [Google Scholar] [CrossRef] [PubMed] [Green Version]
  30. Abu-Bakar, A.; Ahmadian, R.; Falconer, R.A. Modelling the transport and decay processes of microbial tracers in a macro-tidal estuary. Water Res. 2017, 123, 802–824. [Google Scholar] [CrossRef]
  31. Cloutier, D.D.; Alm, E.W.; McLellan, S.L. Influence of land use, nutrients, and geography on microbial communities and fecal indicator abundance at Lake Michigan beaches. Appl. Environ. Microbiol. 2015, 81, 4904–4913. [Google Scholar] [CrossRef] [Green Version]
  32. Brown, K.I.; Boehm, A.B. Comparative decay of Catellicoccus marimmalium and enterococci in beach sand and seawater. Water Res. 2015, 83, 377–384. [Google Scholar] [CrossRef] [PubMed]
  33. Feng, Z.; Reniers, A.; Haus, B.K.; Solo-Gabriele, H.M.; Kelly, E.A. Wave energy level and geographic setting correlate with Florida beach water quality. Mar. Pollut. Bull. 2016, 104, 54–60. [Google Scholar] [CrossRef] [PubMed] [Green Version]
  34. Hassard, F.; Andrews, A.; Jones, D.L.; Parsons, L.; Jones, V.; Cox, B.A.; Daldorph, P.; Brett, H.; McDonald, J.E.; Malham, S.K. Physicochemical factors influence the abundance and culturability of human enteric pathogens and fecal indicator organisms in estuarine water and sediment. Front. Microbiol. 2017, 8, 1996. [Google Scholar] [CrossRef]
  35. Hu, W.; Murata, K.; Horikawa, Y.; Naganuma, A.; Zhang, D.Z. Bacterial community composition in rainwater associated with synoptic weather in an area downwind of the Asian continent. Sci. Total Environ. 2017, 601, 1775–1784. [Google Scholar] [CrossRef]
  36. Dedysh, S.N.; Losey, N.A.; Lawson, P. Thermoanaerobaculaceae. In Bergey’s Manual of Systematics of Archaea and Bacteria; John Wiley & Sons, Inc.: Hoboken, NJ, USA, 2020; pp. 1–3. [Google Scholar]
  37. Li, D.; Werfhorst, L.C.V.D.; Rugh, M.B.; Feraud, M.; Hung, W.C.; Jay, J.; Cao, Y.P.; Parker, E.A.; Grant, S.B.; Holden, P.A. Limited Bacterial Removal in Full-Scale Stormwater Biofilters as Evidenced by Community Sequencing Analysis. Environ. Sci. Technol. 2021, 55, 9199–9208. [Google Scholar] [CrossRef]
  38. Kan, J. Storm events restructured bacterial community and their biogeochemical potentials. J. Geophys. Res. Biogeosci. 2018, 123, 1–34. [Google Scholar] [CrossRef]
  39. Yannarell, A.C.; Steppe, T.F.; Paerl, H.W. Disturbance and recovery of microbial community structure and function following Hurricane Frances. Environ. Microbiol. 2007, 9, 576–583. [Google Scholar] [CrossRef]
  40. Haller, L.; Amedegnato, E.; Poté, J.; Wildi, W. Influence of Freshwater Sediment Characteristics on Persistence of Fecal Indicator Bacteria. Water Air Soil Poll. 2009, 203, 217–227. [Google Scholar] [CrossRef] [Green Version]
Figure 1. Sampling sites of Jinshitan Bathing Beach.
Water 14 01631 g001
Figure 2. The concentration distribution of enterococci during the typhoon event, in which DS represents dry sand; WS represents wet sand; SS represents submerged sand; AS represents alongshore seawater; OS represents offshore seawater.
Water 14 01631 g002
Figure 3. Boxplot of sample: α diversity in seawater and beach sand in Jinshitan bathing beach. DS represents dry sand; WS represents wet sand; SS represents submerged sand; AS represents alongshore seawater; OS represents offshore seawater.
Water 14 01631 g003
Figure 4. NMDS and Hcluster_tree based on weighted_unifrac_otu and bray_curtis, respectively, in Jinshitan bathing beach during typhoon events. (a) NMDS; (b) Hcluster_tree.
Water 14 01631 g004aWater 14 01631 g004b
Figure 5. Changes in community structure at the family level (top 10) before and after the typhoon events in seawater (a), dry sand (b), wet sand (c), in which each column represents the parallel of three samples.
Water 14 01631 g005aWater 14 01631 g005b
Figure 6. The percentage of sequences associated with human and other fecal taxa during the typhoon events in Jinshitan bathing beach.
Water 14 01631 g006aWater 14 01631 g006b
Figure 7. RDA showed the relationship between physical-chemical parameters and the top ten bacterial genera in Jinshitan Bathing Beach. (a) Seawater; (b) beach sand.
Water 14 01631 g007
Table 1. Water quality parameters and bacterial concentration of alongshore seawater.
SamplesWater Temperature
(°C)
DO
(mg/L)
Conductivity
(µS/m)
SalinitypHORP
(mV)
11 August 2018 W1AS27.77.9750,79831.438.09206
21 August 2018 W1AS25.86.5748,31730.947.94149
15 September 2018 W1AS23.76.4646,53031.078.08217
11 August 2018 W1OS27.28.6350,44431.498.13265
21 August 2018 W1OS25.76.3048,26530.967.91185
15 September 2018 W1OS23.66.4346,53531.178.09210
11 August 2018 W2AS27.07.4050,12231.408.03144
21 August 2018 W2AS25.56.9146,91930.157.92125
15 September 2018 W2AS23.66.3146,65031.208.07204
11 August 2018 W2OS26.87.8850,04931.478.06244
21 August 2018 W2OS25.56.9547,16330.297.93151
15 September 2018 W2OS23.66.1846,61431.198.07207
11 August 2018 W3AS29.47.5752,54631.468.02182
21 August 2018 W3AS25.87.1727,90516.957.8767
15 September 2018 W3AS23.76.6046,52831.057.99190
11 August 2018 W3OS29.010.2652,18031.528.22213
21 August 2018 W3OS26.26.6739,79224.727.89101
15 September 2018 W3OS23.46.2246,42031.208.07205
Note: AS represented alongshore seawater; OS represented offshore seawater.
Table 2. Physical-chemical factors of beach sand.
SamplesSediment Grain Size (%)Median Size (Mdφ)Average Particle Size (Mzφ)Water Content
(%)
NO3
(10–3 µg/g)
NH4+
(10–3 µg/g)
TP
(10–3 µg/g)
TN
(10–3 µg/g)
TOC
(10–3 µg/g)
GravelSandSiltClay
11 August 2018 W1DS0.0099.900.100.000.670.680.961.74415.414016.70.059
21 August 2018 W1DS20.0579.950.000.000.320.051.191.66810.820912.50.027
15 September 2018 W1DS0.0099.550.280.170.991.010.182.4589.118510.70.057
11 August 2018 W2DS0.0099.500.290.211.171.223.221.69312.513113.70.593
21 August 2018 W2DS0.0099.910.090.000.810.821.261.61713.110315.80.210
15 September 2018 W2DS0.00100.000.000.000.940.940.021.2349.720410.40.210
11 August 2018W3DS0.0099.580.260.160.790.802.201.92314.920416.00.026
21 August 2018 W3DS0.00100.000.000.000.510.511.551.61712.514913.80.262
15 September 2018 W3DS0.00100.000.000.000.960.960.191.08113.117037.40.223
11 August 2018W1WS24.7175.290.000.00−0.08−0.232.021.74413.113814.60.040
21 August 2018 W1WS0.00100.000.000.000.310.3015.741.48910.818911.10.044
15 September 2018 W1WS0.0099.600.230.171.101.1716.862.53510.824313.90.303
11 August 2018W2WS42.6657.160.110.07−0.09−0.603.701.6429.126813.50.436
21 August 2018 W2WS0.00100.000.000.000.950.957.571.4897.341298.130.222
15 September 2018 W2WS0.0099.630.210.171.071.099.091.13210.219711.30.225
11 August 2018W3WS64.7535.250.000.00−1.22−1.244.751.71912.524213.20
21 August 2018 W3WS0.00100.000.000.000.940.839.551.59110.822111.20.241
15 September 2018 W3WS0.0099.670.180.161.061.0610.891.3369.116019.40.228
11 August 2018W1SS0.0098.870.710.422.202.077.631.77039.217745.90.070
21 August 2018 W1SS63.7236.260.020.00−0.97−0.869.661.6689.721313.30
15 September 2018 W1SS52.9646.840.140.061.861.7219.771.54014.326215.90.263
11 August 2018 W2SS0.0098.580.990.432.101.9420.281.6687.316913.70.324
21 August 2018 W2SS0.00100.000.000.000.120.1219.111.48921.820011.60.268
15 September 2018 W2SS0.0099.230.450.31−1.04−0.8513.911.79511.425611.90.180
11 August 2018 W3SS0.00100.000.000.001.571.5713.591.56614.315844.00.045
21 August 2018 W3SS0.00100.000.000.001.191.1921.341.82111.425213.40.196
15 September 2018 W3SS0.00100.000.000.001.151.1422.750.90316.615222.70.227
Note: DS represented dry sand; WS represented wet sand; SS represented submerged sand.
Publisher’s Note: MDPI stays neutral with regard to jurisdictional claims in published maps and institutional affiliations.

