
Is There Spatial and Temporal Variability in the Response of Plant Canopy and Trunk Growth to Climate Change in a Typical River Basin of Arid Areas

Abstract
:1. Introduction
2. Material and Methods
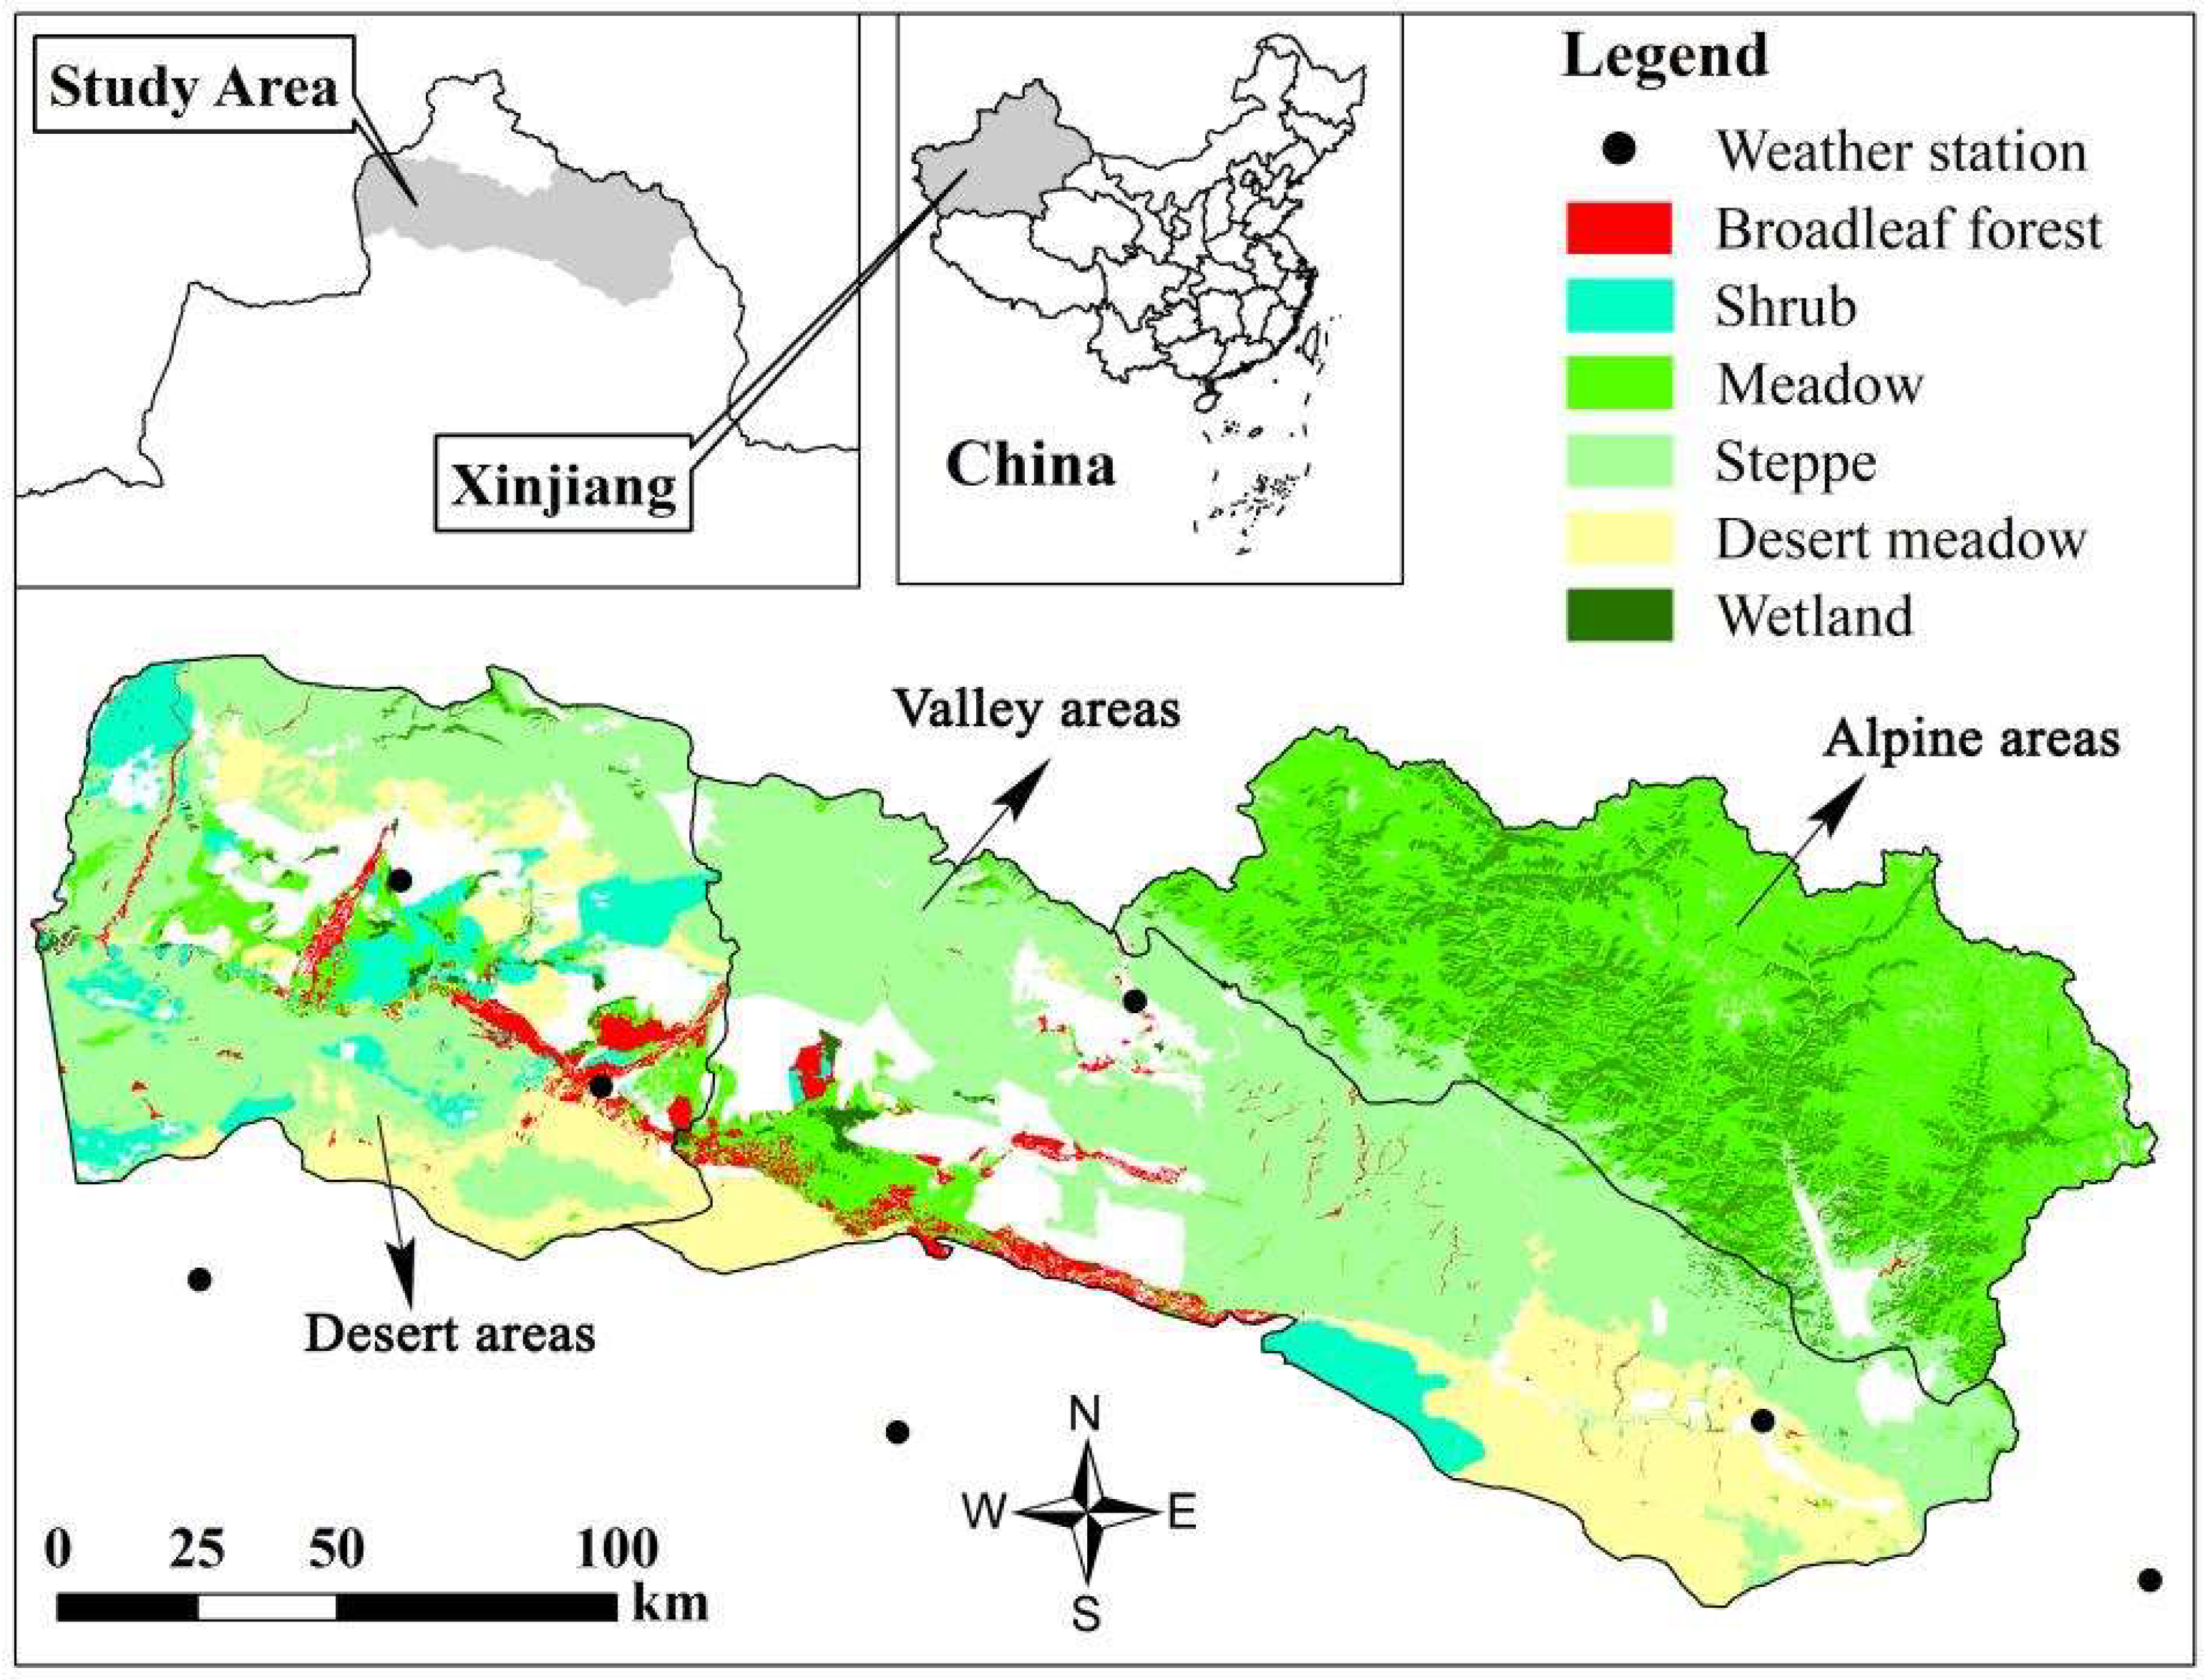
2.1. Study Regions
2.2. Sampling and Measurements
2.3. Data Analysis
2.3.1. SPEI
2.3.2. Mann–Kendall Test
2.3.3. Mutation Test
2.3.4. Contribution of Monthly NDVI Variation to TINDVI Variation
3. Results
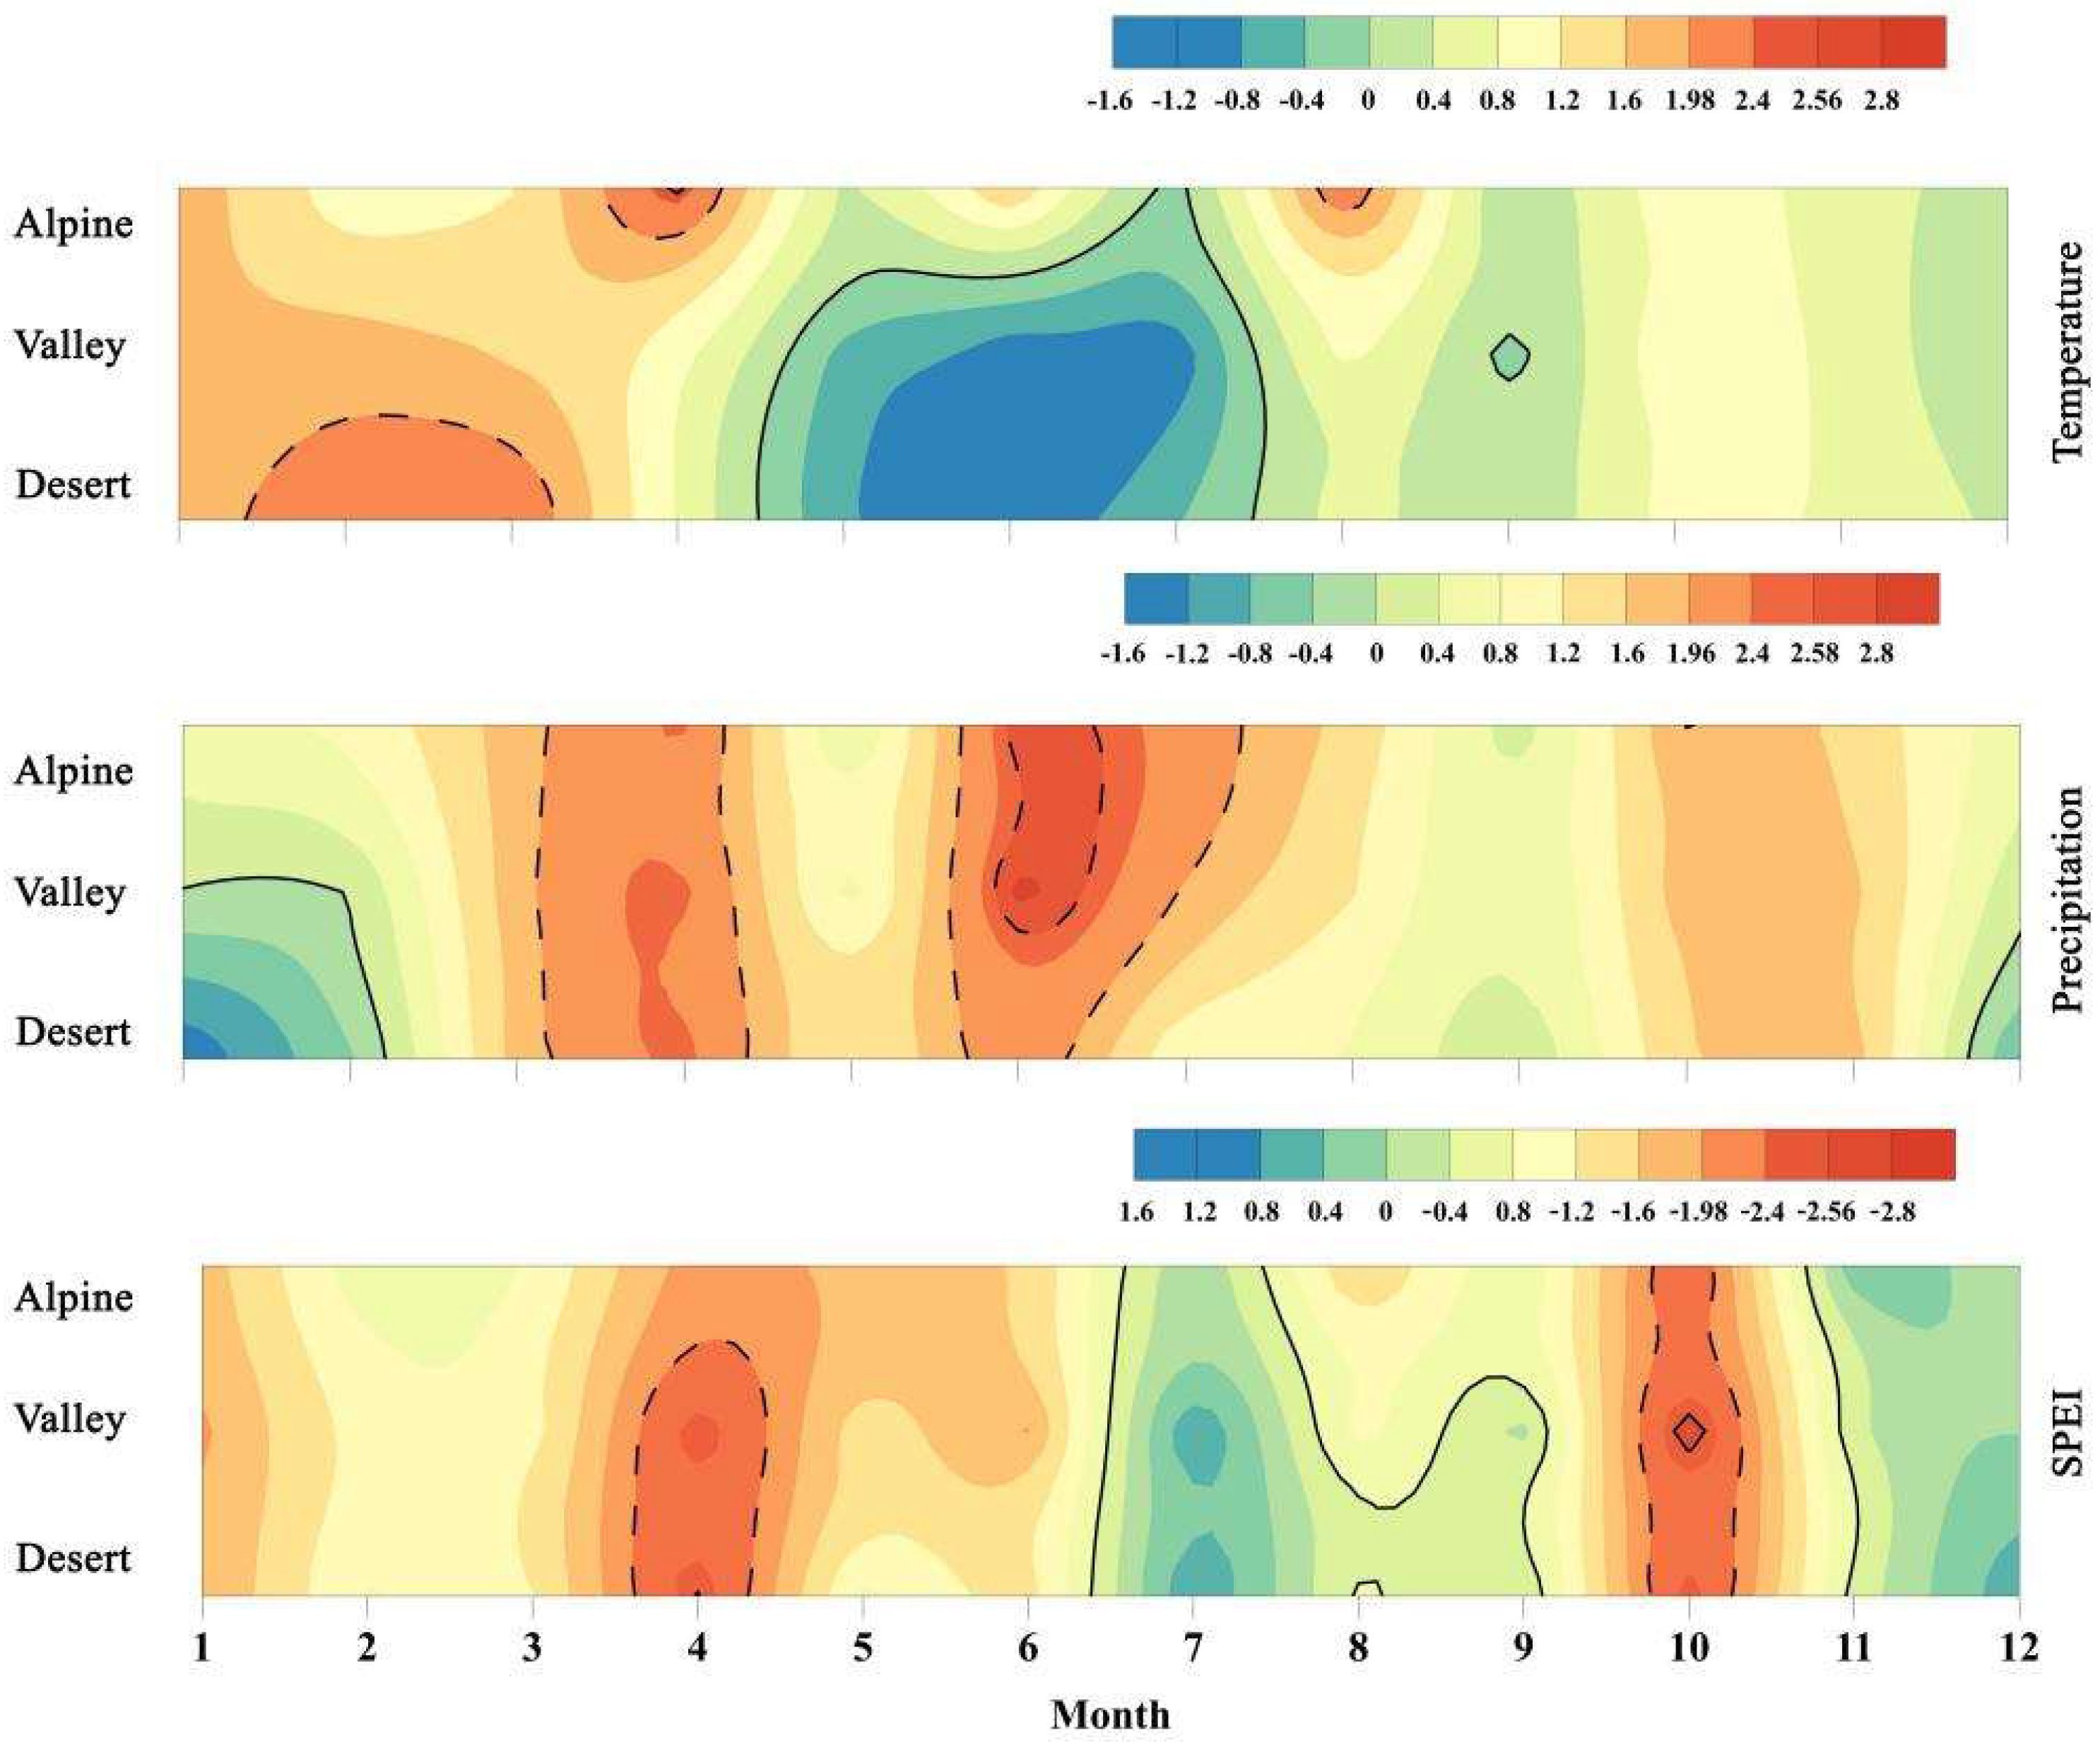
3.1. Climate Change
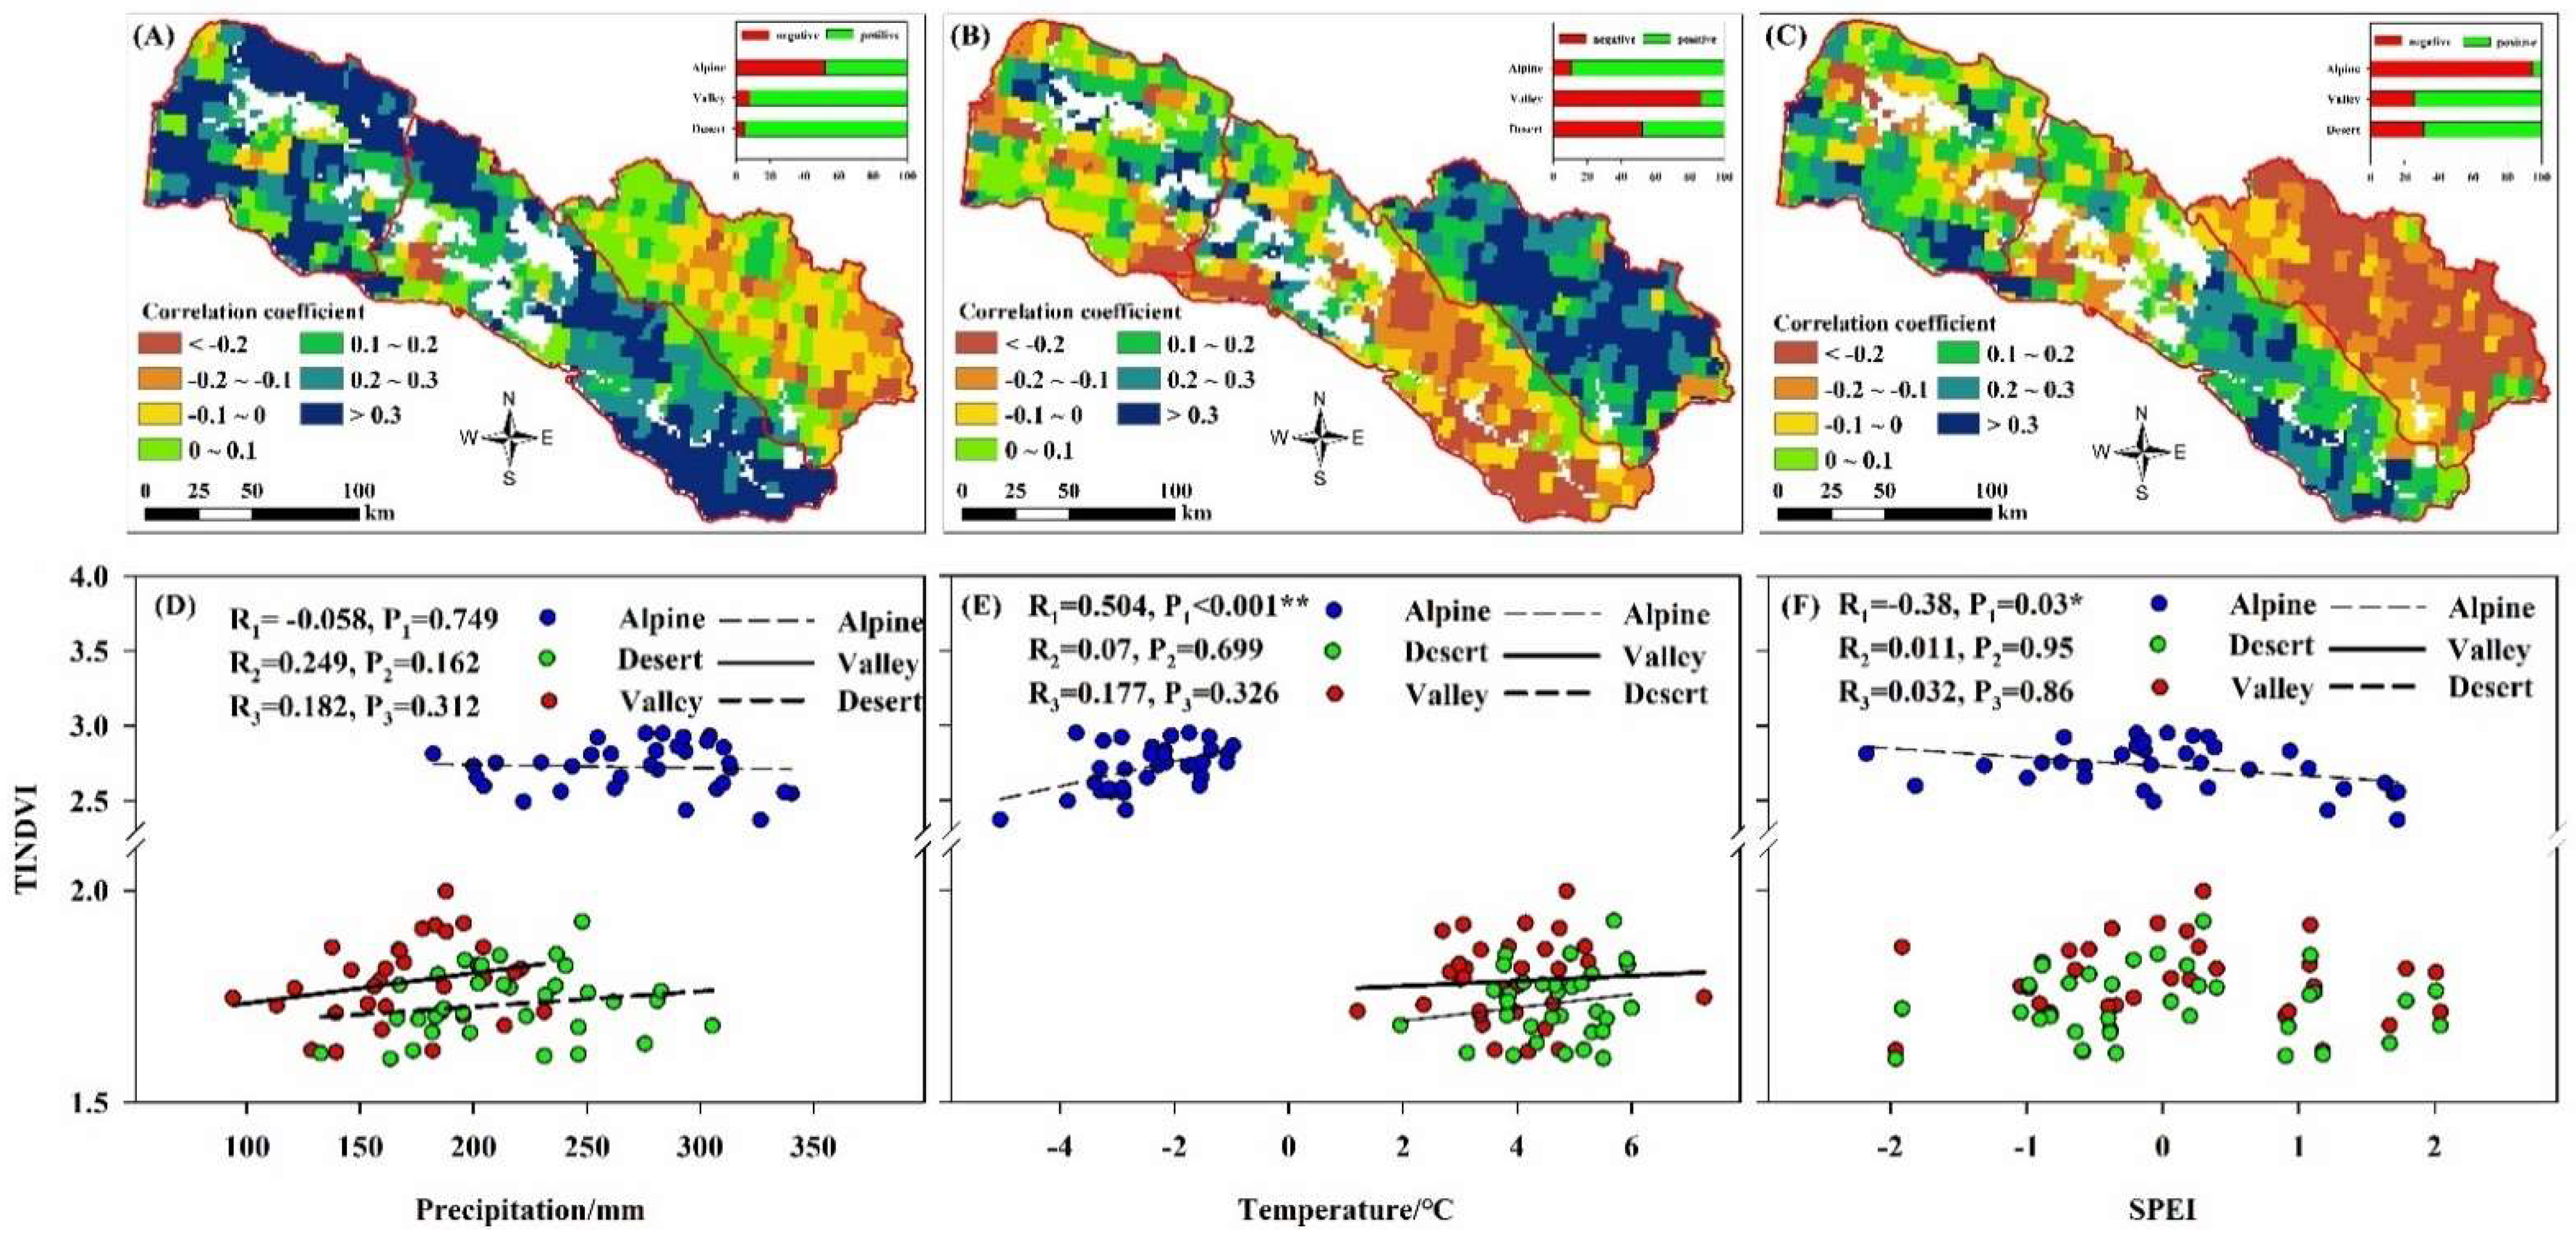
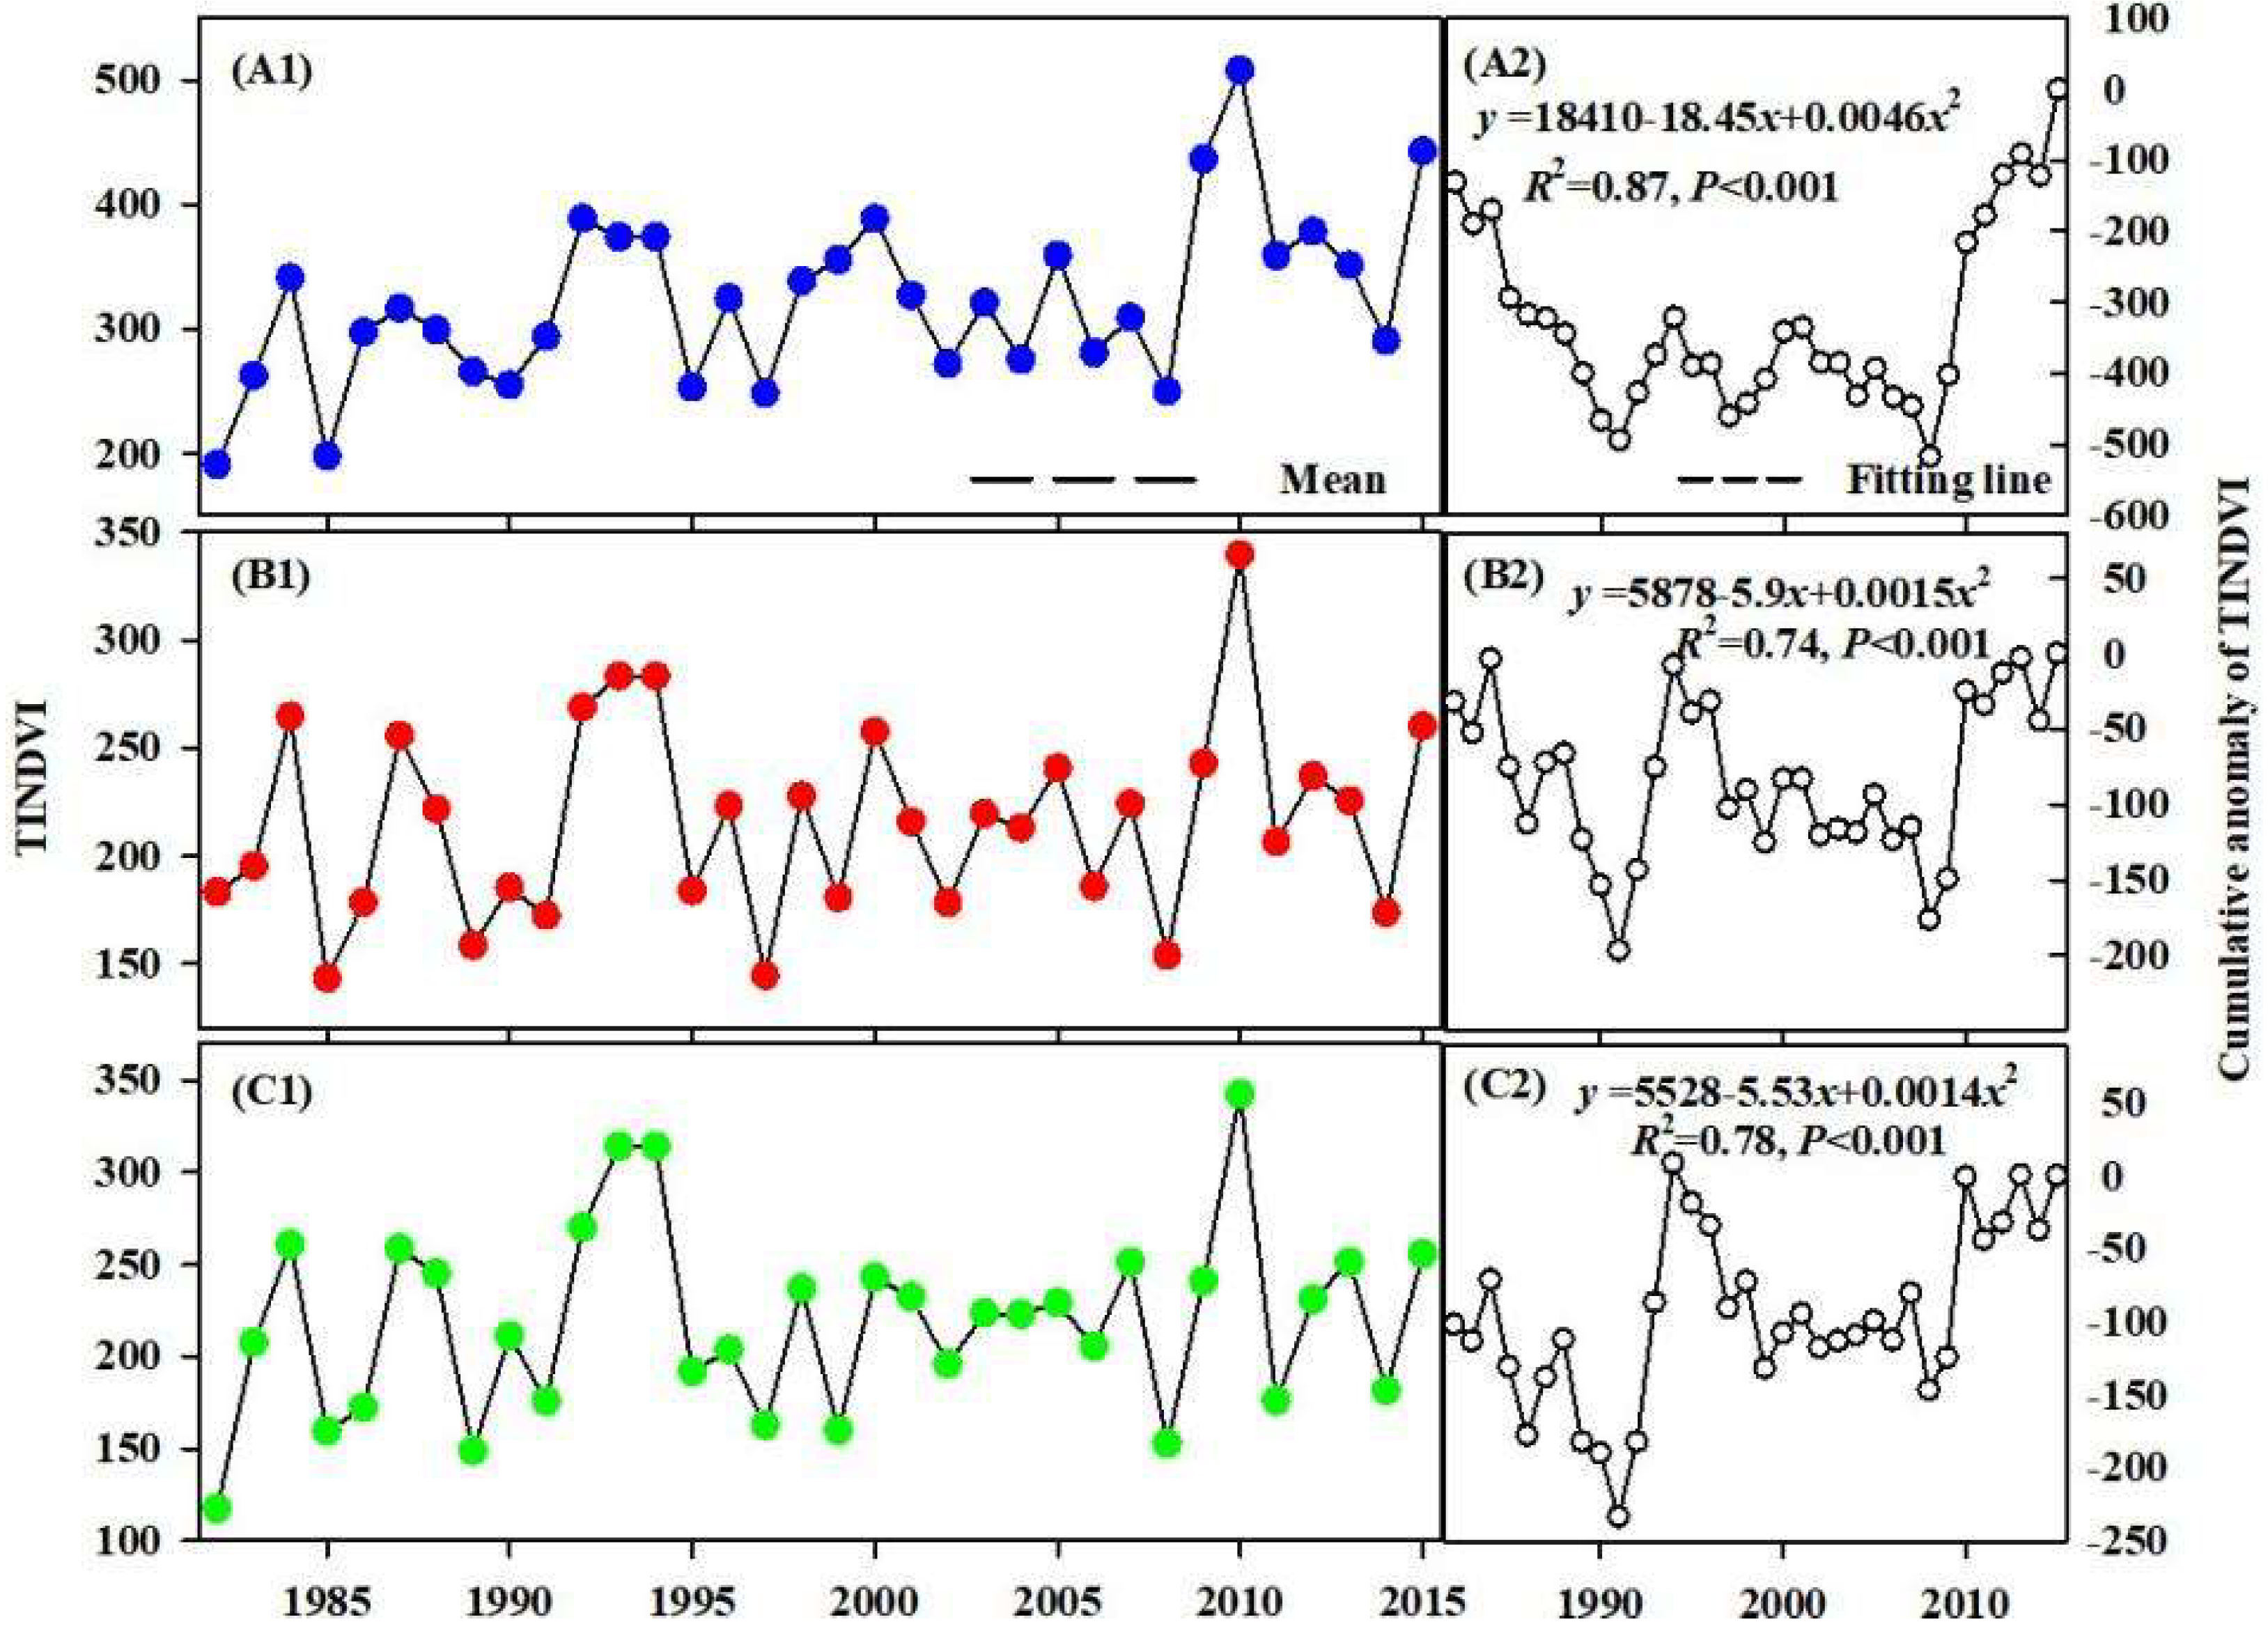
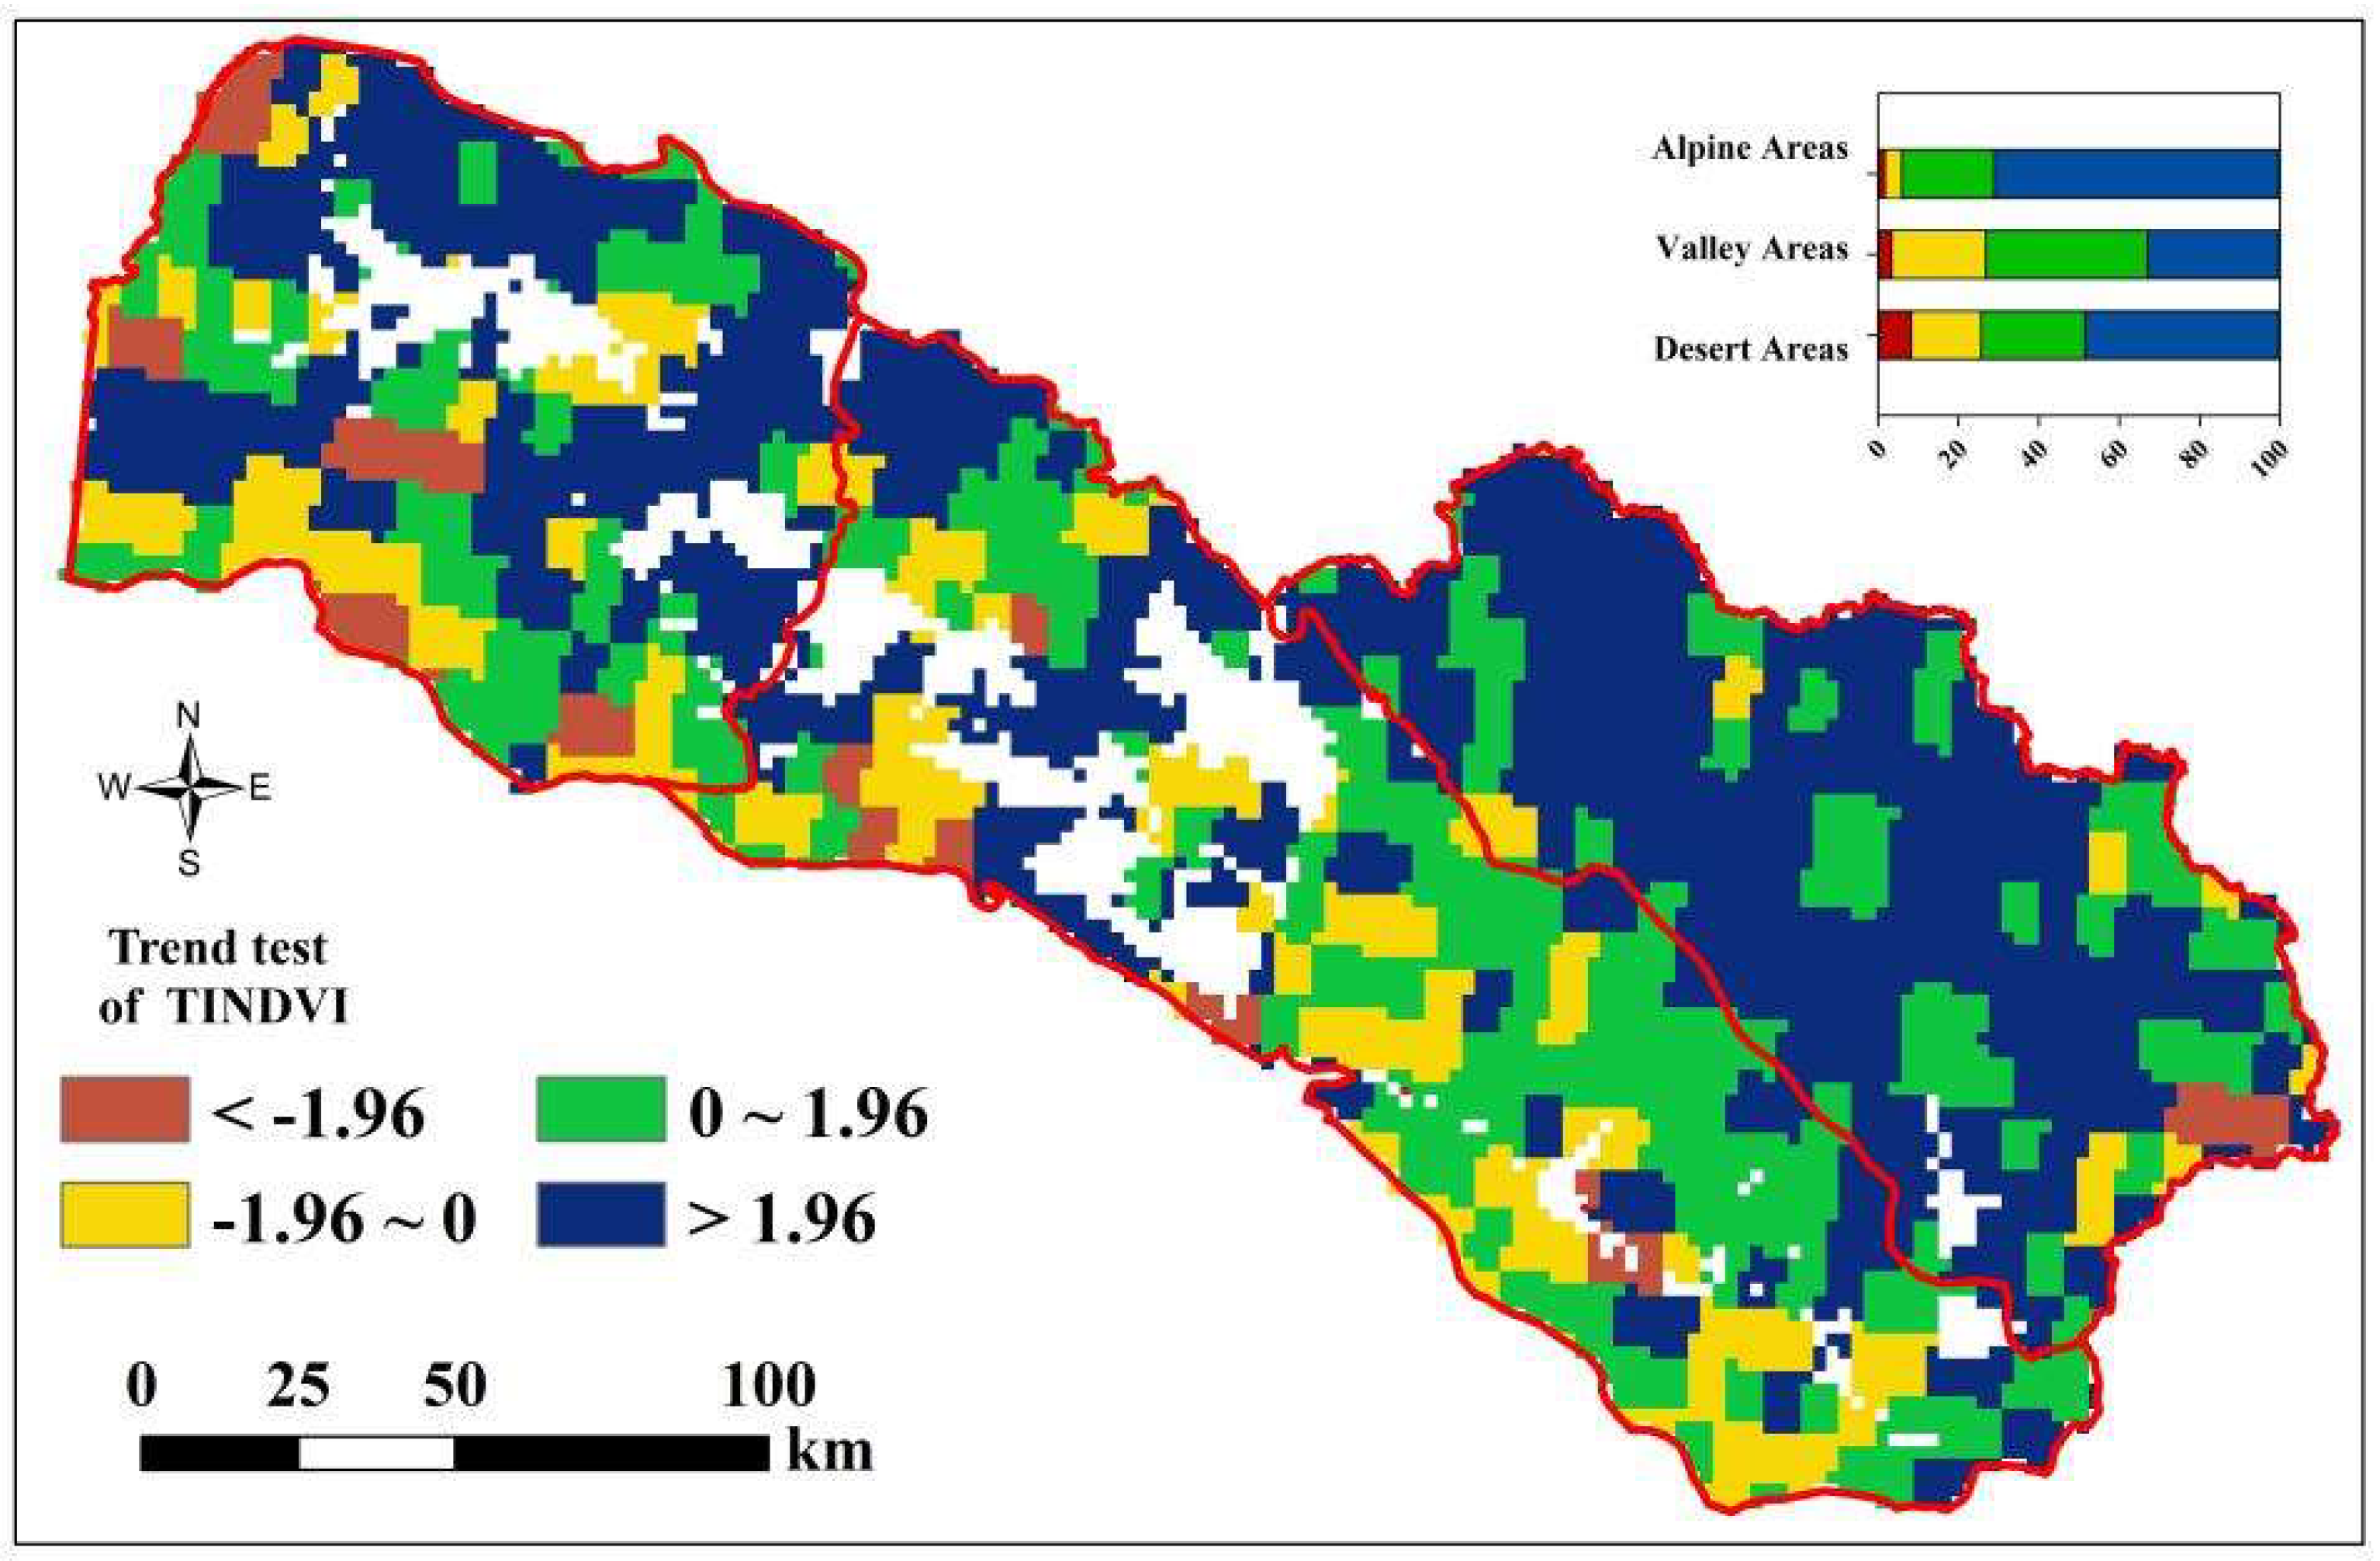
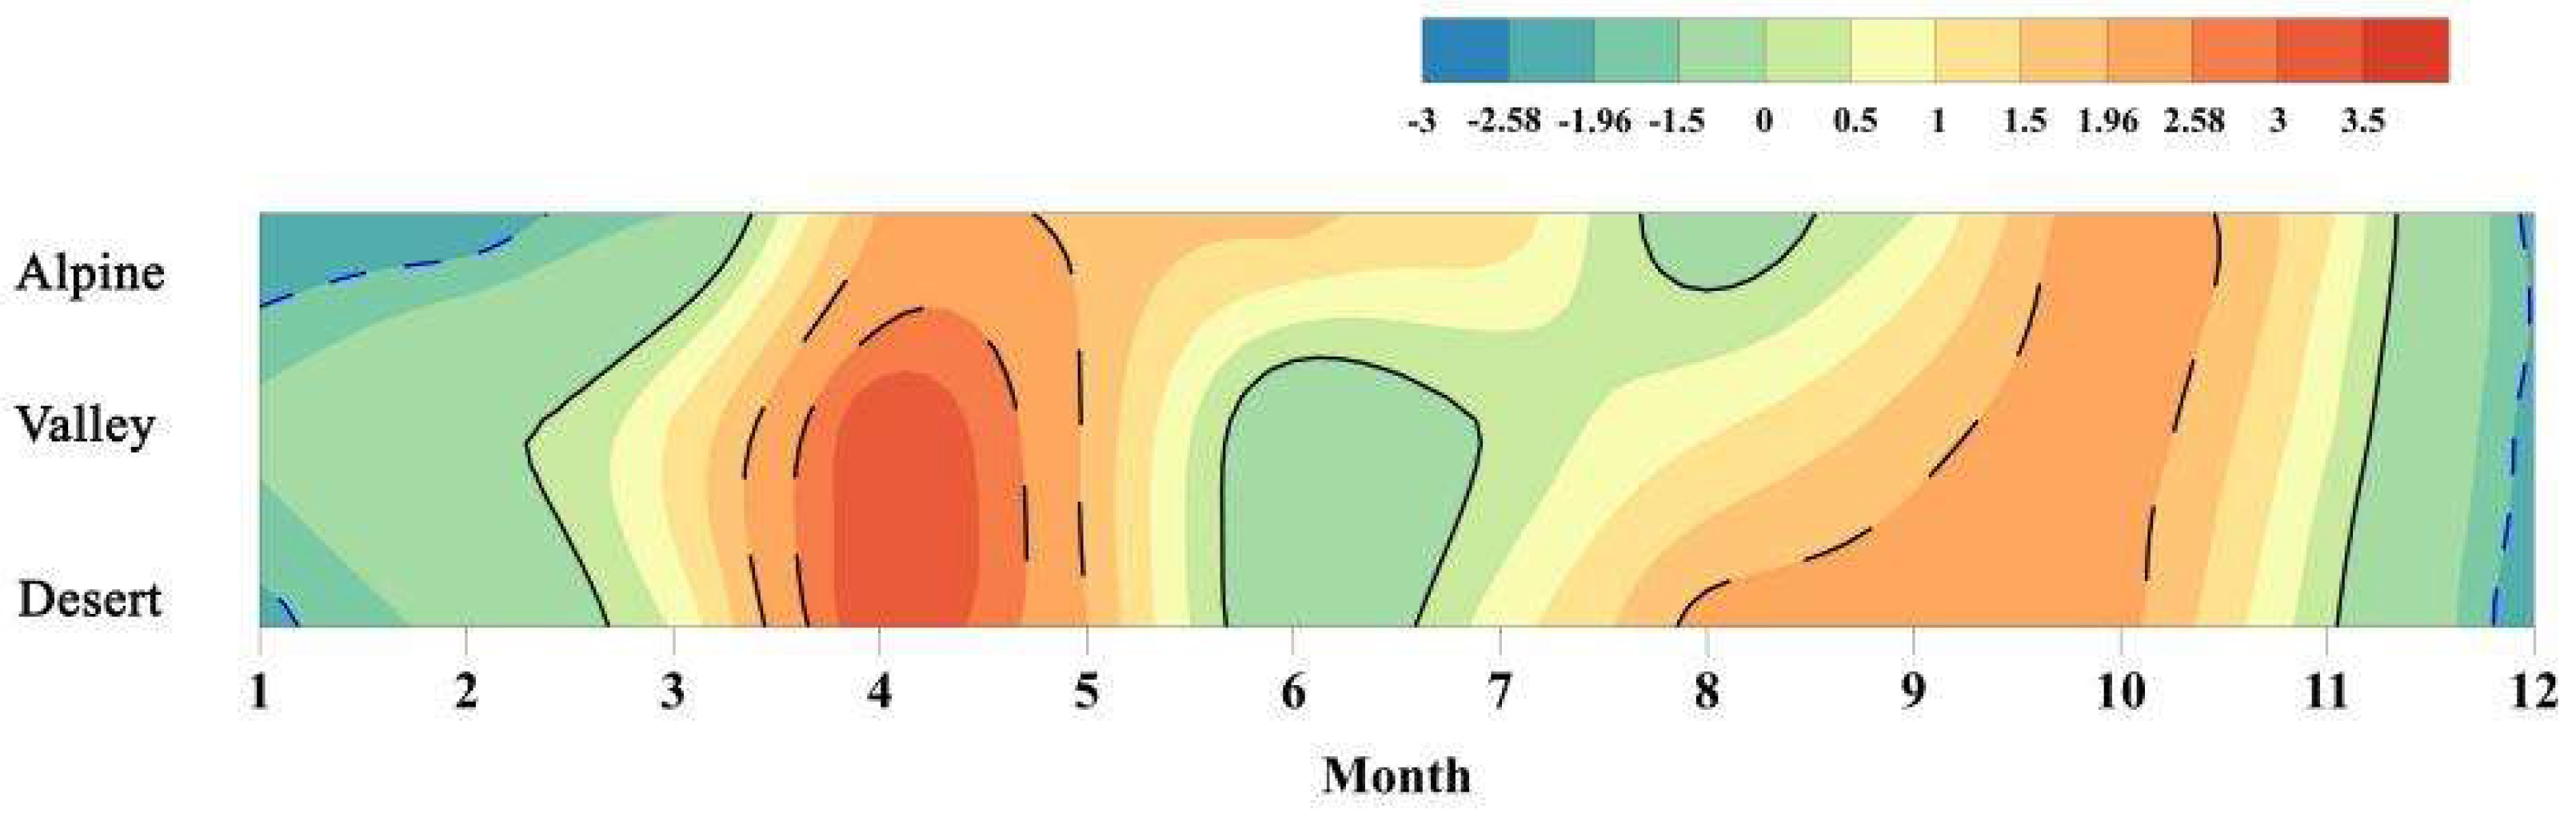
3.2. Spatio-Temporal Variation of TINDVI and NDVI
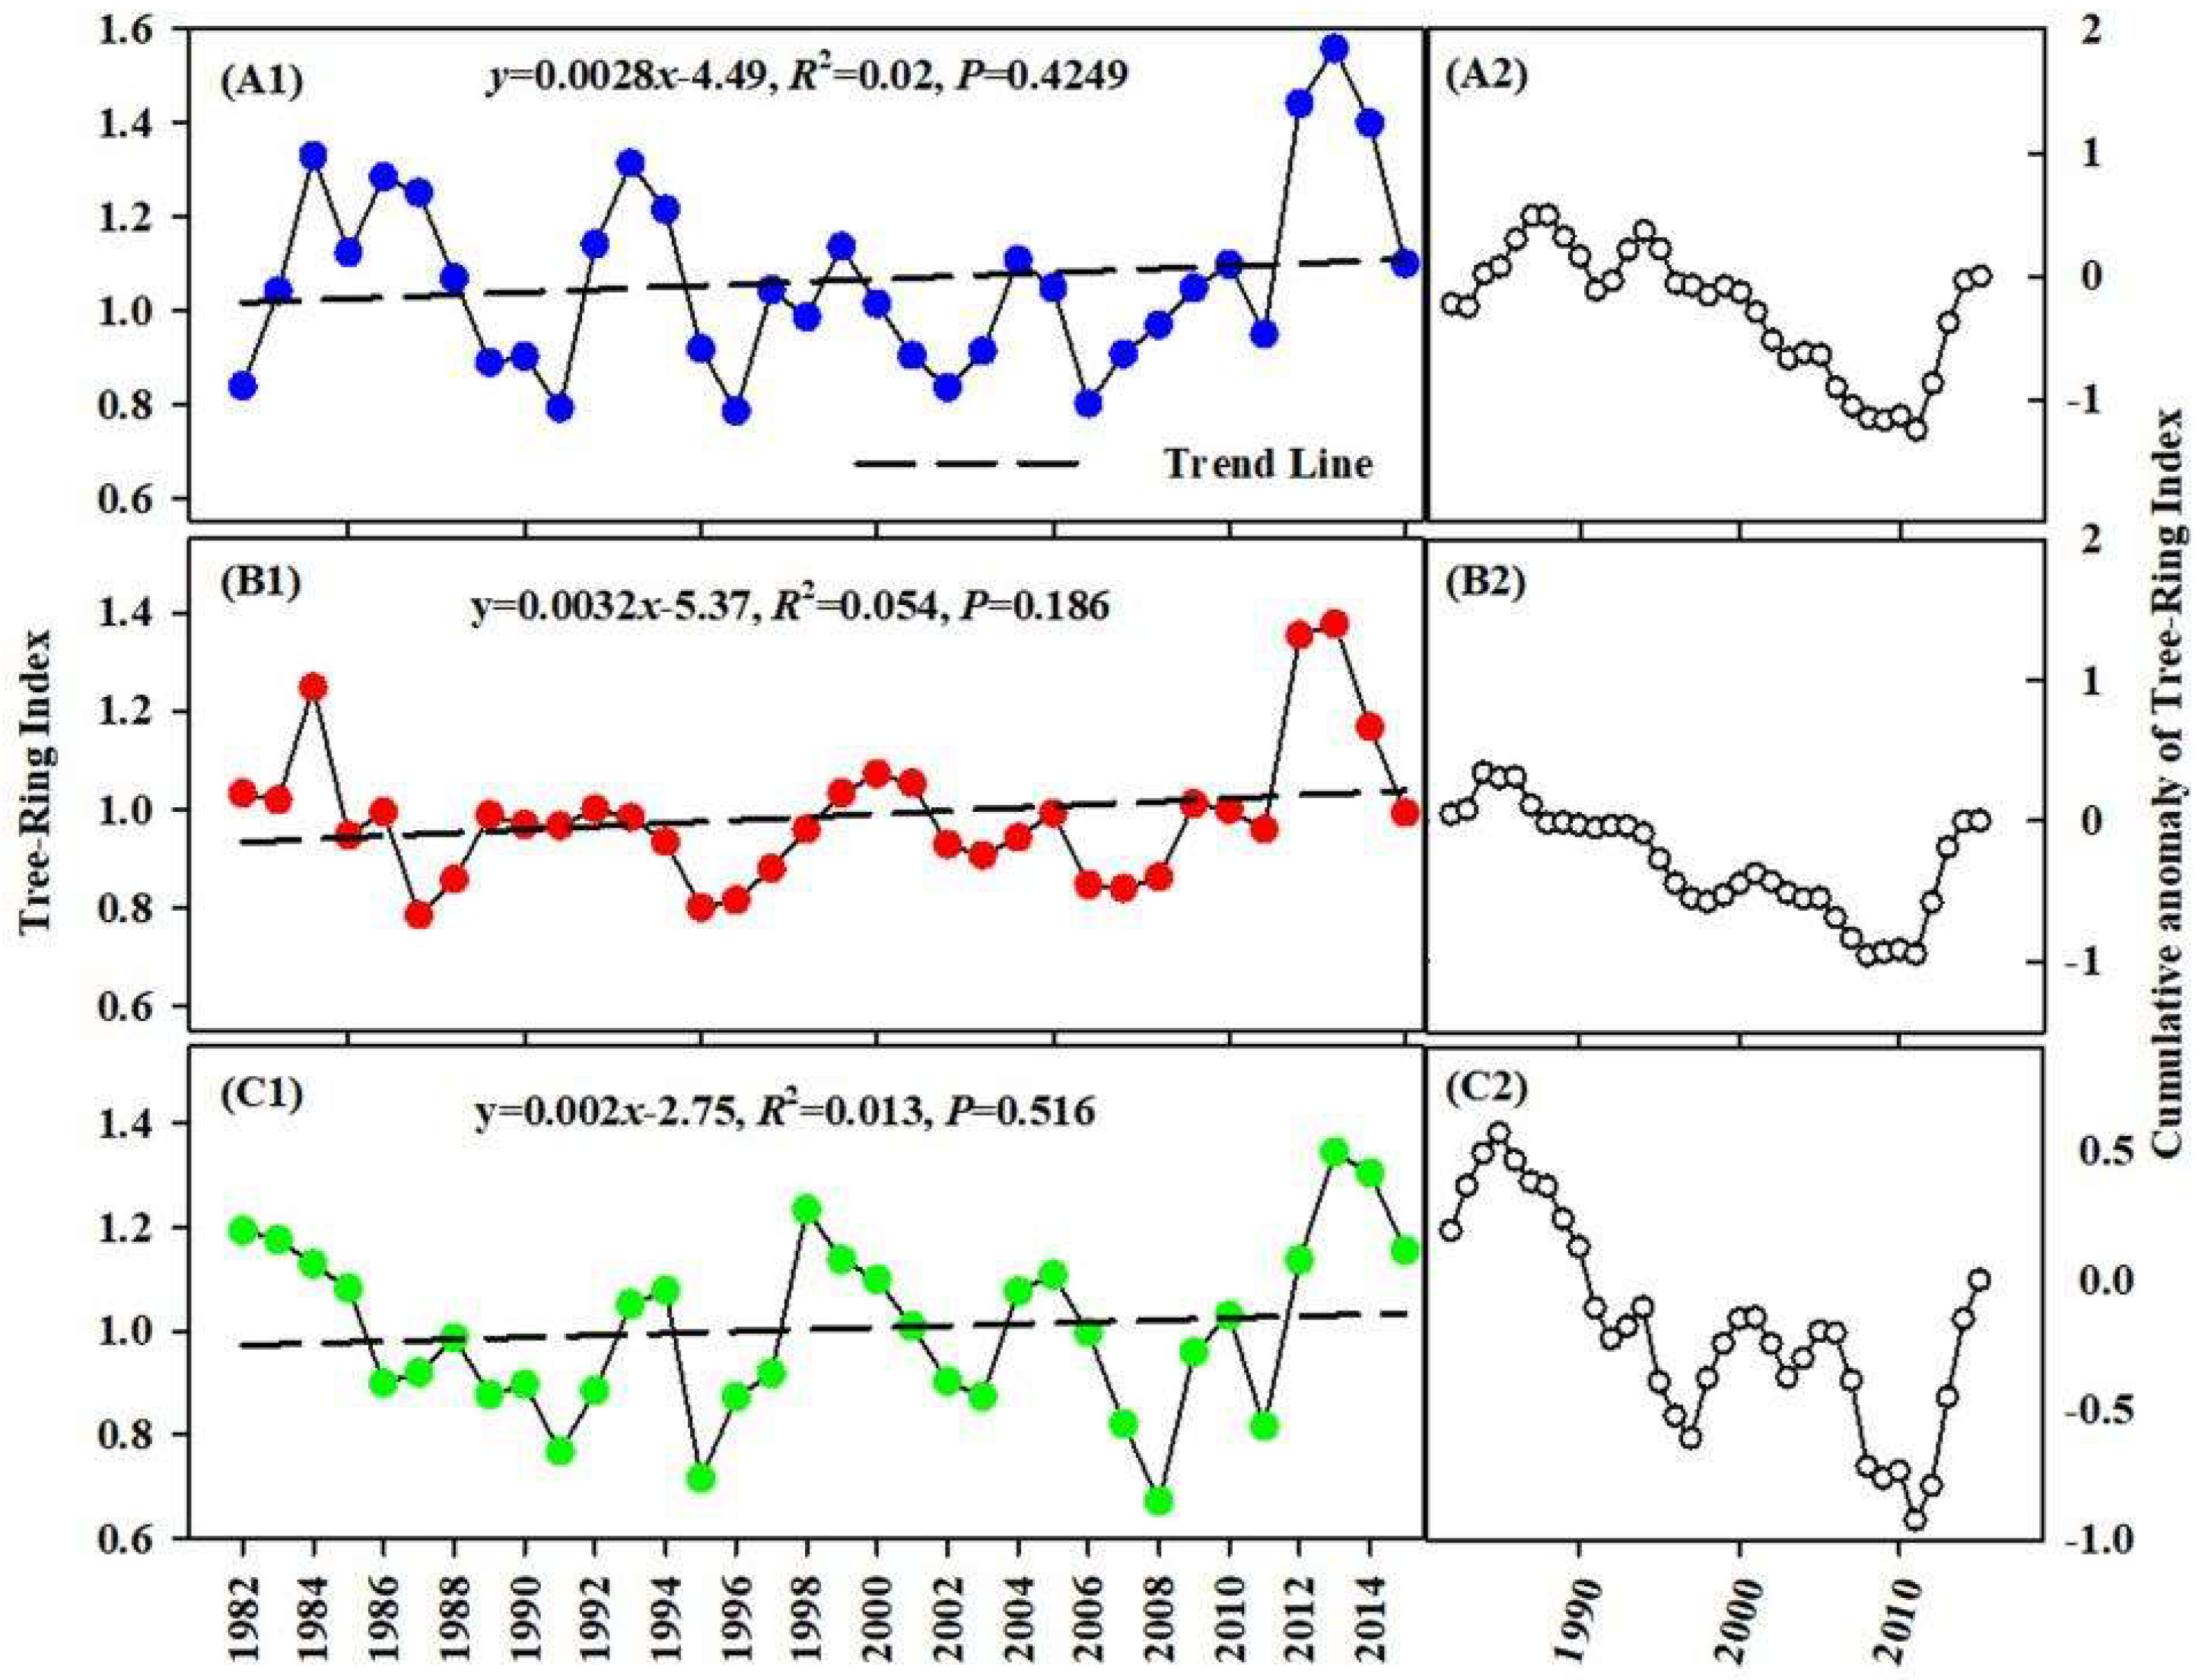
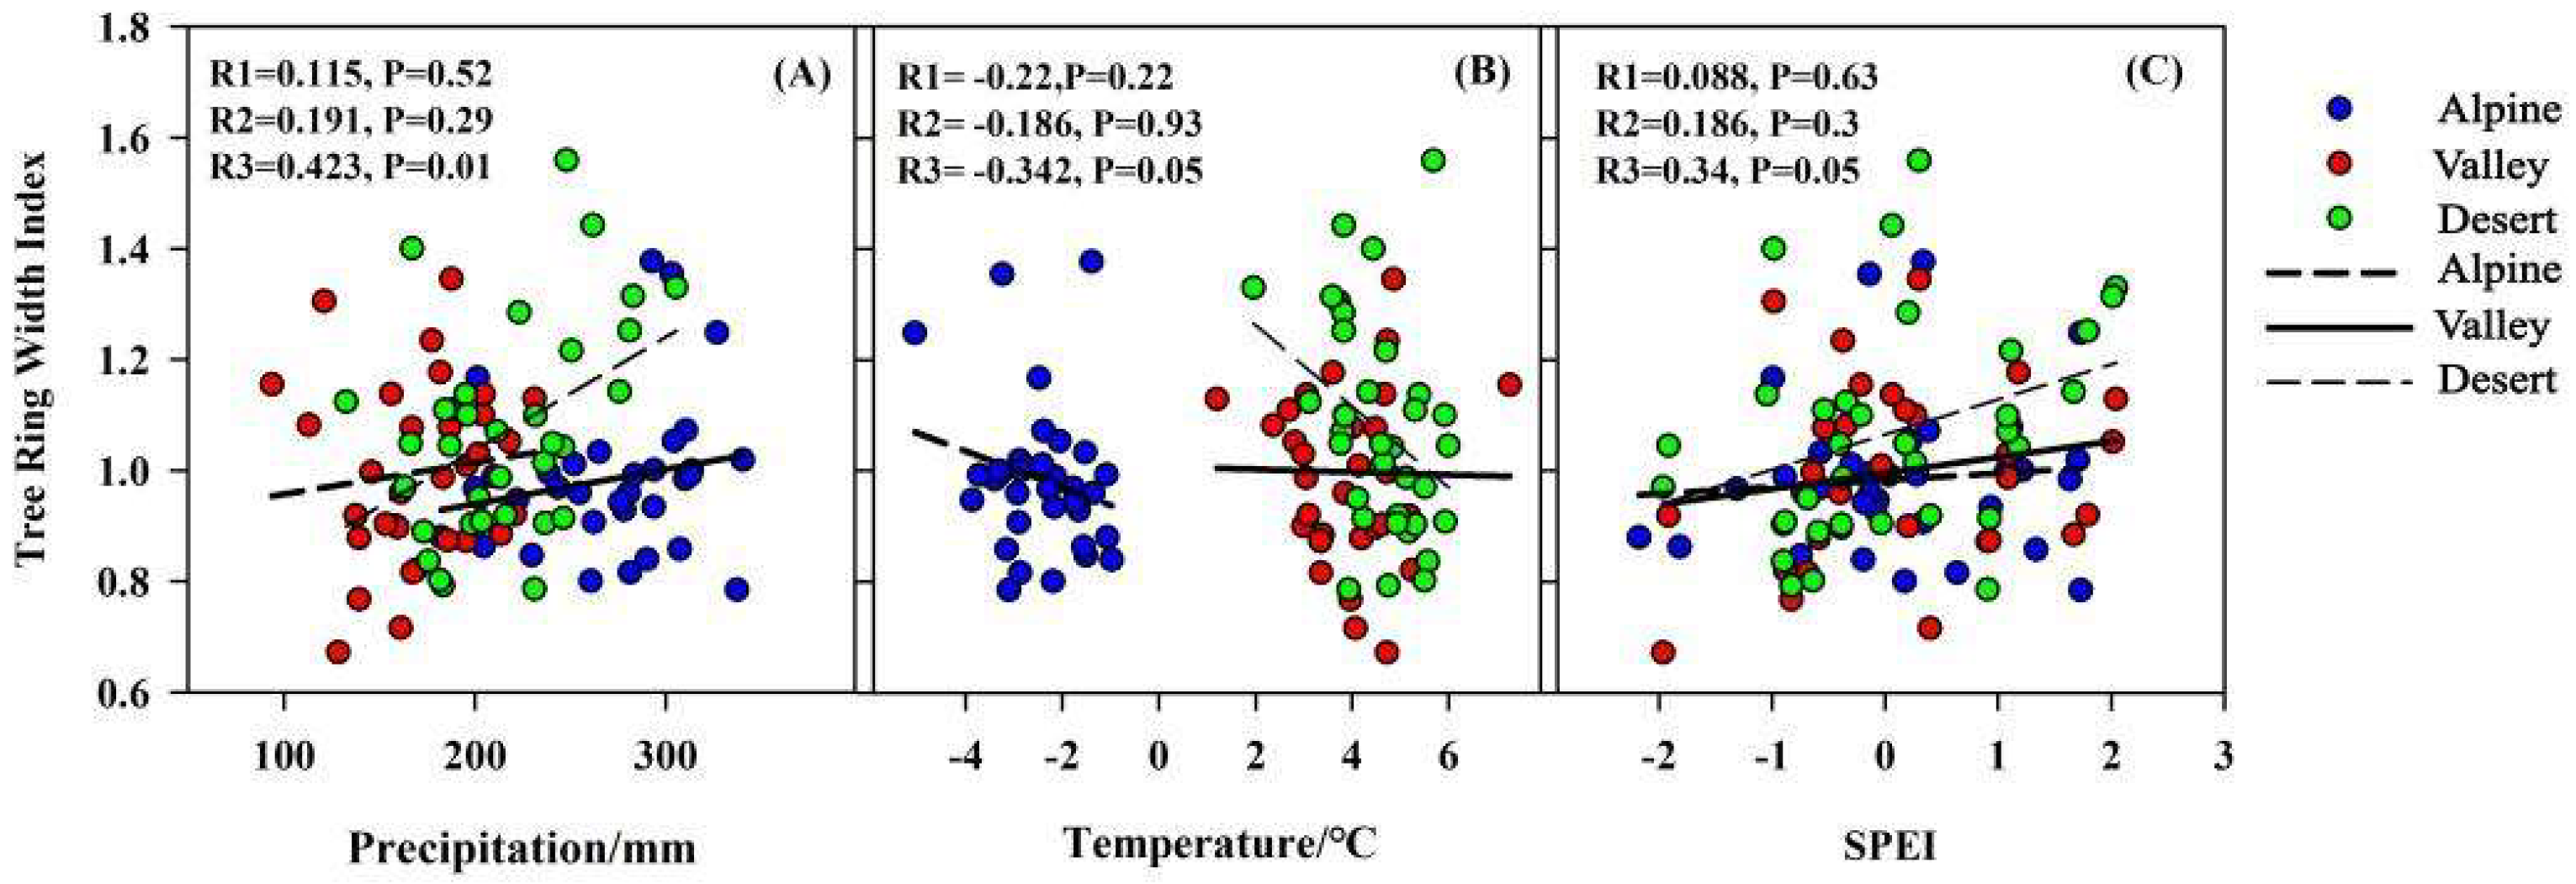
3.3. Change in TRW
4. Discussion
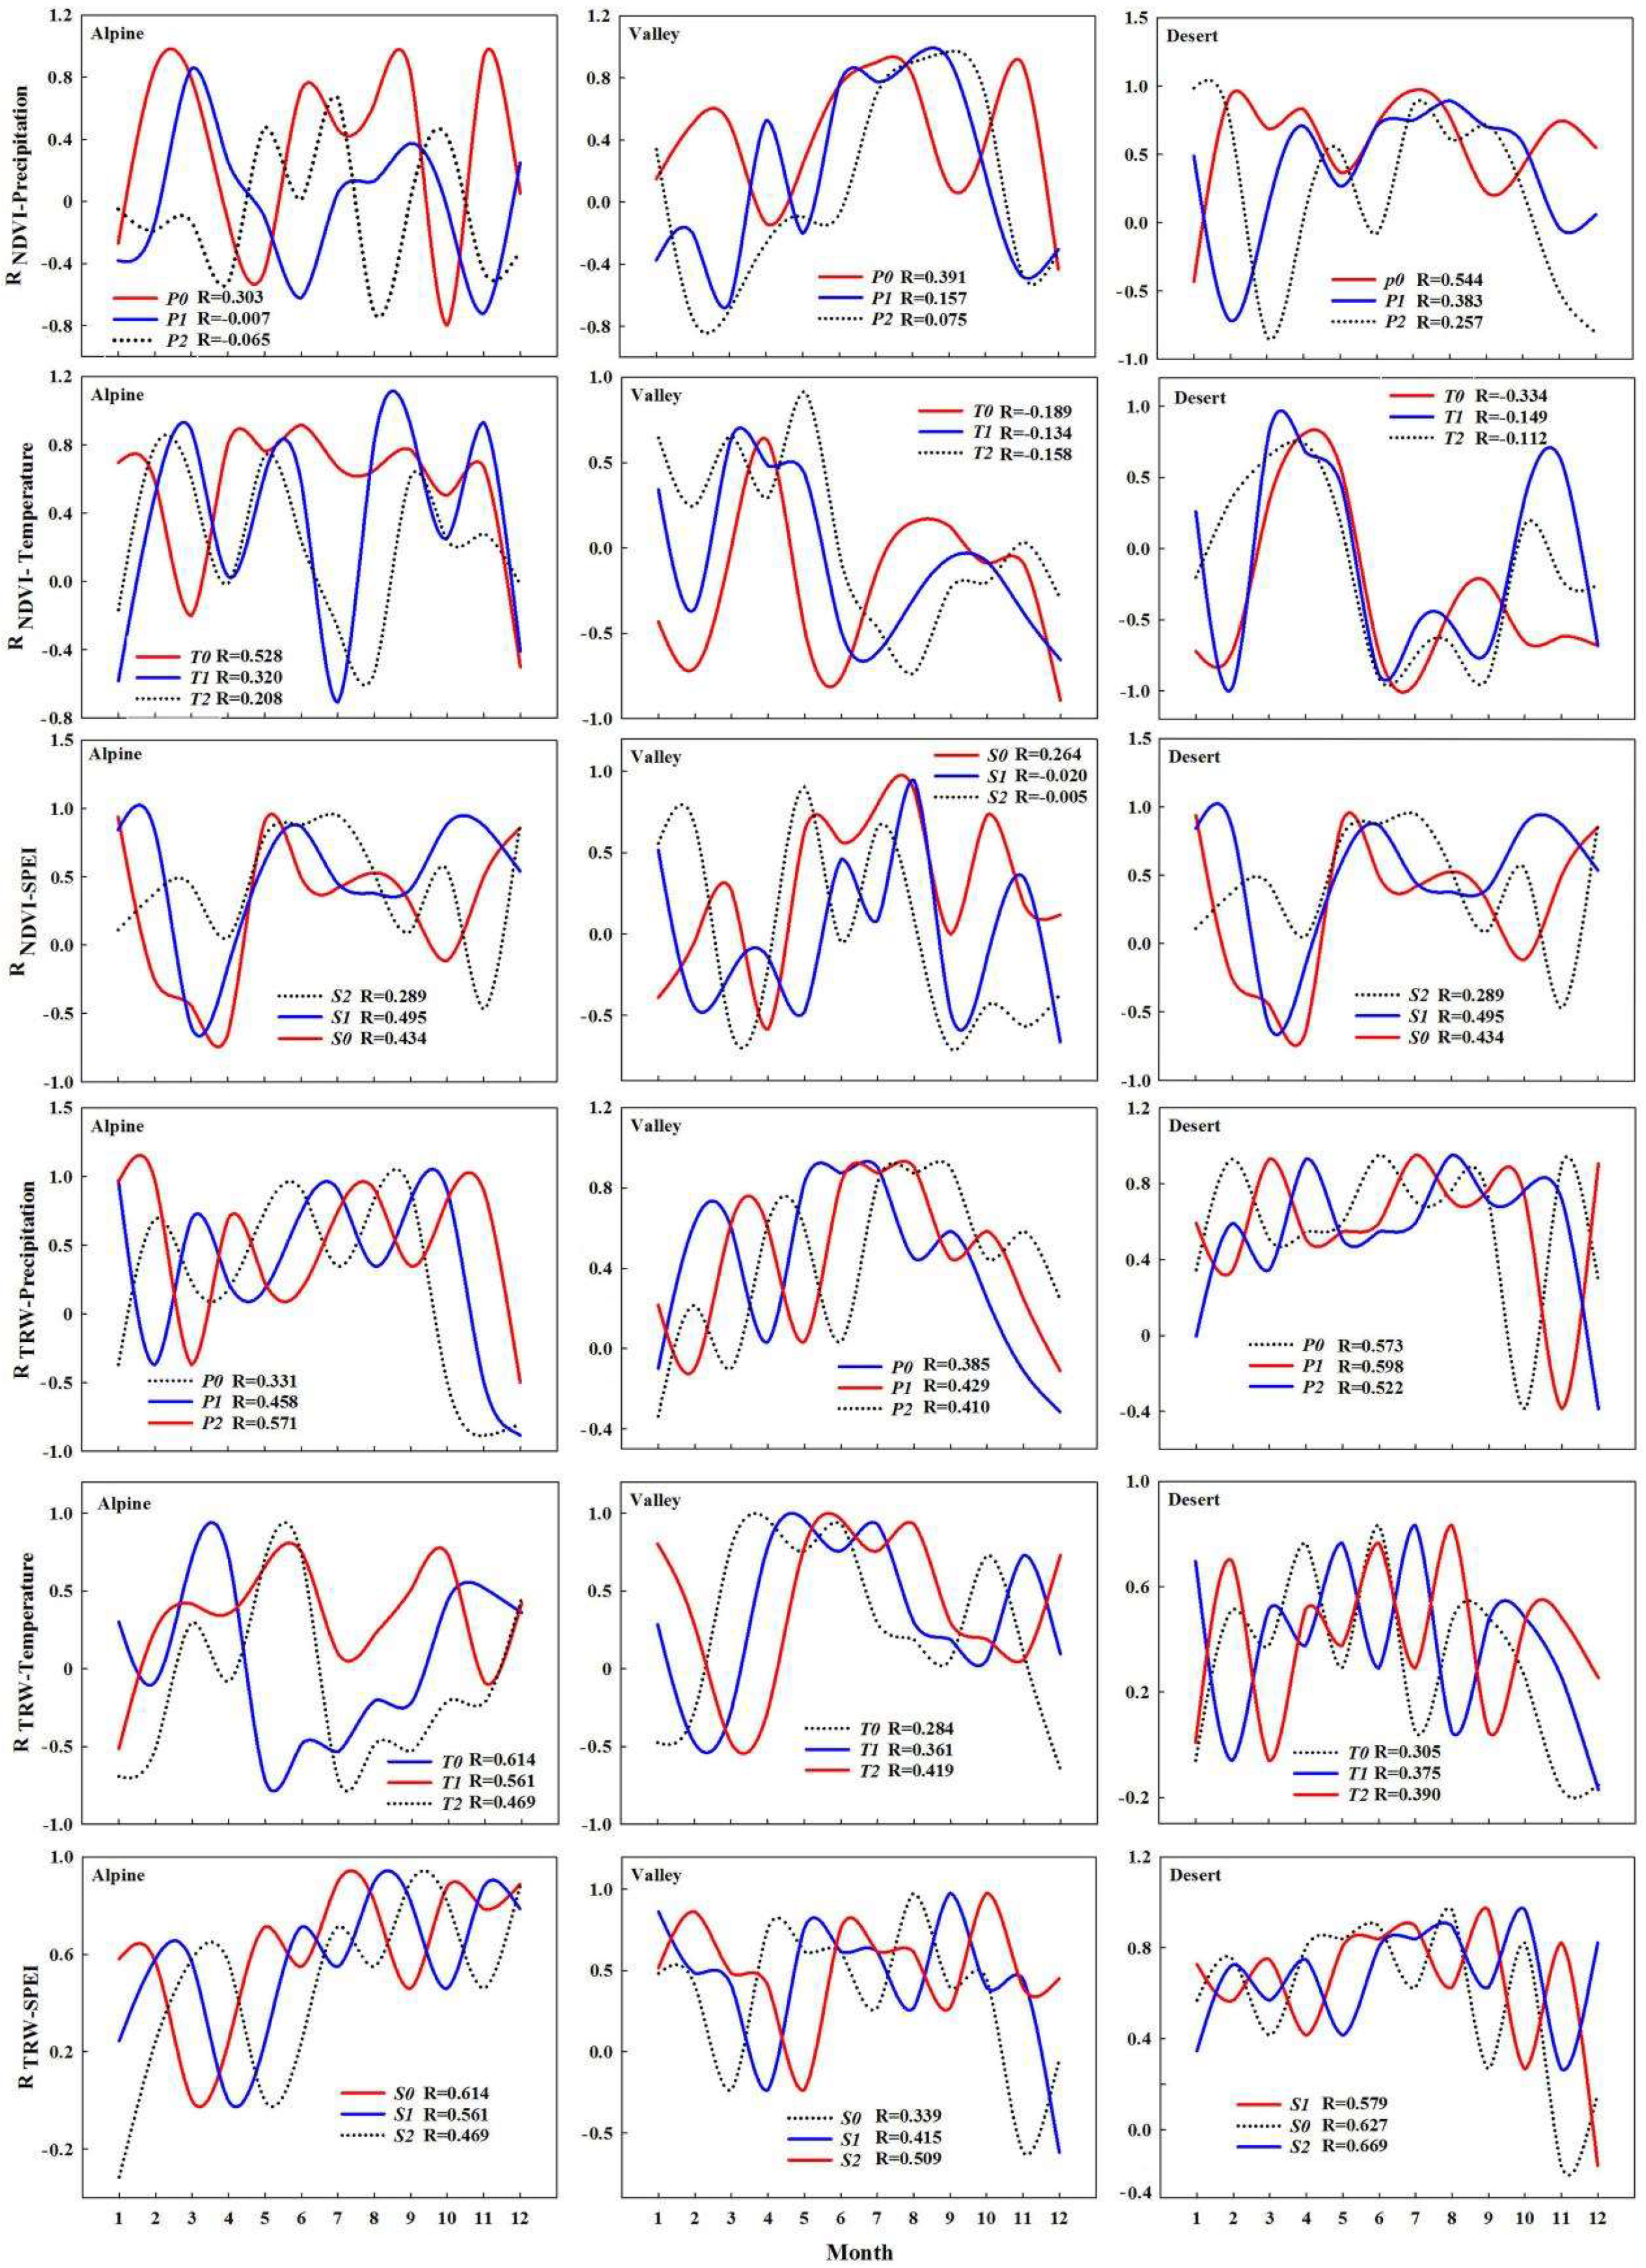
4.1. Influence of Climate Change on NDVI
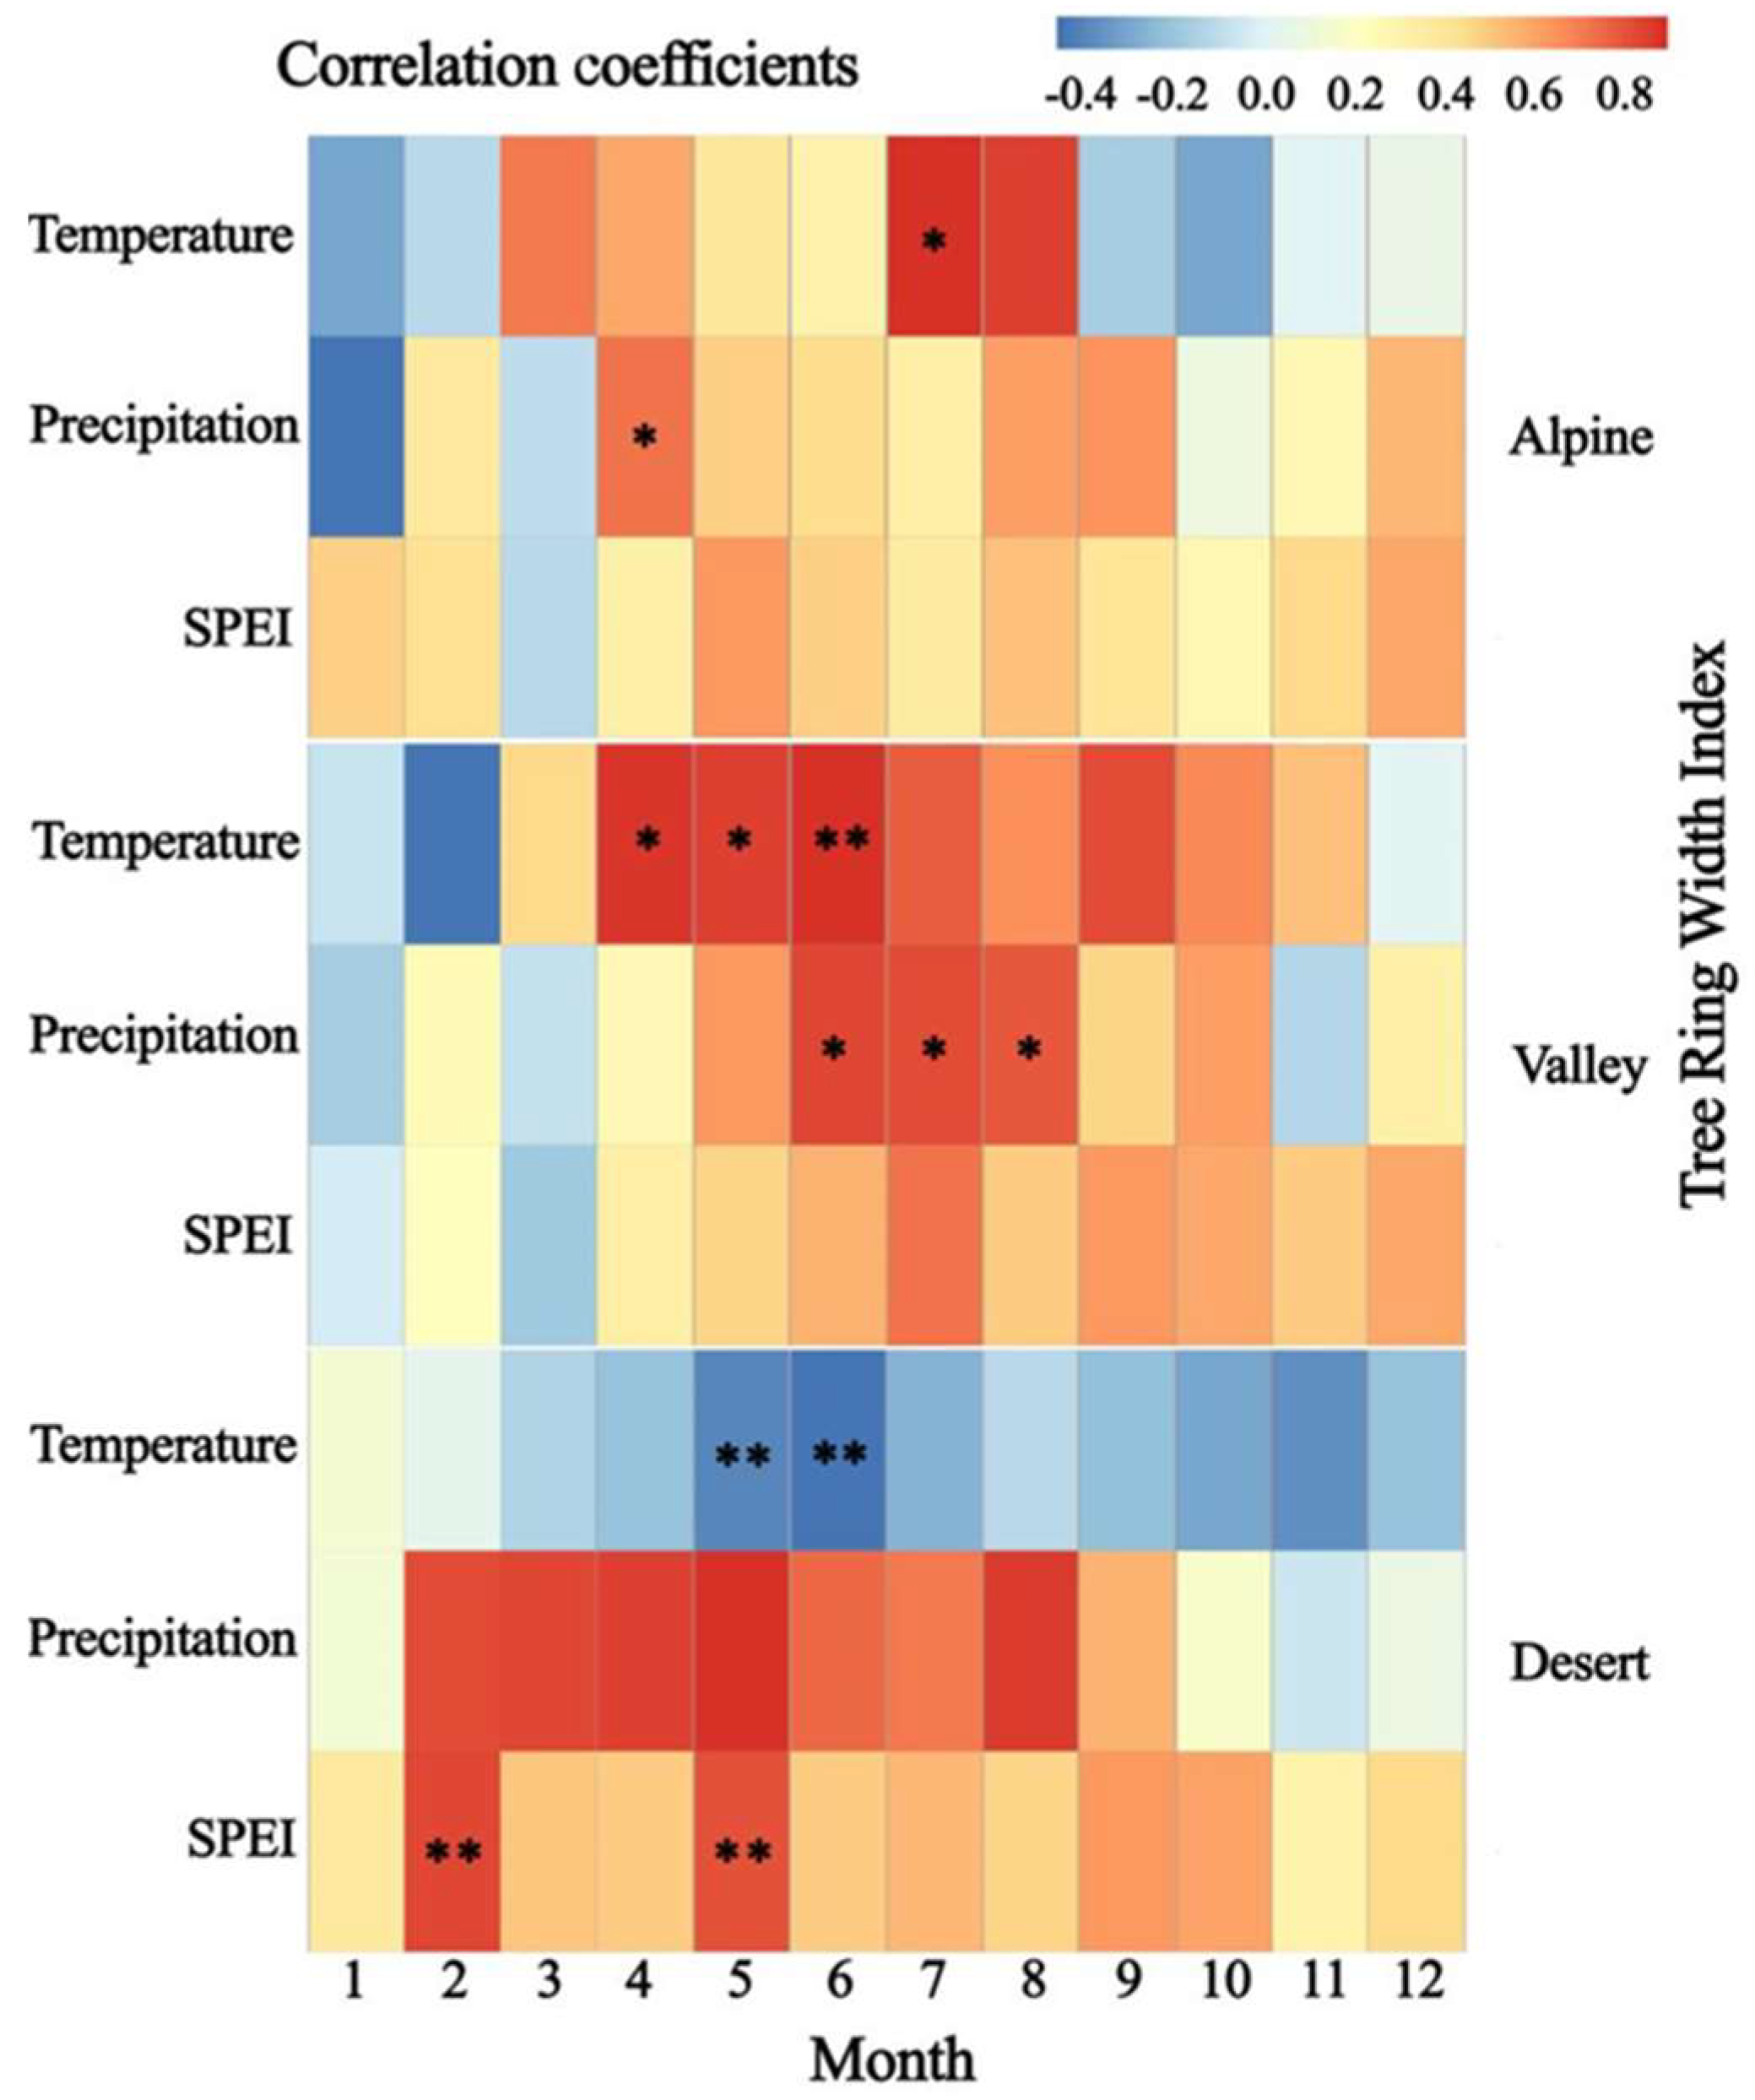
4.2. Effect of Climate Change on Tree-Ring Width
4.3. Relationship between Plant Canopies and Trunks
5. Conclusions
Author Contributions
Funding
Acknowledgments
Conflicts of Interest
References
- Zheng, K.; Zhou, W.J.; Ying, P.J.; Cheng, H.; Zhang, X.L.; Huang, F.Q.; Li, F.M.; Ye, J.S. Impacts of climate change and human activities on grassland vegetation variation in the Chinese Loess Plateau. Sci. Total Environ. 2019, 660, 236–244. [Google Scholar] [CrossRef]
- Wang, J.; Wang, K.; Zhang, M.; Zhang, C. Impacts of climate change and human activities on vegetation cover in hilly southern China. Ecol. Eng. 2015, 81, 451–461. [Google Scholar] [CrossRef]
- Chen, T.; Tang, G.; Yuan, Y.; Guo, H.; Chen, X. Unraveling the relative impacts of climate change and human activities on grassland productivity in Central Asia over last three decades. Sci. Total Environ. 2020, 743, 140649. [Google Scholar] [CrossRef]
- Li, X.; Li, Y.; Chen, A.; Gao, M.; Slette, I.J.; Piao, S. The impact of the 2009/2010 drought on vegetation growth and terrestrial carbon balance in Southwest China. Agric. For. Meteorol. 2019, 269, 239–248. [Google Scholar] [CrossRef]
- Wu, D.; Piao, S.; Zhu, D.; Wang, X.; Xu, W. Accelerated terrestrial ecosystem carbon turnover and its drivers. Glob. Change Biol. 2020, 26, 5052–5062. [Google Scholar] [CrossRef]
- Gang, C.; Zhang, Y.; Wang, Z.; Chen, Y.; Yang, Y.; Li, J.; Cheng, J.; Qi, J.; Odeh, I. Modeling the dynamics of distribution, extent, and NPP of global terrestrial ecosystems in response to future climate change. Glob. Planet. Change 2017, 148, 153–165. [Google Scholar] [CrossRef]
- Jiang, W.; Yuan, L.; Wang, W.; Cao, R.; Zhang, Y.; Shen, W. Spatio-temporal analysis of vegetation variation in the yellow river basin. Ecol. Indic. 2015, 51, 117–126. [Google Scholar] [CrossRef]
- Maclean, L.M.D.; Wilson, R.J. Recent ecological responses to climate change support predictions of high extinction risk. Proc. Natl. Acad. Sci. USA 2011, 108, 12337–12342. [Google Scholar] [CrossRef] [Green Version]
- Berdugo, M.; Delgado-Baquerizo, M.; Soliveres, S.; Hernández-Clemente, R.; Zhao, Y.C.; Gaitán, J.J.; Gross, N.; Saiz, H.; Maire, V.; Lehmann, A.; et al. Global ecosystem thresholds driven by aridity. Science 2020, 367, 787–790. [Google Scholar] [CrossRef] [Green Version]
- Erb, K.H.; Kastner, T.; Plutzar, C.; Bais, A.L.S.; Carvalhais, N.; Fetzel, T.; Gingrich, S.; Haberl, H.; Lauk, C.; Niedertscheider, M.; et al. Unexpectedly large impact of forest management and grazing on global vegetation biomass. Nature 2018, 553, 73–76. [Google Scholar] [CrossRef]
- Chu, H.; Venevsky, S.; Chao, W.; Wang, M. NDVI-based vegetation dynamics and its response to climate changes at Amur-Heilongjiang River Basin from 1982 to 2015. Sci. Total Environ. 2018, 650 Pt 2, 2051–2062. [Google Scholar] [CrossRef] [PubMed]
- Ammer, C. Diversity and forest productivity in a changing climate. New Phytol. 2019, 221, 50–66. [Google Scholar] [CrossRef] [PubMed] [Green Version]
- Knapp, A.K.; Ciais, P.; Smith, M.D. Reconciling inconsistencies in precipitation—Productivity relationships: Implications for climate change. New Phytol. 2016, 214, 41–47. [Google Scholar] [CrossRef] [PubMed] [Green Version]
- Kawabata, A.; Ichii, K.; Yamaguchi, Y. Global monitoring of interannual changes in vegetation activities using ndvi and its relationships to temperature and precipitation. Int. J. Remote Sens. 2001, 22, 1377–1382. [Google Scholar] [CrossRef]
- Zheng, Y.; Zhang, L.; Zhou, Y.; Zhang, B.H. Vegetation change and its driving factors in global drylands during the period of 1982–2012. Arid. Zone Res. 2017, 34, 59–66. (In Chinese) [Google Scholar]
- Prăvălie, R. Drylands extent and environmental issues. A global approach. Earth-Sci. Rev. 2016, 161, 259–278. [Google Scholar] [CrossRef]
- Li, C.F.; Zhang, C.; Luo, G.P.; Chen, X. Modeling the carbon dynamics of the dryland ecosystems in Xinjiang, China from 1981 to 2007—The spatiotemporal patterns and climate controls. Ecol. Model. 2013, 267, 148–157. [Google Scholar] [CrossRef]
- Li, C.; Zhang, C.; Luo, G.P.; Chen, X.; Maisupova, B.; Madaminov, A.A.; Han, Q.; Djenbaev, B.M. Carbon stock and its responses to climate change in Central Asia. Glob. Change Biol. 2015, 21, 1951–1967. [Google Scholar] [CrossRef]
- Huang, J.; Yu, H.; Dai, A.; Wei, Y.; Kang, L. Drylands face potential threat under 2 °C global warming target. Nat. Clim. Change 2017, 7, 417–422. [Google Scholar] [CrossRef]
- Abbott, B.W.; Bishop, K.; Zarnetske, J.P.; Minaudo, C.; Pinay, G. Human domination of the global water cycle absent from depictions and perceptions. Nat. Geosci. 2019, 12, 533–540. [Google Scholar] [CrossRef]
- Hamann, E.; Denney, D.; Day, S.; Lombardi, E.; Jameel, M.I.; MacTavish, R.; Anderson, J.T. Review: Plant eco-evolutionary responses to climate change: Emerging directions. Plant Sci. 2020, 304, 110737. [Google Scholar] [CrossRef] [PubMed]
- Zellweger, F.; Frenne, P.D.; Lenoir, J.; Vangansbeke, P.; Verheyen, K.; Bernhardt-Römermann, M.; Baeten, L.; Hédl, R.; Berki, I.; Brunet, J.; et al. Forest microclimate dynamics drive plant responses to warming. Science 2020, 368, 772–775. [Google Scholar] [CrossRef] [PubMed]
- Ge, W.; Deng, L.; Wang, F.; Han, J. Quantifying the contributions of human activities and climate change to vegetation net primary productivity dynamics in China from 2001 to 2016. Sci. Total Environ. 2021, 773, 145648. [Google Scholar] [CrossRef] [PubMed]
- Zhou, Y.; Yi, Y.J.; Jia, W.F.; Cai, Y.; Li, Z. Applying dendrochronology and remote sensing to explore climate-drive in montane forests over space and time. Quat. Sci. Rev. 2020, 237, 106292. [Google Scholar] [CrossRef]
- Reichstein, M.; Bahn, M.; Ciais, P.; Frank, D.; Mahecha, M.D.; Seneviratne, S.I.; Zscheischler, J.; Beer, C.; Buchmann, N.; Frank, D.C. Climate extremes and the carbon cycle. Nature 2013, 500, 287–295. [Google Scholar] [CrossRef] [PubMed]
- Kannenberg, S.A.; Novick, K.A.; Alexander, M.R.; Maxwell, J.T.; Moore, D.J.P.; Phillips, R.P.; Anderegg, W.R.L. Linking drought legacy effects across scales: From leaves to tree rings to ecosystems. Glob. Change Biol. 2019, 25, 2978–2992. [Google Scholar] [CrossRef]
- Chen, F.; Yuan, Y.J.; Zhang, R.B.; Yu, S.L. Reconstruction of Regional NDVI Using Tree-ring Width Chronology in the Southern Edge of the Badain Jaran Desert, Northwestern China. Desert Oasis Meteorol. 2015, 9, 1033–1044. [Google Scholar]
- Wu, Q.Q.; Zhang, X.; Xu, S.X.; Yang, X.H.; Liu, Y.S.; Zhang, H.Z.; Shi, Z.J. Climatic responses of NDVI and tree growth in the arid areas of inland Asia and their influencing factors. J. Desert Res. 2022, 42, 1–10. (In Chinese) [Google Scholar]
- Cao, R.Y.; Chen, Y.; Shen, M.G.; Chen, J.; Zhou, J.; Wang, C.; Yang, W. A simple method to improve the quality of NDVI time-series data by integrating spatiotemporal information with the Savitzky-Golay filter. Remote Sens. Environ. 2018, 217, 244–257. [Google Scholar] [CrossRef]
- Bigler, C.; Grahn, E.; Laroque, I.; Jeziorski, A.; Hall, R. Holocene environmental change at Lake Njulla (999 m a.s.l.), northern Sweden:a comparison with four small nearby lakes along an altitudinal Gradient. J. Paleolimnol. 2003, 29, 13–29. [Google Scholar] [CrossRef]
- Grissino-Mayer, H. Evaluating cross-dating accuracy: A manual and tutorial for the computer program COFECHA. Tree-Ring Res. 2001, 57, 205–221. [Google Scholar]
- Cook, E.R. A Time-Series Analysis Approach to Tree-Ring Standardization; University of Arizona: Tucson, AZ, USA, 1985. [Google Scholar]
- Fritts, H.C. Tree Ring and Climate; Academic Press: London, UK, 1976. [Google Scholar]
- Vicente-Serrano, S.M.; Beguería, S.; Lopez-Moreno, J.I. A multiscalar drought index sensitive to global warming: The standardized precipitation evapotranspiration index. J. Clim. 2010, 23, 1696–1718. [Google Scholar] [CrossRef] [Green Version]
- Vicente-Serrano, S.M.; Gouveia, C.; Camarero, J.J.; Begueria, S.; Trigo, R.; Lopez-Moreno, J.I.; Azorín-Molina, C.; Pasho, E.; Lorenzo-Lacruz, J.; Revuelto, J.; et al. Response of vegetation to drought time-scales across global land biomes. Proc. Natl. Acad. Sci. USA 2013, 110, 52–57. [Google Scholar] [CrossRef] [PubMed] [Green Version]
- Kendall, M.G. Rank correlation methods. Br. J. 1990, 25, 86–91. [Google Scholar] [CrossRef]
- Mann, H.B. Non-parametric test against trend. Econometrica 1945, 13, 245–259. [Google Scholar] [CrossRef]
- Attaur, R.; Dawood, M. Spatio-statistical analysis of temperature fluctuation using Mann-Kendall and Sen’s slope approach. Clim. Dyn. 2017, 48, 783–797. [Google Scholar]
- Coen, M.C.; Andrews, E.; Bigi, A.; Martucci, G.; Romanens, G.; Vogt, F.P.A.; Vuilleumier, L. Effects of the prewhitening method, the time granularity, and the time segmentation on the Mann-Kendall trend detection and the associated Sen’s slope. Atmos. Meas. Tech. 2020, 13, 6945–6964. [Google Scholar] [CrossRef]
- Ma, X.F.; Yan, W.; Zhao, C.Y.; Kundzewicz, Z.W. Snow-cover area and runoff variation under climate change in the West Kunlun Mountains. Water 2019, 11, 2246. [Google Scholar] [CrossRef] [Green Version]
- Prislan, P.; Gricar, J.; De, L.M.; Smith, K.T.; Cufar, K. Phenological variation in xylem and phloem formation in Fagus sylvatica from two contrasting sites. Agric. For. Meteorol. 2013, 180, 142–151. [Google Scholar] [CrossRef]
- Ren, S.; An, S. Temporal Pattern Analysis of Cropland Phenology in Shandong Province of China Based on Two Long-Sequence Remote Sensing Data. Remote Sens. 2021, 13, 4071. [Google Scholar] [CrossRef]
- Xin, Q.C.; Broich, M.; Zhu, P.; Gong, P. Modeling grassland spring onset across the Western United States using climate variables and MODIS—Derived phenology metrics. Remote Sens. Environ. 2015, 161, 63–77. [Google Scholar] [CrossRef]
- Miao, L.; Daniel, M.; Cui, X.; Ma, M.; Sylvain, D. Changes in vegetation phenology on the Mongolian Plateau and their climatic determinants. PLoS ONE 2017, 12, e0190313. [Google Scholar] [CrossRef] [PubMed] [Green Version]
- Lian, X.; Piao, S.; Li, L.Z.X.; Li, Y.; He, G. Summer soil drying exacerbated by earlier spring greening of northern vegetation. Sci. Adv. 2020, 6, eaax0255. [Google Scholar] [CrossRef] [PubMed] [Green Version]
- Yang, Y.; Guan, H.; Shen, M.; Liang, W.; Jiang, L. Changes in autumn vegetation dormancy onset date and the climate controls across temperate ecosystems in China from 1982 to 2010. Glob. Change Biol. 2015, 21, 652–665. [Google Scholar] [CrossRef] [PubMed]
- Altman, J.; Fibich, P.; Santruckova, H.; Dolezal, J.; Stepanek, P.; Kopacek, J.; Hunova, L.; Oulehle, F.; Tumajer, J.; Cienciala, E. Environmental factors exert strong control over the climate-growth relationships of Picea abies in Central Europe. Sci. Total Environ. 2017, 609, 506–516. [Google Scholar] [CrossRef] [PubMed]
- Gao, M.; Piao, S.; Chen, A.; Yang, H.; Liu, Q.; Fu, Y.; Janssens, I. Divergent changes in the elevational gradient of vegetation activities over the last 30 years. Nat. Commun. 2019, 10, 2970. [Google Scholar] [CrossRef] [PubMed]
- Li, Z.; Li, X.; Rubert-Nason, K.F.; Yang, Q.; Fu, Q.; Feng, J.; Shi, S. Photosynthetic acclimation of an evergreen broadleaved shrub (Ammopiptanthus mongolicus) to seasonal climate extremes on the Alxa Plateau, a cold desert ecosystem. Trees 2018, 32, 603–614. [Google Scholar] [CrossRef]
- Aikio, S.; Taulavuori, K.; Hurskainen, S.; Taulavuori, E.; Tuomi, J.; Mäkelä, A. Contributions of day length, temperature and individual variability on the rate and timing of leaf senescence in the common lilac Syringa vulgaris. Tree Physiol. 2019, 39, 961–970. [Google Scholar] [CrossRef]
- Jeong, S.J.; Ho, C.H.; Park, T.W.; Kim, J.; Levis, S. Impact of vegetation feedback on the temperature and its diurnal range over the Northern Hemisphere during summer in a 2 × CO2 climate. Clim. Dyn. 2011, 37, 821–833. [Google Scholar] [CrossRef] [Green Version]
- Vetaas, O.R.; Paudel, K.P.; Christensen, M. Principal factors controlling biodiversity along an elevation gradient: Water, energy and their interaction. J. Biogeogr. 2019, 46, 1652–1663. [Google Scholar] [CrossRef]
- Myers-Smith, I.H.; Kerby, J.T.; Phoenix, G.K.; Bjerke, J.W.; Epstein, H.E.; Assmann, J.J.; John, C.; Andreu-Hayles, L.; Angers-Blondin, S.; Beck, P.S.A.; et al. Complexity revealed in the greening of the Arctic. Nat. Clim. Change 2020, 10, 106–117. [Google Scholar] [CrossRef] [Green Version]
- Wang, S.; Wang, C.; Duan, J.; Zhu, X.; Du, M. Timing and duration of phenological sequences of alpine plants along an elevation gradient on the Tibetan plateau. Agric. For. Meteorol. 2014, 189–190, 220–228. [Google Scholar] [CrossRef]
- Xie, J.; Kneubühler, M.; Garonna, I.; Notarnicola, C.; Schaepman, M.E. Altitude-dependent influence of snow cover on alpine land surface phenology. J. Geophys. Res. 2017, 122, 1107–1122. [Google Scholar] [CrossRef] [Green Version]
- Deng, C.; Bai, H.; Gao, S.; Zhao, T.; Ma, X. Differences and variations in the elevation-dependent climatic growing season of the northern and southern slopes of the Qinling Mountains of China from 1985 to 2015. Theor. Appl. Climatol. 2018, 137, 1159–1169. [Google Scholar] [CrossRef]
- Zhu, W.; Zhang, X.; Zhang, J.; Zhu, L. A comprehensive analysis of phenological changes in forest vegetation of the Funiu Mountains, China. J. Geogr. Sci. 2019, 29, 131–145. [Google Scholar] [CrossRef] [Green Version]
- Liu, H.; Park, W.A.; Allen, C.D.; Guo, D.; Wu, X.; Anenkhonov, O.A.; Liang, E.; Sandanov, D.V.; Yin, Y.; Qi, Z.; et al. Rapid warming accelerates tree growth decline in semi-arid forests of Inner Asia. Glob. Change Biol. 2013, 19, 2500–2510. [Google Scholar] [CrossRef]
- Mishra, N.B.; Mainali, K.P. Greening and browning of the Himalaya: Spatial patterns and the role of climatic change and human drivers. Sci. Total Environ. 2017, 587–588, 326–339. [Google Scholar] [CrossRef]
- Wu, D.; Zhao, X.; Liang, S.; Zhou, T.; Huang, K.; Tang, B.; Zhao, W. Time-lag effects of global vegetation responses to climate change. Glob. Change Biol. 2015, 21, 3520–3531. [Google Scholar] [CrossRef]
- Rossi, S.; Anfodillo, T.; Cufar, K.; Cuny, H.E.; Deslauriers, A.; Fonti, P.; Frank, D.; Gričar, J.; Gruber, A.; Huang, J.G.; et al. Pattern of xylem phenology in conifers of cold ecosystems at the Northern Hemisphere. Glob. Change Biol. 2016, 22, 3804–3813. [Google Scholar] [CrossRef] [Green Version]
- Smith, B.; Wårlind, D.; Arneth, A.; Hickler, T.; Leadley, P.; Siltberg, J.; Zaehle, S. Implications of incorporating N cycling and N limitations on primary production in an individual-based dynamic vegetation model. Biogeosciences 2014, 11, 2027–2054. [Google Scholar] [CrossRef] [Green Version]
- Gou, X.H.; Chen, F.H.; Yang, M.X.; Peng, J.F.; Chen, T. Analysis of the tree-ring width chronology of Qilian Mountains at different elevation. Acta Ecol. Sin. 2004, 24, 172–176. (In Chinese) [Google Scholar]
- Liu, L.S.; Shao, X.M.; Liang, E.Y. Climate signals from tree ring chronologies of the upper and lower treelines in the Dulan region of the Northeastern Qinghai—Tibetan Plateau. J. Integr. Plant Biol. 2006, 48, 278–285. [Google Scholar] [CrossRef]
- Peng, J.F.; Gou, X.H.; Chen, F.H.; Liu, P.X.; Zhang, Y. Characteristics of ring width chronologies of Picea crassifolia and their responses to climate at different elevations in the Anyemaqen Mountains. Acta Ecol. Sin. 2007, 27, 3268–3276. (In Chinese) [Google Scholar]
- Qiang, W.Y.; Wang, X.L.; Chen, T.; Feng, H.Y.; An, L.Z.; He, Y.Q.; Wang, G. Variations of stomatal density and carbon isotope values of Picea crassifolia at different altitudes in the Qilian Mountains. Trees 2003, 17, 258–262. [Google Scholar] [CrossRef]
- Seftigen, K.; Frank, D.C.; Björklund, J.; Babst, F.; Poulter, B. The climatic drivers of normalized difference vegetation index and tree-ring-based estimates of forest productivity are spatially coherent but temporally decoupled in Northern Hemispheric forests. Glob. Ecol. Biogeogr. 2018, 27, 1352–1365. [Google Scholar] [CrossRef]
- Camarero, J.J.; Rozas, V.; Olano, J.M. Minimum wood density of Juniperus thurifera is a robust proxy of spring water availability in a continental Mediterranean climate. J. Biogeogr. 2014, 41, 1105–1114. [Google Scholar] [CrossRef]
- Deslauriers, A.; Huang, J.G.; Balducci, L.; Beaulieu, M.; Rossi, S. The contribution of carbon and water in modulating wood formation in black spruce saplings. Plant Physiol. 2016, 170, 2072–2084. [Google Scholar] [CrossRef] [Green Version]
- Björklund, J.; von Arx, G.; Nievergelt, D.; Wilson, J.; Bulcke, J.V.D.; Günther, B.; Loader, N.J.; Rydval, M.; Fonti, P.; Scharnweber, T.; et al. Scientific merits and analytical challenges of tree-ring densitometry. Rev. Geophys. 2019, 57, 1224–1264. [Google Scholar] [CrossRef] [Green Version]
- Zhou, P.; Huang, J.G.; Liang, H.; Rossi, S.; Bergeron, Y.; Shishov, V.V.; Jiang, S.; Kang, J.; Zhu, H.; Dong, Z. Radial growth of Larix sibirica was more sensitive to climate at low than high altitudes in the Altai Mountains, China. Agric. For. Meteorol. 2021, 304–305, 108392. [Google Scholar] [CrossRef]
- Churakova, O.V.; Fonti, M.V.; Saurer, M.; Guillet, S.; Corona, C.; Fonti, P.; Myglan, V.S.; Kirdyanov, A.V.; Naumova, O.V.; Ovchinnikov, D.V.; et al. Siberian tree—Ring and stable isotope proxies as indicators of temperature and moisture changes after major stratospheric volcanic eruptions. Clim. Past 2019, 15, 685–700. [Google Scholar] [CrossRef] [Green Version]
- Björklund, J.; Seftigen, K.; Fonti, P.; Nievergelt, D.; Arx, G.V. Dendroclimatic potential of dendroanatomy in temperature-sensitive Pinus sylvestris. Dendrochronologia 2020, 60, 125673. [Google Scholar] [CrossRef]
- Chang, S.Q. Preliminary Study on Moisture Sources and Physical Mechanism of Extreme Precipitation Events in the Arid Central Asia; Lanzhou University: Lanzhou, China, 2019. [Google Scholar]
- Bai, X.; Zhang, X.; Li, J.; Duan, X.; Jin, Y.; Chen, Z. Altitudinal disparity in growth of Dahurian larch (Larix gmelinii Rupr.) in response to recent climate change in northeast China. Sci. Total Environ. 2019, 670, 466–477. [Google Scholar] [CrossRef] [PubMed]
- Niu, X.D.; Jiang, H.; Zhang, J.M.; Fang, C.Y.; Sun, H. Characteristics of CO2 flux in an old growth mixed forest in Tianmu Mountain, Zhejiang, China. Chin. J. Appl. Ecol. 2016, 27, 1–8. (In Chinese) [Google Scholar]
- Wang, Q.; Wang, Y.Q.; Chao, M.; Wang, B.; Li, Y.F. Characteristics of carbon fluxes and their response to environmental factors in ecosystems of mixed coniferous and broad-leaved forests in Jinyun Mountain. Resour. Environ. Yangtze Basin 2019, 28, 75–86. (In Chinese) [Google Scholar]
- Zhang, X.W.; Liu, X.H.; Zhang, Q.L.; Zeng, X.M.; Xu, G.B.; Wu, G.J.; Wang, W.Z. Species-specific tree growth and intrinsic water—Use efficiency of Dahurian larch (Larix gmelinii) and Mongolian pine (Pinus sylvestris var. mongolica) growing in a boreal permafrost region of the Greater Hinggan Mountains, Northeastern China. Agric. For. Meteorol. 2018, 248, 145–155. [Google Scholar] [CrossRef]
- Malyshev, A.V. Warming events advance or delay spring phenology by affecting bud dormancy depth in trees. Front. Plant Sci. 2020, 11, 856. [Google Scholar] [CrossRef]
- Ma, Q.Q.; Huang, J.G.; Hänninen, H.; Berninger, F. Divergent trends in the risk of spring frost damage to trees in Europe with recent warming. Glob. Change Biol. 2018, 25, 351–360. [Google Scholar] [CrossRef] [Green Version]
- Jiang, S.; Liang, H.; Zhou, P.; Wang, Z.; Huang, J.G. Spatial and temporal differences in the response of Larix sibirica to climate change in the central Altai Mountains. Dendrochronologia 2021, 3, 125827. [Google Scholar] [CrossRef]
- Baumbach, L.; Siegmund, J.F.; Mittermeier, M.; Donner, R.V. Impacts of temperature extremes on European vegetation during the growing season. Biogeosciences 2017, 14, 4891–4903. [Google Scholar] [CrossRef] [Green Version]
- Vicente-Serrano, S.M.; Martín-Hernández, N.; Camarero, J.J.; Gazol, A.; Sánchez-Salguero, R.; Peña-Gallardo, M.; Kenawy, A.E.; Domínguez-Castro, F.; Tomas-Burguera, M.; Gutiérrez, E.; et al. Linking tree—Ring growth and satellite-derived gross primary growth in multiple forest biomes. Temporal-scale matters. Ecol. Indic. 2020, 108, 105753. [Google Scholar] [CrossRef]
- Alla, A.Q.; Pasho, E.; Marku, V. Growth variability and contrasting climatic responses of two Quercus macrolepis stands from Southern Albania. Trees 2017, 31, 1491–1504. [Google Scholar] [CrossRef]
- Coulthard, B.L.; Touchan, R.; Anchukaitis, K.J.; Meko, D.M.; Sivrikaya, F. Tree growth and vegetation activity at the ecosystem-scale in the eastern Mediterranean. Environ. Res. Lett. 2017, 12, 084008. [Google Scholar] [CrossRef] [Green Version]
- Sulla-Menashe, D.; Woodcock, C.E.; Friedl, M.A. Canadian boreal forest greening and browning trends: An analysis of biogeographic patterns and the relative roles of disturbance versus climate drivers. Environ. Res. Lett. 2018, 13, 014007. [Google Scholar] [CrossRef]
- Guay, K.C.; Beck, P.S.A.; Berner, L.T.; Goetz, S.J.; Baccini, A. Vegetation productivity patterns at high northern latitudes: A multi-sensor satellite data assessment. Glob. Change Biol. 2014, 20, 3147–3158. [Google Scholar] [CrossRef] [PubMed]
- Lawley, V.; Lewis, M.; Clarke, K.; Ostendorf, B. Site-based and remote sensing methods for monitoring indicators of vegetation condition:an Australian review. Ecol. Indic. 2016, 60, 1273–1283. [Google Scholar] [CrossRef] [Green Version]
- Zhang, Q.; Kong, D.; Singh, V.P.; Shi, P. Response of vegetation to different time-scales drought across China: Spatiotemporal patterns, causes and implications. Glob. Planet. Change 2017, 152, 1–11. [Google Scholar] [CrossRef] [Green Version]
- Cook, E.R.; Seager, R.; Kushnir, Y.; Briffa, K.R.; Büntgen, U.; Frank, D.; Krusic, P.J.; Tegel, W.; Schrier, G.V.D.; Andreu-Hayles, L.; et al. Old World mega-droughts and pluvials during the Common Era. Sci. Adv. 2015, 1, e1500561. [Google Scholar] [CrossRef] [Green Version]
- Büntgen, U.; Myglan, V.S.; Ljungqvist, F.C.; McCormick, M.; Cosmo, N.D.; Sigl, M.; Jungclaus, J.; Wagner, S.; Krusic, P.J.; Esper, J.; et al. Cooling and societal change during the Late Antique Little Ice Age from 536 to around 660 AD. Nat. Geosci. 2016, 9, 231–236. [Google Scholar] [CrossRef]
- Gauthier, S.; Bernier, P.; Kuuluvainen, T.; Shvidenko, A.Z.; Schepaschenko, D.G. Boreal forest health and global change. Science 2015, 349, 819–822. [Google Scholar] [CrossRef]
- Galiano, L.; Timofeeva, G.; Saurer, M.; Siegwolf, R.; Martínez-Vilalta, J.; Hommel, R.; Gessler, A. The fate of recently fixed carbon after drought release: Towards unravelling C storage regulation in Tilia platyphyllos and Pinus sylvestris. Plant Cell Environ. 2017, 40, 1711–1724. [Google Scholar] [CrossRef]
- Mitchell, P.J.; O’Grady, A.P.; Tissue, D.T.; Worledge, D.; Pinkard, E.A. Co-ordination of growth, gas exchange and hydraulics define the carbon safety margin in tree species with contrasting drought strategies. Tree Physiol. 2014, 34, 443–458. [Google Scholar] [CrossRef]
- Sala, A.; Woodruff, D.R.; Meinzer, F.C. Carbon dynamics in trees: Feast or famine? Tree Physiol. 2012, 32, 764–775. [Google Scholar] [CrossRef] [Green Version]
- Kannenberg, S.A.; Schwalm, C.R.; Anderegg, W.R. Ghosts of the past: How drought legacy effects shape forest functioning and carbon cycling. Ecol. Lett. 2020, 23, 891–901. [Google Scholar] [CrossRef] [Green Version]
- Gough, C.M.; Vogel, C.S.; Schmid, H.P.; Su, H.B.; Curtis, P.S. Multi-year convergence of biometric and meteorological estimates of forest carbon storage. Agric. For. Meteorol. 2008, 148, 158–170. [Google Scholar] [CrossRef]
- Cuny, H.E.; Rathgeber, C.B.K.; Frank, D.; Fonti, P.; Makinen, H.; Prislan, P.; Rossi, S.; Castillo, E.M.d.; Campelo, F.; Vavrčík, H.; et al. Woody biomass production lags stem-girth increase by over one month in coniferous forests. Nat. Plants 2015, 1, 15160. [Google Scholar] [CrossRef]
- Cai, Q.; Liu, Y. Two centuries temperature variations over subtropical southeast China inferred from Pinus taiwanensis Hayata tree-ring width. Clim. Dyn. 2017, 48, 1813–1825. [Google Scholar] [CrossRef]
- Shi, Z.J.; Xu, L.H.; Dong, L.S.; Gao, J.X.; Yang, X.H.; Lü, S.H.; Feng, C.Y.; Shang, J.X.; Song, A.Y.; Guo, H.; et al. Growth-climate response and drought reconstruction from tree-ring of Mongolian pine in Hulunbuir, Northeast China. J. Plant Ecol. 2016, 9, 51–60. [Google Scholar] [CrossRef]
- Ruibo, Z. Tree-Ring-Based Droughts Variability in Western Tianshan Mountains, Central Asia; College of Earth and Environment Sciences: Lanzhou, China, 2017. [Google Scholar]


| Area | Time Series | MS | SD | SNR | EPS | AC1 | MC |
|---|---|---|---|---|---|---|---|
| Alpine | 1959–2015 | 0.284 | 0.466 | 3.308 | 0.768 | 0.449 | 0.500 |
| Valley | 1959–2015 | 0.281 | 0.222 | 7.314 | 0.88 | −0.201 | 0.556 |
| Desert | 1959–2015 | 0.282 | 0.236 | 10.234 | 0.911 | 0.176 | 0.65 |
| Area | Factor | Z-Value | β-Value | Variation Tendency | Mutation Year |
|---|---|---|---|---|---|
| Alpine | Temperature | 2.36 | 0.052 °C/a | * | NS |
| Precipitation | 2.42 | 3.12 mm/a | * | NS | |
| SPEI | 0.52 | 0.0082/a | NS | 1996 | |
| Valley | Temperature | 1.97 | 0.017 °C/a | * | NS |
| Precipitation | 1.02 | 1.16 mm/a | NS | NS | |
| SPEI | 0.79 | −0.016/a | NS | 1996 | |
| Desert | Temperature | 1.32 | 0.035 °C/a | NS | NS |
| Precipitation | 1.11 | 1.16 mm/a | NS | NS | |
| SPEI | 1.47 | −0.026/a | NS | 1996 |
| NDVI | TRW of Alpine Areas | TRW of Valley Areas | TRW of Desert Areas |
|---|---|---|---|
| The interannual level | 0.413 | 0.413 | 0.413 |
| Pre-growing season (January to March) | 0.495 | 0.638 | 0.684 |
| Growing season (April to August) | 0.827 | 0.852 * | 0.903 * |
| Late growing season (September to December) | 0.014 | 0.507 | 0.332 |
Publisher’s Note: MDPI stays neutral with regard to jurisdictional claims in published maps and institutional affiliations. |
© 2022 by the authors. Licensee MDPI, Basel, Switzerland. This article is an open access article distributed under the terms and conditions of the Creative Commons Attribution (CC BY) license (https://creativecommons.org/licenses/by/4.0/).
Share and Cite
Yuan, K.; Xu, H.; Zhang, G. Is There Spatial and Temporal Variability in the Response of Plant Canopy and Trunk Growth to Climate Change in a Typical River Basin of Arid Areas. Water 2022, 14, 1573. https://doi.org/10.3390/w14101573
Yuan K, Xu H, Zhang G. Is There Spatial and Temporal Variability in the Response of Plant Canopy and Trunk Growth to Climate Change in a Typical River Basin of Arid Areas. Water. 2022; 14(10):1573. https://doi.org/10.3390/w14101573
Chicago/Turabian StyleYuan, Kaiye, Hailiang Xu, and Guangpeng Zhang. 2022. "Is There Spatial and Temporal Variability in the Response of Plant Canopy and Trunk Growth to Climate Change in a Typical River Basin of Arid Areas" Water 14, no. 10: 1573. https://doi.org/10.3390/w14101573
APA StyleYuan, K., Xu, H., & Zhang, G. (2022). Is There Spatial and Temporal Variability in the Response of Plant Canopy and Trunk Growth to Climate Change in a Typical River Basin of Arid Areas. Water, 14(10), 1573. https://doi.org/10.3390/w14101573