Article

Landsat Observations of Two Decades of Wetland Changes in the Estuary of Poyang Lake during 2000–2019

1
Changjiang River Scientific Research Institute, Wuhan 430000, China
2
Key Laboratory of the Regulation and Flood Control of Middle and Lower Reaches of the Yangtze River under Ministry of Water Resources, Wuhan 430000, China
*
Authors to whom correspondence should be addressed.
Water 2022, 14(1), 8; https://doi.org/10.3390/w14010008
Submission received: 10 November 2021 / Revised: 16 December 2021 / Accepted: 17 December 2021 / Published: 21 December 2021

Abstract

:
The stability of wetlands is threatened by the combined effects of global climate change and human activity. In particular, the vegetation cover status of lake wetlands has changed. Here, the change in vegetation cover at the estuary of Poyang Lake was monitored, and its influencing factors are studied to elucidate the dynamic change characteristics of vegetation at the inlet of this lake. Flood and water level changes are two of the main factors affecting the evolution of wetland vegetation at the estuary of Poyang Lake. Therefore, Landsat data from 2000 to 2019 were used to study the spatial and temporal variation in the Normalized Difference Vegetation Index (NDVI) in the vegetation cover area. Theil–Sen Median trend analysis and Mann–Kendall tests were used to study the long-term trend characteristics of NDVI. The response between NDVI and the explanatory variables at the estuary of Poyang Lake was quantified using regression tree analysis to study the regional climate, water level, and flood inundation duration. Results showed the following: (1) Vegetation in a large area of the study area improved significantly from 2000 to 2010 and only slightly from 2010 to 2019, and few areas with slight degradation of vegetation were found. In most of these areas, the vegetation from 2000 to 2010 exhibited a gradual change, from nothing to something, which started around 2004; (2) The main variable that separated the NDVI values was the mean water level in October. When the mean October water level was greater than 14.467 m, the study area was still flooded in October. Thus, the regional value of BestNDVI was approximately 0.3, indicating poor vegetation growth. When the mean water level in October was less than 14.467 m, the elevation of the study area was higher than the water level value, and after the water receded in October, the wetland vegetation exhibited autumn growth in that year. Thus, the vegetation in the study area grew more abundantly. These results could help manage and protect the degraded wetland ecology.

1. Introduction

Wetland is a transition zone located between terrestrial and aquatic ecosystems [1]. Wetlands function as ecological processes, including hydrological retention, nutrient transformation, biological survival, and growth and plant diversity [2,3,4,5]. Wetlands are characterized by groundwater and shallow water which is frequent and persistent enough to encourage aquatic plants to dominate aquatic soil during the annual growing season [6]. Wetlands have three important structural parameters: saturated soils, plant community composition, and hydrological characteristics [7]. Different combinations of hydrological characteristics and vegetation create a rich variety of wetland types. Thus, the types of this ecosystem include coastal wetlands, inland wetlands, and artificial wetlands. Lake wetlands develop from the cold temperate zone to the tropics, from plains to mountains and plateaus, and from coastal to inland regions [6,8,9,10,11]. Wetland conservation research focuses on two aspects: the interpretation of soil structure and vegetation patterns from a hydrological perspective, and plants based on the understanding of spatial and temporal scales and the interactions between soil, water, and vegetation [12,13].
Hydrological processes are responsible for the formation, persistence, size, and function of wetlands [14,15]. Hydrology is extremely vital for the conservation of wetland structures and their functions [15]. Lake wetland plant communities are a central component of the natural landscape of lake wetlands, with high productivity and biomass, providing habitats for many animals and playing an important role in maintaining regional biodiversity. Lake wetland vegetation is a dynamic component under natural conditions, with lake wetlands providing a range of important ecosystem services, such as biodiversity, nutrient uptake, pollution control, groundwater recharge, timber production, and recreation [16,17,18,19,20]. The species composition and spatial distribution of lake wetland vegetation depends on lake wetland morphology to a large extent, water level fluctuations, and plant tolerance to flood disturbance and water stress [20]. Water conditions primarily determine the wetland plant community composition. A strong correlation exists between vegetation within individual wetlands and various water conditions, which determine the spatial and temporal heterogeneity of wetland vegetation [21]. Flooding is an important limiting factor for plant growth in lake wetlands, with most lake wetland plants failing to grow naturally in a fully flooded state and gradually dying with increasing periods of flooding [20,22,23]. Changes in hydrological conditions could also affect the intensity of flooding stress (e.g., duration of flooding) and the intensity of underwater light, thus affecting the growth of lake wetland plants. Therefore, in the context of global climate change and human activities, studying the effects and mechanisms of flooding duration and climate change on the growth of lake wetland plants could provide a scientific basis for the conservation and management of lake wetland vegetation [24,25,26].
Satellite remote sensing has been widely used to assess the condition of wetland vegetation on regional scales [27,28,29,30]. Long-term remote sensing of wetland vegetation requires satellite observations with sufficient historical and spatial resolution to describe changes in influencing conditions, such as climate, hydrology, and land management [31]. Landsat satellites are ideal for meeting these requirements due to their extensive and continuous archives (30+ years), temporal resolution (8–16 days), and spatial resolution of 30 m pixel size [32]. From the first Landsat archives, the ecological applications of Landsat data have increased exponentially [33]. Software platforms, such as the Google Earth engine, now provide access to remote sensing and climate data archives, with massively parallel cloud computing capabilities [34]. This cloud-based access and processing has led to remarkable advances and data discoveries related to high-resolution land cover and water extent maps and visualizations that would not have been possible otherwise [35,36]. These new capabilities and advances have altered the paradigm for long historical and high-resolution remote sensing and ecosystem monitoring.
Poyang Lake is the largest freshwater lake in China, one of the first seven wetlands listed in the Wetlands of International Importance in China, and the only wetland in China that is a member of the World Network of Lakes for Life [37,38]. Poyang Lake has 95% of the total number of wintering cranes in the world and 75% of the total number of wintering Oriental white storks in the world. It is known as the “Kingdom of Migratory Birds.” Therefore, the international community is highly concerned about the wetland of Poyang Lake. Poyang Lake has a unique vegetation of continental beach, and aquatic, marsh, and wet vegetation exists in the first and largest freshwater lake in China, something that is rare in China and around the world. Its huge biological resources and biodiversity are valuable natural germplasm resources given by nature to humans [39]. Therefore, studying the patterns between vegetation and hydrological changes in the wetlands of Poyang Lake is crucial.
Vegetation depends on hydrology rather than speaking about correlation; many wetlands are dynamic, and they need to be monitored throughout the year to map changes in water storage and vegetation cover [40,41]. These features could be observed through changes in vegetation and water indices over time and provide insights into the extent, function, and frequency of events in the system. The temporal frequency of high-quality optical remote sensing images of Poyang Lake wetlands is commonly limited by the amount of cloud in the area [42,43,44]. Many previous remote sensing studies on Poyang Lake have focused on single-date assessments of selected cover types [45,46,47], whereas multi-temporal basin-wide analyses have primarily dealt with inundation dynamics and scarce vegetation or habitat features [48,49]. Vegetation dynamics, particularly on a large scale, could be monitored using remote sensing [50,51]. Of the spectral indices that could be determined from remote sensing, the Normalized Difference Vegetation Index (NDVI) is the most important [52,53]. NDVI is still the best known and most commonly used index. It is commonly used to explore the relationship between terrestrial vegetation and climate [50,54]. In arid and semi-arid regions, the linear relationship between NDVI and prior rainfall is well documented, although the response of NDVI to soil and hydrological factors is less studied [49,54,55].
In this paper, the dynamics of NDVI and wetland vegetation were examined by analyzing (1) the long-term trends in NDVI over the last 20 years and (2) relationships between NDVI and climatic and hydrological variables. This method was used to determine long-term trends and variability over a 20-year period. Theil–Sen median and Mann–Kendall tests were mainly used for the long-term trend analysis of the vegetation of Poyang Lake. A regression tree was generated to classify the response variables (NDVI) in accordance with the explanatory variables (hydrological and climatic variables). The values of the response variables were separated by identifying thresholds to explain the influence of climatic and hydrological factors on the vegetation of Poyang Lake.

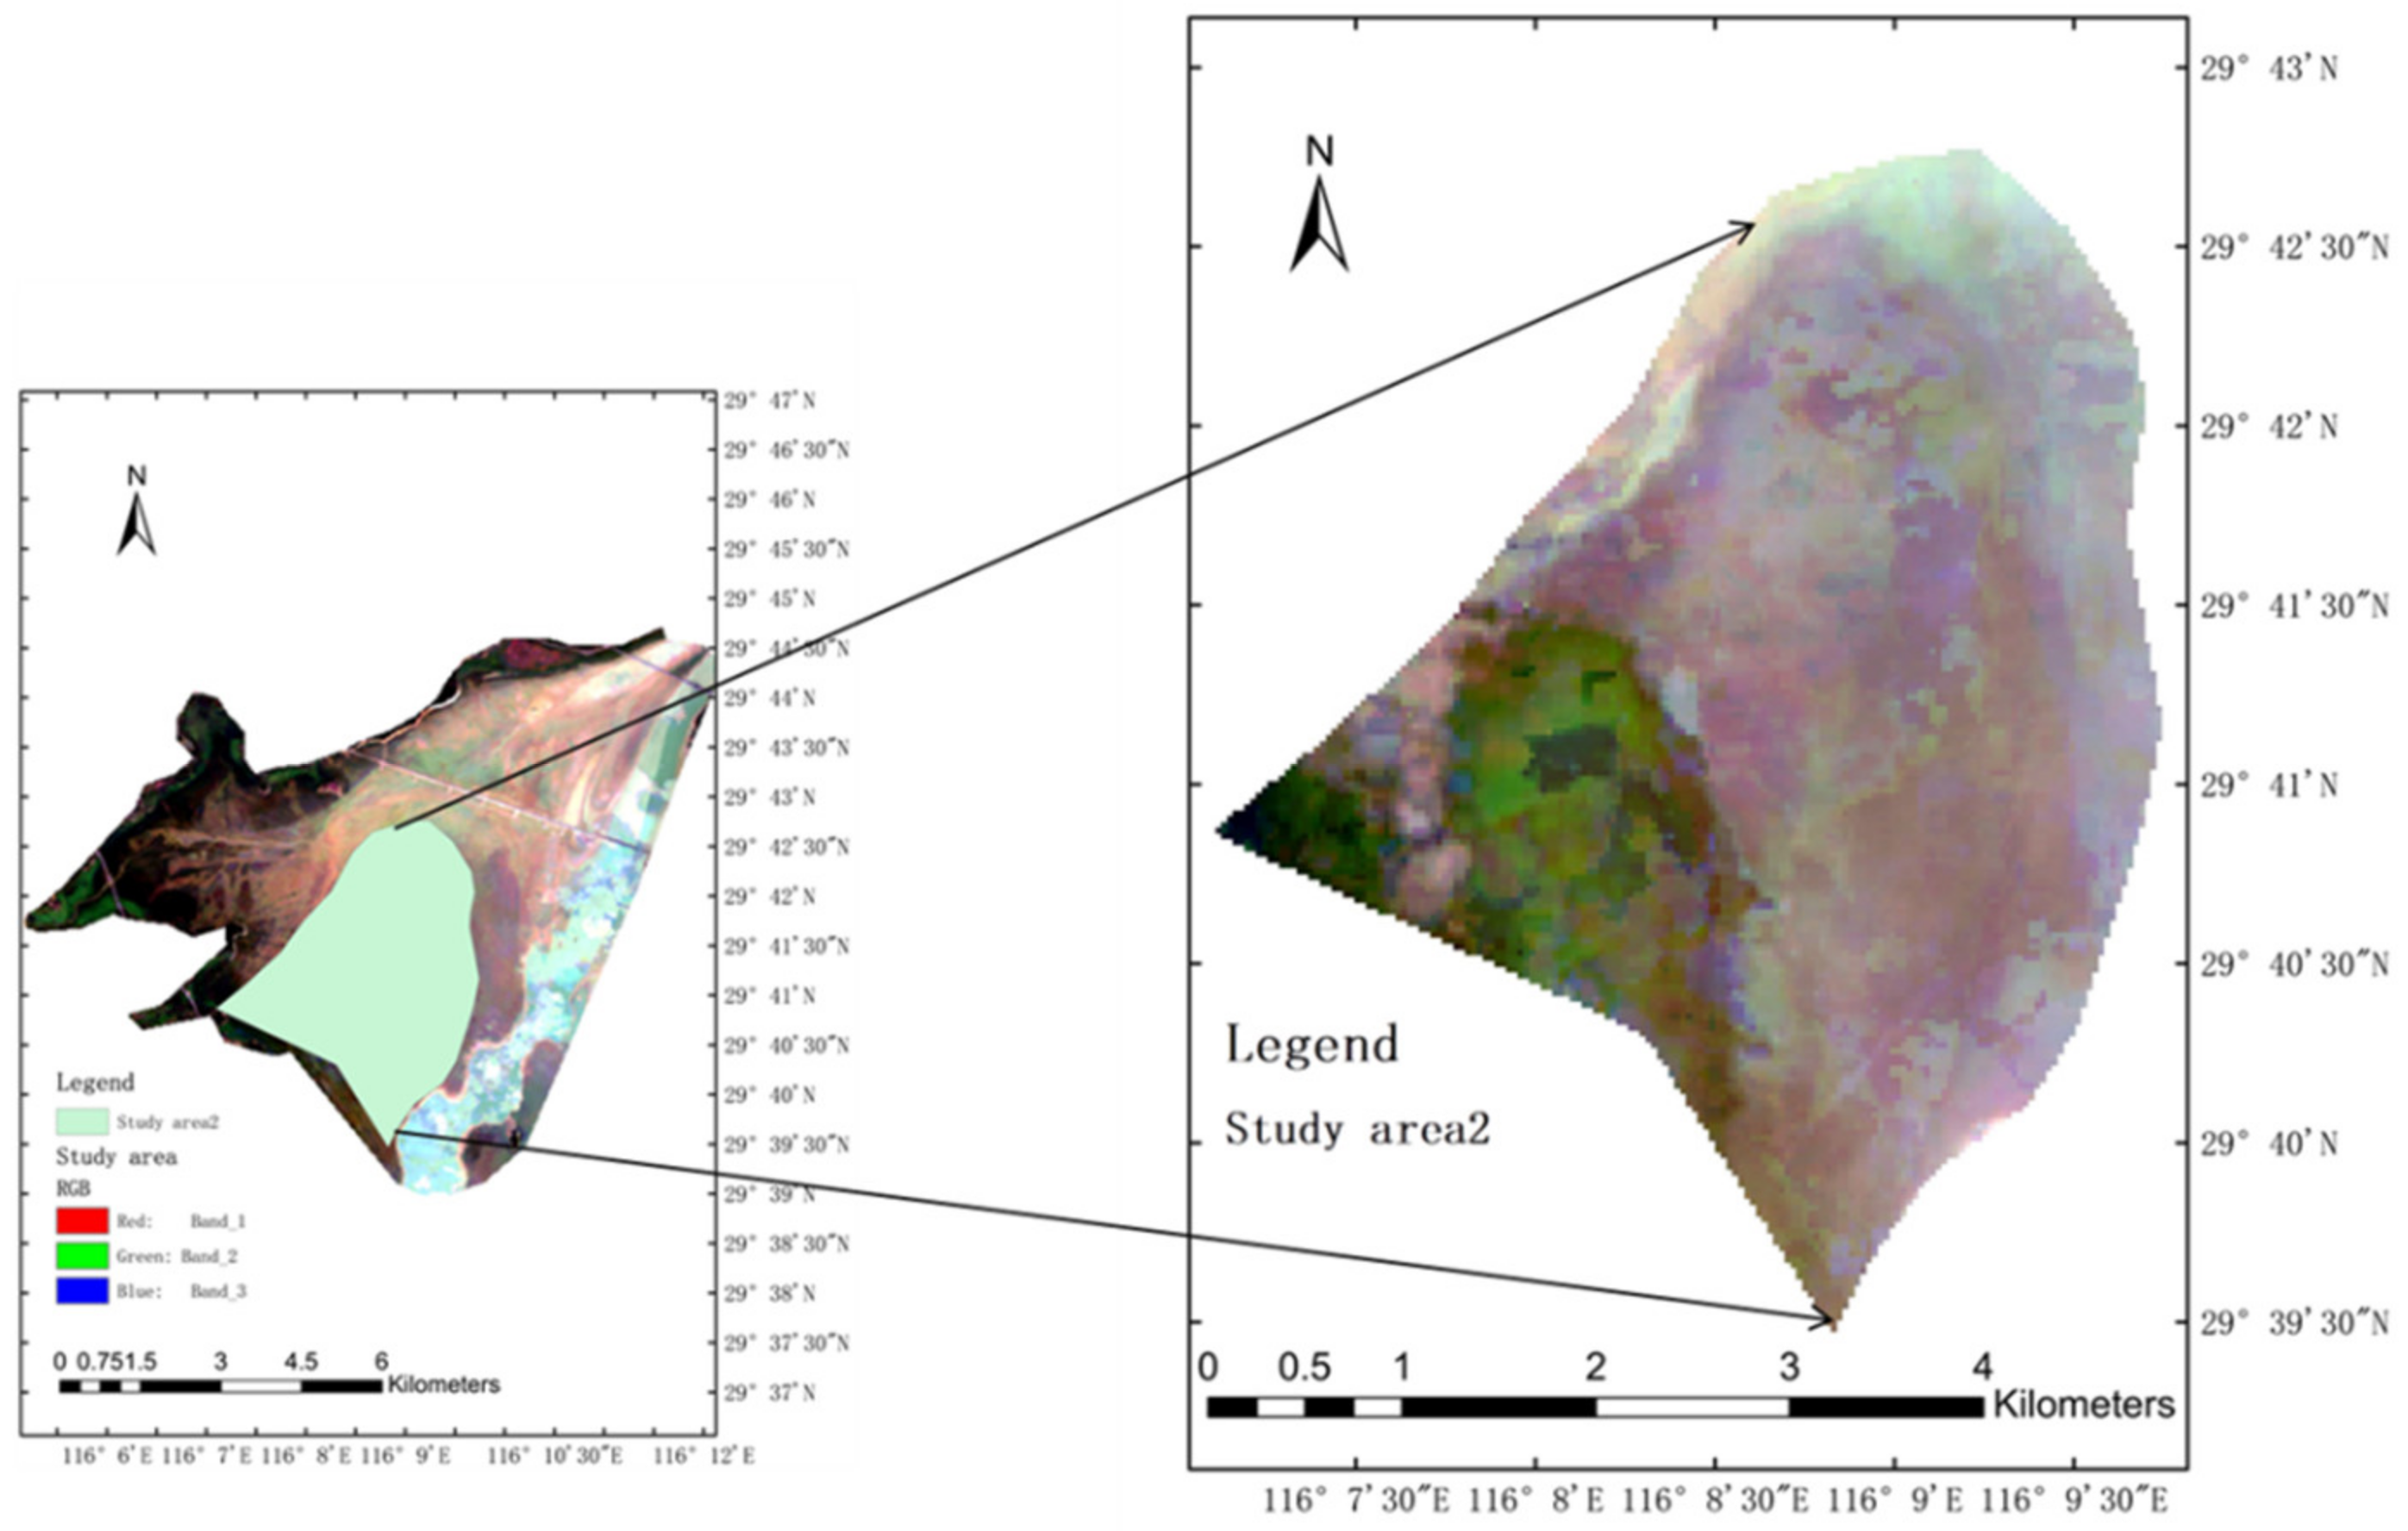
2. Study Area and Dataset

Poyang Lake is located at a longitude of 115°49′–116°46′ E and a latitude of 28°24′–29°26′ N. It is a gulping, seasonal, and shallow freshwater lake, and the water level varies considerably [56]. Topped by the incoming water of five rivers and the high water level of the Yangtze River, the high water period is from April to September, with the highest water level commonly occurring in June to July, a dry period from October to March, and the lowest water level usually occurring in December and January [57,58]. Poyang Lake forms a unique landscape of “high water is a lake, low water is like a river” and “one flood, one line of dry water” [59]. The wetland of Poyang Lake is characterized by a subtropical, warm, and humid climate. The average annual temperature is 16.5–17.8 °C. The average annual precipitation in the lake area was 1570 mm from 1951 to 1984, and it increased to 1654.8 mm from 1991 to 2005, influenced by the monsoon climate. The annual precipitation is mainly concentrated in the months of April to June [60,61].
The vegetation of Poyang Lake wetland is mainly grass swamp vegetation and aquatic vegetation, and the plant community types are rich [62]. The community types covering large areas are Carex, Phragmites australis (Cav.) Trin. ex Steud, Triarrhena lutarioriparia L. Liu, and Cynodon dactylon (L.) Pers [62,63]. The spatial distribution of wetland plant communities in Poyang Lake shows an obvious water gradient, various vegetation types occupy specific water ecological niche space, and the distribution form shows a general pattern of strip-like distribution along the water–land intersection [62]. The growth process of plants in Poyang Lake wetlands could be divided into two growth periods: autumn and spring. The autumn growth period is from September to January of the following year; when the water level recedes, the wetland plants gradually sprout and grow, and then they stop growing due to the lower temperatures in winter [64]. The spring growth period is from March to June, and it continues as the temperature rises but stops when the lake level rises and vegetation is gradually submerged [65]. The aboveground parts of plants that sprout and grow during the autumn growth period are frequently able to continue to grow during the following spring growth period, whereas most aboveground parts of wetland plants die during prolonged flooding [64,65,66]. The present paper focused on the study and investigation of beach vegetation near Jiujiang City, where the plant community is wetland vegetation (Figure 1). The vegetation is similar to the general characteristics of the wetland plants of Poyang Lake. More than ten species of Carex spp. are distributed in the lake area, mainly reproducing by cloning. The wetland vegetation in the study area has characteristics of dense clonal growth, massive community cover, and a simple structure. It generally consists of 5–7 species of wet plants, and it is common for various wetland vegetations to mix within the community. The height of this type of community is commonly 60–80 cm and the cover is 95–100%. The community has a neat appearance with few constituent species, flowers, and young fruit in May. The whole appearance is dark green and densely growing.
Meteorological data were obtained from the daily data (including rainfall and temperature) recorded at Lushan Station of Poyang Lake, provided by the China Meteorological Science Data Sharing Network (http://data.cma.cn/site/article/id/347.html, accessed on 10 October 2021) [67,68,69].
Hydrological observation data used the daily average water level data of the Hukou hydrological station from 2000 to 2019, provided by the Poyang Lake Hydrological Bureau of Jiangxi Province. All elevation data in this paper were Yellow Sea elevation (Wusong elevation − 1.86 m = Yellow Sea elevation) [64,70,71].

3. Methods

This article uses a flowchart (Figure 2) to clearly show the main research process.

3.1. NDVI

The remote sensing images processed on GEE platform were Landsat-5, Landsat-7, and Landsat-8 remote sensing images from 2000 to 2019 in the study area of Poyang Lake. Due to the several missing satellite data for 2012, the data for 20 years (excluding 2012, with a spatial resolution of 30 m and a satellite revisit period of 16 days) were utilized for the three satellite data images. NDVI is calculated from satellite data bands with the following formula [72,73,74,75]:
NDVI = NIR RED NIR + RED
NDVI values range from −1 to 1. An NDVI of approximately 0.6–0.9 indicates significant vegetation. For areas with sparse plant cover, the NDVI values are lower but still greater than 0 (roughly 0.2–0.5). The NDVI values for water, snow, bare land, and rocks are 0 or near 0 [76,77] (https://www.usgs.gov/special-topics/remote-sensing-phenology/science/ndvi-foundation-remote-sensing-phenology?qt-science_center_objects=0#qt-science_center_objects, accessed on 10 October 2021).
Landsat scenes are affected by clouds; not all places could be selected for cloud-free imagery. Ideally, the “best” Landsat images for each region are collected and analyzed, the clouds and noisy pixels are flagged, and finally, the extracted maps are stitched. In this study, a maximum NDVI image for each year was generated by obtaining the maximum NDVI value that occurred in the time series. Choosing the maximum NDVI value reduces the influence of clouds and other external factors, and using a composite of the maximum NDVI values for each location in the region to stitch together a new image could still represent the annual vegetation growth in the region [78,79]. The maximum NDVI corresponding to each pixel in the study area for each year was calculated and expressed as NDVImax; then, the annual NDVImax maps were classified into five categories in accordance with the vegetation survey of Poyang Lake: (−1, 0.3), (0.3, 0.4), (0.4, 0.5), (0.5, 0.6), and (0.6, 1).

3.2. Modified Normalized Difference Water Index (MNDWI)

The GEE platform applies a temporal filter to select all available Landsat surface reflectance images for the time period of a year. Landsat images available from 2000 to 2019 were collated into an annual image collection. On the basis of each image in the GEE computation collection, the time composite was generated by filtering to remove images, such as those with banded clouds and cloud shadows. MNDWI was calculated to map surface water and flood areas [80] as follows:
MNDWI = G SWIR 1 G + SWIR 1 ,
where G and SWIR1 are the green and shortwave infrared bands, respectively. A constant MNDWI threshold of −0.05 was defined to discriminate between water (>−0.05) and non-water (<−0.05) (Figure 3). Adaptive MNDWI thresholding [81] can improve surface water mapping applications. The constant threshold was applied to annual temporal composite images, producing binary water masks. The binary masks were cleaned using standard image processing morphological filtering [82], whereby small, erroneously classified disconnected areas containing fewer than 100 pixels were removed, and a circular structuring element with a radius of two pixels performed a single iteration of morphological closing. The cleaned, annually resolved binary water masks were exported from the Google Earth engine [83]. Wetted channel occurrence, i.e., the frequency at which a pixel was classified as wetted channel between 2000 and 2019, was mapped to eventually visualize wetted wetland planform dynamics.

3.3. Exploratory Analyses

In this paper, the dynamic changes in riparian vegetation in Poyang Lake were studied in two manners. First, the spatial distribution characteristics, temporal variation characteristics, and trends in the maximum NDVI for each pixel year in the region for the last 20 years were studied. Second, the relationship between NDVI and climate and hydrological variables in areas with significant vegetation changes was studied, where NDVI was used as the regional average of NDVImax.

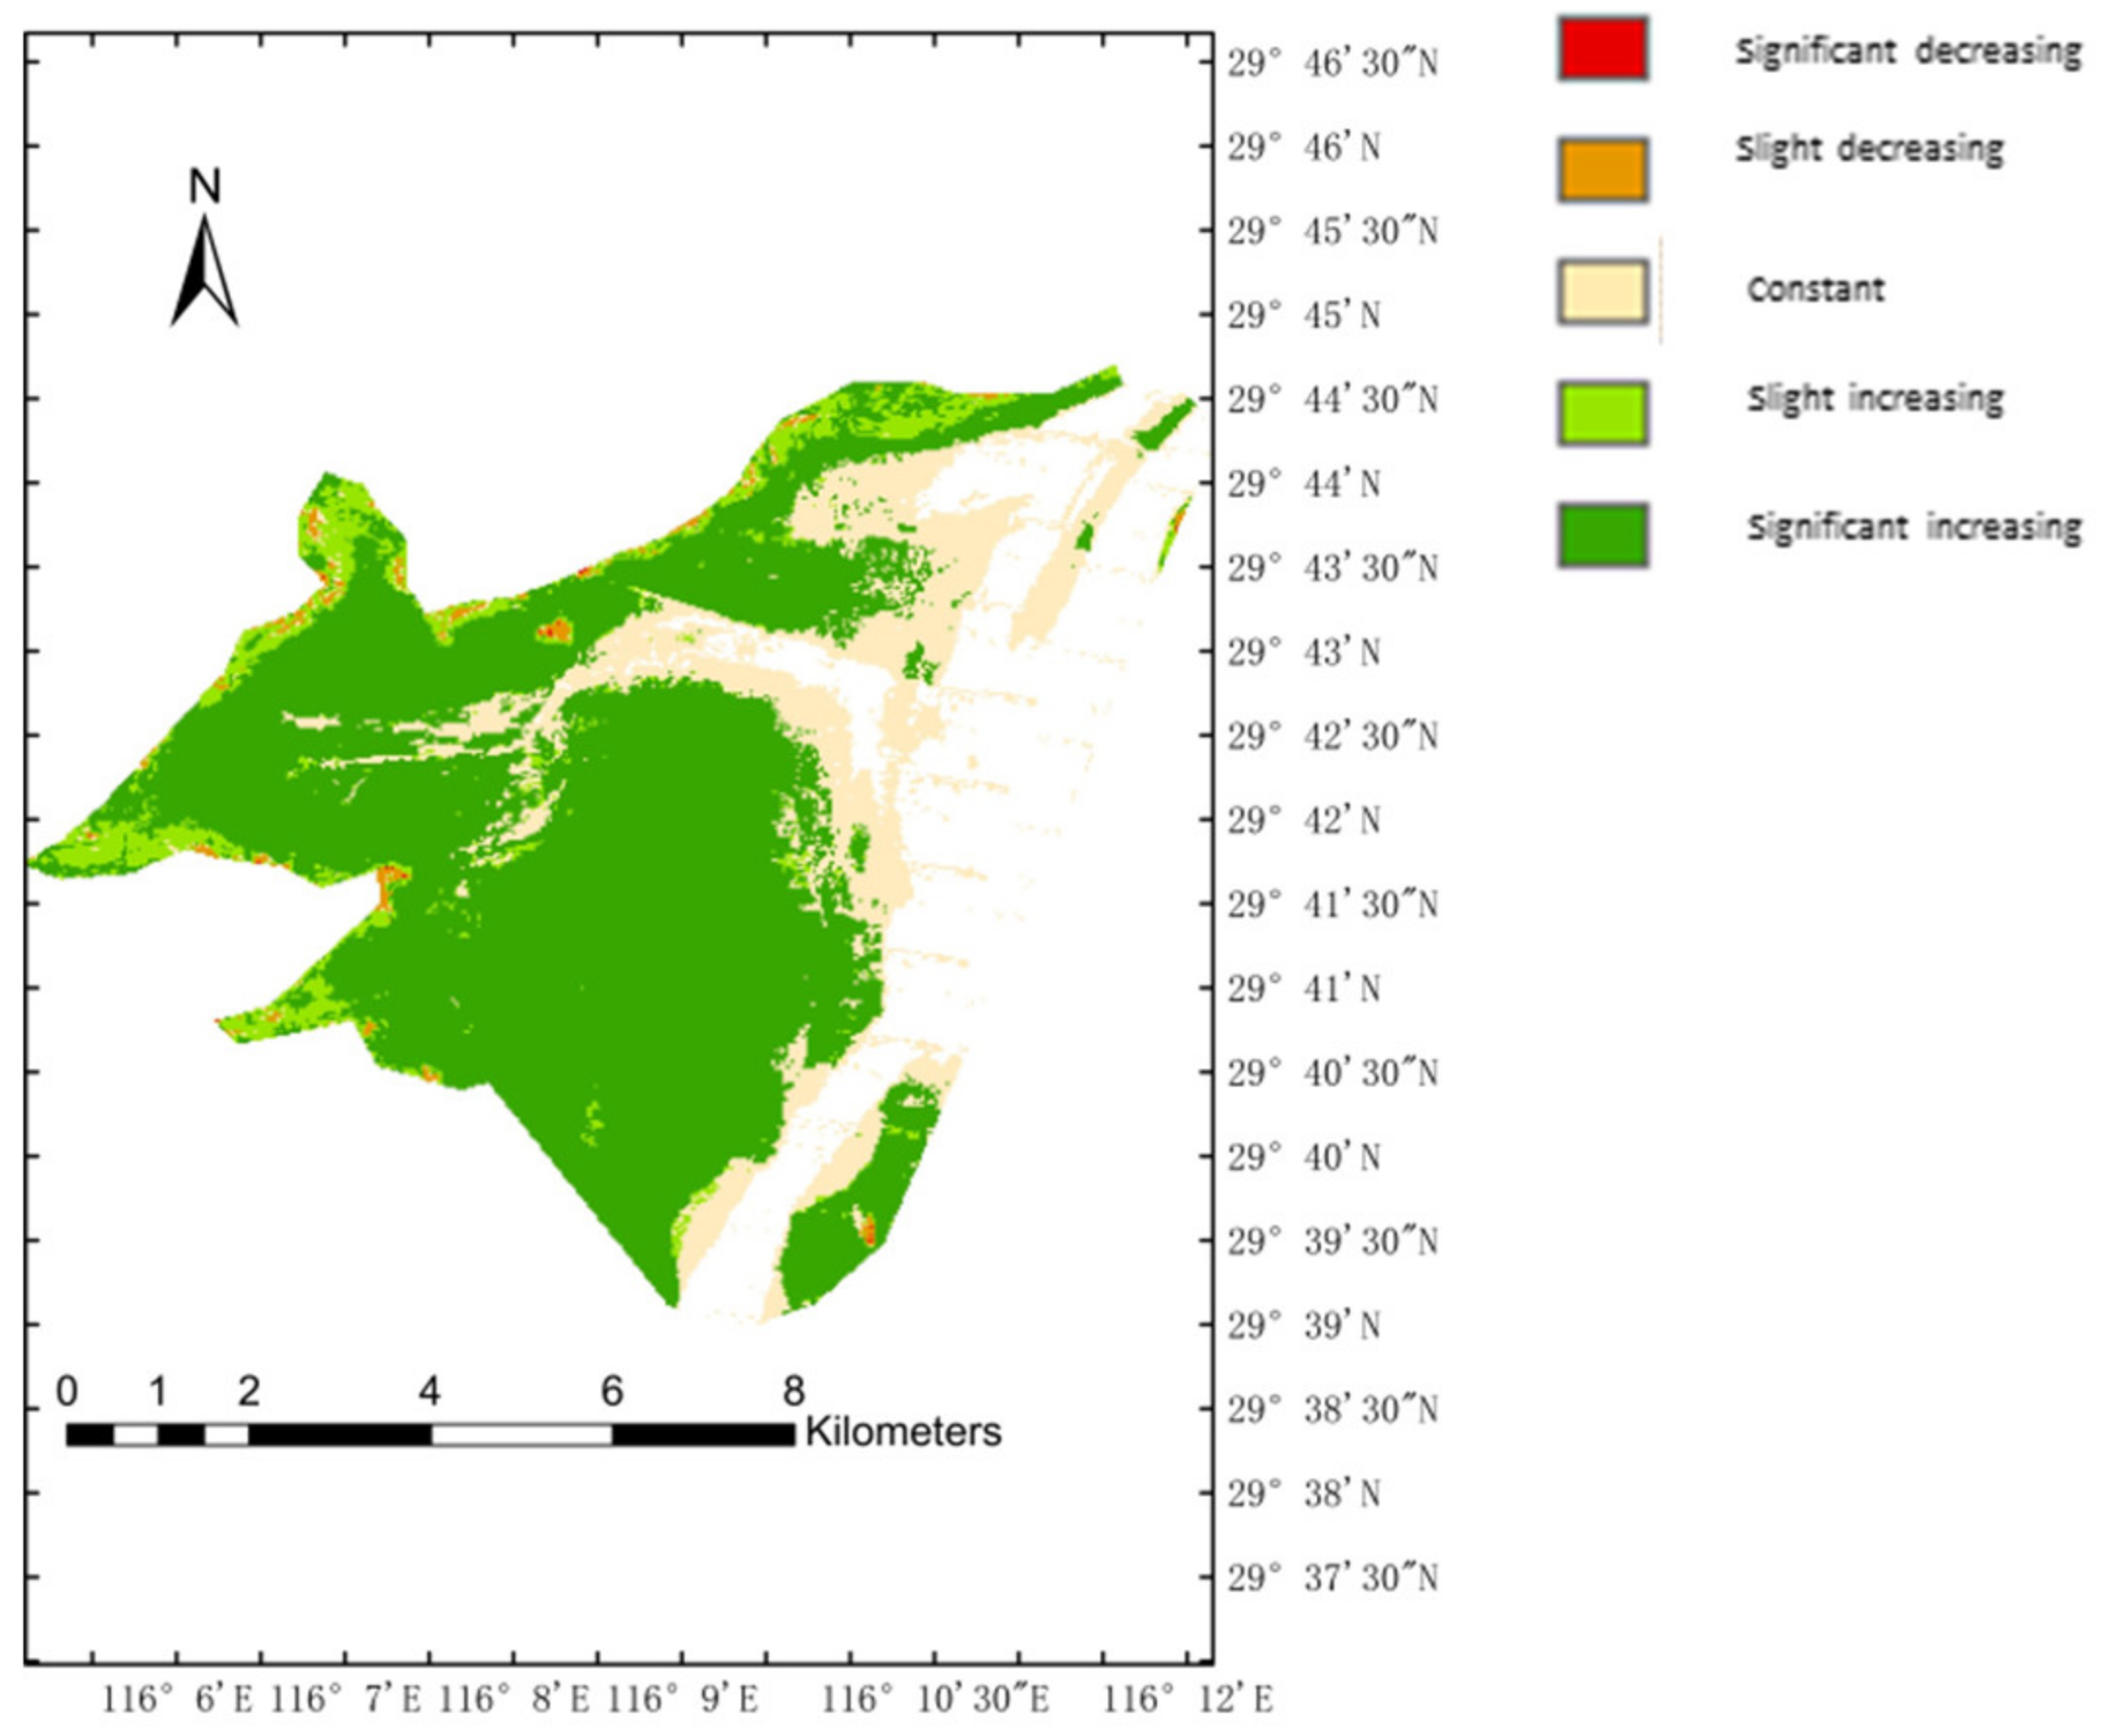
3.3.1. Analysis of Spatial and Temporal Vegetation Trends

Theil–Sen median trend analysis and Mann–Kendall tests were used to study the spatial distribution characteristics, temporal variation characteristics, and trends in regional NDVI.
Both could be well combined to become an important method for determining trends in long time series data, and they have gradually been applied to long time series analyses of vegetation growth [84,85,86]. The advantages of this approach are that it does not require the data to obey a certain distribution, has a strong resistance to data errors, and has a more solid statistical theoretical basis for tests of the significance level, thereby making the results more scientifically credible. The Theil–Sen median trend analysis is a robust non-parametric statistical method of trend calculation that could reduce the influence of data outliers. Its calculation formula is as follows [85,86]:
S N D V I = M e d i a n N D V I j N D V I j i j i
where N D V I i and N D V I j denote NDVI values for image year i and year j, respectively, n denotes the length of the time series; S N D V I > 0 reflects a growing trend in NDVI, whereas the opposite reflects the trend of NDVI degradation.
The Mann–Kendall test is a nonparametric statistical tool to determine the significance of a trend; it does not require the sample to follow a certain distribution, and it is not disturbed by a few outliers [87]

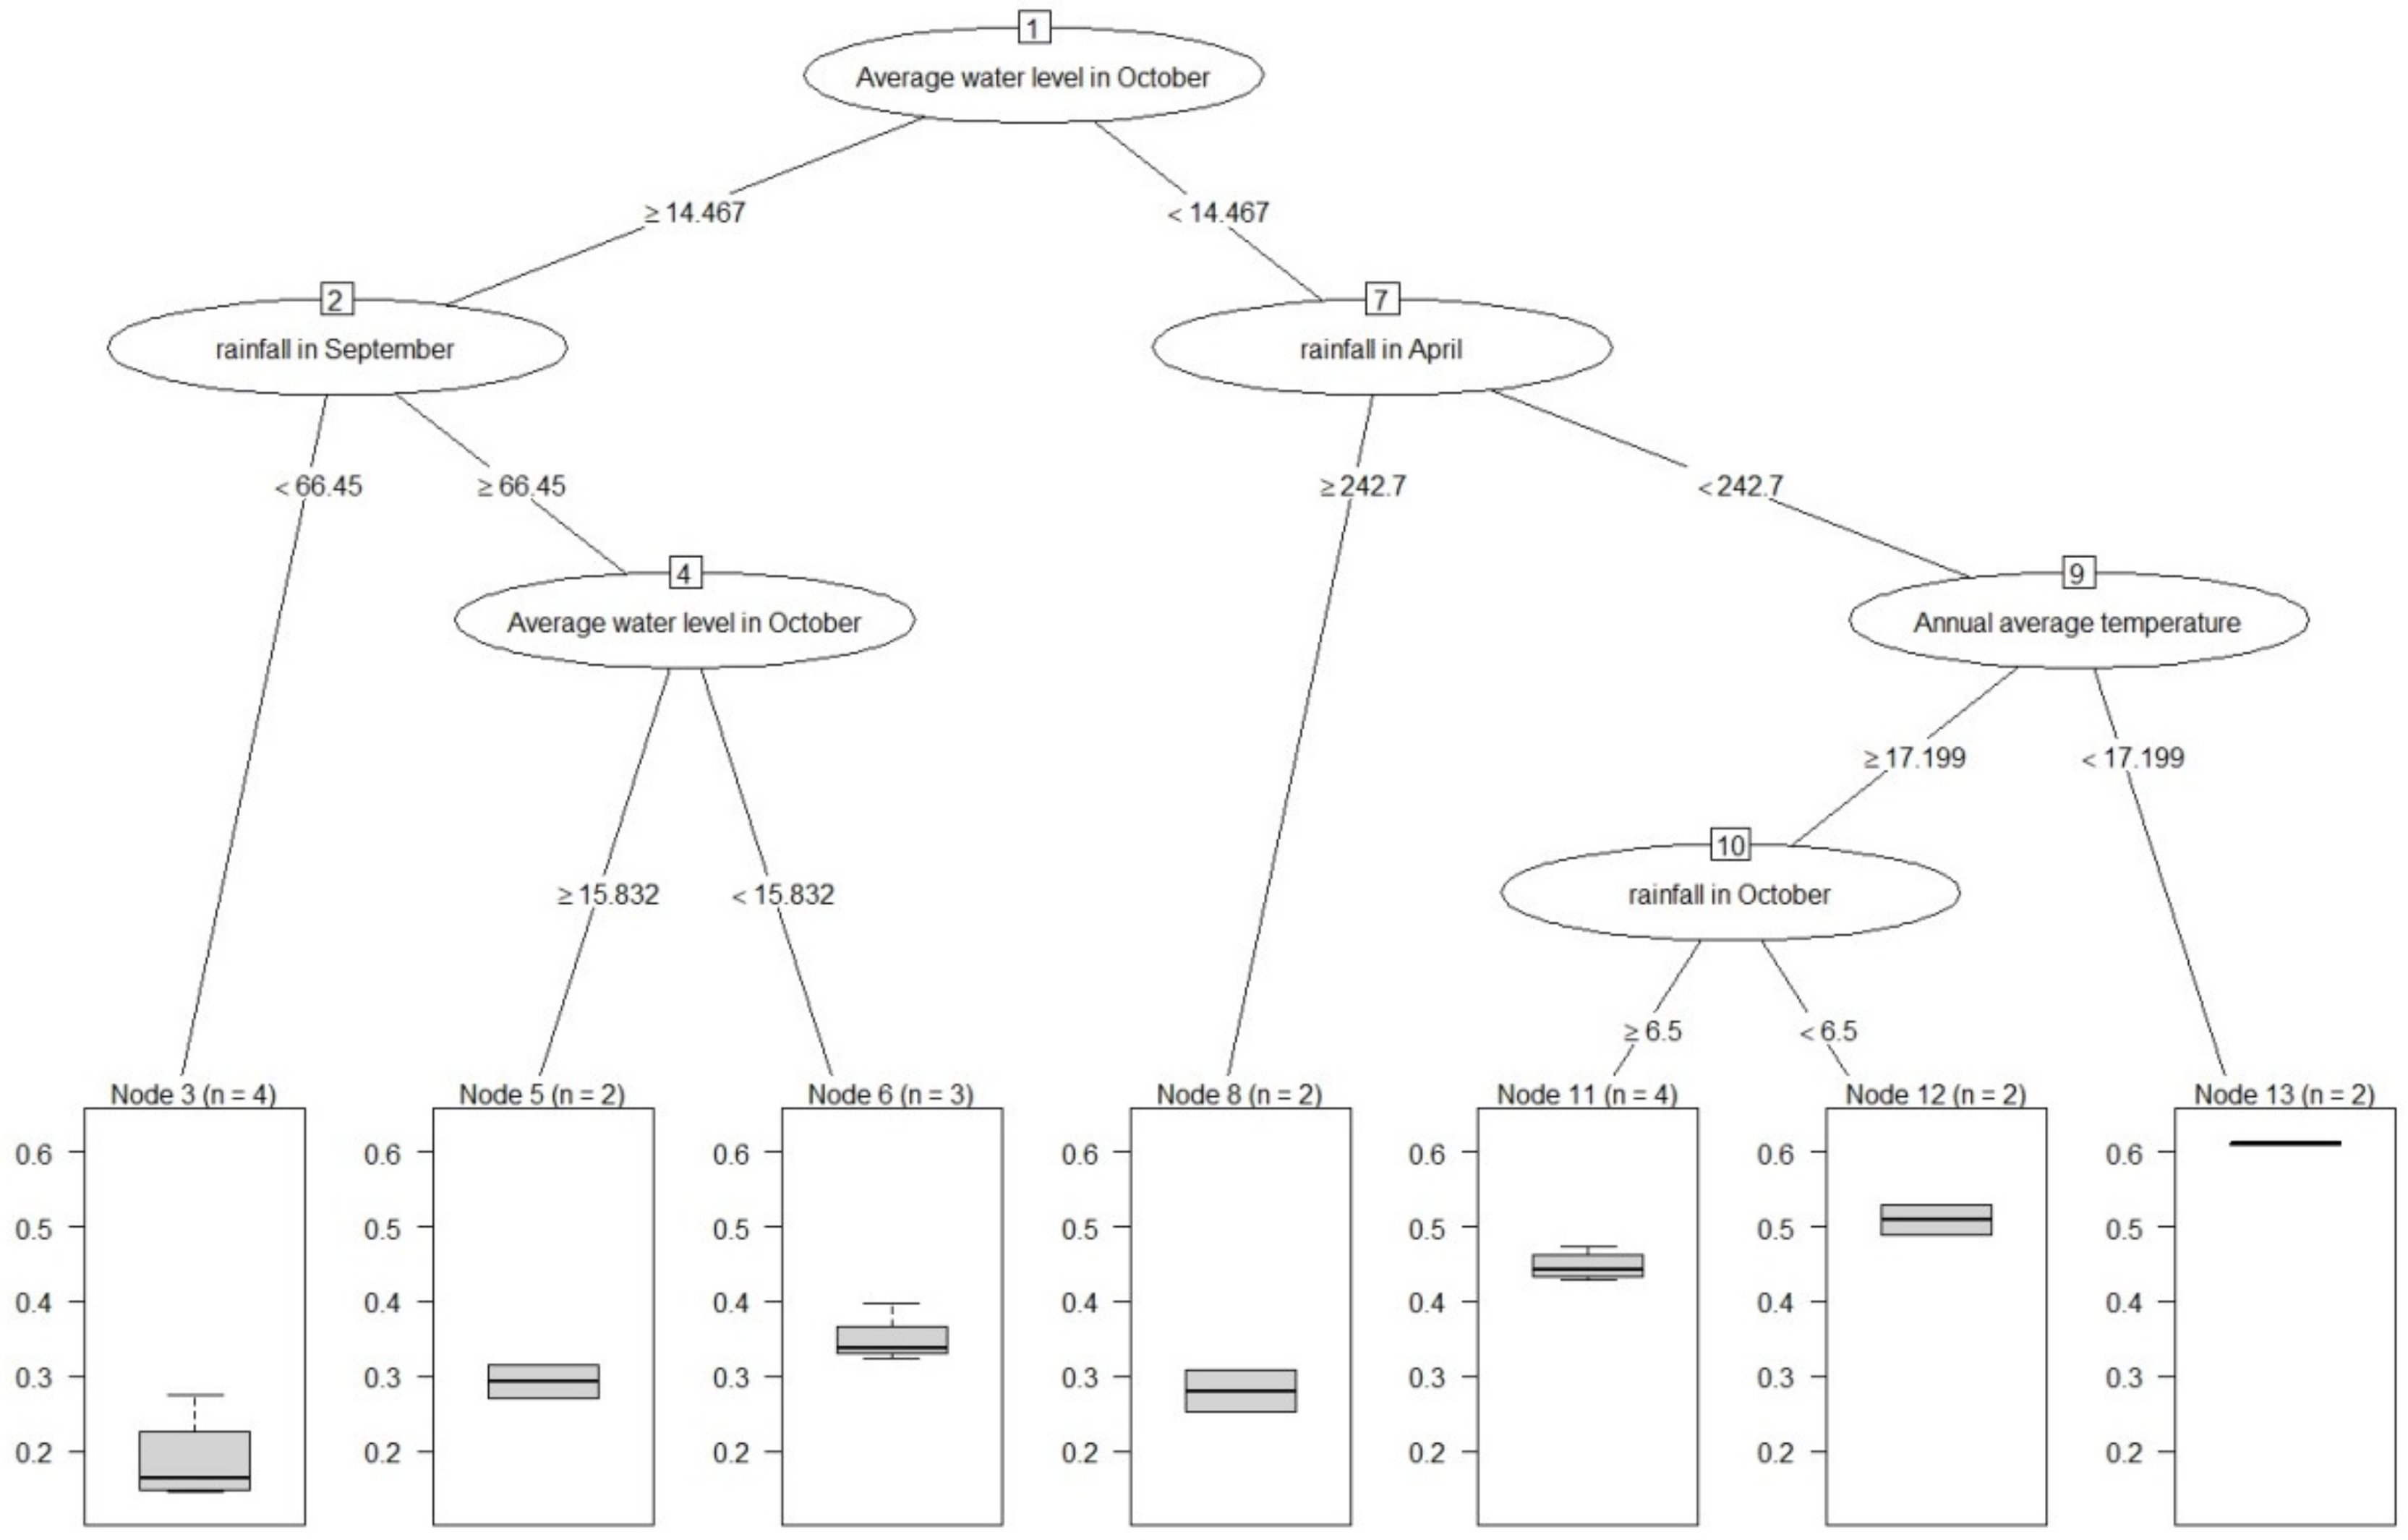
3.3.2. Regression Tree Analysis

Regression tree analysis is a commonly used nonparametric regression and classification statistical method that generates a regression tree [88]. The response variables are classified in accordance with the explanatory variables, and their values are separated by identifying thresholds [89]. Regression tree analysis is used in R to find the explanatory variables that are most strongly associated with the response variable [89]. This method tests the global null hypothesis of independence between any of the explanatory variables and the response variable. It selects the explanatory variable with the strongest association to the response variable. This association is measured by a p-value corresponding to the hypothesis test (we used a Kruskal–Wallis test). Then, the algorithm implements an optimal binary split in the selected explanatory variable using a permutation test. The classification stops when the p-value is greater than a threshold [89].
The explanatory variables used for regression tree analysis included water level (average water level in April, May, September, October, November, and December), flood inundation (inundation in April, May, September, October, November, and December and inundation duration), temperature (annual average temperature, annual maximum temperature, and annual minimum temperature), and rainfall (February, March, April, May, July, August, September, October, and November). Among them, water level, temperature, and rainfall are continuous variables. Flood inundation is a subtype variable, except for the inundation duration variable, where 0 means the area is flooded, and 1 means the area is not flooded. The response variable is the regional average of NDVImax per year, which is expressed as BestNDVI.

4. Results and Discussions

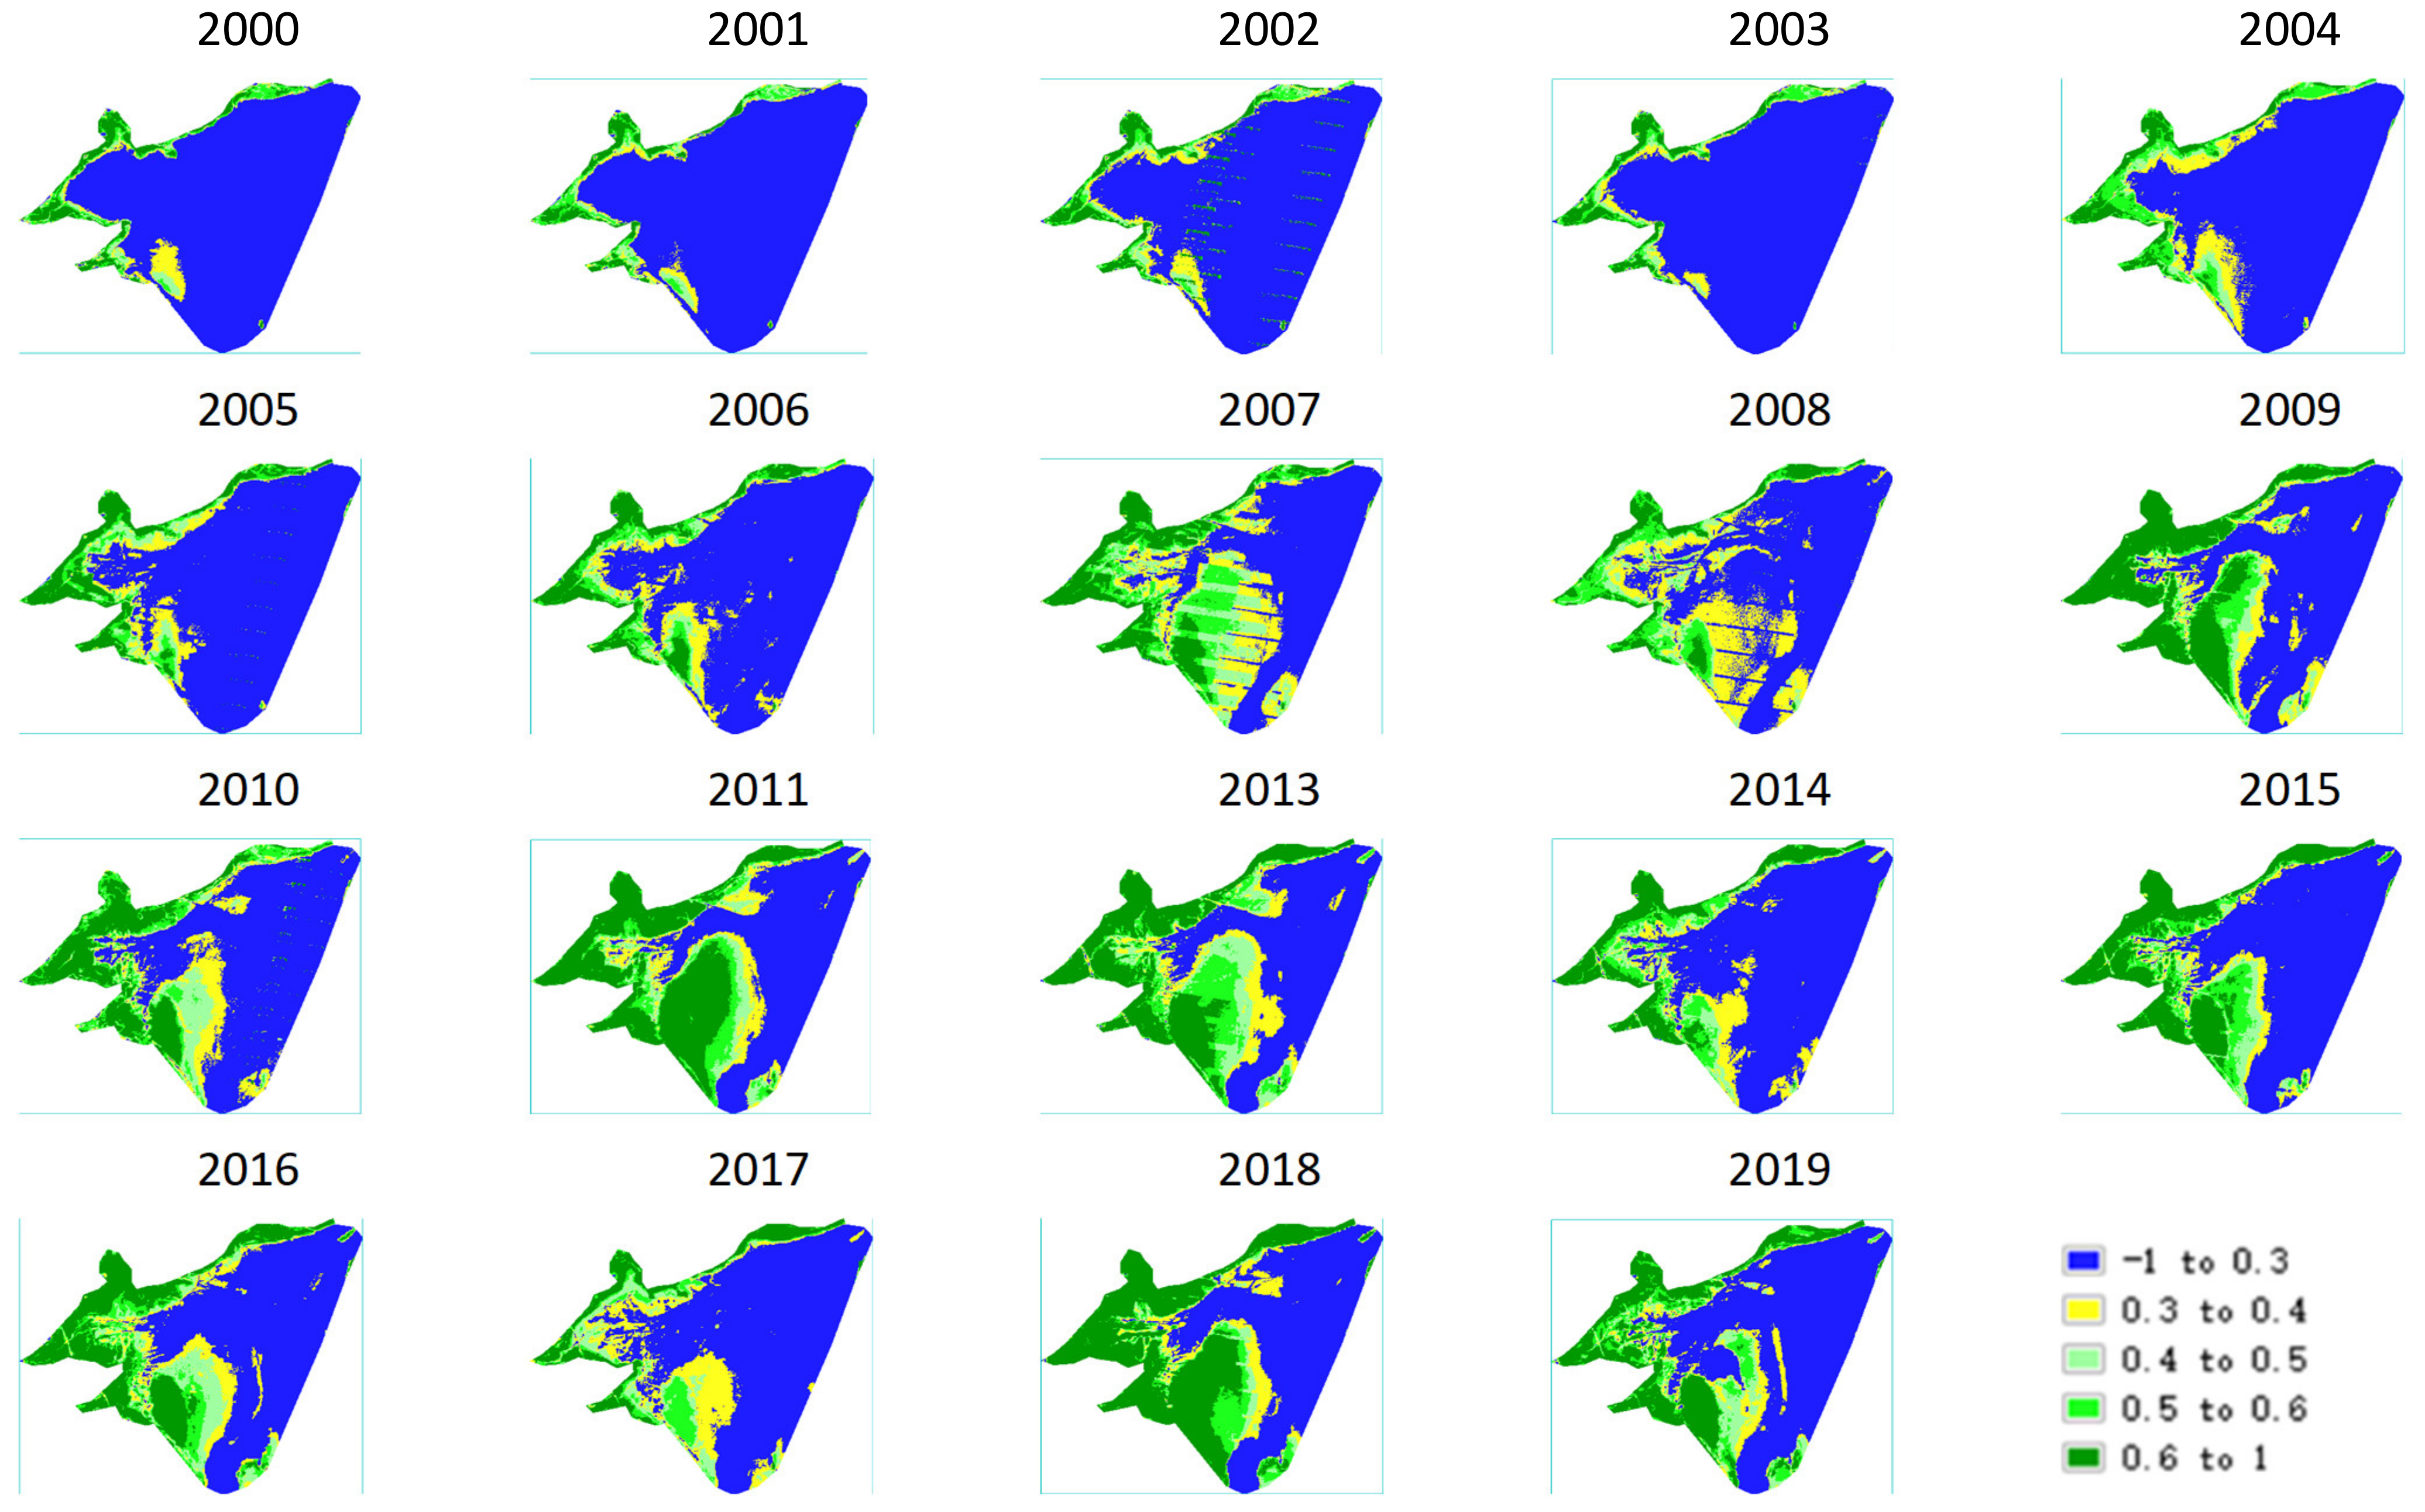
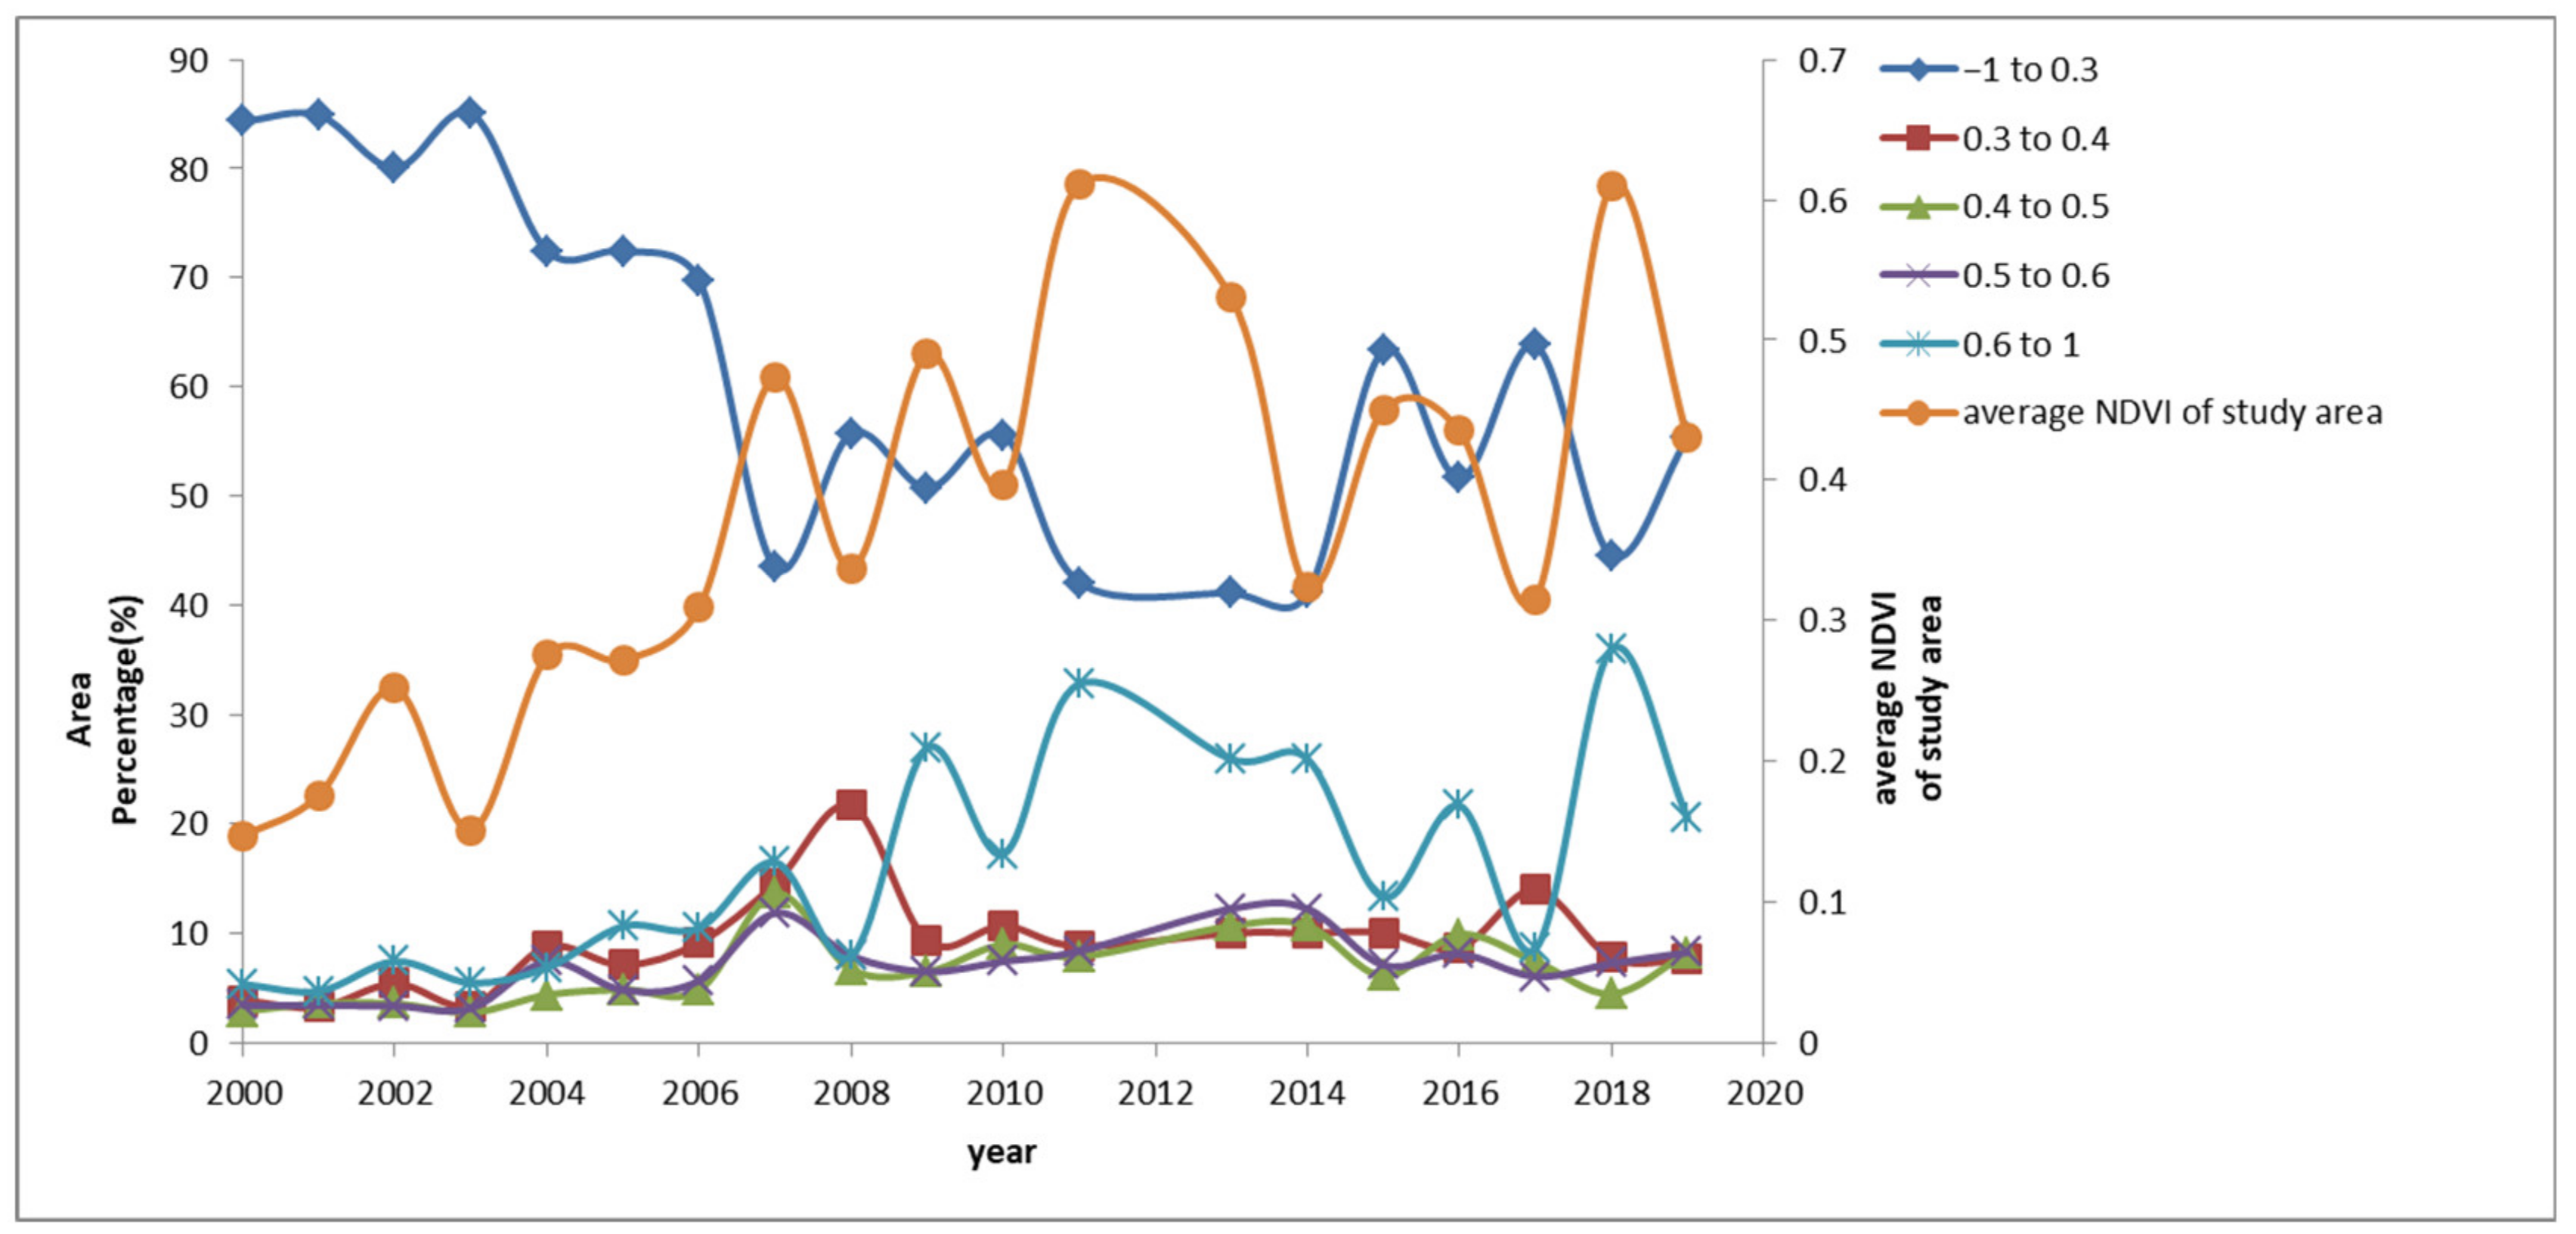
4.1. Spatial and Temporal Distribution Characteristics of NDVI

By using the regional NDVImax synthetic map from 2000 to 2019, the variation of NDVI in the study area for 20 years is clearly presented in the figure. It can be seen from Figure 4 that the variety of vegetation NDVI in the study area in 2000 and 2011 was substantial. Higher vegetation cover areas greater than 0.6 gradually expanded, and the regional NDVI after 2011 had its own increasing and decreasing trends in each year. This finding is related to the hydrological conditions in the pair of years. The wetland vegetation of Poyang Lake achieved diffuse growth in 2000 and 2011. The suitable stage of vegetation growth was completed in 2011. During these years, the proportion of the vegetation area in Poyang Lake expanded and the water area decreased.
It can be seen from Figure 5, the results of the maximum classification of NDVI, that 72% of the study area was unvegetated and 28% was vegetated, with NDVI values less than 0.3 in 2004. In addition, 9% of the study area was covered by low values of 0.3–0.4. The areas with values greater than 0.4 accounted for 19%. The area of 0.4–0.5 accounted for 4%, and the area of 0.5–0.6 accounted for 8%. The areas with higher vegetation cover greater than 0.6 accounted for 7%. Meanwhile, in 2004, 43% of the study area was unvegetated, with NDVI values less than 0.3. Areas with low values of 0.3–0.4 accounted for 8%, and those greater than 0.4 accounted for 8%. The areas with 0.4–0.5 also accounted for 8%. In addition, 8% of the areas had values of 0.5–0.6. The higher vegetation cover areas greater than 0.6 accounted for 33%. From 2004 to 2011, a change over the 8 years was found; most of the area evolved from no vegetation growth to vegetation cover.
The combination of Theil–Sen median trend analysis and Mann–Kendall test could effectively reflect the spatial distribution characteristics of NDVI trends in the study area basin from 2000 to 2010. The time was divided into two periods, 2000–2010 and 2010–2019, for the trial. Thus, this paper was based on the actual situation of SNDVI. SNDVI values between −0.0005 and 0.0005 were classified as stable and constant, areas with SNDVI values greater than or equal to 0.0005 were classified as improvement areas, and those with SNDVI values less than −0.0005 were classified as degraded areas. The results of the Mann–Kendall test at a 0.05 confidence level were classified as significant change (Z > 1.96 or Z < −1.96) and insignificant change (−1.96 ≤ Z ≤ 1.96). The graded results of the Theil–Sen median trend analysis and Mann–Kendall test were superimposed. The NDVI trend data were obtained at the image metric scale, and the results were classified into five types of changes (Table 1).
Figure 6 and Figure 7 show that the vegetation of a large proportion of the study area was significantly improved from 2000 to 2010. Few parts were stable and unchanged. The vegetation of the study area in these years is an evolving process from nothing to something, and the vegetation in most of the area significantly improved. In the 2010–2019 study, vegetation has grown in the study area for some years. The vegetation was only slightly improved in the later years. Few areas where the vegetation was slightly degraded were observed.

4.2. Flood Inundation Changes

Dummy color time composite images and mapping regional flood inundation were used to further study the spatial and temporal variation of lake wetland inundation. The spatial and temporal characteristics of vegetation change in the study area were combined. Study area 2, which changed significantly in the study area over 20 years, was separated. A geographical map of study area 2 and a monthly inundation map of this study area were created (Figure 8).
Study area 2 showed significant changes in land outcrops over 19 years. The main focus was on the changes in regional inundation in April, September, October, and November. Figure 9 shows that the area has been inundated since 2004, and most of the area was not inundated in April. The land outcropping in September, October, and November was earlier. This finding was consistent with the advance of the dry period in recent years in the previous studies of Poyang Lake. In particular, the Poyang Lake region experienced drought in 2006 and 2007. The region started to recede in September. In 2007, the region started to rise in June. Compared with other previous years, this was delayed by 1–2 months. The satellite images revealed the temporal and spatial changes of flood inundation in Poyang Lake.

4.3. Regression Tree Analysis

Analysis of the BestNDVI regression tree showed that the main variable separating the NDVI values was the mean water level in October. It can be seen from Figure 10, that when the October mean water level was greater than 14.467 m, the study area remained flooded in October, and the value of BestNDVI in the study area was approximately 0.3, indicating poor vegetation growth. When the average water level in October was less than 14.467 m, the elevation of the study area was higher than the water level value. After the receding of water in October, wetland vegetation exhibited autumn growth in the year and the vegetation in the study area grew more luxuriantly. Meanwhile, when the mean water level in October was less than 14.467 m, the NDVI value of vegetation was also closely associated with the rainfall and annual mean temperature.

4.4. Discussions

According to flood inundation results in the study area, the area was mostly in the non-inundated state in April 2004, and the emergence of beaches in September, October, and November was earlier. The dry period of Poyang Lake beaches was earlier, and the inundation time was shorter. In particular, the Poyang Lake area was dry in 2006 and 2007, and the area started to recede in September. In 2007, the area started to rise in June, which was delayed by 1–2 months compared with other years before. Once the freshwater wetlands became mud flats, the substrate dried out and the marsh vegetation was permanently lost. The long-term absence of water may irreversibly damage the resilience and adaptation of wetlands to water level changes, which may lead to permanent degradation or disappearance [90]. Combined with the results of previous studies, Poyang Lake’s flow was related not only to the rainfall in the basin, but also to the runoff in the basin and the flow of the Yangtze River [91,92]. Poyang Lake basin has been affected by intensive human activities, including reservoir construction and sand mining [93]. In 2007, the Poyang Lake basin had 9783 reservoirs. Most of these reservoirs were built before 1980s. They did not cause significant changes to the lake level after 2000. The sand dredging activity in Poyang Lake started in 2001, and it was banned in 2008 [94]. Sand mining may be one of the reasons for water level changes in Poyang Lake. The Three Gorges Dam changed the relationship between the Yangtze River and Poyang Lake and interferes with the hydrological process of the whole lake basin [95]. Operation of the Three Gorges Dam reduces the flow of the Yangtze River during the dry period, subsequently causing the water level of Poyang Lake to drop from late summer to autumn [94]. The Three Gorges Dam reduces flood risks in the lake basin, especially during the flood period of the Yangtze River from July to September [5,96]. Therefore, changes in inundation in the study area may be the effect of sand mining and Three Gorges Dam operation.
Water is an important component of wetland plants, with most wetland plants containing 80–90% of their fresh weight or even more [44,49,71]. Water is also the medium of all biochemical reactions in plants; carbon dioxide must be dissolved in water to penetrate into cells and participate in photosynthesis [97]. Organic substances, such as starch and protein, must be hydrolyzed to become simple compounds, such as sugar and amino acids, in plants for use in sprouting and growing [44]. Vegetation of the Poyang Lake wetland could adapt to changes in the hydrological rhythm of abundance and dryness, and the basic requirement of vegetative growth and development could be satisfied by a certain time of inundation; however, the vegetation growth could be inhibited if the inundation time is too long [44,49,97]. Given the unique landscape of “high water lake phase and low water river phase” in Poyang Lake wetland, the adaptability of wetland vegetation to flooding was the strongest in the study area, and it was distributed on the mudflats with 30–300 days of flooding, mainly because moss grass could pass through the unfavorable environment by dormancy under the flooding conditions [62,98,99]. In addition, moss grasses have slender stalks, and the biomass is concentrated on leaves and roots. Under flooding condition, the chlorophyll content of moss grass leaves decreases, respiration slows down, and nutrients are stored in roots; when the dry period comes, it could sprout and grow rapidly and form a large dominant community [56,70,99]. Facing the advancement of a dry period and shorter inundation time of Poyang Lake, the hydrological conditions suitable for the growth of wetland vegetation are formed in the study area [56,100,101]. Thus, the vegetation in the study area grew from nothing, especially after 2 drought years. Thus, the vegetation could spread and grow in a large area in Poyang Lake and reach the most abundant vegetation growth in 2011. Afterwards, the vegetation growth was affected by the hydrologic conditions and climate every year, and the vegetation growth changed slightly. Regression tree analysis showed how climate and hydrological variables affected the vegetation of lake wetlands, and the results showed that the main variables separating NDVI values were the mean water level in October, followed by rainfall in March and annual mean temperature. The change in river–lake relationships after 2003 led to the advance of a dry period in Poyang Lake by nearly 1 month and the general shortening of inundation time on the continental beach, which changed the community structure and spatial distribution of wetland vegetation. In accordance with the prediction of changes in the Yangtze River’s main current flushing and sanitation, the trend in Yangtze River main current flushing should be further intensified in the future. Such findings indicated that the arrival of the dry period of Poyang Lake may be more advanced, and the inundation time of the continental beach may be further shortened accordingly. In addition, the vegetation of the continental beach may spread to the area with lower elevation and longer inundation time through rhizome expansion to meet its own ecological demand, and the wetland may be degraded in a large area. Therefore, the main influencing variable that affected the NDVI value of the study area in the regression tree was the mean water level in October. When the mean water level in October was small, the shoals of the study area were exposed. After the water receded in October, the wetland vegetation of Poyang Lake exhibited autumn growth in the year. Thus, the vegetation in the study area grew more abundantly.

5. Conclusions

In this paper, the trends of vegetation in lake wetlands and the influencing variables most strongly associated with vegetation growth were analyzed by linking climatic and hydrological variables to NDVI. This study aimed to explore the long-term changes in the regional inundated area and determine the long-term trends in regional vegetation and the role of hydrology and climate.
Landsat satellite data were used to study the changes in inundation and long-term trends in vegetation in the Poyang Lake region after 2000 years. The beaches with newly emerged vegetation after 2000 were linked with hydrological and meteorological data by using a regression tree model. The role between the two was analyzed. In this area, most of the area has not been inundated in April since 2004, and the beach emergence was earlier in September, October, and November. The dry period of Poyang Lake beaches was earlier, and the inundation time became shorter. The water level of Poyang Lake is believed to have a great connection with human activities, including sand mining and the operation of the large-scale Three Gorges Dam hydraulic projects. In the face of the early dry period and a short inundation time of Poyang Lake, the hydrological conditions suitable for the growth of wetland Carex vegetation in the study area were formed. Therefore, the vegetation in the study area grew from nothing to something, especially after 2 dry years. Thus, the vegetation Carex spread and grew in Poyang Lake in a large area and reached the most abundant vegetation growth in 2011, after which the vegetation growth was affected by the hydrological conditions and climate every year, and the vegetation growth changed slightly.
The plant ecosystem of Poyang Lake wetland is complex in structure and extremely rich in biodiversity. The change of water level will significantly affect the primary productivity, species diversity and community structure of the wetland aquatic plant community. Additionally, in recent years, the low dry water level of Poyang Lake comes early. The water level decreases faster during the dry period, the flood level is not high and the frequency of flood decreases. Especially, the early arrival of low dry water level has caused some damage to the wetland plant ecosystem. Changes in wetland plant communities could have profound effects not only on ecosystem functions directly controlled by vegetation, but also on human ecosystem service values. They also provide a scientific basis for recognizing and understanding the evolution of seasonal lakes and wetlands and enriching and developing theory and methods of lake wetland ecohydrology. Poyang Lake wetland grassland is a habitat and feeding ground for rare wintering migratory birds during the dry season. Future work will focus on quantitative analyses of the relationship between the growth of wetland grassland vegetation and water level dynamics. Using multi-year vegetation index data and field survey data, we will analyze changes in the wetland grassland environment in terms of the growth status, species and biomass of grassland vegetation, and the area of exposed grassland during the dry season.

Author Contributions

Data curation, X.J., J.W. and J.D.; Formal analysis, X.J. and X.L.; Investigation, X.J.; Methodology, X.J., X.L. and J.D.; Resources, J.W.; Supervision, J.W. All authors have read and agreed to the published version of the manuscript.

Funding

This research was funded by National Natural Science Foundation of China (Grant/Award Numbers: 10802013), National Key Research and Development Program of China (Grant/Award Number: 2018YFC0407603, 2018YFC0407803), Fundamental Research Funds for Central Public Welfare Research Institutes (Grant/Award Number: CKSF2021438/HL, CKSF2021530/HL).

Conflicts of Interest

The authors declare no conflict of interest.

References

  1. Brinson, M.M.; Mitsch, W.J.; Gosselink, J.G. Wetlands, 4th ed.; John Wiley and Sons: Hoboken, NJ, USA, 2007; ISBN 9780471699675. [Google Scholar] [CrossRef]
  2. Teng, Z.; Fan, W.; Wang, H.; Cao, X.; Xu, X. Monitoring Soil Microorganisms with Community-Level Physiological Profiles Using Biolog EcoPlates™ in Chaohu Lakeside Wetland, East China. Eurasian Soil Sc. 2020, 53, 1142–1153. [Google Scholar] [CrossRef]
  3. Engel, S.; Pagiola, S.; Wunder, S. Designing payments for environmental services in theory and practice: An overview of the issues. Ecol. Econ. 2008, 65, 663–674. [Google Scholar] [CrossRef]
  4. Xu, X.; Jiang, B.; Tan, Y.; Costanza, R.; Yang, G. Lake-wetland ecosystem services modeling and valuation: Progress, gaps and future directions. Ecosyst. Serv. 2018, 33, 19–28. [Google Scholar] [CrossRef]
  5. Li, T.; Gao, X. Ecosystem Services Valuation of Lakeside Wetland Park beside Chaohu Lake in China. Water 2016, 8, 301. [Google Scholar] [CrossRef]
  6. Zhou, D.; Zhang, H.; Liu, C. Wetland ecohydrology and its challenges. Ecohydrol. Hydrobiol. 2016, 16, 26–32. [Google Scholar] [CrossRef]
  7. Hunter, R.G.; Faulkner, S.P.; Gibson, K.A. The importance of hydrology in restoration of bottomland hardwood wetland functions. Wetlands 2008, 28, 605–615. [Google Scholar] [CrossRef]
  8. Lingzhi, C. The Status of Terrestrial Ecosystems in China. Biodivers. Sci. 1993, 1, 19–22. [Google Scholar] [CrossRef]
  9. Pfadenhauer, J.S.; Klötzli, F.A. Temperate Azonal Vegetation. In Global Vegetation; Springer International Publishing: Berlin/Heidelberg, Germany, 2020. [Google Scholar]
  10. Wu, S.; Yin, Y.; Zhao, D.; Huang, M.; Shao, X.; Dai, E. Impact of future climate change on terrestrial ecosystems in China. Int. J. Climatol. 2009, 30, 866–873. [Google Scholar] [CrossRef]
  11. Mishra, V.; Cherkauer, K.A. Influence of cold season climate variability on lakes and wetlands in the Great Lakes region. J. Geophys. Res. 2011, 116. [Google Scholar] [CrossRef] [Green Version]
  12. Crawford, R.M.M. Eco-hydrology: Plants and Water in Terrestrial and Aquatic Environments. J. Ecol. 2000, 88, 1095–1097. [Google Scholar] [CrossRef]
  13. Peters, J.; Wieme, V.; Boeckx, P.; Samson, R.; Godoy, R.; Oyarzún, C.; Verhoest, N. Possibilities for ecohydrological monitoring in natural and managed ecosystems in southern chile. Gayana Botánica 2005, 62, 120–129. [Google Scholar] [CrossRef]
  14. Hoogeveen, Y. EURECA—Europe’s Ecosystems and Human Well-Being (2); SciVee, Inc.: Poway, CA, USA, 2009. [Google Scholar] [CrossRef]
  15. Sutton-Grier, A.E.; Sandifer, P.A. Conservation of Wetlands and other Coastal Ecosystems: A Commentary on their Value to Protect Biodiversity, Reduce Disaster Impacts, and Promote Human Health and Well-Being. Wetlands 2018, 39, 1295–1302. [Google Scholar] [CrossRef] [Green Version]
  16. Li, W.; Cui, L.; Sun, B.; Zhao, X.; Gao, C.; Zhang, Y.; Zhang, M.; Pan, X.; Lei, Y.; Ma, W. Distribution patterns of plant communities and their associations with environmental soil factors on the eastern shore of Lake Taihu, China. Ecosyst. Health Sustain. 2017, 3, 1385004. [Google Scholar] [CrossRef]
  17. Bakker, E.S.; Sarneel, J.M.; Gulati, R.D.; Liu, Z.; van Donk, E. Restoring macrophyte diversity in shallow temperate lakes: Biotic versus abiotic constraints. Hydrobiologia 2012, 710, 23–37. [Google Scholar] [CrossRef] [Green Version]
  18. Okruszko, T.; Duel, H.; Acreman, M.; Grygoruk, M.; Flörke, M.; Schneider, C. Broad-scale ecosystem services of European wetlands—Overview of the current situation and future perspectives under different climate and water management scenarios. Hydrol. Sci. J. 2011, 56, 1501–1517. [Google Scholar] [CrossRef]
  19. Clifford, C.; Heffernan, J. Artificial Aquatic Ecosystems. Water 2018, 10, 1096. [Google Scholar] [CrossRef] [Green Version]
  20. Raulings, E.J.; Morris, K.A.Y.; Roache, M.C.; Boon, P.I. The importance of water regimes operating at small spatial scales for the diversity and structure of wetland vegetation. Freshw. Biol. 2010, 55, 701–715. [Google Scholar] [CrossRef]
  21. Niemuth, N.D.; Wangler, B.; Reynolds, R.E. Spatial and Temporal Variation in Wet Area of Wetlands in the Prairie Pothole Region of North Dakota and South Dakota. Wetlands 2010, 30, 1053–1064. [Google Scholar] [CrossRef]
  22. Yang, L.; Wei, W.; Chen, L.; Mo, B. Response of deep soil moisture to land use and afforestation in the semi-arid Loess Plateau, China. J. Hydrol. 2012, 475, 111–122. [Google Scholar] [CrossRef]
  23. Correa-Araneda, F.J.; Urrutia, J.; Soto-Mora, Y.; Figueroa, R.; Hauenstein, E. Effects of the hydroperiod on the vegetative and community structure of freshwater forested wetlands, Chile. J. Freshw. Ecol. 2012, 27, 459–470. [Google Scholar] [CrossRef] [Green Version]
  24. Junk, W.J.; An, S.; Finlayson, C.M.; Gopal, B.; Květ, J.; Mitchell, S.A.; Mitsch, W.J.; Robarts, R.D. Current state of knowledge regarding the world’s wetlands and their future under global climate change: A synthesis. Aquat. Sci. 2012, 75, 151–167. [Google Scholar] [CrossRef] [Green Version]
  25. Guo, H.; Hu, Q.; Jiang, T. Annual and seasonal streamflow responses to climate and land-cover changes in the Poyang Lake basin, China. J. Hydrol. 2008, 355, 106–122. [Google Scholar] [CrossRef]
  26. Erwin, K.L. Wetlands and global climate change: The role of wetland restoration in a changing world. Wetl. Ecol. Manag. 2008, 17, 71–84. [Google Scholar] [CrossRef]
  27. Ozesmi, S.L.; Bauer, M.E. Satellite remote sensing of wetlands. Wetl. Ecol. Manag. 2002, 10, 381–402. [Google Scholar] [CrossRef]
  28. Smith, A.M.S.; Kolden, C.A.; Tinkham, W.T.; Talhelm, A.F.; Marshall, J.D.; Hudak, A.T.; Boschetti, L.; Falkowski, M.J.; Greenberg, J.A.; Anderson, J.W.; et al. Remote sensing the vulnerability of vegetation in natural terrestrial ecosystems. Remote Sens. Environ. 2014, 154, 322–337. [Google Scholar] [CrossRef]
  29. Goetz, S.J. Remote sensing of riparian buffers: Past progress and future prospects. J. Am. Water Resour. Assoc. 2006, 42, 133–143. [Google Scholar] [CrossRef]
  30. Lawley, V.; Lewis, M.; Clarke, K.; Ostendorf, B. Site-based and remote sensing methods for monitoring indicators of vegetation condition: An Australian review. Ecol. Indic. 2016, 60, 1273–1283. [Google Scholar] [CrossRef] [Green Version]
  31. Dawson, S.; Fisher, A.; Lucas, R.; Hutchinson, D.; Berney, P.; Keith, D.; Catford, J.; Kingsford, R. Remote Sensing Measures Restoration Successes, but Canopy Heights Lag in Restoring Floodplain Vegetation. Remote Sens. 2016, 8, 542. [Google Scholar] [CrossRef] [Green Version]
  32. Gutman, G.; Masek, J.G. Long-term time series of the Earth’s land-surface observations from space. Int. J. Remote Sens. 2012, 33, 4700–4719. [Google Scholar] [CrossRef]
  33. Kennedy, R.E.; Andréfouët, S.; Cohen, W.B.; Gómez, C.; Griffiths, P.; Hais, M.; Healey, S.P.; Helmer, E.H.; Hostert, P.; Lyons, M.B.; et al. Bringing an ecological view of change to Landsat-based remote sensing. Front. Ecol. Environ. 2014, 12, 339–346. [Google Scholar] [CrossRef]
  34. Gorelick, N.; Hancher, M.; Dixon, M.; Ilyushchenko, S.; Thau, D.; Moore, R. Google Earth Engine: Planetary-scale geospatial analysis for everyone. Remote Sens. Environ. 2017, 202, 18–27. [Google Scholar] [CrossRef]
  35. Hansen, M.C.; Potapov, P.V.; Moore, R.; Hancher, M.; Turubanova, S.A.; Tyukavina, A.; Thau, D.; Stehman, S.V.; Goetz, S.J.; Loveland, T.R.; et al. High-Resolution Global Maps of 21st-Century Forest Cover Change. Science 2013, 342, 850–853. [Google Scholar] [CrossRef] [PubMed] [Green Version]
  36. Kennedy, R.; Yang, Z.; Gorelick, N.; Braaten, J.; Cavalcante, L.; Cohen, W.; Healey, S. Implementation of the LandTrendr Algorithm on Google Earth Engine. Remote Sens. 2018, 10, 691. [Google Scholar] [CrossRef] [Green Version]
  37. Sun, Z.; Zhang, L.; Sun, W.; Jiang, H.; Mou, X.; Sun, W.; Song, H. China’s wetlands conservation: Achievements in the eleventh 5-year plan (2006–2010) and challenges in the twelfth 5-year plan (2011–2015). Environ. Eng. Manag. J. 2014, 13, 379–394. [Google Scholar] [CrossRef]
  38. Liu, W.; Liu, Y.; Mannaerts, C.M.; Wu, G. Monitoring variation of water turbidity and related environmental factors in Poyang Lake National Nature Reserve, China. In Proceedings of the Geoinformatics 2007: Geospatial Information Technology and Applications, Nanjing, China, 25–27 May 2007. [Google Scholar]
  39. Dong, Y. Background Information of Poyang Lake and Yangtze Finless Porpoises. In Contingent Valuation of Yangtze Finless Porpoises in Poyang Lake, China; Springer: Dordrecht, The Netherlands, 2012. [Google Scholar]
  40. Johnston, R.M.; Barson, M.M. Remote sensing of Australian wetlands: An evaluation of Landsat TM data for inventory and classification. Mar. Freshw. Res. 1993, 44, 235. [Google Scholar] [CrossRef]
  41. Gong, P.; Niu, Z.; Cheng, X.; Zhao, K.; Zhou, D.; Guo, J.; Liang, L.; Wang, X.; Li, D.; Huang, H.; et al. China’s wetland change (1990–2000) determined by remote sensing. Sci. China Earth Sci. 2010, 53, 1036–1042. [Google Scholar] [CrossRef]
  42. Crews, K. Landscape Dynamism. In Land Use Change; CRC Press: New York, NY, USA, 2007. [Google Scholar]
  43. de Boer, W.F.; Cao, L.; Barter, M.; Wang, X.; Sun, M.; van Oeveren, H.; de Leeuw, J.; Barzen, J.; Prins, H.H.T. Comparing the community composition of European and eastern Chinese waterbirds and the influence of human factors on the China waterbird community. Ambio 2011, 40, 68–77. [Google Scholar] [CrossRef] [Green Version]
  44. Chen, S.; Su, X.; Fang, L.; Chen, L. CarexDynamics as an Environmental Indicator in the Poyang Lake Wetland Area: Remote Sensing Mapping and GIS Analysis. Ann. GIS 2007, 13, 44–50. [Google Scholar] [CrossRef]
  45. Michishita, R.; Gong, P.; Xu, B. Spectral mixture analysis for bi-sensor wetland mapping using Landsat TM and Terra MODIS data. Int. J. Remote Sens. 2011, 33, 3373–3401. [Google Scholar] [CrossRef]
  46. Andreoni, F. Regional Resilience-Based Natural Resource Management Planning in Australia: The Namoi Catchment Experience. In Sustainable Development and Planning X; WIT Press: New Forest, UK, 2018. [Google Scholar]
  47. Zhao, X.; Stein, A.; Chen, X.-L. Monitoring the dynamics of wetland inundation by random sets on multi-temporal images. Remote Sens. Environ. 2011, 115, 2390–2401. [Google Scholar] [CrossRef]
  48. Feng, L.; Hu, C.; Chen, X.; Cai, X.; Tian, L.; Gan, W. Assessment of inundation changes of Poyang Lake using MODIS observations between 2000 and 2010. Remote Sens. Environ. 2012, 121, 80–92. [Google Scholar] [CrossRef]
  49. Wang, L.; Dronova, I.; Gong, P.; Yang, W.; Li, Y.; Liu, Q. A new time series vegetation–water index of phenological–hydrological trait across species and functional types for Poyang Lake wetland ecosystem. Remote Sens. Environ. 2012, 125, 49–63. [Google Scholar] [CrossRef]
  50. Barbosa, H.A.; Huete, A.R.; Baethgen, W.E. A 20-year study of NDVI variability over the Northeast Region of Brazil. J. Arid. Environ. 2006, 67, 288–307. [Google Scholar] [CrossRef]
  51. Gaughan, A.E.; Stevens, F.R.; Gibbes, C.; Southworth, J.; Binford, M.W. Linking vegetation response to seasonal precipitation in the Okavango–Kwando–Zambezi catchment of southern Africa. Int. J. Remote Sens. 2012, 33, 6783–6804. [Google Scholar] [CrossRef]
  52. Bulcock, H.H.; Jewitt, G.P.W. Spatial mapping of leaf area index using hyperspectral remote sensing for hydrological applications with a particular focus on canopy interception. Hydrol. Earth Syst. Sci. 2010, 14, 383–392. [Google Scholar] [CrossRef] [Green Version]
  53. Sims, N.C.; Colloff, M.J. Remote sensing of vegetation responses to flooding of a semi-arid floodplain: Implications for monitoring ecological effects of environmental flows. Ecol. Indic. 2012, 18, 387–391. [Google Scholar] [CrossRef]
  54. Ji, L.; Peters, A.J. Assessing vegetation response to drought in the northern Great Plains using vegetation and drought indices. Remote Sens. Environ. 2003, 87, 85–98. [Google Scholar] [CrossRef]
  55. Parsons, M.; Thoms, M.C. Patterns of vegetation greenness during flood, rain and dry resource states in a large, unconfined floodplain landscape. J. Arid. Environ. 2013, 88, 24–38. [Google Scholar] [CrossRef]
  56. Zhang, Q.; Ye, X.-C.; Werner, A.D.; Li, Y.-L.; Yao, J.; Li, X.-H.; Xu, C.-Y. An investigation of enhanced recessions in Poyang Lake: Comparison of Yangtze River and local catchment impacts. J. Hydrol. 2014, 517, 425–434. [Google Scholar] [CrossRef] [Green Version]
  57. Wang, Y.; Yu, X.; Li, W.; Xu, J.; Chen, Y.; Fan, N. Potential influence of water level changes on energy flows in a lake food web. Chin. Sci. Bull. 2011, 56, 2794–2802. [Google Scholar] [CrossRef] [Green Version]
  58. Liu, G.H.; Li, W.E.I.; Li, E.H.; Yuan, L.Y.; Davy, A.J. Landscape-scale variation in the seed banks of floodplain wetlands with contrasting hydrology in China. Freshw. Biol. 2006, 51, 1862–1878. [Google Scholar] [CrossRef]
  59. Li, Y.; Zhang, Q.; Cai, Y.; Tan, Z.; Wu, H.; Liu, X.; Yao, J. Hydrodynamic investigation of surface hydrological connectivity and its effects on the water quality of seasonal lakes: Insights from a complex floodplain setting (Poyang Lake, China). Sci. Total Environ. 2019, 660, 245–259. [Google Scholar] [CrossRef]
  60. Andreoli, R.; Yesou, H.; Li, J.; Desnos, Y.L. Inland lake monitoring using low and medium resolution ENVISAT ASAR and optical data: Case study of Poyang Lake (Jiangxi, P.R. China). In In Proceedings of the 2007 IEEE International Geoscience and Remote Sensing Symposium, Barcelona, Spain, 23–28 July 2007. [Google Scholar]
  61. Chen, H.; Lin, D. The prevalence and control of schistosomiasis in Poyang Lake region, China. Parasitol. Int. 2004, 53, 115–125. [Google Scholar] [CrossRef]
  62. Sang, H.; Zhang, J.; Lin, H.; Zhai, L. Multi-Polarization ASAR Backscattering from Herbaceous Wetlands in Poyang Lake Region, China. Remote Sens. 2014, 6, 4621–4646. [Google Scholar] [CrossRef] [Green Version]
  63. Feng, L.; Hu, C.; Chen, X.; Zhao, X. Dramatic Inundation Changes of China’s Two Largest Freshwater Lakes Linked to the Three Gorges Dam. Environ. Sci. Technol. 2013, 47, 9628–9634. [Google Scholar] [CrossRef]
  64. Zhang, L.; Yin, J.; Jiang, Y.; Wang, H. Relationship between the hydrological conditions and the distribution of vegetation communities within the Poyang Lake National Nature Reserve, China. Ecol. Inform. 2012, 11, 65–75. [Google Scholar] [CrossRef]
  65. Tan, Z.; Jiang, J. Spatial–Temporal Dynamics of Wetland Vegetation Related to Water Level Fluctuations in Poyang Lake, China. Water 2016, 8, 397. [Google Scholar] [CrossRef] [Green Version]
  66. Fan, H.; Xu, L.; Wang, X.; Jiang, J.; Feng, W.; You, H. Relationship Between Vegetation Community Distribution Patterns and Environmental Factors in Typical Wetlands of Poyang Lake, China. Wetlands 2017, 39, 75–87. [Google Scholar] [CrossRef]
  67. Zhang, Y.; Yang, G.; Li, B.; Cai, Y.; Chen, Y. Using eutrophication and ecological indicators to assess ecosystem condition in Poyang Lake, a Yangtze-connected lake. Aquat. Ecosyst. Health Manag. 2016, 19, 29–39. [Google Scholar] [CrossRef]
  68. Gao, J.H.; Jia, J.; Kettner, A.J.; Xing, F.; Wang, Y.P.; Xu, X.N.; Yang, Y.; Zou, X.Q.; Gao, S.; Qi, S.; et al. Changes in water and sediment exchange between the Changjiang River and Poyang Lake under natural and anthropogenic conditions, China. Sci. Total. Environ. 2014, 481, 542–553. [Google Scholar] [CrossRef] [PubMed]
  69. Feng, L.; Hu, C.; Chen, X. Satellites Capture the Drought Severity Around China’s Largest Freshwater Lake. IEEE J. Sel. Top. Appl. Earth Obs. Remote Sens. 2012, 5, 1266–1271. [Google Scholar] [CrossRef]
  70. Guo, H.; Hu, Q.; Zhang, Q.; Feng, S. Effects of the Three Gorges Dam on Yangtze River flow and river interaction with Poyang Lake, China: 2003–2008. J. Hydrol. 2012, 416–417, 19–27. [Google Scholar] [CrossRef]
  71. Dai, X.; Wan, R.; Yang, G. Non-stationary water-level fluctuation in China’s Poyang Lake and its interactions with Yangtze River. J. Geogr. Sci. 2015, 25, 274–288. [Google Scholar] [CrossRef] [Green Version]
  72. Su, Y.; Wang, D.; Zhao, S.; Shi, J.; Shi, Y.; Wei, D. Examining long-term natural vegetation dynamics in the Aral Sea Basin applying the linear spectral mixture model. PeerJ 2021, 9, e10747. [Google Scholar] [CrossRef]
  73. Wang, J.; Meng, J.J.; Cai, Y.L. Assessing vegetation dynamics impacted by climate change in the southwestern karst region of China with AVHRR NDVI and AVHRR NPP time-series. Environ. Geol. 2007, 54, 1185–1195. [Google Scholar] [CrossRef]
  74. Otto, M.; Scherer, D.; Richters, J. Hydrological differentiation and spatial distribution of high altitude wetlands in a semi-arid Andean region derived from satellite data. Hydrol. Earth Syst. Sci. 2011, 15, 1713–1727. [Google Scholar] [CrossRef] [Green Version]
  75. Cho, M.A.; Skidmore, A.; Corsi, F.; van Wieren, S.E.; Sobhan, I. Estimation of green grass/herb biomass from airborne hyperspectral imagery using spectral indices and partial least squares regression. Int. J. Appl. Earth Obs. Geoinf. 2007, 9, 414–424. [Google Scholar] [CrossRef]
  76. Zuzulova, V.; Vido, J. Normalized difference vegetation index as a tool for the evaluation of agricultural drought in Slovakia. Ecocycles 2018, 4, 83–87. [Google Scholar] [CrossRef]
  77. Hansen, P.M.; Schjoerring, J.K. Reflectance measurement of canopy biomass and nitrogen status in wheat crops using normalized difference vegetation indices and partial least squares regression. Remote Sens. Environ. 2003, 86, 542–553. [Google Scholar] [CrossRef]
  78. Trianni, G.; Lisini, G.; Angiuli, E.; Moreno, E.A.; Dondi, P.; Gaggia, A.; Gamba, P. Scaling up to National/Regional Urban Extent Mapping Using Landsat Data. IEEE J. Sel. Top. Appl. Earth Obs. Remote Sens. 2015, 8, 3710–3719. [Google Scholar] [CrossRef]
  79. Maxwell, S.K.; Sylvester, K.M. Identification of “ever-cropped” land (1984–2010) using Landsat annual maximum NDVI image composites: Southwestern Kansas case study. Remote Sens. Environ. 2012, 121, 186–195. [Google Scholar] [CrossRef] [Green Version]
  80. Fitton, J.M.; Rennie, A.F.; Hansom, J.D.; Muir, F.M.E. Remotely sensed mapping of the intertidal zone: A Sentinel-2 and Google Earth Engine methodology. Remote Sens. Appl. Soc. Environ. 2021, 22, 100499. [Google Scholar] [CrossRef]
  81. Boothroyd, R.J.; Williams, R.D.; Hoey, T.B.; Tolentino, P.L.M.; Yang, X. National-scale assessment of decadal river migration at critical bridge infrastructure in the Philippines. Sci. Total Environ. 2021, 768, 144460. [Google Scholar] [CrossRef]
  82. Boothroyd, R.J.; Williams, R.D.; Hoey, T.B.; Barrett, B.; Prasojo, O.A. Applications of Google Earth Engine in fluvial geomorphology for detecting river channel change. WIREs Water 2020, 8, e21496. [Google Scholar] [CrossRef]
  83. Legleiter, C.J.; Fonstad, M.A. An Introduction to the Physical Basis for Deriving River Information by Optical Remote Sensing. In Fluvial Remote Sensing for Science and Management; John Wiley & Sons, Ltd.: Hoboken, NJ, USA, 2012. [Google Scholar]
  84. Jiang, W.; Yuan, L.; Wang, W.; Cao, R.; Zhang, Y.; Shen, W. Spatio-temporal analysis of vegetation variation in the Yellow River Basin. Ecol. Indic. 2015, 51, 117–126. [Google Scholar] [CrossRef]
  85. Zhu, B.; Liao, J.; Shen, G. Combining time series and land cover data for analyzing spatio-temporal changes in mangrove forests: A case study of Qinglangang Nature Reserve, Hainan, China. Ecol. Indic. 2021, 131, 108135. [Google Scholar] [CrossRef]
  86. Neeti, N.; Eastman, J.R. A Contextual Mann-Kendall Approach for the Assessment of Trend Significance in Image Time Series. Trans. GIS 2011, 15, 599–611. [Google Scholar] [CrossRef]
  87. Tošić, I. Spatial and temporal variability of winter and summer precipitation over Serbia and Montenegro. Theor. Appl. Climatol. 2004, 77, 47–56. [Google Scholar] [CrossRef]
  88. De’ath, G.; Fabricius, K.E. Classification and regression trees: A powerful yet simple technique for ecological data analysis. Ecology 2000, 81, 3178–3192. [Google Scholar] [CrossRef]
  89. Hothorn, T.; Hornik, K.; Zeileis, A. Unbiased Recursive Partitioning: A Conditional Inference Framework. J. Comput. Graph. Stat. 2006, 15, 651–674. [Google Scholar] [CrossRef] [Green Version]
  90. Tan, Z.; Chen, P.; Zhang, Q.; Jiang, J. Vegetation Changes in T H e Poyang Lake Wetland Linked to the Three Gorges Dam: An Assessment Based on Moderate Resolution Imaging Spectroradiometer (MODIS) Observations from 2000 to 2012. Wetlands 2019, 39, 151–163. [Google Scholar] [CrossRef]
  91. Zhang, Q.; Li, L.; Wang, Y.G.; Werner, A.D.; Xin, P.; Jiang, T.; Barry, D.A. Has the Three-Gorges Dam made the Poyang Lake wetlands wetter and drier? Geophys. Res. Lett. 2012, 39, L20402. [Google Scholar] [CrossRef] [Green Version]
  92. Li, N.; Wang, L.; Zeng, C.; Wang, D.; Liu, D.; Wu, X. Variations of Runoff and Sediment Load in the Middle and Lower Reaches of the Yangtze River, China (1950–2013). PLoS ONE 2016, 11, e0160154. [Google Scholar] [CrossRef] [PubMed]
  93. de Leeuw, J.; Shankman, D.; Wu, G.; de Boer, W.F.; Burnham, J.; He, Q.; Yesou, H.; Xiao, J. Strategic assessment of the magnitude and impacts of sand mining in Poyang Lake, China. Reg. Environ. Chang. 2009, 10, 95–102. [Google Scholar] [CrossRef]
  94. Mei, X.; Dai, Z.; Du, J.; Chen, J. Linkage between Three Gorges Dam impacts and the dramatic recessions in China’s largest freshwater lake, Poyang Lake. Sci. Rep. 2015, 5, 18197. [Google Scholar] [CrossRef] [Green Version]
  95. Dai, Z.; Liu, J.T. Impacts of large dams on downstream fluvial sedimentation: An example of the Three Gorges Dam (TGD) on the Changjiang (Yangtze River). J. Hydrol. 2013, 480, 10–18. [Google Scholar] [CrossRef]
  96. Hu, Q.; Feng, S.; Guo, H.; Chen, G.; Jiang, T. Interactions of the Yangtze river flow and hydrologic processes of the Poyang Lake, China. J. Hydrol. 2007, 347, 90–100. [Google Scholar] [CrossRef]
  97. Dronova, I.; Gong, P.; Clinton, N.E.; Wang, L.; Fu, W.; Qi, S.; Liu, Y. Landscape analysis of wetland plant functional types: The effects of image segmentation scale, vegetation classes and classification methods. Remote Sens. Environ. 2012, 127, 357–369. [Google Scholar] [CrossRef]
  98. Wu, G.; Liu, Y. Satellite-based detection of water surface variation in China’s largest freshwater lake in response to hydro-climatic drought. Int. J. Remote Sens. 2014, 35, 4544–4558. [Google Scholar] [CrossRef]
  99. Wang, H.-Z.; Xu, Q.-Q.; Cui, Y.-D.; Liang, Y.-L. Macrozoobenthic community of Poyang Lake, the largest freshwater lake of China, in the Yangtze floodplain. Limnology 2007, 8, 65–71. [Google Scholar] [CrossRef]
  100. Hu, Q.; Wu, Q.; Yao, B.; Xu, X. Ecosystem respiration and its components from a Carex meadow of Poyang Lake during the drawdown period. Atmos. Environ. 2015, 100, 124–132. [Google Scholar] [CrossRef]
  101. Wan, R.; Wang, P.; Wang, X.; Yao, X.; Dai, X. Mapping Aboveground Biomass of Four Typical Vegetation Types in the Poyang Lake Wetlands Based on Random Forest Modelling and Landsat Images. Front. Plant Sci. 2019, 10, 1281. [Google Scholar] [CrossRef]
Figure 1. Geographical location map of the study area.
Water 14 00008 g001
Figure 2. Flow chart of this study.
Water 14 00008 g002
Figure 3. GEE workflow for identifying changes in wetland.
Water 14 00008 g003
Figure 4. Vegetation classification map of the study area from 2000 to 2019.
Water 14 00008 g004
Figure 5. Area percentage of classified NDVI and regional average NDVI.
Water 14 00008 g005
Figure 6. Trends in annual average NDVI in the study area from 2000 to 2010.
Water 14 00008 g006
Figure 7. Trends of annual average NDVI in the study area from 2010 to 2019.
Water 14 00008 g007
Figure 8. Monthly inundation variation map of study area 2. (Description: Water 14 00008 i001 Regional non-inundation, Water 14 00008 i002 Regional inundation).
Water 14 00008 g008
Figure 9. Geographical location map of study area 2.
Water 14 00008 g009
Figure 10. Regression tree showing classification of BestNDVI.
Water 14 00008 g010
Table 1. Statistics on NDVI trends.
SNDVIValueTrend of NDVIPercentage
(2000–2010)
Percentage (2010–2019)
≥0.0005≥−1.96Significant increase718
≥0.0005−1.96 to 1.96Slight increase745
−0.0005 to 0.0005−1.96 to 1.96Constant2122
<−0.0005−1.96 to 1.96Slight decrease120
<−0.0005<−1.96Significant decrease05
Publisher’s Note: MDPI stays neutral with regard to jurisdictional claims in published maps and institutional affiliations.

