Article

Nitrate Removal and Woodchip Properties across a Paired Denitrifying Bioreactor Treating Centralized Agricultural Ditch Flows

1
Department of Crop Sciences, University of Illinois Urbana-Champaign, AW-101 Turner Hall, MC-046, 1102 South Goodwin Avenue, Urbana, IL 61801-4730, USA
2
Department of Agricultural and Biological Engineering, University of Illinois Urbana-Champaign, Urbana, IL 61801-4713, USA
3
Department of Civil and Environmental Engineering, University of Illinois Urbana-Champaign, Urbana, IL 61801-2350, USA
*
Author to whom correspondence should be addressed.
Water 2022, 14(1), 56; https://doi.org/10.3390/w14010056
Submission received: 2 December 2021 / Revised: 20 December 2021 / Accepted: 23 December 2021 / Published: 28 December 2021
(This article belongs to the Section Water, Agriculture and Aquaculture)

Abstract

:
Treatment of nitrate loads by denitrifying bioreactors in centralized drainage ditches that receive subsurface tile drainage may offer a more effective alternative to end-of-pipe bioreactors. A paired denitrifying bioreactor design, consisting of an in-ditch bioreactor (18.3 × 2.1 × 0.2 m) treating ditch base flow and a diversion bioreactor (4.6 × 9.1 × 0.9 m) designed to treat high-flow events, was designed and constructed in an agricultural watershed (3.2 km2 drainage area) in Illinois, USA. Flow and water chemistry were monitored for three years and the woodchip and bioreactor-associated soil were analyzed for denitrification potential and chemical properties after 25 months. The in-ditch bioreactor did not significantly reduce nitrate concentrations in the ditch, likely due to low hydraulic connectivity with stream water and sedimentation. The diversion bioreactor significantly reduced nitrate concentrations (58% average reduction) but treated only ~2% of annual ditch flow. Denitrification potential was significantly higher in the in-ditch bioreactor woodchips versus the diversion bioreactor after 25 months (2950 ± 580 vs. 620 ± 310 ng N g−1 dry media h−1). The passive flow design was simple to construct and did not restrict flow in the drainage ditch but resulted in low hydraulic exchange, limiting nitrate removal.

Graphical Abstract

1. Introduction

Wood-based denitrification has been demonstrated to be an effective method for nitrate reduction in a variety of applications (e.g., subsurface drainage, aquaculture, and brine denitrification) at a wide range of nitrate loading rates [1,2,3]. Denitrifying woodchip bioreactors reduce nitrate loads in subsurface agricultural drainage (“tile drainage”) using enhanced denitrification [1]. Enhanced denitrification in woodchip bioreactors is achieved by providing a carbon substrate (i.e., woodchips) as a feed source for denitrifying bacteria. Nutrient reduction strategies for several U.S. states include denitrifying bioreactors for treating agricultural drainage. The large number of individual tile drainage outlets across the U.S. Midwest region, combined with a lack of knowledge of location or layout of tile pipes, presents challenges for successfully scaling the implementation of end-of-pipe bioreactors [4]. Subsurface drained fields are often connected by large drainage ditches, and centralized treatment of nitrate in these ditches could improve the economy of scale compared to conventional end-of-pipe bioreactors.
The first in-ditch woodchip bioreactor widely reported in the literature provided a 78% reduction in mean nitrate concentration [4]. This design included an infiltration galley and adjustable outlet pipe with woodchips trenched below stream grade. Later designs have included wooden berms [5] or woodchips encased in plastic mesh or wire in a ditch or stream [6,7]. Source of wood used in bioreactors has not been shown to substantially affect nitrate removal performance [8]. Ease of construction and minimized cost have often been aims of these “reactive ditches” [6]. Costs for simple in-ditch bioreactors have been relatively inexpensive (Pfannerstil et al.: €2000; Chase et al.: $500) [6,7], although more complicated designs can increase costs (Christianson et al.: $18,000, Sarris and Burbery: >$8000) [5,9].
Routing ditch flow to a conventional bioreactor adjacent to a ditch is another option for scalability of the technology. The United States Department of Agriculture Natural Resources Conservation Service (USDA NRCS) has standardized the design of denitrifying bioreactors with Conservation Practice Standard Code 605 [10]. While this practice standard was intended primarily for treating subsurface tile drainage, it generally applies to any location with a need to reduce nitrate concentrations. Routing ditch flow to a bioreactor outside of the channel would provide more flexibility to implement bioreactors, and research on this type of system could help enrich the design standard. For example, one such “ditch diversion bioreactor” (35 × 7.9 × 0.9 m, length × width × depth) in Maryland was designed to the NRCS practice standard and treated roughly one-third of ditch flow [5]. The nitrogen (N) load was reduced by 25% over 295 d which was consistent with design standard expectations.
Applying a bioreactor design standard to either in-ditch or ditch diversion bioreactors may require design modifications to accommodate the unique water quality and flow characteristics of ditch drainage. Drainage ditches in tile-drained areas tend to have lower nitrate concentrations than water coming directly from subsurface tile drainage due to relatively lower nitrate concentrations in surface runoff or seepage [11] as well as in-ditch nitrate processing [12]. Ditch and stream flows are also different from tile drainage in their relatively higher sediment loads. In terms of flow, centralized ditches collecting drainage from larger catchments may have more consistent flow throughout the year when compared to the tile outlet from a single field. In-ditch bioreactors may be limited by the need to avoid restricting flow rates in the drainage ditch to maintain adequate conveyance.
The objectives of this study were to design and evaluate a paired bioreactor configuration consisting of an in-ditch bioreactor treating ditch base flow and a diversion bioreactor designed to treat high-flow events. The three major design objectives were to (1) maximize hydraulic loading across the paired design, (2) avoid restricting the flow capacity of the drainage ditch, and (3) develop a straightforward “farmer-friendly” construction process. It was hypothesized that differences in woodchip properties (microbial and physiochemical) over time and nitrate removal performance would be affected by the relative hydraulic loading of either component of the paired design. Both observed and potential nitrate removal were assessed using flow/water chemistry monitoring and denitrification potential assays, respectively.

2. Materials and Methods

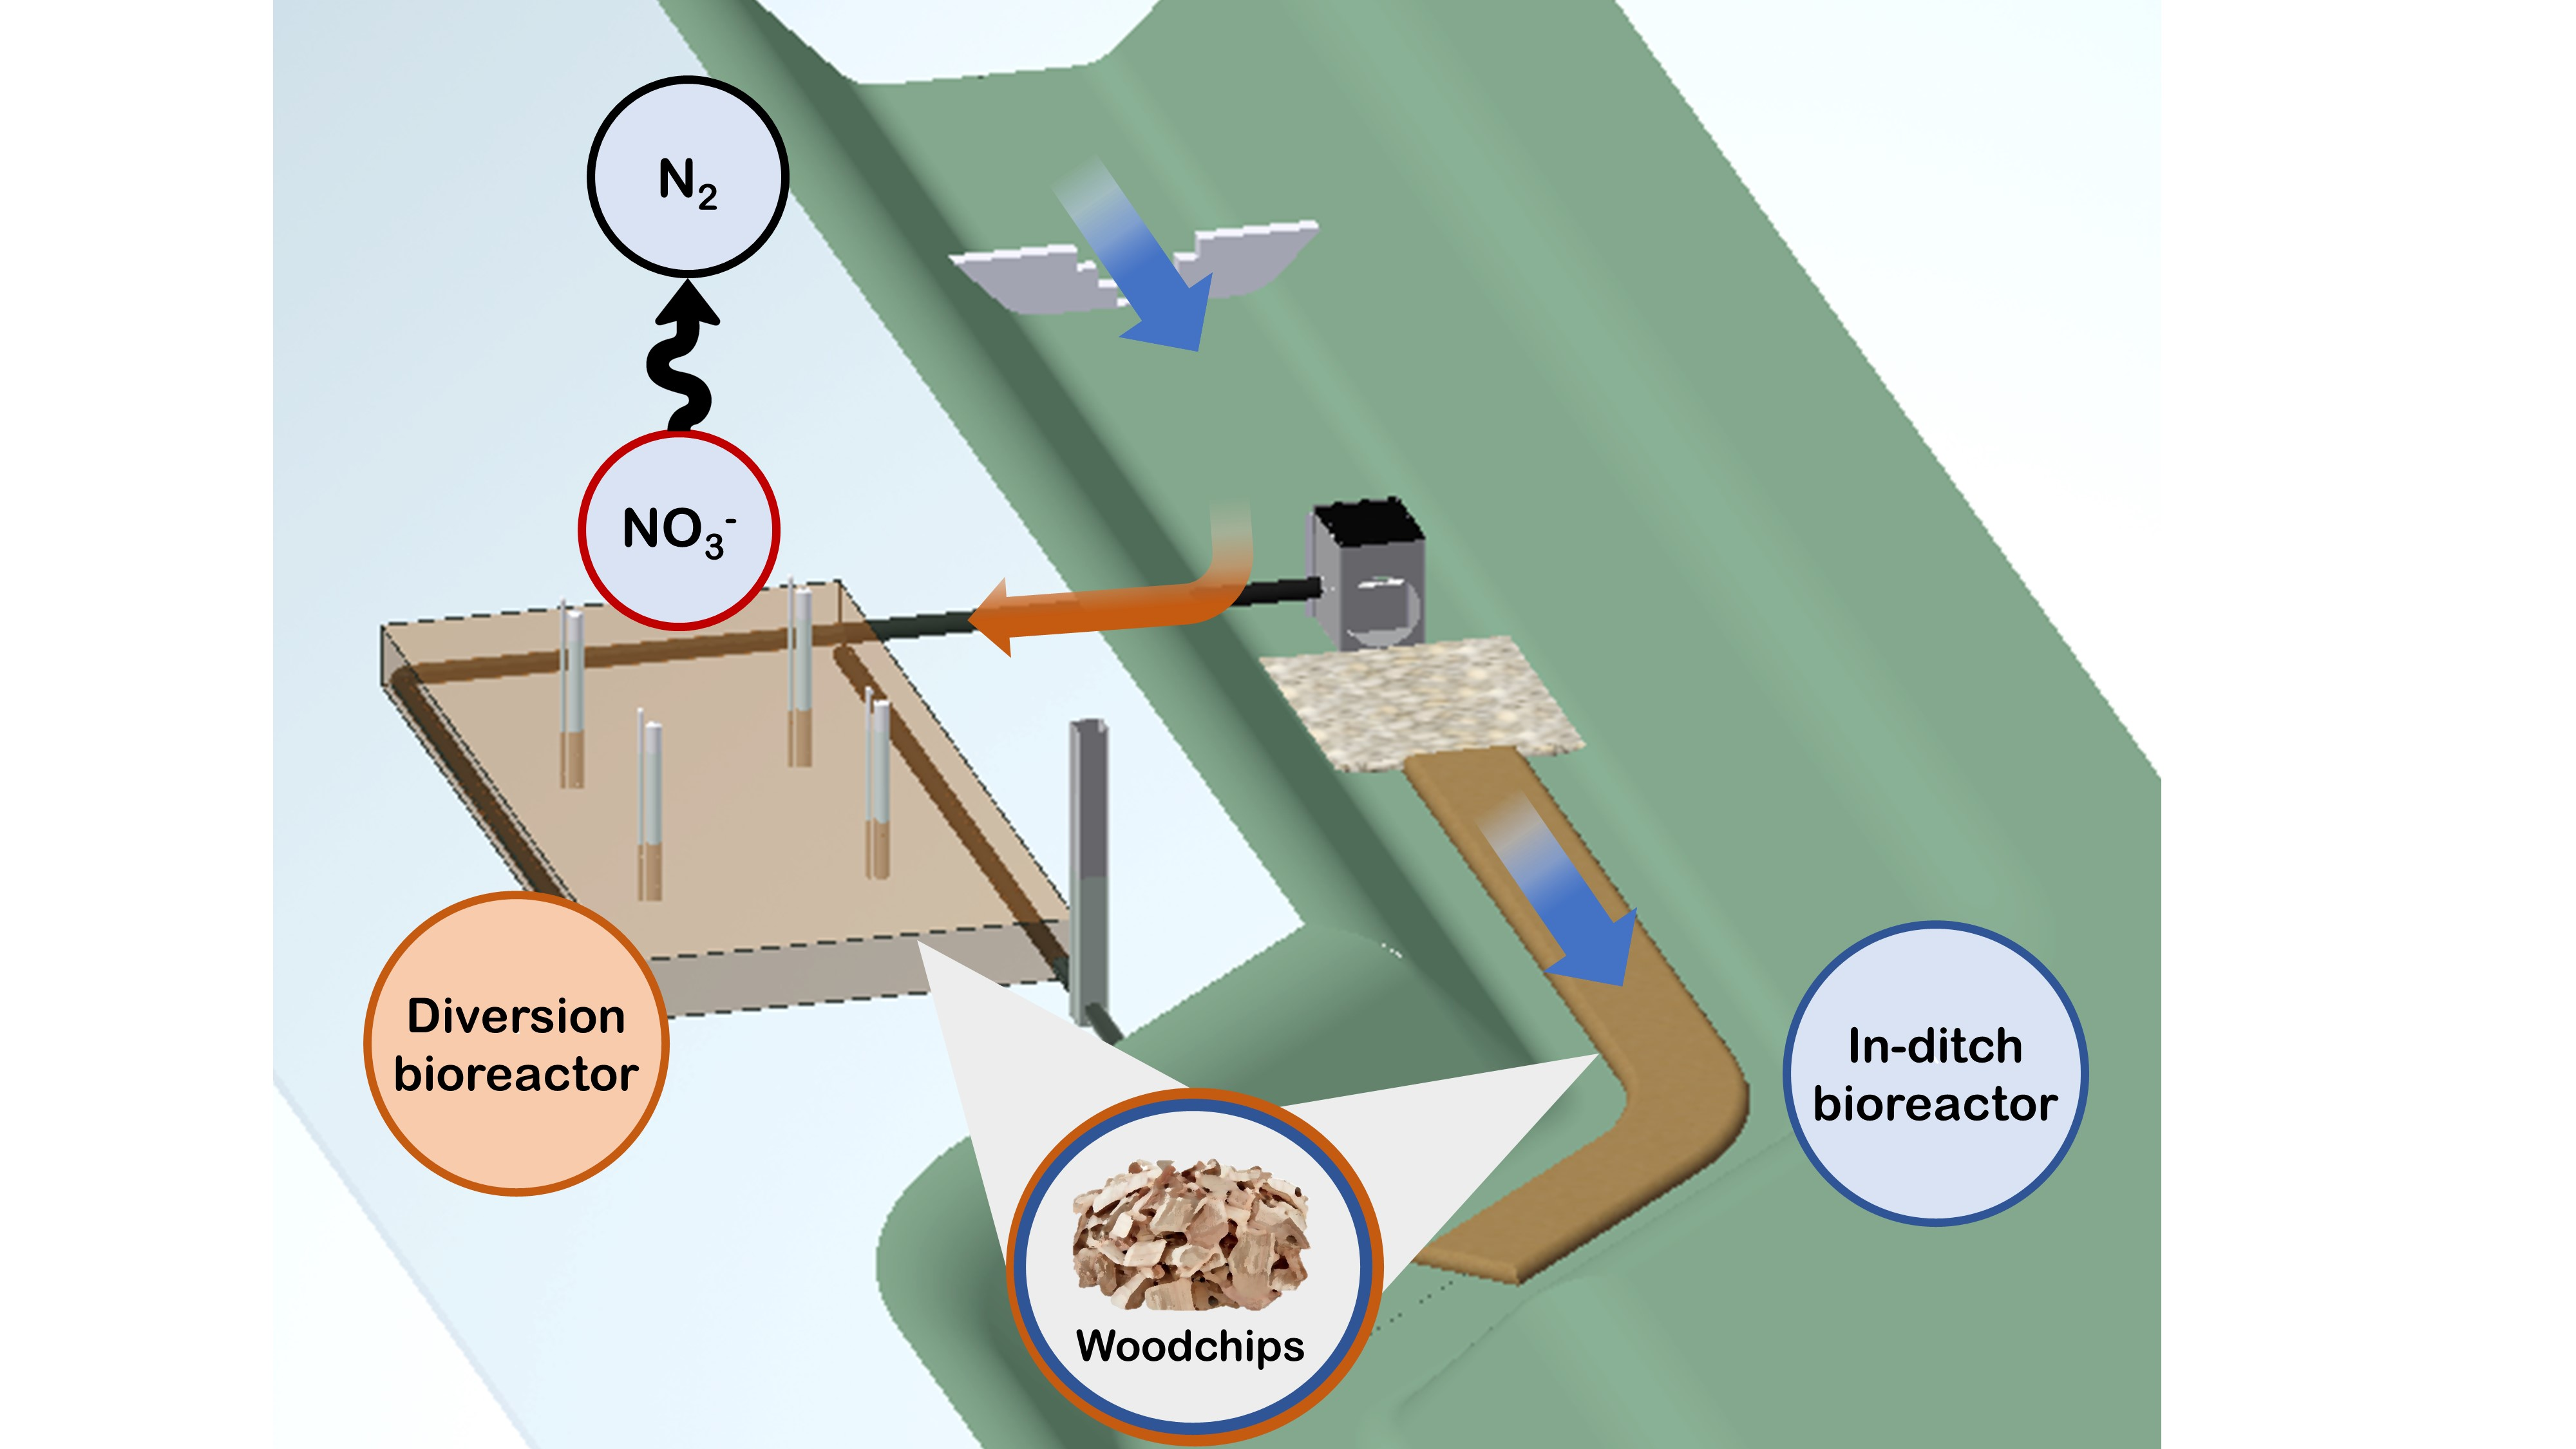
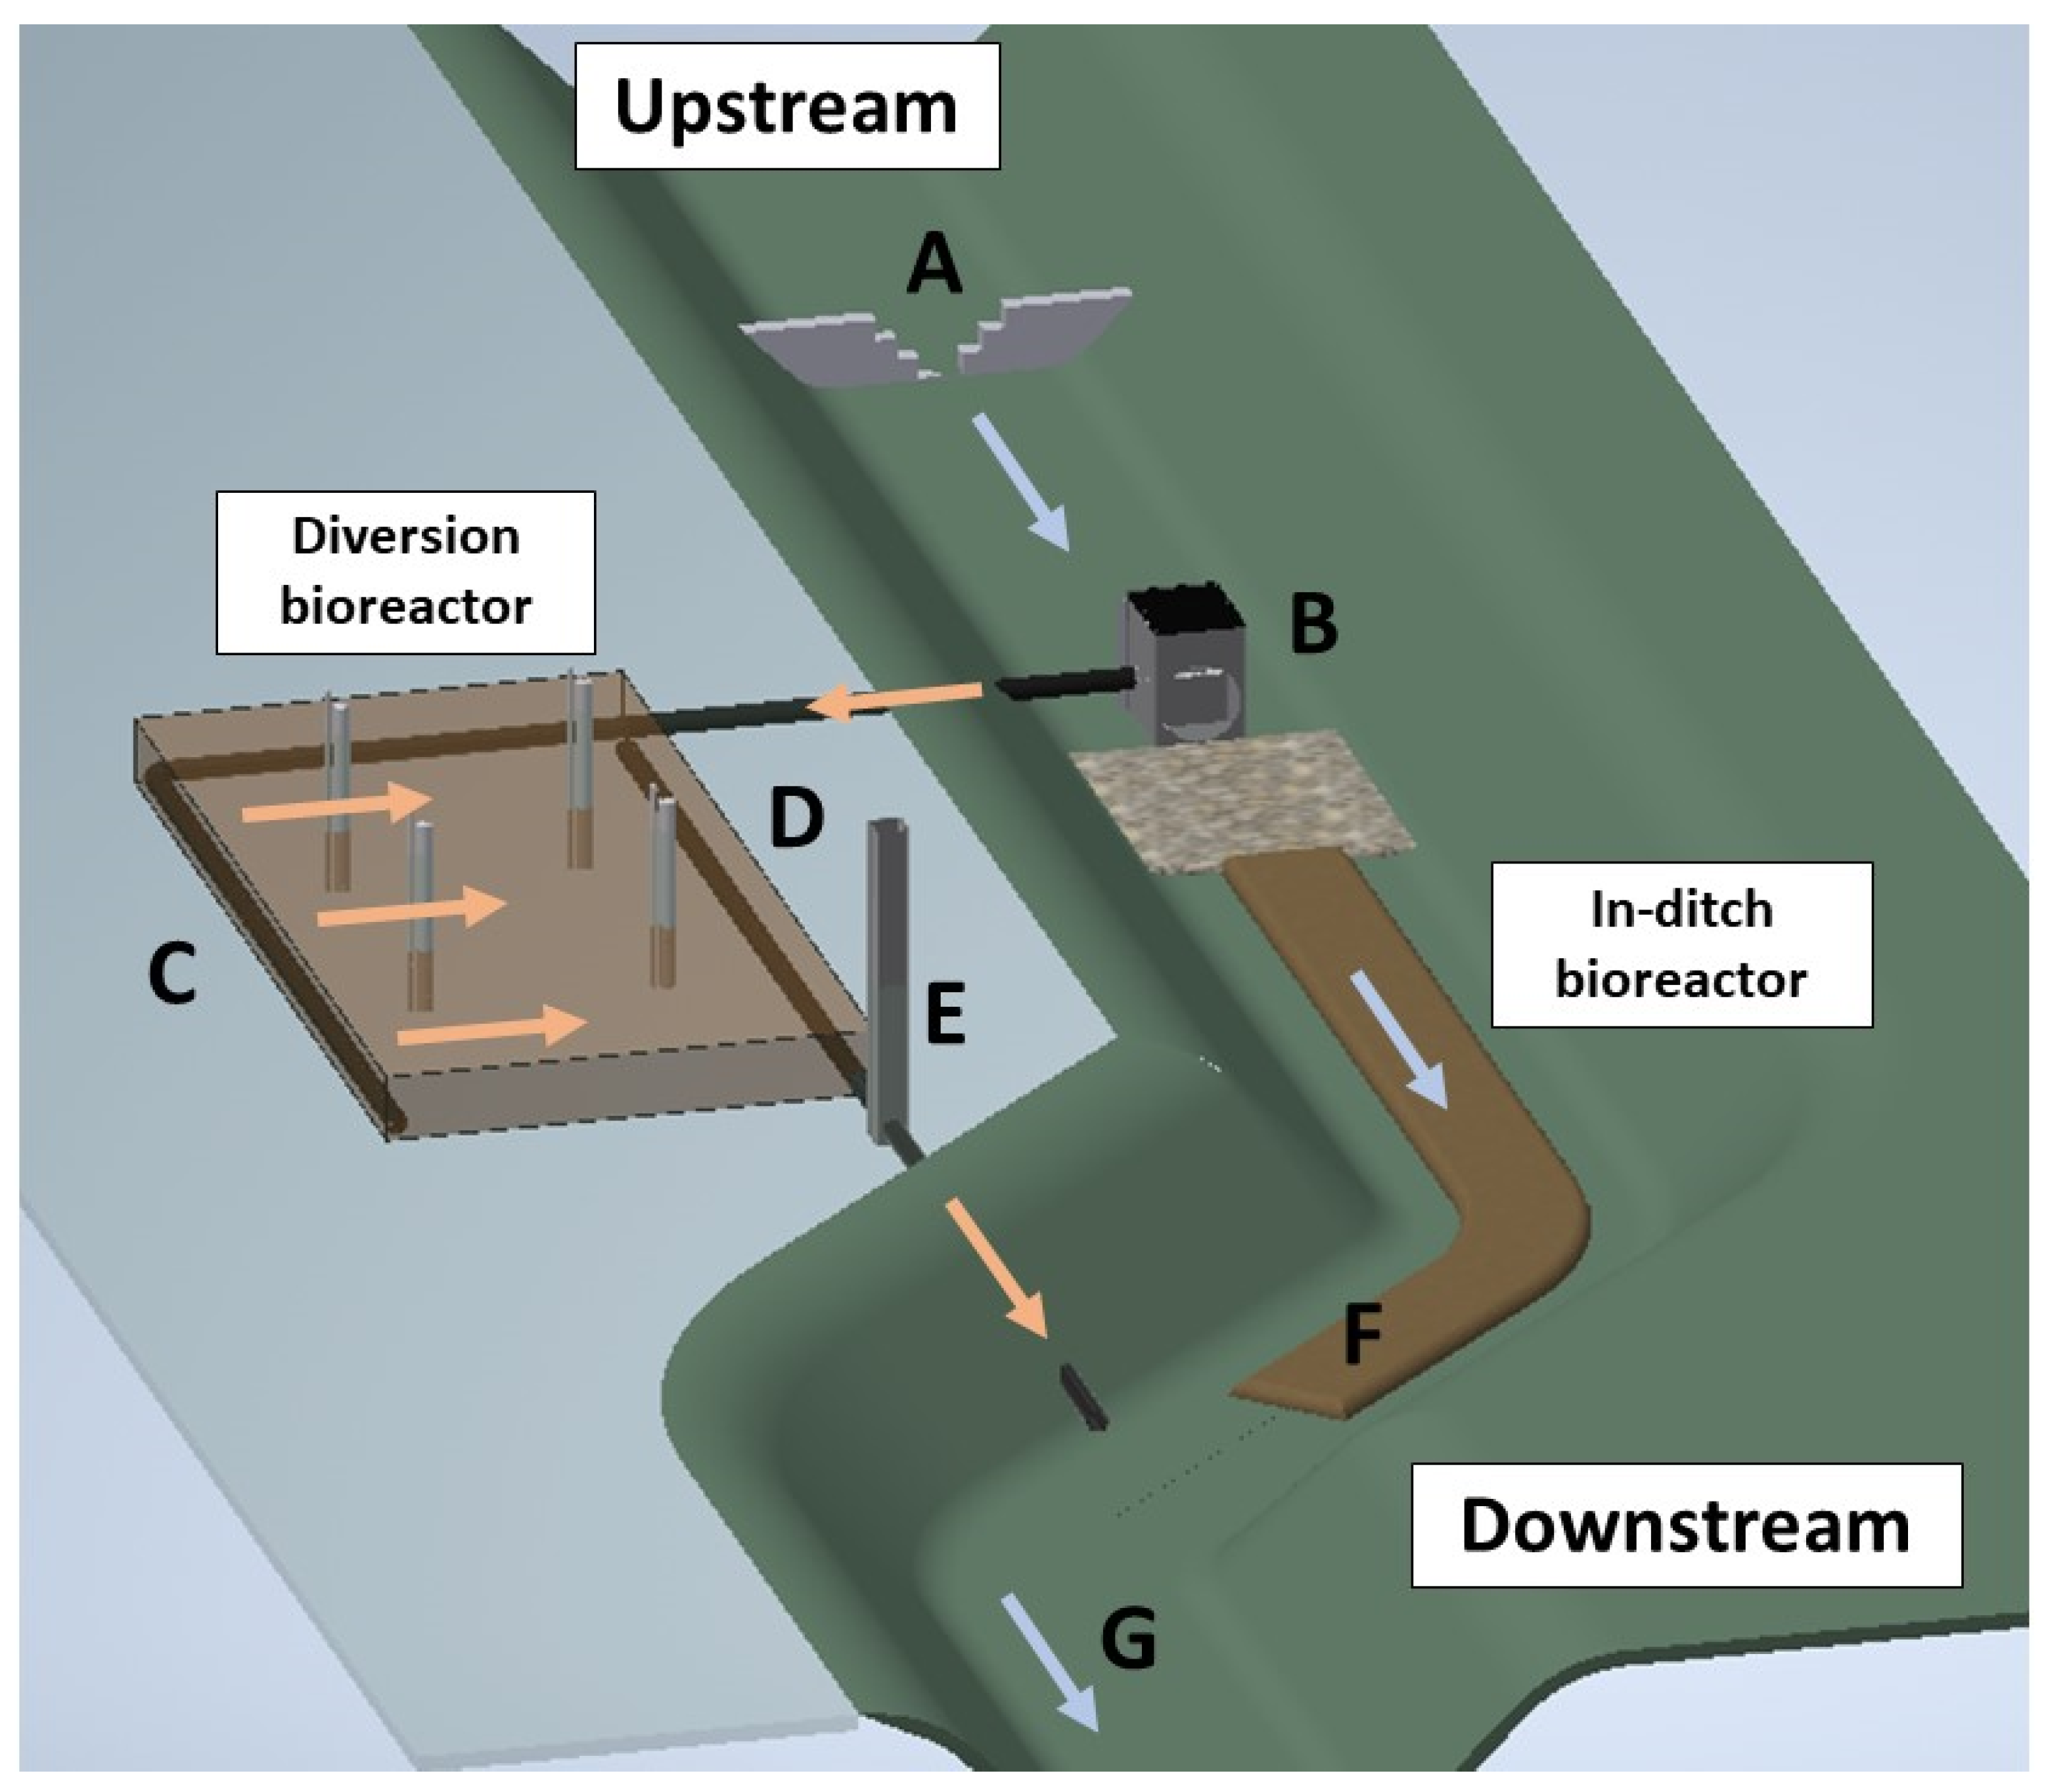
2.1. Bioreactor Design and Construction

A paired denitrifying bioreactor system was constructed adjacent to an existing drainage ditch on a private farm in Illinois, USA, in October 2018 (Figure 1). The estimated surface drainage catchment of the ditch was 3.2 km2 (StreamStats online tool, USGS.gov (accessed on 27 September 2021) predominantly in conventional corn-soybean rotation (Zea mays; Glycine max). The site was briefly described by Wickramarathne et al. who evaluated tannic acid flushing from the diversion bioreactor [13].
The in-ditch portion of the paired bioreactor system consisted of a woodchip-filled bag constructed by hand along the bottom of the ditch (1.8–2.1 m ditch depth, bioreactor length × width × depth = 18.3 × 2.1 × 0.2 m), similar to the “bioreactor sock” described by Chase et al. [7] (Figures S1 and S2). The ditch flow rate for design purposes was assumed to be 28.3 L s−1 (estimated using StreamStats). The bioreactor was intended to treat only a portion of ditch flow and provide a 4.7 h hydraulic retention time (HRT) at a bioreactor design flow rate of 0.49 L s−1, based on ditch dimensions and length constraints. The drainage contractor provided smoothing and shaping of the ditch bottom to aid the manual construction of the woodchip bag. Plastic mesh fencing (0.6 cm size mesh) was zip-tied to form a “blanket” and placed in the pre-shaped ditch, filled with woodchips, and then zipped-tied on top to form an enclosure. A 4.1 m length of ditch upstream of the bioreactor was laid with class #1 stone rip-rap (~30 cm size) to reduce scour under the woodchip bag and encourage sedimentation upstream of the bag.
The diversion bioreactor (4.6 m length × 9.1 m width) was constructed on the bank adjacent to the ditch (Figure 1 and Figure S3). This bioreactor was designed for an HRT of 0.5 h treating a design flow rate of 12.5 L s−1. The excavated pit for the diversion bioreactor was 1.9 m deep and filled with 0.9 m of woodchips covered with the mounded spoil. Surface flow from the drainage ditch was directed into the diversion bioreactor using a large in-stream riser structure (Figure 1, Point B; Figure S4) and a 25.4 cm diameter corrugated plastic tubing with invert ~0.2 m above ditch bottom. The bottom of the bioreactor was located ~0.2 m above the ditch bottom, and the water level within the bioreactor was controlled using a water level control structure at the outlet (AgriDrain; Adair, IA, USA)). A wide bioreactor orientation (length-to-width ratio of 1:2) and relatively low design HRT were used to treat as much water as possible. This bioreactor was not intended to operate at base flow conditions but rather as supplemental treatment at high flows.
Woodchips for both bioreactors were a ~70/30 mixture of hardwood/softwood that were double ground on a commercial-scale grinder, resulting in effective (D10) and median (D50) diameters of 2.9 and 5.0 mm, respectively. Initial woodchip drainable porosity and bulk density were 64% and 227 kg·m−3, respectively [13,14]. The total contractor cost for the small amount of ditch shaping and materials for the in-ditch bioreactor plus the cost of excavating, filling, and materials for the diversion bioreactor was $8800.

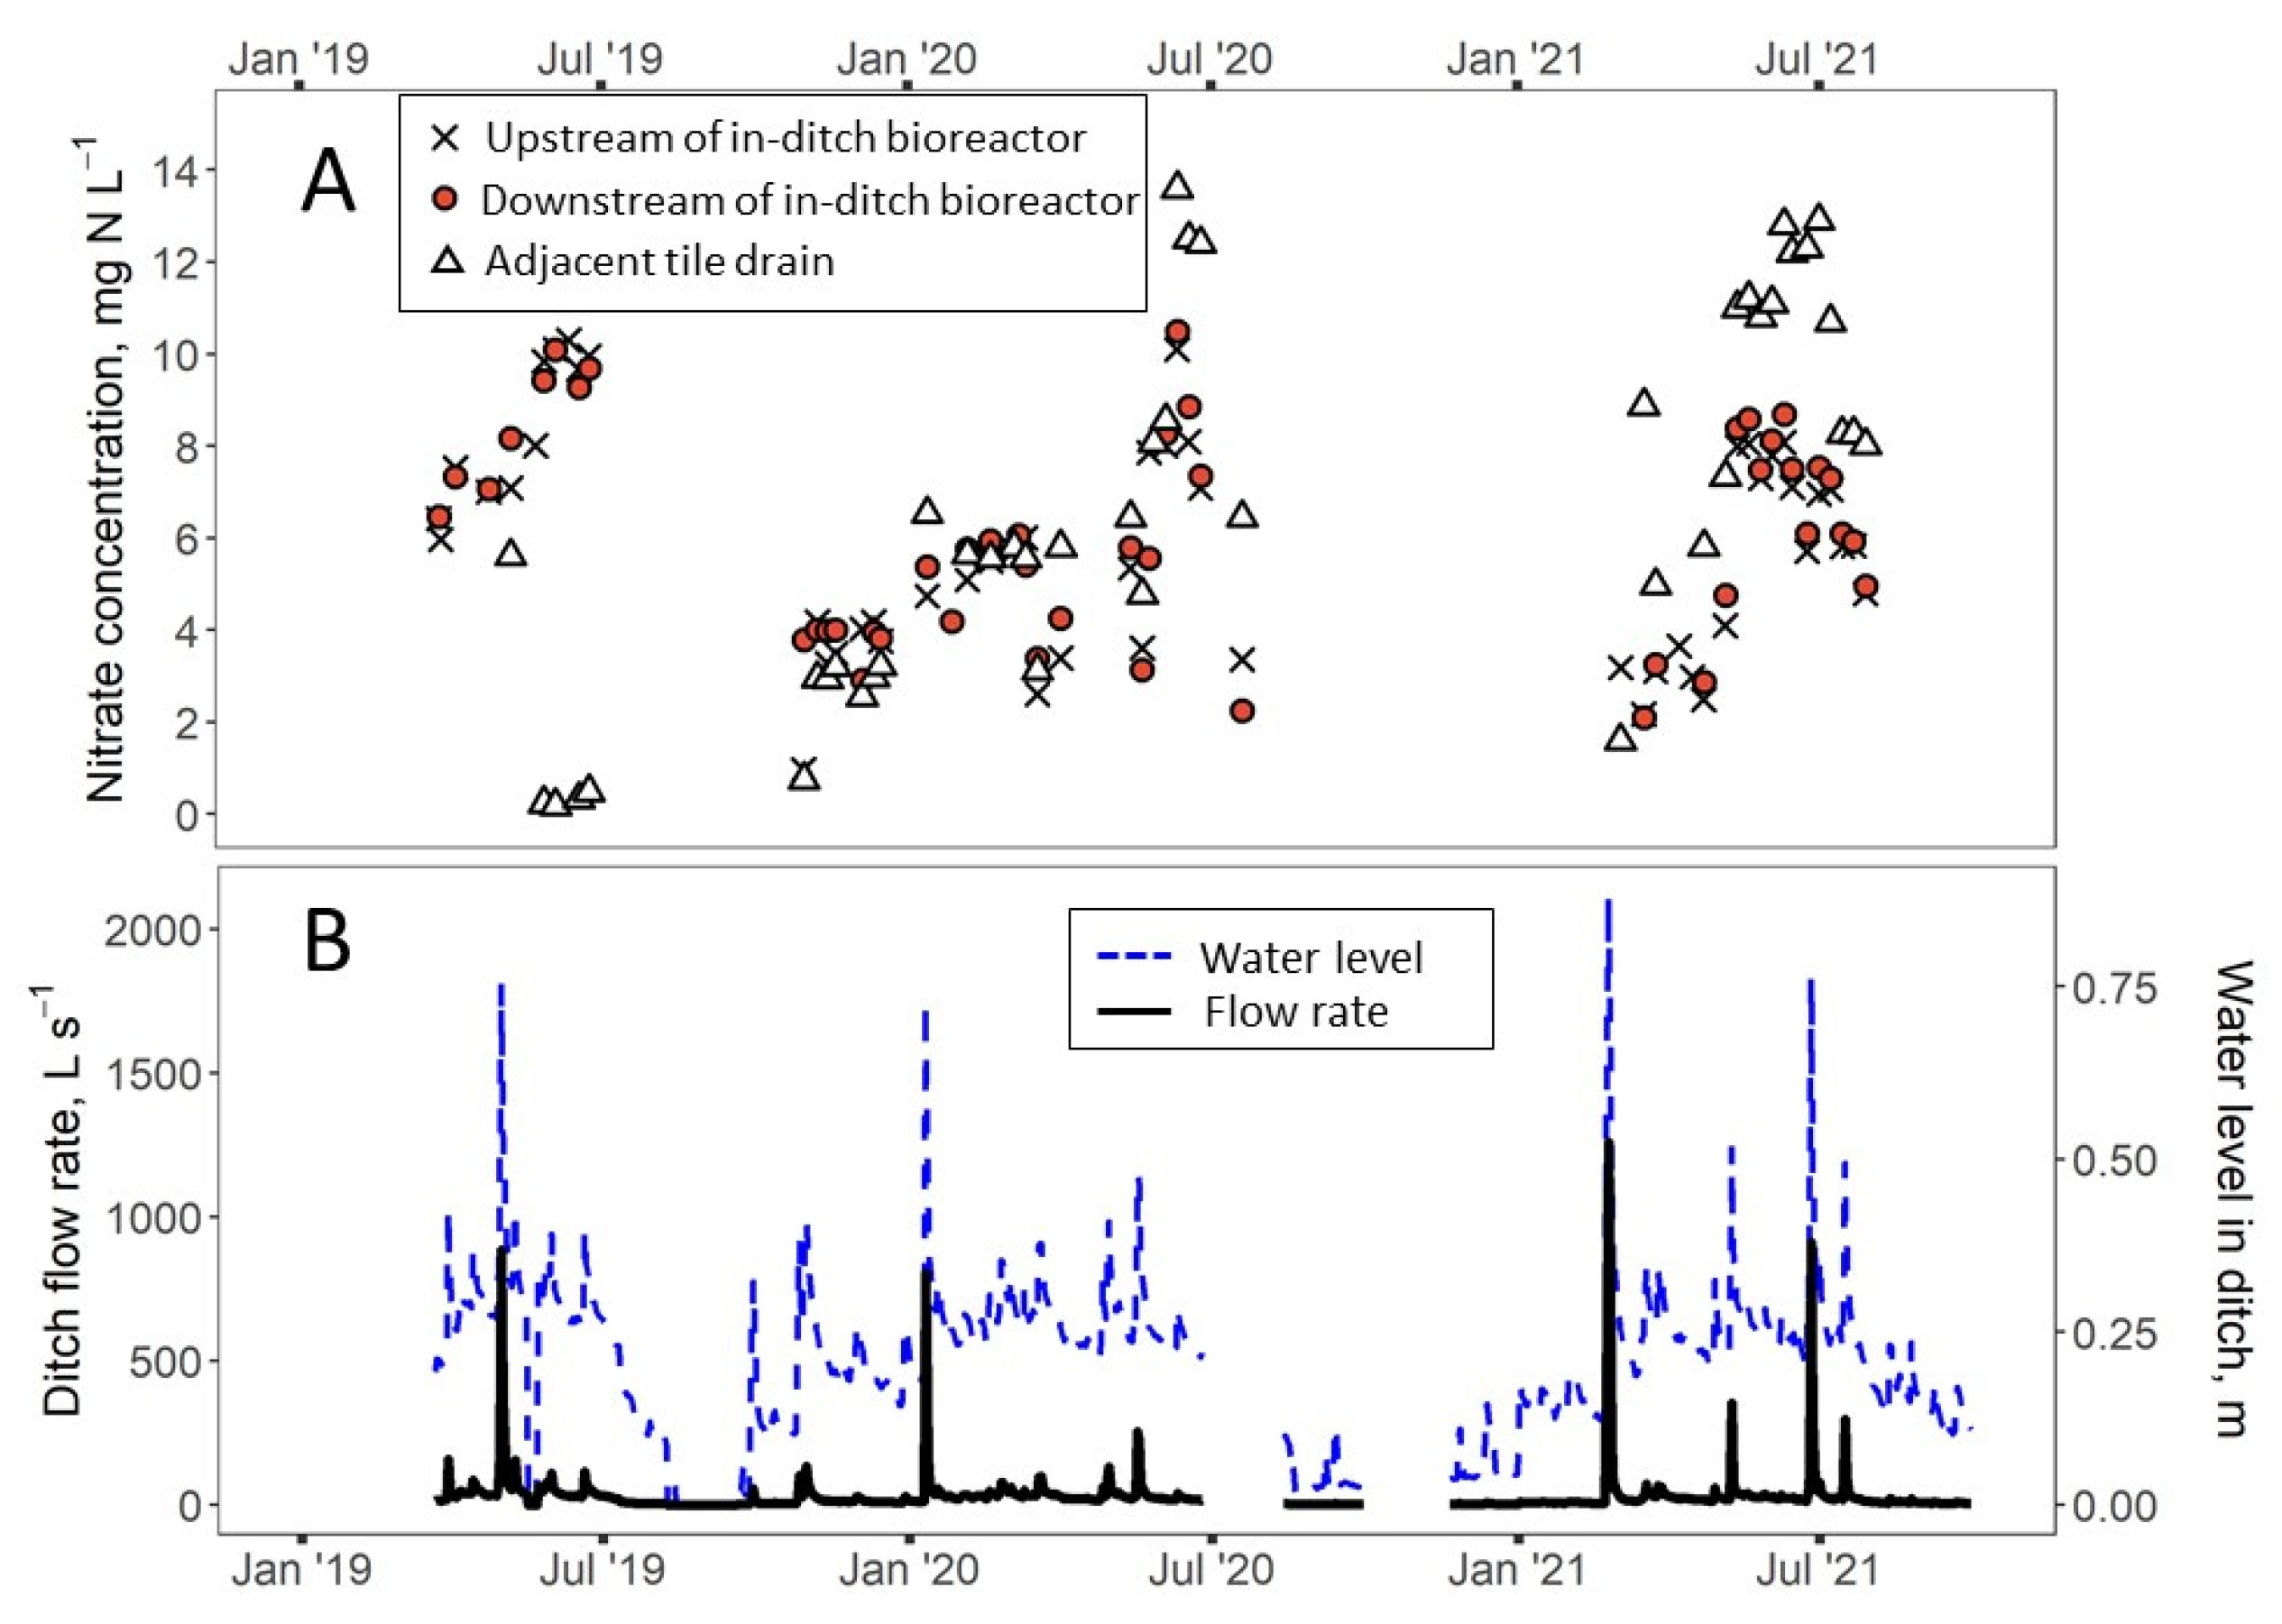
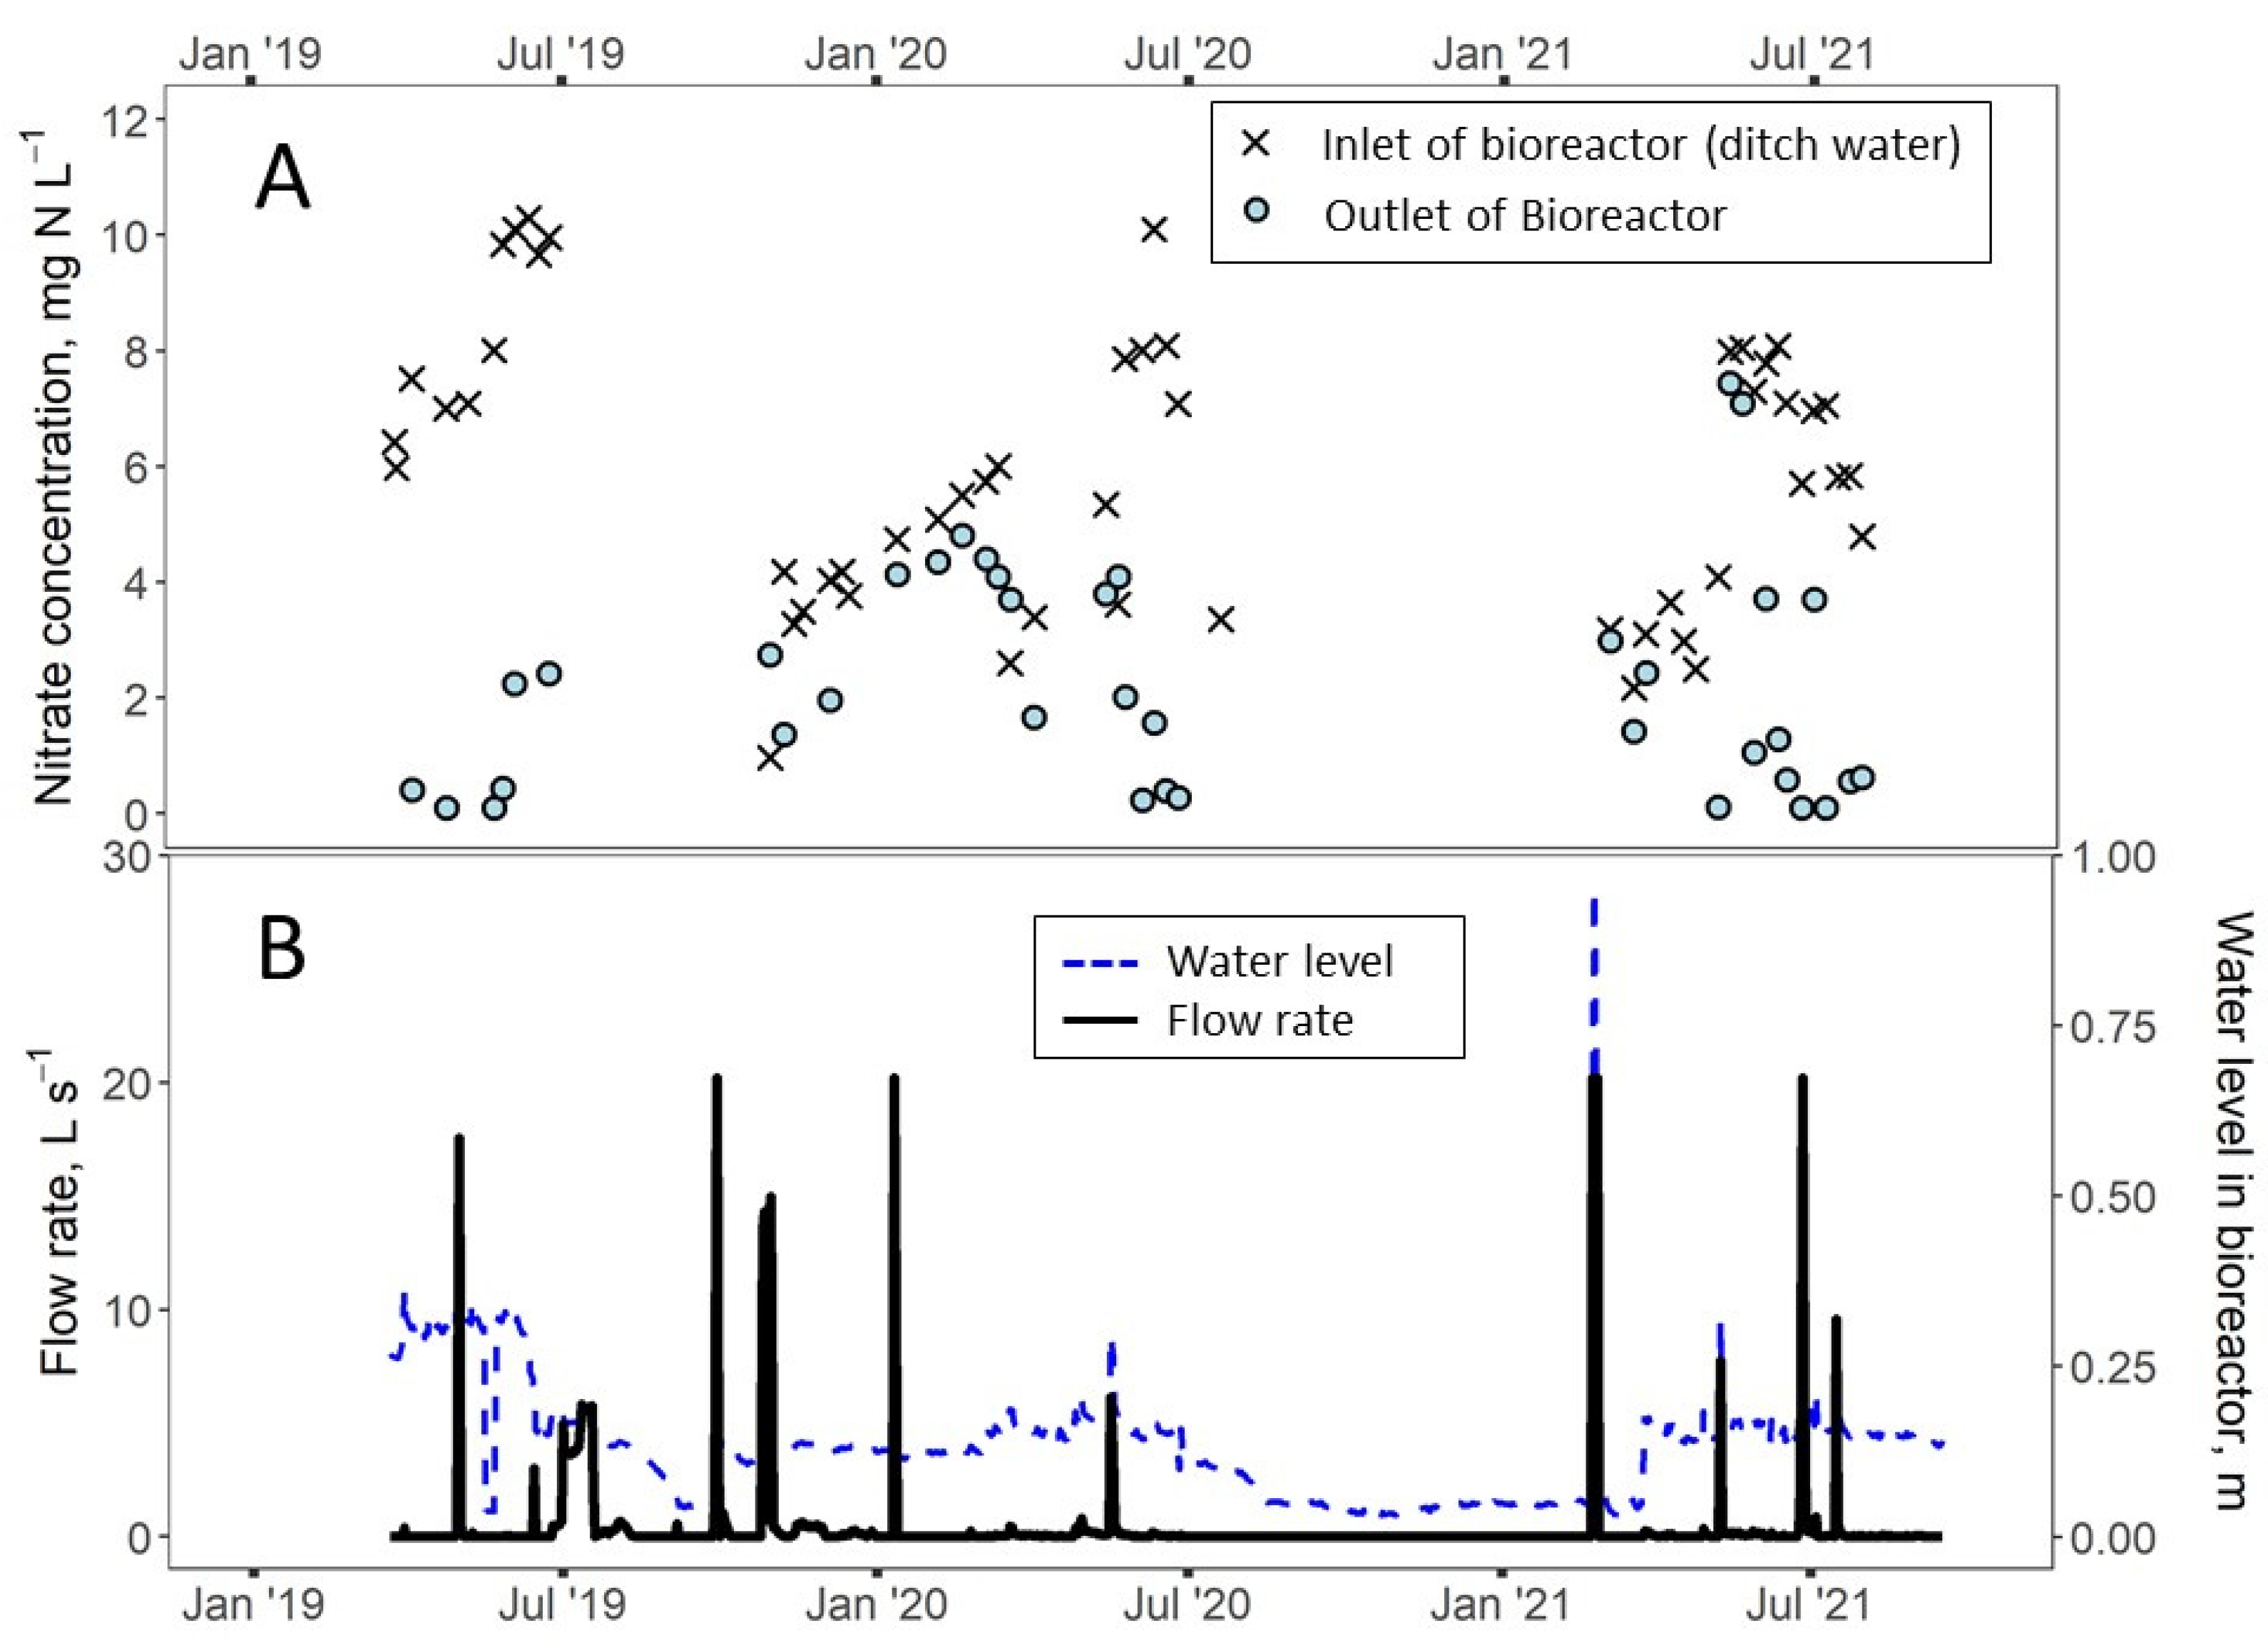
2.2. Flow and Nitrate Monitoring

Volumetric flow rates in the drainage ditch were estimated using water velocity (measured via float method during on-site visits) along with measured water-filled, cross-sectional area of the multi-stage cinder block weir (continuous depth measurement using water level logger). A 61 cm tall cinder block weir was constructed 13.6 m upstream of the woodchip-filled bag by stacking and cementing cinder blocks in four layers to create rectangular gaps with increasing width in four stages. The width of weir openings for each stage was 41, 81, 122, and 325 cm, where the width of the final stage was the full channel width. A water level logger (HOBO U20L-04; 15 min logging interval; corrected for barometric pressure) was deployed in a stilling well placed in the channel bottom to record the depth of water in the ditch. Water velocity in the ditch was estimated by recording travel time of a tennis ball along a consistent 2.1 m section of the ditch. The average of ten tennis ball velocity measurements was used for each site visit in which water velocity was measured (17, 23, and 12 velocity measurements in 2019, 2020, and 2021, respectively). A correction factor of 0.8 was applied to tennis ball velocity measurements to account for velocity variation over depth [15].
A non-linear regression relating water depth and velocity was used to estimate flow between site visits (Supplemental Figure S5; R2 = 0.80). A random error of 5% was assumed for in-ditch daily flow measurements, when developing the depth–velocity relationship [16], and uncertainty of cumulative annual flow was calculated by adding uncertainties for daily flow in quadrature (i.e., taking the square root of summed squares of absolute daily uncertainties).
Flow through the diversion bioreactor was estimated by recording the water depth in the outlet control structure (HOBO water level logger U20L-04; daily average of measurements at 15 min logging interval). The water level in the outlet structure was related to established stage–discharge relationships for free flow over a stainless steel v-notch weir in AgriDrain control structures [17]. During each site visit, water level in the control structure was manually measured with a tape measure to verify logger calibration.
Water grab samples were collected at least every other week when flow was occurring, with samples collected at the upstream weir, at the diversion bioreactor outlet, directly downstream of the in-ditch bioreactor, and downstream of both bioreactors (Figure 1, Points A, E, F, and G). Samples were transported on ice, filtered (0.45 µm filter) within 24 h, and frozen until analysis for nitrate-N (Lachat Quickchem, Hach Company, Loveland, CO, USA; Method 10-107-04-1-A). Nitrate-N concentrations were multiplied by cumulative flow between sampling events to calculate the nitrate-N load (i.e., most similar to M3 method) [18]. Annual flow volumes and nitrate-N loads were reported by water year (01 October to 30 September).
Pore water samples were collected from the in-ditch bioreactor during seven site visits between 3 June and 29 July 2021. Pore water wells were constructed of galvanized steel pipe (1.5 cm internal diameter) inserted 25 cm into the woodchip-filled bag. Five holes (0.3 cm diameter) were drilled in the bottom 20 cm of each pore water well and covered with filter sock. Wells were placed at 2.4, 6.1, 10.4, 13.4 and 17.1 m from the upstream edge of the in-ditch bioreactor immediately below the rip-rap section. Samples were drawn manually using a syringe and vinyl tubing inserted into the well. Pore water samples were transported, stored, and analyzed per the method described above for nitrate-N.

2.3. Media Physiochemical Analyses

Woodchips used in both bioreactors were collected at the time of construction and were sent to an external lab for analysis of carbon (C), N (combustion method using Carlo Erba 1500 C/N Analyzer), and phosphorus (P) content (nitric acid and hydrogen peroxide digestion, analyzed on Thermo 6500 Duo ICP) by Brookside Laboratories, Inc. (New Bremen, OH, USA). After 25 months (November 2020), woodchips from the in-ditch bioreactor were excavated every ~2.4 m along its length (n = 8 sampling points), rinsed with deionized water to remove attached soil particulates, and analyzed for nutrients (C, N, P) in triplicate. A composite sample of unwashed in-ditch woodchips was created by mixing woodchips from each sampling point, and this unwashed composite sample was also analyzed as above for nutrients. The layer of settled sediment on top of the in-ditch bioreactor was collected at each sampling point. Phosphorus (extractable, Bray-1), magnesium, calcium, and potassium (Mehlich III extract) and organic matter content (loss on ignition, A&L Great Lakes Laboratories, Fort Wayne, IN, USA) of the soil was analyzed separately for each sampling location, with each analysis in triplicate.
Four woodchip sampling ports (15 cm diameter PVC) were inserted vertically into the diversion bioreactor during construction (Figure 1; Figure S3). Woodchip bags, each containing 155 g air-dried woodchips, were made using filter sock fabric and deployed inside the PVC ports shortly following bioreactor construction. They were placed at the bottom of the bioreactor, with loose woodchips placed above. The bags were extracted using a Shop-Vac® in November 2020, after which the woodchips were carefully separated from the mesh, and unwashed woodchip samples were analyzed for C, N, and P using methods described above (Brookside Laboratories). Soil cores from the soil cover of the diversion bioreactor were also collected and analyzed for nutrient and organic matter content using methods described above (Bray-1 and Mehlich III extract; A&L Great Lakes Laboratories, Fort Wayne, IN, USA). Soil texture was determined by hydrometer method.

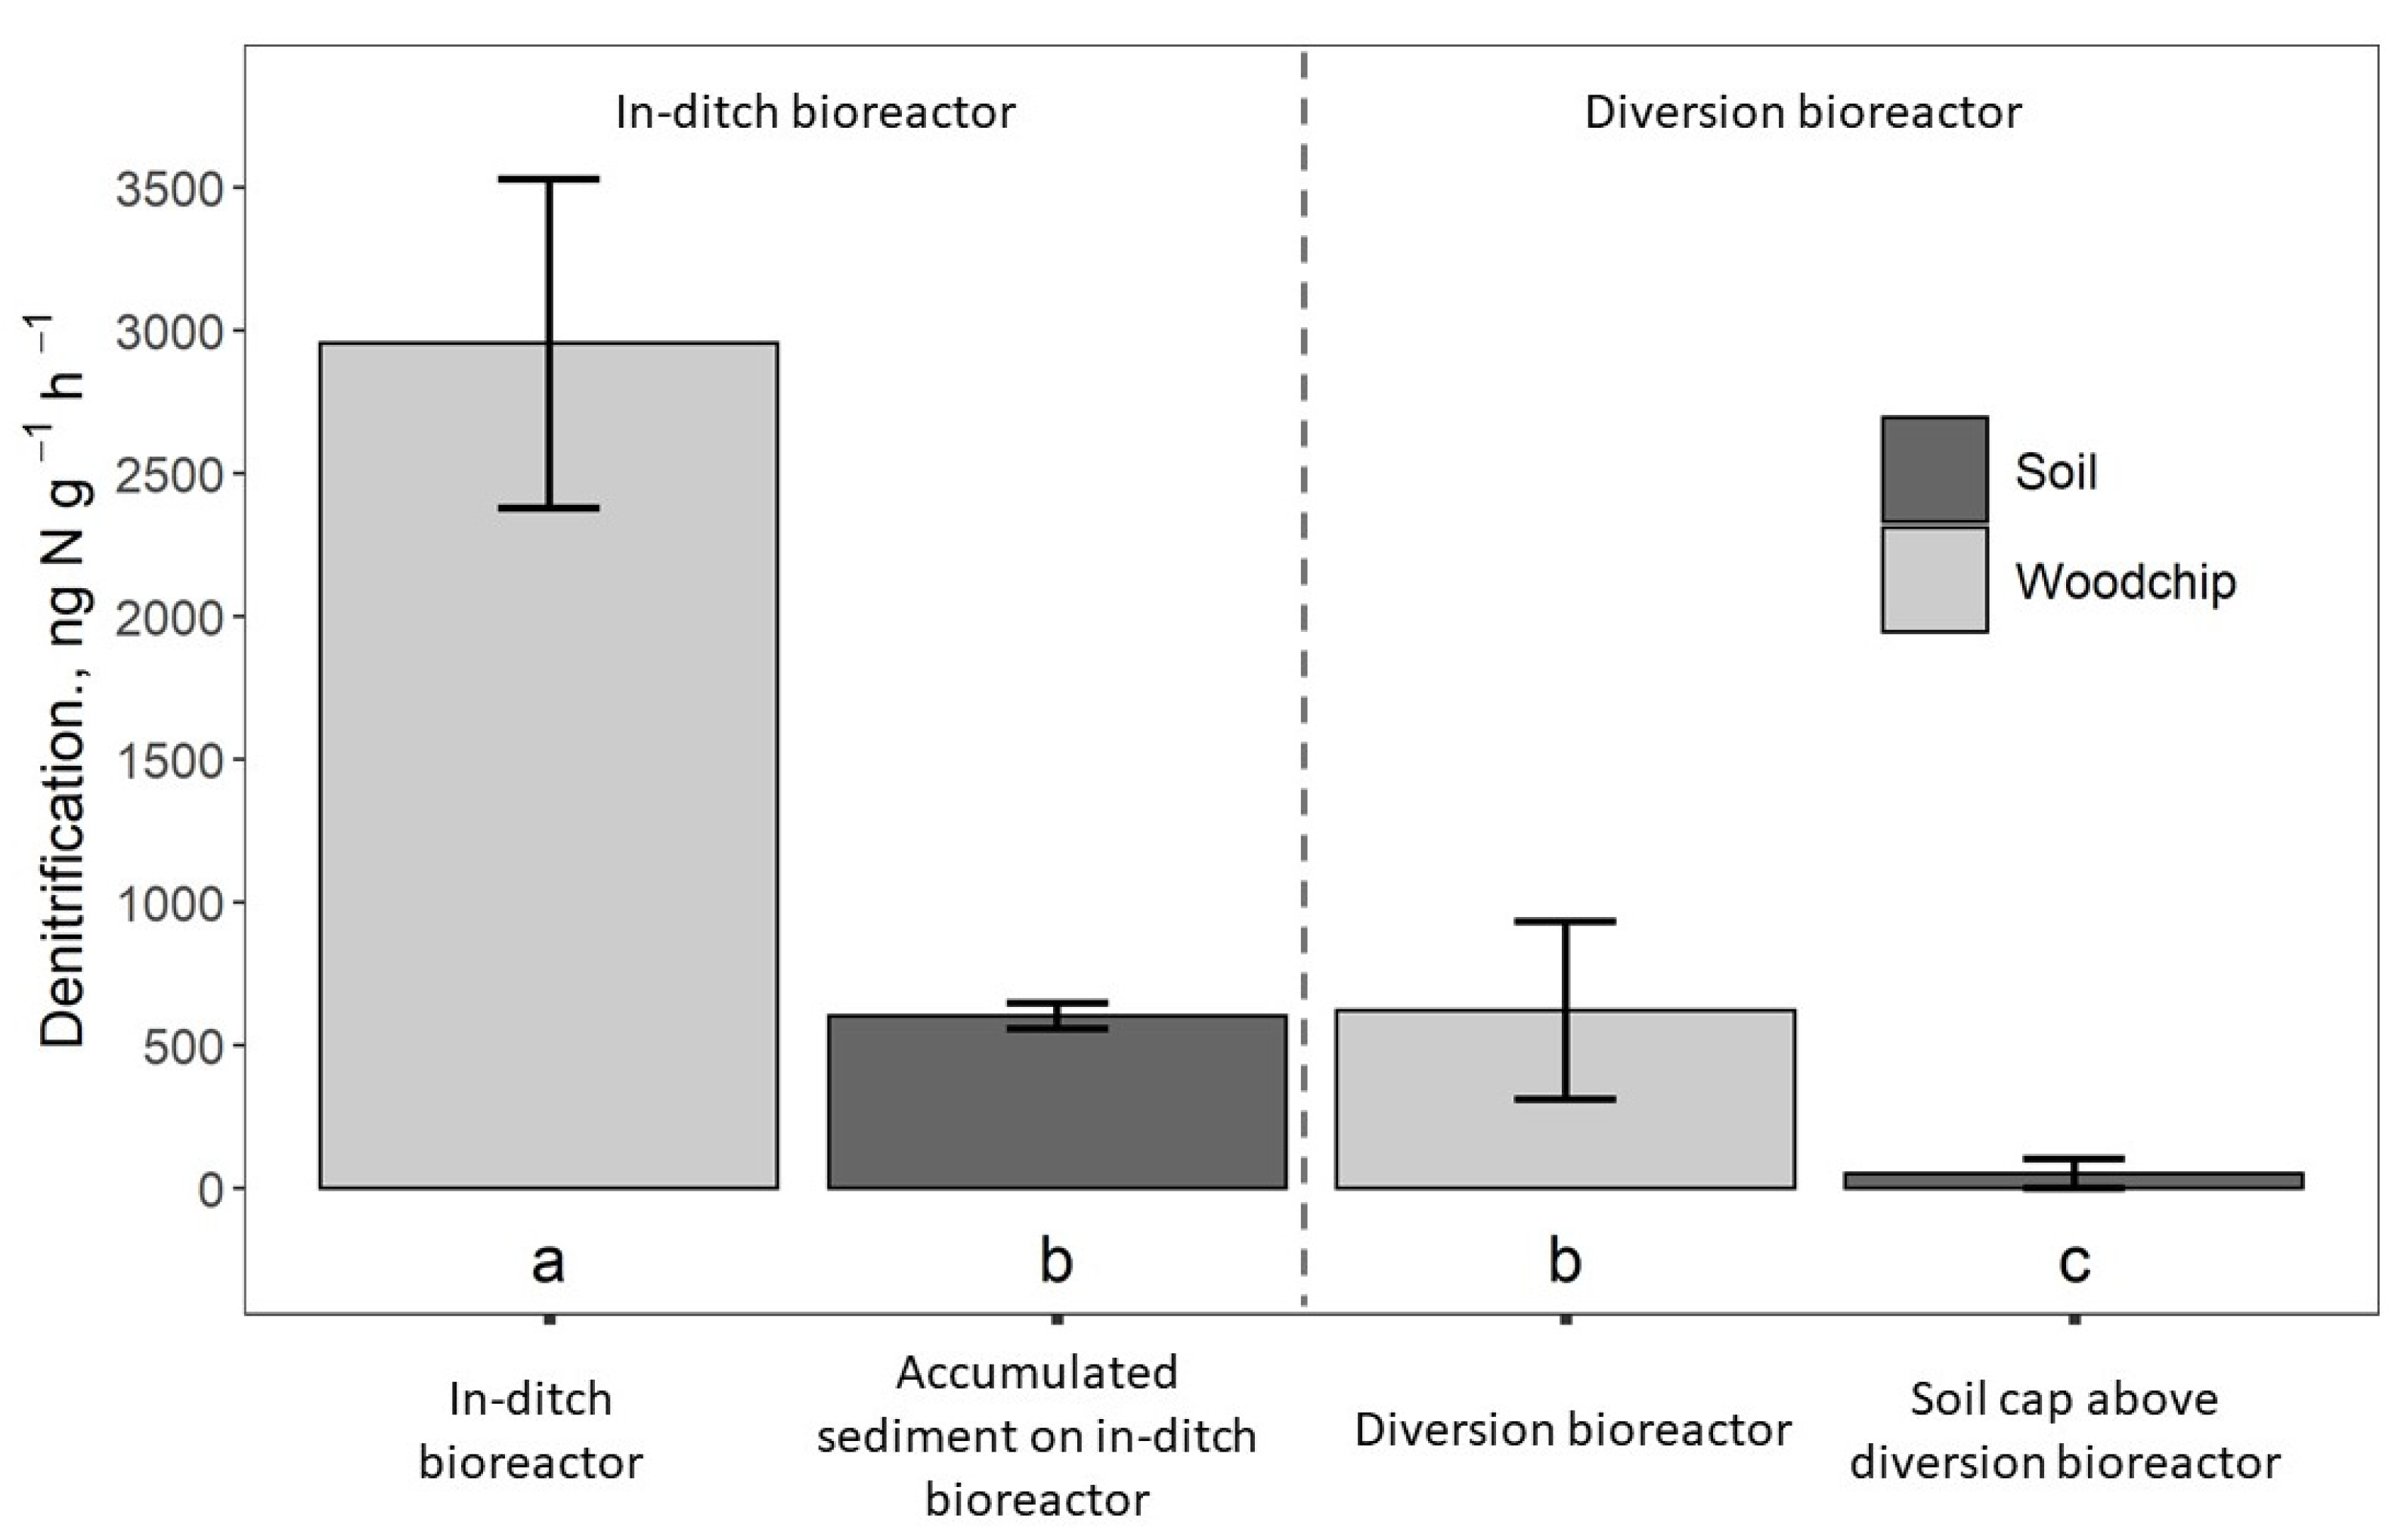
2.4. Denitrification Potential

Denitrification potentials of the unwashed woodchips and soils from the in-ditch and diversion bioreactors were quantified using the acetylene inhibition method [19]. In-ditch bioreactor woodchips collected along the length of the bioreactor were aggregated into one sample by mixing thoroughly. Woodchips from each of the four diversion bioreactor sampling ports were similarly aggregated into one sample. The assays were conducted using methods previously described for woodchip [20] and soil samples [21]. Briefly, in each 150 mL assay jar, a 15–25 g woodchip or soil sample was treated with 25 mL of nutrient solution. For each sample, assays were conducted in triplicate by providing a nitrogen plus supplemental carbon treatment to each replicate (0.1 mg nitrate-N and 2 mg glucose-C per g of sample). After treatment, jars were sealed, the headspace was flushed with helium to induce anaerobic conditions, and acetylene was added to inhibit the final step of denitrification. The jars were hand shaken and incubated at 20 °C with headspace gas sampling at 2, 3, and 4 h. Gas samples were analyzed for N2O using gas chromatography (Shimadzu GC-2014 and AOC 5000 plus, Kyoto, Japan). Potential denitrification rates were determined using N2O concentration change over time, the ideal gas law, and moisture content, accounting for the effects of dilution and dissolved N2O. For this study, only the nitrate reduction pathway of denitrification was considered, since it has generally been shown to be the dominant mode of microbial nitrate reduction in woodchip bioreactors.

2.5. Statistical Analysis

Statistical analysis was performed in R [22]. Nitrate concentration reduction by the in-ditch and diversion bioreactor was determined using a paired t-test (t.test()) of inlet and outlet water samples. Normality of the differences in paired samples was assessed by the Shapiro–Wilk test using shapiro.test(), and in the case of non-normal differences, a paired Wilcoxon signed rank test was used (wilcox.test()). Multiple comparisons test for denitrification potential and nutrient content were done using Tukey’s Honest Significant Difference test (TukeyHSD()). Group means were considered statistically different at α = 0.05. Correlations between variables were assessed using cor().

3. Results and Discussion

3.1. Bioreactor Performance

3.1.1. In-Ditch Bioreactor

Nitrate removal by the in-ditch bioreactor was negligible, most likely caused by low hydraulic connectivity between the water column and the woodchips. Nitrate-N concentrations upstream and downstream of the in-ditch bioreactor averaged 5.9 ± 2.4 (n = 52, mean ± standard deviation) and 6.1 ± 2.2 mg N L−1 (n = 47), respectively, over the three-year monitoring period (Figure 2A). Nitrate-N concentrations downstream of the in-ditch bioreactor were not significantly less than upstream (paired Wilcoxon signed-rank test, one-sided, p = 0.99). Percent reduction in nitrate concentration across the in-ditch bioreactor averaged −1 ± 16%. This was lower than the 28% average reduction in nitrate concentration reported by Pfannerstill et al. for an in-ditch bioreactor in Germany [6]. Christianson et al. reported a nitrate concentration reduction of 65% at a 92 m long in-ditch bioreactor in Maryland [5], although that bioreactor was more than five times greater in length. On many sampling dates, the slightly higher nitrate concentrations downstream of the in-ditch bioreactor may have been related to an intermittent contribution of nitrate from an adjacent tile drain discharging into the ditch between sampling points. Nitrate concentrations from this source (6.7 ± 4.0 mg N L−1, n = 44 samples) were significantly higher (paired Wilcoxon signed-rank test, one-sided, p = 0.007) than those in the upstream ditch.
Mean and median daily averaged ditch flow rates were 30 ± 80 and 17 L s−1, comparable with the estimated design flow rate, with the majority of flow in winter and spring months (Figure 2B). Annual cumulative ditch flow was 550,000, 740,000, and 840,000 m3 during 2019 (partial water year), 2020, and 2021 water years, respectively, with uncertainty of cumulative annual flow of <1%. Flow monitoring instrumentation was not designed to estimate the amount of water treated by the in-ditch bioreactor. Therefore, treated flow was estimated to be ~3% of total ditch flow, based on bioreactor length, watershed characteristics, and estimates of groundwater contribution (StreamStats online tool; USGS.gov, assessed on 27 September 2021). Initial design objectives included not restricting ditch flow and an easily constructed and replicable design. The bag-style bioreactor was able to be quickly installed on-site in a single day and avoided restricting ditch flow. However, the lack of an in-ditch feature to force water through the woodchips made the design ineffective at significantly reducing nitrate concentrations. Robertson and Merkley [4] incorporated a check dam downstream of an in-ditch bioreactor, such that water was forced to flow downwards through the woodchip bed. In the absence of a check dam feature, the in-ditch bioreactor likely operated more closely to an amended hyporheic zone with enhanced denitrification.
Hydraulic connectivity issues were exacerbated by settled sediment on top of the woodchip-filled bag. Sediment cores taken along the bioreactor length 25 months after construction showed the woodchip-filled bag was covered with 5–9 cm of soil and substantial vegetative cover in some places. Robertson and Merkley [4] saw flow rates through an in-ditch bioreactor with a check dam decrease significantly after the first year, and that flow rates increased abruptly after removing an overlying layer of accumulated silt. Sedimentation may be site-dependent, as Pfannerstill et al. [6] reported there was no maintenance requirement over two years of monitoring at their in-ditch bioreactor. Nevertheless, the possibility of woodchip clogging should be considered in the design of in-ditch bioreactors given the limiting hydraulic conductivity of this bioreactor may have been closer to that of a clay loam (saturated hydraulic conductivity of 1 × 10⁻⁵–2 × 10⁻⁴ cm s−1 for clay loam) [23] versus 2–10 cm s−1 for woodchips [24,25].
The median water level in the ditch over the study period was ~8 cm above the surface of the in-ditch bioreactor. The surface of the in-ditch bioreactor was almost continuously submerged, other than dry periods in late summer of 2019 and 2020 (Figure 2B). Pore water samples from the in-ditch bioreactor collected in summer 2021 consistently showed lower nitrate concentrations in the woodchip pore water relative to the ditch surface water (Supplemental Figure S6). Mean nitrate-N concentrations in the stream and pore water samples were 6.4 ± 1.1 and 0.3 ± 0.6 mg N L−1, respectively, across the seven sampling dates, which suggested the in-ditch bioreactor was capable of acting as a sink for nitrate. Slow water movement from surface water into the woodchips would have resulted in a long HRT for water able to enter the woodchip-filled bag, possibly explaining the near-zero nitrate concentrations within the pore water. However, due to the design of the in-ditch bioreactor and resulting sedimentation above the woodchips, much of the treated flow may have been subsurface upwelling, rather than surface flow, though the same slow water movement conditions would apply. With this approach, a small portion (~3%) of the overall flow may have been treated, which may have resulted in approximately 60 kg of N reduction in each of the three years (based on pore water samples and estimates of subsurface flow).

3.1.2. Ditch Diversion Bioreactor

Nitrate-N concentrations in samples collected at the outlet of the diversion bioreactor averaged 2.2 ± 1.9 mg N L−1 (range: 0.1–7.4 mg N L−1; n = 38; Figure 3A), which were significantly less than those at the inlet (paired Wilcoxon signed rank test, one-sided, p < 0.001). Nitrate removal efficiency across paired samples averaged 58 ± 39% (range: −42–99%), with 16 of 38 sample events showing >80% reduction. Estimates of annual nitrate load removed were 22, 5, and 18 kg N in 2019, 2020, and 2021 water years.
Although the diversion bioreactor showed a favorable percent reduction in nitrate concentration, this bioreactor only received 2.2, 1.5 and 1.5% of annual ditch flow during 2019, 2020, and 2021 water years, respectively. Mean and median outflow rates only were 1.1 ± 3.4 and 0.1 L s−1, although the maximum flow rate (20.1 L s−1) was higher than the design flow rate of 12.5 L s−1 (Figure 3B). High flows through the diversion bioreactor coincided with high stage events in the ditch as ditch water level rose (Figure 2B) and water entered the diversion bioreactor. The low cumulative flow through the diversion bioreactor was affected by the lack of an effective diversion feature at the riser structure to route water out of the ditch. This bioreactor was intended to provide treatment when ditch flow rate was high, rather than operate at base flow conditions; however, the design relied on passive flow and resulted in much of the ditch flow bypassing the diversion bioreactor.
Median hydraulic retention times were 4, 17, and 37 h for 2019, 2020, and 2021, respectively (previously reported drainable porosity of 64%) [13]. Annual flow-weighted HRT was shorter (0.8, 1.7, and 1.5 h for 2019, 2020, and 2021) likely due to most of flow occurring during a small number of high-flow events; 90% of total flow volume occurred in <13% of days with flow. Low-flow-weighted HRT and relatively low nitrate concentrations in the ditch (compared to tile drainage, e.g., 9.0–17.9 mg NO3-N L−1 in a tile drainage review) [26] were drivers of the high percent nitrate reduction. Frequent unsaturated conditions may have improved nitrate removal [27], which was highlighted when evaluating water depth in the bioreactor. Of the 90 cm of woodchips available to convey flow, water depth was almost always less than 30 cm (93% of time when flow was occurring), and <15 cm 65% of the time. Resulting annual volumetric nitrate removal rates were 5.9, 0.8, and 4.4 g N m−3 woodchip-filled volume d−1 in 2019, 2020, and 2021, respectively, for the ditch diversion bioreactor, within the range of other annual field studies (0.4–7.8 g N m−3 d−1) [28].

3.1.3. Performance of Paired Bioreactor Design

Nitrate concentrations in samples collected downstream of the outlet of both bioreactors (Figure 1, Point G) were not significantly less than upstream samples collected at the cinderblock weir (paired Wilcoxon rank sum test, one-sided, p = 0.9922). Mean nitrate-N concentrations in upstream and downstream samples were 5.9 ± 2.4 and 6.7 ± 2.5 (n = 39) mg N L−1, respectively (Supplemental Figure S7). The diversion bioreactor removed between 5–22 kg N annually (versus estimated 11–16 kg annual N removal by in-ditch bioreactor) a small contribution of the estimated 4600–4800 kg of N entering the paired system annually. The large N load transported through this ditch illustrates the immense opportunity for targeted N treatment not just in this ditch but in the millions of similar drainage ditches across the Midwestern agricultural landscape. However, more effective design and operational ideas are needed to provide better nitrate removal while still not restricting flow conveyance capacity.
In neither bioreactor was the production of ammonium or nitrite measured. Both forms of nitrogen can be produced during incomplete processes of denitrification of dissimilatory reduction of nitrate to ammonium. Nitrite and ammonium production have been shown to occur in woodchip bioreactors [29], although concentrations are generally low relative to reduction in nitrate concentrations. Future research with in-ditch bioreactors should determine production ammonium or nitrite which can be harmful to aquatic health.

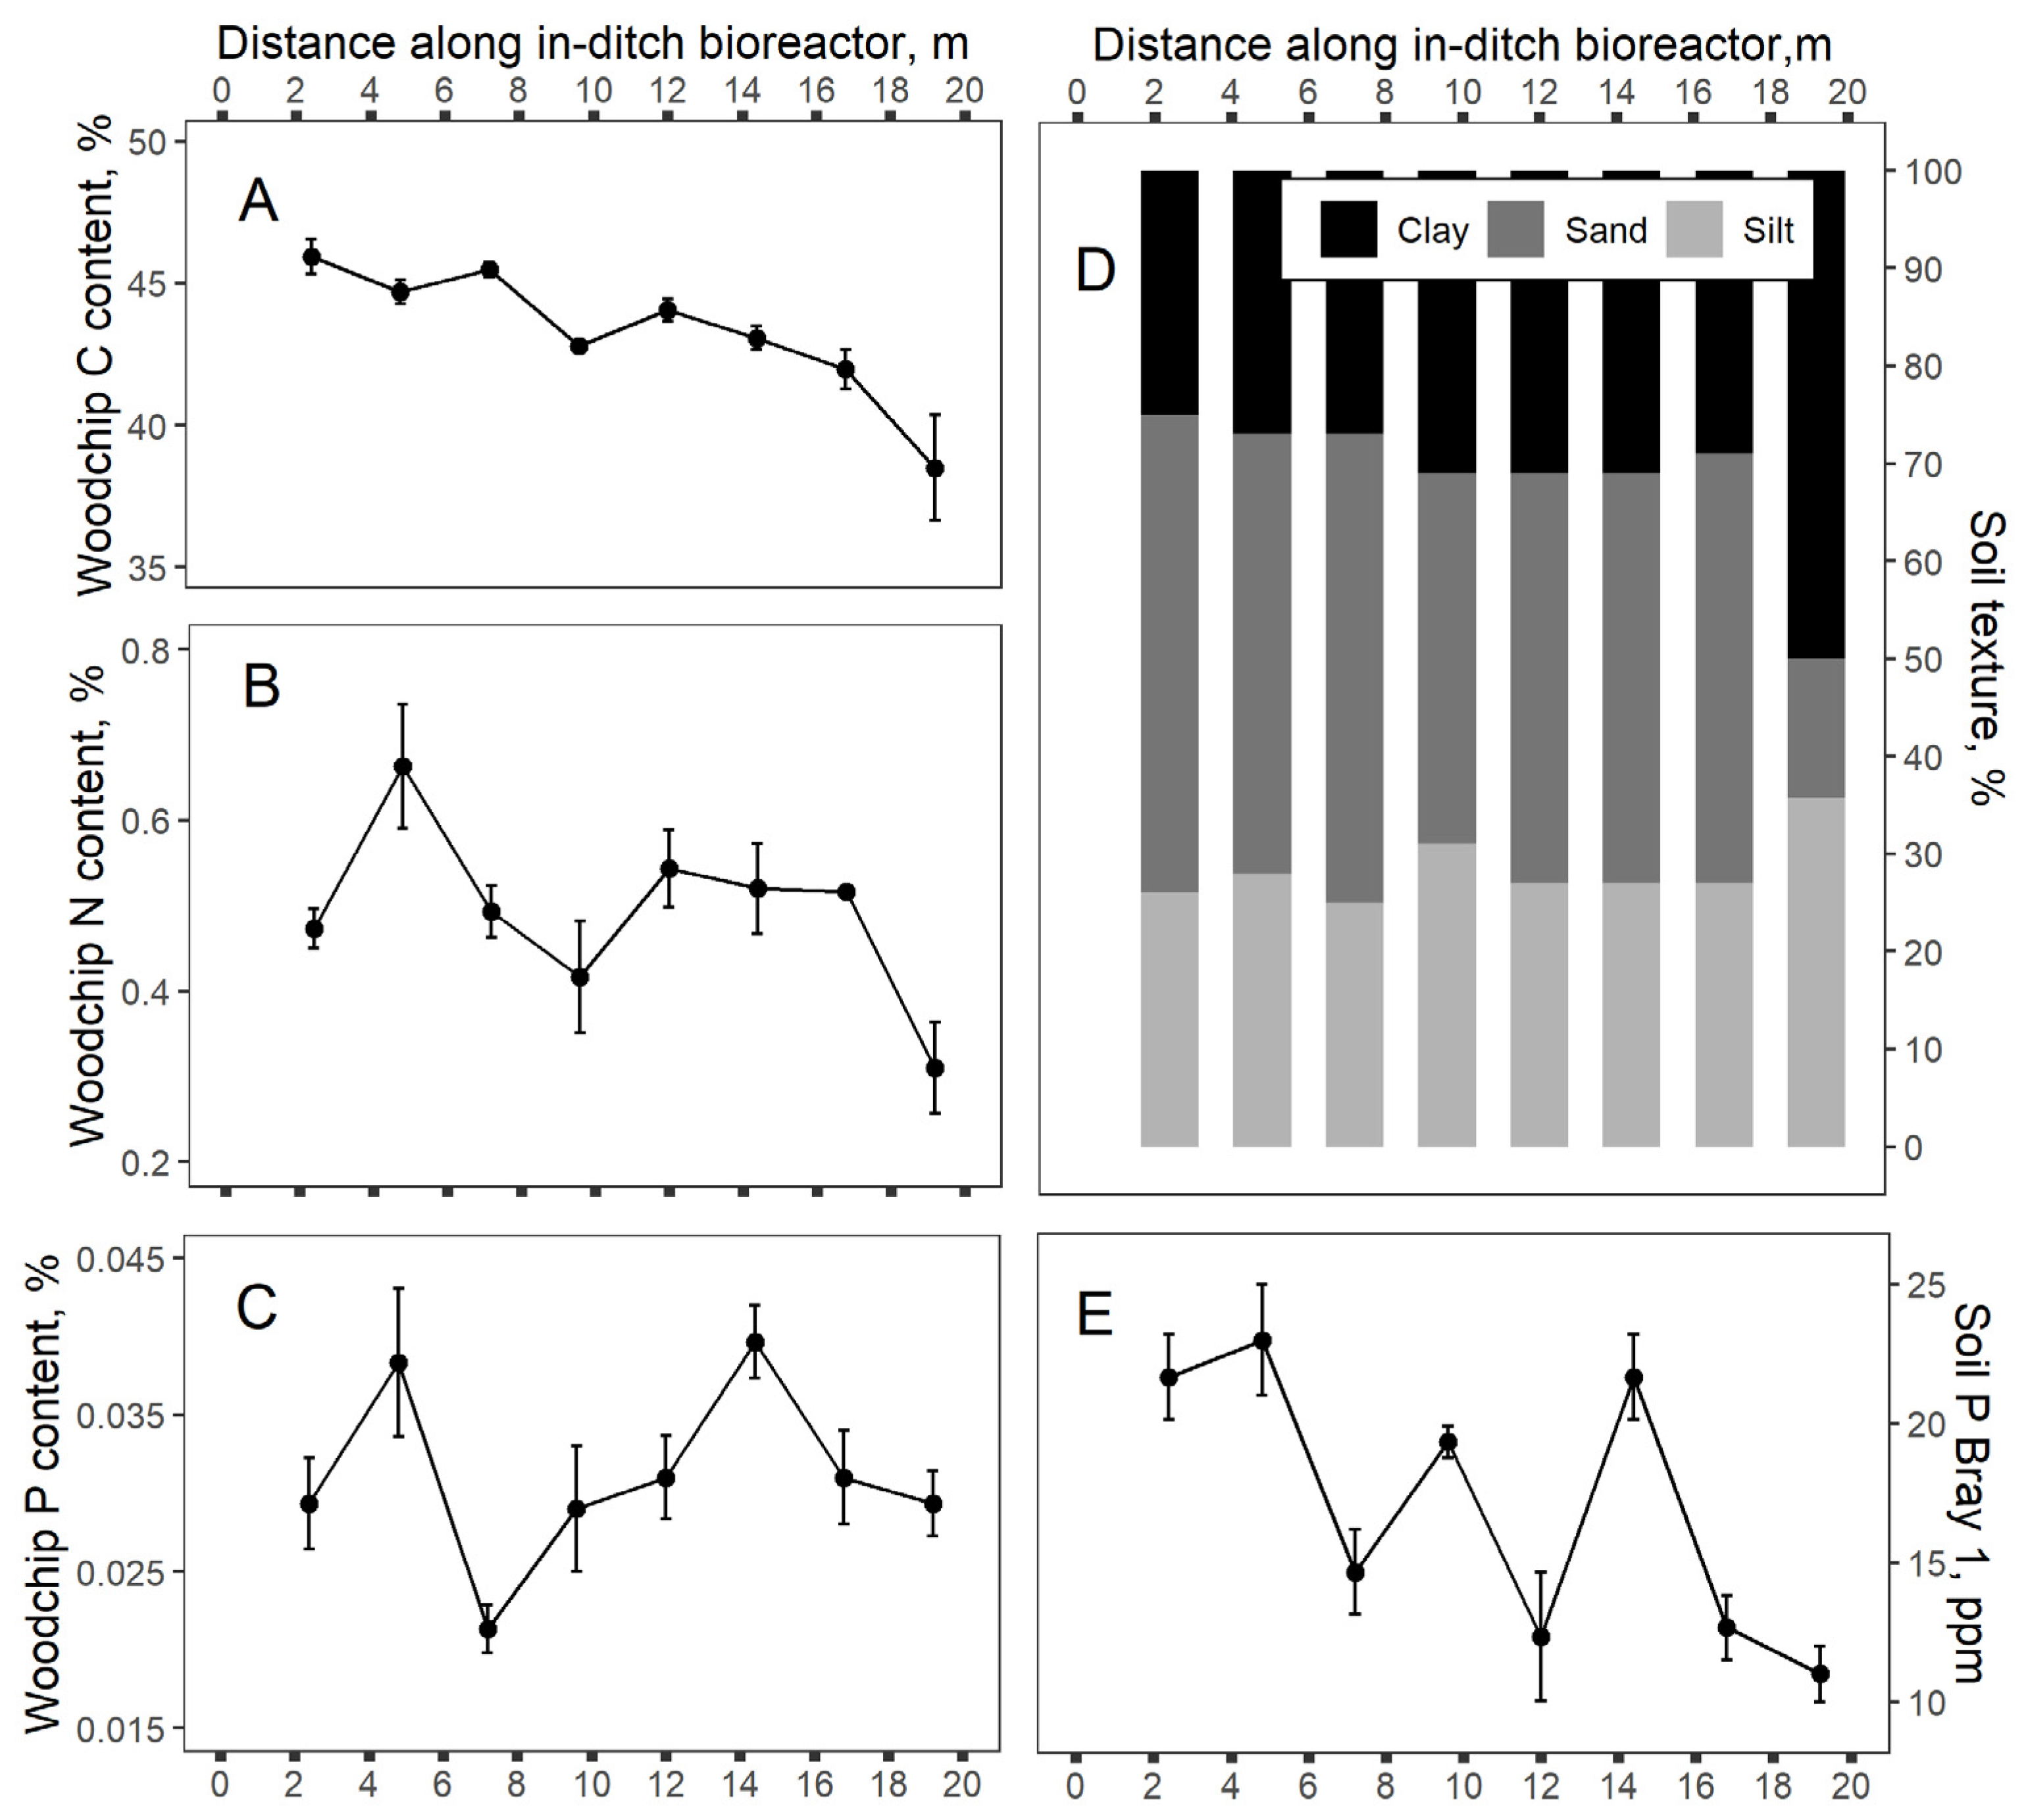
3.2. Microbial and Physiochemical Properties of Woodchips and Soil

Denitrification potential of the in-ditch woodchips (2950 ± 580 ng N g−1 dry media h−1) was significantly higher than all other sediment or woodchip samples, including the diversion bioreactor woodchips (620 ± 310 ng N g−1 dry media h−1, Figure 4). Values were within the range reported in the literature (100–11,000 ng N g−1 h−1) [20,30,31]. The in-ditch woodchip’s high potential to provide denitrification was consistent with low nitrate observed within the pore water (Supplemental Figure S6). The lack of flow in the diversion bioreactor may have prevented the formation of a robust community of denitrifiers, which may explain the lower potential denitrification rate compared to the in-ditch woodchips (Figure 4). There were relatively short periods of saturation of the woodchip profile, and aerobic conditions may not have promoted an optimal denitrifying community.
Microbial community characteristics can influence denitrification rates in woodchip bioreactors [32,33]. Since a labile carbon supplement was used in the denitrification assays, the low denitrification potential of the diversion bioreactor woodchips was likely caused by differences in the microbial community instead of carbon availability. With the methods used, it was unclear whether differences in denitrification potential were due to differences in community composition or abundance. This study did not assess microbial community composition; however, previous studies have shown diverse fungal and microbial communities in woodchip bioreactors [34]. Microbial analyses in woodchip bioreactors have shown evidence of dissimilatory reduction of nitrate to ammonium, although denitrification was still the dominant nitrate reduction process [35,36].
In-ditch bioreactor woodchip C content was significantly lower after 25 months (43.3 ± 2.4%) compared to woodchips at time of construction (47.8 ± 0.3%, Table 1), while relative N content increased in the aged in-ditch woodchips. The lower C content of the unwashed, in-ditch woodchips (17.4 ± 0.5%; Table 1), which were used in the denitrification potential tests, reflected the relatively low C content of soil particles attached to the woodchip surface. Woodchips from the diversion bioreactor were not significantly different from initial woodchips for woodchip C, N, or P content or C:N ratio, and had significantly higher C:N ratio relative to in-ditch woodchips after both had been in place for 25 months (Table 1). Woodchip C:N ratios decrease over time as carbon is consumed due to a variety of processes [37], and the woodchips from both locations in the present study were comparable to woodchips excavated from a 4-year-old bioreactor in Iowa (C:N ratio 52–140) [38]. Although much of the woodchip profile for the diversion bioreactor was frequently unsaturated and should have seen greater degradation under unsaturated conditions [30], the woodchip bags excavated from the sampling ports were located at the bioreactor bottom. This portion of the bioreactor was saturated for longer periods, which could help explain observed C:N ratios.
The in-ditch bioreactor had higher denitrification potential rates than the ditch diversion bioreactor for both woodchips and soil (Figure 4). Settled soil on top of the in-ditch bioreactor and the soil cap on of the ditch diversion bioreactor provided rates of 600 ± 45 and 51 ± 52 ng N g−1 dry media h−1, respectively. Settled sediment on top of the in-ditch bioreactor was more frequently saturated with nitrate-laden water than the soil cap of the ditch diversion bioreactor. Therefore, the soil cap likely did not have adequate conditions suitable for development of denitrifying organisms. In addition, settled sediment on top of the in-ditch bioreactor was higher in organic matter than that of the soil cap (3.4 ± 0.2% vs. 2.5 ± 0.5%, respectively; Table S1). These differences likely contributed to the significant difference in denitrification potentials.
Distance from the upstream edge of the in-ditch bioreactor was negatively correlated with in-ditch woodchip C (R2 = 0.70, p < 0.001, Figure 5A) and N (R2 = 0.16, p = 0.03, Figure 5B) contents, but not C:N ratio (p = 0.14) after 25 months from construction. While the in-ditch bioreactor woodchips had significantly greater P content than initial woodchips or diversion woodchips (Table 1: 0.051 ± 0.001 versus 0.011 ± 0.001 and 0.010 ± 0.001%P, respectively), there was no significant longitudinal trend in that P content (Figure 5C). However, the Bray-1P content of the soil settled on the top of the in-ditch bioreactor was negatively correlated with distance from the upstream edge of bioreactor (R2 = 0.39, p < 0.001, Figure 5E). Settled soil upstream tended to have higher sand and lower clay content relative to downstream (Figure 5D), consistent with settling velocities [39].
Pfannerstill et al. indicated a reactive ditch bioreactor in Germany did not consistently reduce dissolved or total phosphorus concentrations or loads [6]. Although woodchips have been shown to reduce dissolved phosphorus concentrations [14,40,41], it is likely that sediment accumulation associated with an in-dich bioreactor would be a greater sink for phosphorus in-ditch drainage water. Burial of the woodchip bag due to settled sediment, however, impeded hydraulic connectivity between the water column and woodchips, limiting the ability of the bioreactor to achieve its primary objective of reducing nitrate loads. It is likely the in-ditch bioreactor provided some particulate P reduction benefit for water quality via sedimentation, but the possible net gain of this is unclear given some soil disturbance during bioreactor construction and given that settled P can later become mobilized.

4. Conclusions

A paired bioreactor designed to avoid restricting flow capacity while still treating as much of the hydraulic loading as possible for a centralized conveyance ditch did not result in significantly lower downstream nitrate concentrations. Performance of both system components, the in-ditch bioreactor and the diversion bioreactor, was affected by low loading, likely a result of the passive (i.e., “simple”) design which was a design objective. The lack of an infiltration feature at the in-ditch bioreactor, combined with settled sediment over time, limited the flow connection of between the water column and in-ditch bioreactor. Raising the surface of the woodchip bed above the ditch water level [6] may be an effective strategy for avoiding sediment accumulation on the bioreactor. The ditch diversion bioreactor was not intended to treat base flows, but also treated less flow than expected due to the passive design. Nevertheless, the large amount of N transported in this ditch, as well as the millions of kilometers of similar conveyance systems across the US Midwest, suggest the general design idea (i.e., treating flow in centralized ditches) still merits consideration. In the future, the diversion bioreactor will be retrofitted with a pumping set-up to more consistently deliver flow to maximize hydraulic loading to the bioreactor.
Deeper investigation of the woodchips and bioreactor-associated soils illustrated that while ultimate nitrate removal was less than expected, water quality benefit via denitrification and sedimentation was possible. The high denitrification potential of the in-ditch woodchips paired with the very low nitrate concentrations in the pore water samples illustrated the ability of this simple bioreactor to reduce nitrate via denitrification. Sediment accumulation over the top of this bioreactor exacerbated loss of hydraulic connectivity, but differences in settled soil texture and soil P content along the bioreactor length may have illustrated a water quality tradeoff with settled sediment and particulate P. Even so, the ultimate fate of that settled P is unclear and improved hydraulic connection (both initially and over time) with the woodchips should be an aim for future in-ditch designs.
Woodchips in the diversion bioreactor had significantly lower denitrification potential compared to the in-ditch woodchips after 25 months, despite both woodchips being from the same source. However, the in-ditch woodchip’s high denitrification potential indicated similarly high potential could be possible within the diversion bioreactor woodchips if nitrate and anoxic conditions were provided via sufficient flow routing. High nitrate concentration reductions for water that was routed into the diversion bioreactor during this monitoring period further confirmed this potential. After more than 2 y, the C content and C:N ratio of the diversion bioreactor woodchips were not statistically different from the initial woodchips which corroborated the future potential for nitrate removal in this bioreactor, hence the importance of the future work with pumps.

Supplementary Materials

The following are available online at https://www.mdpi.com/article/10.3390/w14010056/s1, Figure S1. Photo of in-ditch bioreactor; Figure S2. Photo of drainage ditch; Figure S3. Photo of diversion bioreactor ditch; Figure S4. Photo of riser structure; Figure S5. Regression for in-ditch water depth and velocity; Figure S6. Nitrate concentrations in pore water of in-ditch bioreactor; Figure S7. Downstream nitrate concentrations; Table S1. Organic matter and nutrient content of soils.

Author Contributions

Conceptualization, R.C. (Reid Christianson), R.A.C.C. and L.C.; Methodology, R.C. (Reid Christianson), R.A.C.C. and L.C.; Formal Analysis, L.C., B.M. and M.F.; Investigation, R.C. (Ronnie Chacon), N.W. and M.F.; Data Curation, B.M.; Writing—Original Draft Preparation, B.M.; Writing—Review and Editing, R.C. (Reid Christianson), R.A.C.C., L.C. and M.F.; Visualization, L.C. and B.M.; Supervision, L.C.; Project Administration, R.A.C.C. and L.C.; Funding Acquisition, L.C. All authors have read and agreed to the published version of the manuscript.

Funding

This work was funded by the Illinois Nutrient Research and Education Council (IL NREC) Project #2017-4-360498-302. Additionally funding was provided by project NR185A12XXXXC004 CESU under the Great Rivers Umbrella Agreement 68-3A75-18-518 504 (USDA NRCS), as well as Grant no. 2018-67011-28071/Project Accession #1015478 (USDA NIFA).

Acknowledgments

The authors would like to thank M. Wallace for lab analysis; A.P. Sanchez, J. Kandume, and A. Muñoz for help during site construction and monitoring.

Conflicts of Interest

The authors declare no conflict of interest.

References

  1. Schipper, L.A.; Robertson, W.D.; Gold, A.J.; Jaynes, D.B.; Cameron, S.C. Denitrifying bioreactors—An approach for reducing nitrate loads to receiving waters. Ecol. Eng. 2010, 36, 1532–1543. [Google Scholar] [CrossRef]
  2. Díaz-García, C.; Martínez-Sánchez, J.J.; Maxwell, B.M.; Franco, J.A.; Álvarez-Rogel, J. Woodchip bioreactors provide sustained denitrification of brine from groundwater desalination plants. J. Environ. Manag. 2021, 289, 112521. [Google Scholar] [CrossRef]
  3. Pulkkinen, J.T.; Ronkanen, A.; Pasanen, A.; Kiani, S.; Kiuru, T.; Koskela, J.; Lindholm-Lehto, P.; Lindroos, A.J.; Muniruzzaman, M.; Solismaa, L.; et al. Start-up of a “zero-discharge” recirculating aquaculture system using woodchip denitrification, constructed wetland, and sand infiltration. Aquacult. Eng. 2021, 93, 102161. [Google Scholar] [CrossRef]
  4. Robertson, W.D.; Merkley, L. In-stream bioreactor for agricultural nitrate treatment. J. Environ. Qual. 2009, 38, 230–237. [Google Scholar] [CrossRef] [Green Version]
  5. Christianson, L.E.; Collick, A.S.; Bryant, R.B.; Rosen, T.; Bock, E.M.; Allen, A.L.; Kleinman, P.J.A.; May, E.B.; Buda, A.R.; Robinson, J.; et al. Enhanced Denitrification Bioreactors Hold Promise for Mid-Atlantic Ditch Drainage. Agric. Environ. Lett. 2017, 2, 170032. [Google Scholar] [CrossRef] [Green Version]
  6. Pfannerstill, M.; Kühling, I.; Hugenschmidt, C.; Trepel, M.; Fohrer, N. Reactive ditches: A simple approach to implement denitrifying wood chip bioreactors to reduce nitrate exports into aquatic ecosystems? Environ. Earth Sci. 2016, 75, 1–10. [Google Scholar] [CrossRef]
  7. Chase, E.H.; Schneider, R.L.; Baker, N.J.; Dunn, S.J. Retrofitting the rural roadside ditch network to treat nitrogen from agricultural runoff using woodchip bioreactors. In Proceedings of the 12th International Conference on Low-Volume Roads, Kalispell, MT, USA, 15–18 September 2019; pp. 320–324. [Google Scholar]
  8. Addy, K.; Gold, A.J.; Christianson, L.E.; David, M.B.; Schipper, L.A.; Ratigan, N.A. Denitrifying bioreactors for nitrate removal: A meta-analysis. J. Environ. Qual. 2016, 45, 873–881. [Google Scholar] [CrossRef]
  9. Sarris, T.S.; Burbery, L.F. Stochastic multi-objective performance optimization of an in-stream woodchip denitrifying bioreactor. Ecol Eng. 2018, 124, 38–50. [Google Scholar] [CrossRef]
  10. USDA NRCS Illinois. Conservation Practice Standard Denitrifying Bioreactor Code 605 (605-CPS); United States Department of Agricultural Natural Resources Conservation Service: Champaign, IL, USA, 2020.
  11. Deutsch, B.; Kahle, P.; Voss, M. Assessing the source of nitrate pollution in water using stable N and O isotopes. Agron. Sustain. Dev. 2006, 26, 263–267. [Google Scholar] [CrossRef]
  12. Bernhardt, E.S.; Hall, R.O., Jr.; Likens, G.E. Whole-system estimates of nitrification and nitrate uptake in streams of the Hubbard Brook Experimental Forest. Ecosystems 2002, 5, 419–430. [Google Scholar] [CrossRef]
  13. Wickramarathne, N.M.; Cooke, R.A.; Book, R.; Christianson, L.E. Denitrifying woodchip bioreactor leachate tannic acid and true color: Lab and field studies. Trans. ASABE 2020, 63, 1747–1757. [Google Scholar] [CrossRef]
  14. Sanchez Bustamente-Bailon, A.P.; Margenot, A.; Cooke, R.A.; Christianson, L.E. Phosphorus removal in denitrifying woodchip bioreactors varies by wood type and water chemistry. Environ. Sci. Pollut. Res. 2021. [Google Scholar] [CrossRef]
  15. USEPA. Volunteer Stream Monitoring: A Methods Manual. 1997. Available online: https://www.epa.gov/sites/default/files/2015-06/documents/stream.pdf (accessed on 27 December 2021).
  16. Muste, M.; Lee, K.; Kim, D.; Bacotiu, C.; Oliveros, M.R.; Cheng, Z.; Quintero, F. Revisiting hysteresis of flow variables in monitoring unsteady streamflows. J. Hydraul. Res. 2020, 58, 867–887. [Google Scholar] [CrossRef]
  17. Christianson, L.; Christianson, R.; Lipka, A.; Bailey, S.; Chandrasoma, J.; McCoy, C.; Fontes, G.P.; Roh, J.; Bailon, A.P.; Wickramarathne, N.M.; et al. Calibration of stainless steel-edged V-notch weir stop logs for water level control structures. Appl. Eng. Agric. 2019, 35, 745–749. [Google Scholar] [CrossRef]
  18. Williams, M.R.; King, K.W.; Macrae, M.L.; Ford, W.; Van Esbroeck, C.; Brunke, R.I.; English, M.C.; Schiff, S.L. Uncertainty in nutrient loads from tile-drained landscapes: Effect of sampling frequency, calculation algorithm, and compositing strategy. J. Hydrol. 2015, 530, 306–316. [Google Scholar] [CrossRef]
  19. Tiedje, J.M.; Simkins, S.; Groffman, P.M. Perspectives on measurement of denitrification in the field including recommended protocols for acetylene based methods. Plant Soil 1989, 115, 261–284. [Google Scholar] [CrossRef]
  20. Wickramarathne, N.M.; Christianson, L.E.; Foltz, M.E.; Zilles, J.L.; Christianson, R.D.; Cooke, R.A. Biological Nitrate Removal with Emerald Ash Borer-Killed Ash and High-Tannin Oak Woodchips. Front. Environ. Sci. 2021, 9, 73. [Google Scholar] [CrossRef]
  21. Foltz, M.E.; Kent, A.D.; Koloutsou-Vakakis, S.; Zilles, J.L. Influence of rye cover cropping on denitrification potential and year-round field N2O emissions. Sci. Total Environ. 2021, 765, 144295. [Google Scholar] [CrossRef]
  22. R Core Team. R: A Language and Environment for Statistical Computing; R Foundation for Statistical Computing: Vienna, Austria, 2017; Available online: https://www.R-project.org/ (accessed on 1 December 2021).
  23. García-Gutiérrez, C.; Pachepsky, Y.; Martín, M.Á. Saturated hydraulic conductivity and textural heterogeneity of soils. Hydrol. Earth Syst. Sci. 2018, 22, 3923–3932. [Google Scholar] [CrossRef] [Green Version]
  24. Chun, J.; Cooke, R.; Eheart, J.; Kang, M. Estimation of flow and transport parameters for woodchip-based bioreactors: I. laboratory-scale bioreactor. Biosyst. Eng. 2009, 104, 384–395. [Google Scholar] [CrossRef]
  25. Cameron, S.G.; Schipper, L.A. Nitrate removal and hydraulic performance of organic carbon for use in denitrification beds. Ecol. Eng. 2010, 36, 1588–1595. [Google Scholar] [CrossRef]
  26. Hertzberger, A.; Pittelkow, C.; Harmel, R.; Christianson, L. The MANAGE Drain Concentration database: A new tool compiling North American drainage nutrient concentrations. Agric. Water Manag. 2019, 216, 113–117. [Google Scholar] [CrossRef]
  27. Maxwell, B.M.; Birgand, F.; Schipper, L.A.; Christianson, L.E.; Tian, S.; Helmers, M.J.; Williams, D.J.; Chescheir, G.M.; Youssef, M.A. Drying–rewetting cycles affect nitrate removal rates in woodchip bioreactors. J. Environ. Qual. 2019, 48, 93–101. [Google Scholar] [CrossRef]
  28. Christianson, L.E.; Bhandari, A.; Helmers, M.J.; Kult, K.J.; Sutphin, T.; Wolf, R. Performance evaluation of four field-scale agricultural drainage denitrification bioreactors in Iowa. Trans. ASABE 2012, 55, 2163. [Google Scholar] [CrossRef] [Green Version]
  29. Lepine, C.; Christianson, L.; Sharrer, K.; Summerfelt, S. Optimizing hydraulic retention times in denitrifying woodchip bioreactors treating recirculating aquaculture system wastewater. J. Environ. Qual. 2016, 45, 813–821. [Google Scholar] [CrossRef]
  30. Moorman, T.B.; Parkin, T.B.; Kaspar, T.C.; Jaynes, D.B. Denitrification activity, wood loss, and N2O emissions over 9 years from a wood chip bioreactor. Ecol. Eng. 2010, 36, 1567–1574. [Google Scholar] [CrossRef]
  31. Hathaway, S.K.; Bartolerio, N.A.; Rodríguez, L.F.; Kent, A.D.; Zilles, J.L. Denitrifying bioreactors resist disturbance from fluctuating water levels. Front. Environ. Sci. 2017, 5, 35. [Google Scholar] [CrossRef]
  32. Zhao, J.; Feng, C.; Tong, S.; Chen, N.; Dong, S.; Peng, T.; Jin, S. Denitrification behavior and microbial community spatial distribution inside woodchip-based solid-phase denitrification (W-SPD) bioreactor for nitrate-contaminated water treatment. Bioresour. Technol. 2018, 249, 869–879. [Google Scholar] [CrossRef] [PubMed]
  33. Fatehi-Pouladi, S.; Anderson, B.C.; Wootton, B.; Button, M.; Bissegger, S.; Rozema, L.; Weber, K.P. Interstitial water microbial communities as an indicator of microbial denitrifying capacity in wood-chip bioreactors. Sci. Total Environ. 2019, 655, 720–729. [Google Scholar] [CrossRef]
  34. Aalto, S.L.; Suurnäkki, S.; von Ahnen, M.; Tiirola, M.; Pedersen, P.B. Microbial communities in full-scale woodchip bioreactors treating aquaculture effluents. J. Environ. Manag. 2022, 301, 113852. [Google Scholar] [CrossRef]
  35. Hellman, M.; Hubalek, V.; Juhanson, J.; Almstrand, R.; Peura, S.; Hallin, S. Substrate type determines microbial activity and community composition in bioreactors for nitrate removal by denitrification at low temperature. Sci. Total Environ. 2021, 755, 143023. [Google Scholar] [CrossRef] [PubMed]
  36. Jéglot, A.; Sørensen, S.R.; Schnorr, K.M.; Plauborg, F.; Elsgaard, L. Temperature Sensitivity and Composition of Nitrate-Reducing Microbiomes from a Full-Scale Woodchip Bioreactor Treating Agricultural Drainage Water. Microorganisms 2021, 9, 1331. [Google Scholar] [CrossRef] [PubMed]
  37. Ghane, E.; Feyereisen, G.W.; Rosen, C.J.; Tschirner, U.W. Carbon quality of four-year-old woodchips in a denitrification bed treating agricultural drainage water. Trans. ASABE 2018, 61, 995–1000. [Google Scholar] [CrossRef]
  38. Schaefer, A.; Werning, K.; Hoover, N.; Tschirner, U.; Feyereisen, G.; Moorman, T.B.; Howe, A.C.; Soupir, M.L. Impact of flow on woodchip properties and subsidence in denitrifying bioreactors. Agrosyst. Geosci. Environ. 2021, 4, 20149. [Google Scholar] [CrossRef]
  39. Haan, C.T.; Barfield, B.J.; Hayes, J.C. Design Hydrology and Sedimentology for Small Catchments; Elsevier: Amsterdam, The Netherlands, 1994. [Google Scholar]
  40. Hua, G.; Salo, M.W.; Schmit, C.G.; Hay, C.H. Nitrate and phosphate removal from agricultural subsurface drainage using laboratory woodchip bioreactors and recycled steel byproduct filters. Water Res. 2016, 102, 180–189. [Google Scholar] [CrossRef]
  41. Husk, B.; Sanchez, J.; Anderson, B.; Whalen, J.; Wootton, B. Removal of phosphorus from agricultural subsurface drainage water with woodchip and mixed-media bioreactors. J. Soil Water Conserv. 2018, 73, 265–275. [Google Scholar] [CrossRef]
Figure 1. The paired bioreactor system with in-ditch and diversion bioreactor on adjacent bank. Flow entered the paired system through the cinder block weir (A). Surface water entered the diversion bioreactor through the in-ditch riser structure (B), flowed from the inlet flow manifold (C) to the outlet flow manifold (D), and exited through the outlet water level control structure (E). Water samples for measuring nitrate entering the bioreactors were collected at Point A. Water samples measuring nitrate leaving the diversion and in-ditch bioreactor were collected at Points E and F, respectively, and at Point G to determine total nitrate removal by the paired system.
Water 14 00056 g001
Figure 2. Nitrate concentrations upstream (black ×) and downstream (red circle) of the in-ditch bioreactor (A). Estimated flow rate (solid black line) and water level (dashed blue line) in the ditch, measured at the cinder block weir (B).
Water 14 00056 g002
Figure 3. Nitrate concentrations at the bioreactor inlet (black ×, note these are the same as in Figure 2A) and bioreactor outlet (light blue circle) of the diversion bioreactor (A). Estimated flow rate (solid black line) and measured water level (dashed blue line) in the outlet control structure (B).
Water 14 00056 g003
Figure 4. Mean denitrification potential of unwashed woodchips and soil samples taken from the in-ditch and diversion bioreactor 25 months after installation. Lower-case letters indicate differences at α = 0.05. Error bars indicate standard deviations.
Water 14 00056 g004
Figure 5. In-ditch bioreactor woodchip carbon (A), nitrogen (B), and phosphorus (C) content as well as soil texture (D) and soil Bray-1 phosphorus (E) taken from samples collected every ~2.4 m, along the in-ditch bioreactor 25 months after construction. Plotted points are the mean (n = 3) with error bars showing standard deviation for all analyzes except soil texture (n = 1).
Water 14 00056 g005
Table 1. Nutrient content of woodchips from the in-ditch and diversion bioreactors initially and after 25 months. Mean ± standard deviation shown (n = 3 for top two rows, n = 24 for in-ditch, washed, n = 12 for diversion, unwashed). Different lower-case letters in a given column represent significant differences at p < 0.05 probability level.
Bioreactor and Sample Location% Carbon% Nitrogen% PhosphorusC:N Ratio
Initial woodchips used to construct both bioreactors47.8 ± 0.3 a0.30 ± 0.05 b0.011 ± 0.001 c161 ± 23 a
In-ditch bioreactor woodchips, unwashed †17.4 ± 0.5 c0.36 ± 0.02 ab0.051 ± 0.001 a48 ± 2 c
In-ditch bioreactor woodchips, washed ‡43.3 ± 2.3 b0.49 ± 0.10 a0.031 ± 0.006 b92 ± 20 b
Diversion bioreactor, unwashed †46.9 ± 1.2 a0.36 ± 0.09 b0.010 ± 0.001 c137 ± 36 a
† unwashed woodchips were used in the denitrification potential tests. ‡ Aggregated sample from each of eight in-ditch sample locations.
Publisher’s Note: MDPI stays neutral with regard to jurisdictional claims in published maps and institutional affiliations.

