Article

Aqueous Mercury Removal with Carbonaceous and Iron Sulfide Sorbents and Their Applicability as Thin-Layer Caps in Mercury-Contaminated Estuary Sediment

1
Graduate Institute of Environmental Engineering, National Taiwan University, No. 1, Sec. 4, Roosevelt Rd., Taipei 106, Taiwan
2
Institute of Environmental Engineering and Management, National Taipei University of Technology, No. 1, Sec. 3, Chung-Hsiao E. Rd., Taipei 106, Taiwan
*
Author to whom correspondence should be addressed.
Water 2020, 12(7), 1991; https://doi.org/10.3390/w12071991
Submission received: 7 May 2020 / Revised: 10 July 2020 / Accepted: 12 July 2020 / Published: 14 July 2020

Abstract

:
This study aimed to investigate the Hg removal efficiency of iron sulfide (FeS), sulfurized activated carbon (SAC), and raw activated carbon (AC) sorbents influenced by salinity and dissolved organic matter (DOM), and the effectiveness of these sorbents as thin layer caps on Hg-contaminated sediment remediation via microcosm experiments to decrease the risk of release. In the batch adsorption experiments, FeS showed the greatest Hg2+ removal efficiencies, followed by SAC and AC. The effect of salinity levels on FeS was insignificant. In contrast, the Hg2+ removal efficiency of AC and SAC increased as increasing the salinity levels. The presence of DOM tended to decrease Hg removal efficiency of sorbents. Microcosm studies also showed that FeS had the greatest Hg sorption in both freshwater and estuary water; furthermore, the methylmercury (MeHg) removal ability of sorbents was greater in the freshwater than that in the estuary water. Notably, for the microcosms without capping, the overlying water MeHg in the estuary microcosm (0.14−1.01 ng/L) was far lesser than that in the freshwater microcosms (2.26−11.35 ng/L). Therefore, Hg compounds in the freshwater may be more bioavailable to microorganisms in methylated phase as compared to those in the estuary water. Overall, FeS showed the best Hg removal efficiency, resistance to salinity, and only slightly affected by DOM in aqueous adsorption experiments. Additionally, in the microcosms, AC showed as the best MeHg adsorber that help inhibiting the release of MeHg into overlying and decreasing the risk to the aqueous system.

1. Introduction

Mercury (Hg) has been known as a global contaminant due to the characteristics of long-range transport in the atmosphere, persistence in the environment, bioaccumulation in the food chain, and adverse effects in human health and ecosystem [1]. The increased accumulation of Hg compounds in sediment may cause the high possibility of Hg being transformed to methylmercury (MeHg) by organisms, which is a neurotoxic compound occurred under anoxic conditions [2,3,4,5]. The bioaccumulation and biomagnification of MeHg via food chain transfer may pose a high risk to human through fish consumption [6,7]. Therefore, the strategies for sediment remediation are needed to decrease the Hg contaminant release and the possibility of direct or indirect contact with benthic organisms and water surface.
In-situ capping is a feasible approach to remediate contaminated sediment. The main approach is to allow the sediment left in place but decreasing the chance of further contamination from resuspension of contaminants by the capping layer. This technique could decrease the need for handing sediment and decrease the potential of exposure and consequential spills of sediment. The cost is relatively low as compared to traditional dredging and excavation. Thin layer capping may refer as active capping, which involves a chemically reactive material placing in the subaqueous to sequestrate the emission of contaminants from sediment and decrease the bioavailability, mobility, and toxicity of contaminants [8]. Owing to the physical and chemical sorption properties of reactive materials, the amount of sorbents needed and the thickness of the capping layer to achieve the considerable results are lesser as compared to traditional capping [8]. Besides, remediation technology not only decreases the cost, but also minimizes the exposure of benthic organisms to contaminated sediment and decreases the ecological risk associated with contaminated sediments [9].
The active materials may carry a series of reactions to remove contaminants, adsorption, absorption, and precipitation of contaminants and shift them from the aqueous phase to a solid. It works by increasing the contaminated-solid partition coefficient and extend the isolation time before contaminant breaking through the capping layer. A wide variety of active materials are applied and preferred according to the specific conditions of the remediation site. Carbonaceous materials such as activated carbon (AC), biochars, and surface-modified black carbon could effectively decrease organic contaminants and immobilize Hg. AC has several functional groups such as carboxyl, lactone, and phenolic groups. With its high specific surface area, AC has the potential to be an option for remediation of organic pollutant and Hg-contaminated sites [10,11,12].
Sulfurized activated carbon (SAC) is generally formed by heating the carbon in the presence of elemental sulfur [13,14] or sulfurous gases [15,16]. SAC provides sulfur-containing functional groups, which show high affinity for Hg compounds to form mercuric sulfide at the surface. Hence, SAC has been verified to further enhance the adsorption capacity of Hg as compared to untreated AC in aqueous adsorption tests [17].
Iron sulfide (FeS) minerals have been widely applied for Hg immobilization on account of the high affinity to Hg ions [18,19,20,21,22]. The mercuric sulfide (HgS) is a stable compound and hardly soluble with a low solubility product constant (Ksp) of 2 × 10−54 for red cinnabar [23] and 4 × 10−54 for black metacinnabar [24,25]. Additionally, FeS can effectively immobilize other divalent metals such as Cd2+, Co2+, Zn2+, and Ni2+ through adsorption and coprecipitation [26,27].
The objective of this research attempts to decrease the release of both ionic Hg (Hg2+) and MeHg from sediment to surface water and minimize the negative impacts of Hg contamination on the ecological environment with in-situ thin-layer capping practice, which has been shown to have potentials to decrease Hg contamination in sediment. However, previous application of in-situ capping was primarily focused on systems like contaminated river and lake sediment, there is few studies correlated with wetland and estuary, which are complex systems and effected by tidal flow. Besides, the knowledge of capping material’s stability is still limited and easily affected by environmental factors. Therefore, it is necessary to investigate the influence of these environmental factors, such as salinity and dissolved organic material (DOM), on the Hg sorption effectiveness of active capping materials. AC, SAC, and FeS were examined as the capping materials because of their potentially suitable physicochemical properties for Hg sorption. In this study, both aqueous batch sorption experiments and lab-scale vertical up-flow microcosms were conducted to comprehend the impact of environmental factors on the stability of materials and applicability to Hg-contaminated sediment.

2. Materials and Methods

The test sediment was collected from a Hg-contaminated seawater pond in China Petrochemical Development Corporation, An-Shun, Tainan city, Taiwan, designated as An-Shun site. The sediment within 0-15 cm depth was collected using a stainless crab bucket. For the sediment pretreatment procedures, the sediment was air dried in a hood, and the branches and benthic biotas were removed. The sediment was grounded and sieved through a 20-mesh screen to obtain homogenized sediment. After pretreatment, the sediment was stored at room temperature and covered with a black plastic bag.
Three kinds of sorbents were tested in the experiments. Commercial coconut-shell AC was obtained from Li Jing Viscarb Co. Ltd., Taiwan and sieved to obtain a size range from 18 to 30 mesh. Sieved AC was dried in an oven at 105 °C for 24 h. To obtain SAC, the commercial AC was pretreated with elemental sulfur following the protocol described in Hsi et al. [28]. The prepared SAC had the size range and pretreatment conditions the same as the AC and has been examined in our previous study [29]. FeS was purchased from Sigma-Aldrich.

2.1. Physicochemical Properties of Sorbents and Sediment

The physical properties of AC, SAC, and FeS were determined by using a physisorption analyzer (Micromeritics ASAP 2420, Norcross, GA, USA) based on the N2 adsorption-desorption isotherm at 77K. The Brunauer-Emmett-Teller (BET) equation was used to determine the specific surface area based on ASTM D6556-10 [30], and the micropore surface area and volume were calculated by using the t-plot method by using the Jura–Harkins equation: t = [13.99/(0.034 − log(p/p0)]0.5 [31].
Elemental analyses were conducted to measure the contents of elements including N, C, S, H (Elementar Vario EL cube, Langenselbold, Germany), and O (Thermo Fisher Flash 2000, Waltham, MA, USA) for AC and SAC. The water content of air-dried sediment was measured by the weight method based on the Taiwan Environmental Protection Administration (TEPA) standard method (NIEA S280.62C). Sediment pH value with 1:1 sediment to H2O ratio was measured by pH meter (Suntex SP-2300, New Taipei City, Taiwan) based on TEPA standard method (NIEA S410.62C). Sediment texture was measured by using the bouyoucos hydrometer method [32]. Sediment organic carbon (OC) content was measured by Walkley-Black wet oxidation [33]. Sediment cation exchange capacity (CEC) was measured by the ammonium acetate method based on the TEPA standard method (NIEA S201.61C). Detailed descriptions pertaining to characterizing the physical and chemical properties of sampled sediment can be found in Supplementary Material.

2.2. Aqueous Batch Sorption Experiment

The following steps were conducted in each aqueous batch sorption experiment:

2.2.1. Preparation of Hg Stock Solution

A serial dilution of Hg standard solution was made to the intended concentrations using analyzed reagent-grade Hg standard (1000 μg/mL dilute in nitric acid; Ultra Scientific), and adjust the pH value of the solution to 7.0 for various dosage and Hg concentration experiments. In contrast, the pH value of artificial waters was measured to be 7.6, 8.2, 8.3 for freshwater, estuary water, and seawater conditions, respectively, determined by the ions present (Table S1) to evaluate the effect of salinity and DOM on Hg adsorption. 0.1 M HNO3 or 0.1 M NaOH were used to adjust the pH of solutions.

2.2.2. Sample Preparation

(1)
The Hg stock solution of 50 mL was injected into the glass bottles.
(2)
The intended dosage of sorbents was added into the glass bottles and sealed with a rubber plug and aluminum cap.
(3)
The bottles were collected, including the samples of triplicate plus the blank.

2.2.3. Adsorption Process

The samples were put into the reciprocating water bath shaker and shaken at 130 rpm at 30 °C for 24 h to achieve an adsorption equilibrium.
In order to determine the suitable dosage of sorbents in the following experiments, the dosages 5, 10, 15, 20, 25, 30, 40 and 50 mg were tested with the Hg concentration of 74 µg/L in 50 mL solution. To determine the adsorption isotherms of sorbents, 4.3, 25, 56, and 135 µg/L Hg2+ were tested with 20 mg of sorbents in 50 mL solution.
In order to study the influence of salinity on Hg removal, the Hg2+ solutions (Hg concentration = 197.1 ± 10 µg/L) with three different salinity levels of artificial waters were tested in this study, including freshwater (pH = 7.6 ± 0.1), estuary water (pH = 8.2 ± 0.1), and seawater (pH = 8.3 ± 0.1). The compositions of freshwater and seawater are listed in Table S1. The freshwater was prepared according to Lewis et al. [34]; the seawater was prepared according to Kester et al. [35]. The estuary water was prepared by mixing fresh water and seawater at a 1:1 volume ratio. The concentrations of ion species listed in Table S1 were confirmed by ion chromatography (Metrohm 792 Basic IC, Herisau, Switzerland). Hg(II) species at various salinity levels were simulated by using MINTEQ 3.1 and listed in Table S2.
To evaluate the effect of DOM on sorbents’ Hg removal efficiency, the DOM solution was prepared by humic acid (HA, Sigma Aldrich, Saint Louis, MO, USA). HA of 10 mg was dissolved in ultrapure water and pre-adjusted to pH 7 by 0.1 M NaOH. The solution was stirred for 1 h to promote fast dissolution, and then filtered through a 0.2 μm mixed cellulose ester filter (DISMIC-25AS, Toyo Roshi Kaisha, Tokyo, Japan). The filtrate was collected and stored at 4 °C refrigerator before using. The actual concentration of DOM was verified by a Total OC analyzer (OI Analytical Aurora 1030W, College Station, TX, USA). The DOM was controlled at a concentration of approximately 2.5 mg-C/L and the Hg concentration is 196.2 ± 5 µg/L.

2.2.4. Preservation of Sample and Analysis

(1)
Each sample was preserved with 0.5% BrCl2 and estimated by cold vapor atomic fluorescence spectroscopy (CVAFS; Brooks Rand Automated Total Mercury System, Seattle, WA, USA).
(2)
The aqueous Hg removal efficiency by sorbents was calculated by the following Equation (1):
R = C 0 C t C 0 × 100 % ,
where R (%) is the Hg removal efficiency of sorbents, C0 (ng/L) is the initial Hg concentrations detected in blank solution, and Ct (ng/L) is the concentration of remaining Hg at any time.
Equation (2) was used to determine the partitioning coefficient (KD) for Hg adsorption by the adsorbent:
K D = q e C e
where qe is the equilibrium Hg adsorption capacity (mg/g) and Ce is the equilibrium Hg concentration (µM). The calculated values of KD were listed in Table S3.

2.3. Laboratory Microcosm Experiments

The microcosm was established according to Ting et al. [17] with modifications. Vertical up-flow columns were used to stimulate the release of Hg compounds and examine the efficiency of sorbent cappings on Hg sequestration (Figure 1). The dimensions of the column with an internal height of 15 cm and an internal diameter of 6 cm with glass fiber at the bottom. To investigate how the Hg-contaminated estuary sediment affected by salinity and to understand the stabilizing efficiency of AC, SAC, and FeS cappings, two systems, the freshwater and estuary systems, were set up. Each of the four columns contained 300 g of dried Hg-contaminated sediment from the An-Shun site. The total number of column is 8. Column A was capped with AC (9 g; i.e., 3 wt% AC added); column B was capped with SAC (9 g; i.e., 3 wt% SAC added); column C was capped with FeS (9 g; i.e., 3 wt% FeS added); column D was without capping as the control unit.
To start up the microcosms, dried Hg-contaminated sediment was firstly added into the column, filled with waters and waited for 24 h to settle. The microcosms were activated to circulate the waters in the column for sediment acclimation and stabilization, and counted as the operation day 1. The capping materials were applied on day 25. The total volume of water used for each experiment was 1.5 L. The water first entering into the bottom of the column was referred as inflow, then vertically moved upwards to fill the column, and then discharged through the outlet. The effluent water were stored in a temporary buffer tank and recirculated into the bottom of column in a closed system by using a peristaltic pump (Lead Fluid BT100S, Hebei, China) to maintain a flow rate of 1 mL/min. The reason that the effluent water was recirculated back to the microcosm column is to establish the mass balance of THg partitioning in various phases (i.e., sediment, capping material, overlying water) in a closed system and evaluate the THg accumulation ability of the various capping materials.
Periodic sampling was in progress while the microcosms were in operation. Each time, 100 mL of water sample was collected from the tube of outflow. After that, the temperature, pH (SunTex SR-2300, New Taipei City, Taiwan), dissolved oxygen (DO; Extech EXStik DO600, Nashua, NH, USA), electrical conductivity (EC; Taina EZDO 6021, Taichung, Taiwan), oxidation reduction potential (ORP; SunTex SR-2300, New Taipei City, Taiwan), trace metals concentration, total Hg (THg), MeHg, DOM, and anions were analyzed. The temporary buffer tank was then refilled with the artificial waters to maintain a constant water amount.
To measure the trace compound concentration, including metals, THg, MeHg, DOM, and anions, the water samples were filtered with 0.45 μm mixed cellulose ester filter (DISMIC-25AS, Toyo Roshi Kaisha, Tokyo, Japan). Trace metals were determined by Inductively couple plasma optical emission spectrometry (Agilent 700, Santa Clara, CA, USA) after the sample was acidified with 0.15% HNO3. Water samples for THg analysis were preserved by adding 0.5% BrCl2 solution and stored in 20 mL glass bottles. THg in sediment and water was analyzed following the USEPA Method 1631 and NIEA W331.50B protocols by using CVAFS. The water samples were preserved by adding 0.2% HCl and stored in 20 mL amber glass bottles in MeHg analysis. MeHg in sediment and water was analyzed following the USEPA Method 1630, NIEA W341.60B and NIEA W540.50B procedures by using gas chromatography/CVAFS (Brooks Rand MERX Integrated Automated MeHg Analyzer, Seattle, WA, USA).
Recovery of Hg in the microcosm system was evaluated based on the Hg concentration in overlying water, cap materials, and sediment. To determine the Hg concentration in cap materials and sediment, digestion was first conducted in a microwave system (Ethos 1600, Milestone, Shelton, CT, USA) with a power setting of 800 W (USEPA method 3051a). After digestion, the THg (μg/mg) in the solid phase was determined using CVAFS (USEPA method 245.7). QA/QC of data were confirmed based on Hsu et al. [29] and Wang et al. [36]. The recovery values for the QC samples of sediment of THg (NIST 2709a, 0.9 mg/kg) and MeHg (SQC-1238, 10 μg/kg) were 98.6 and 90.0%, respectively. For spiked sediment, the recovery values of THg and MeHg were 94.8 and 95.2%, and were 107.1 and 101.4% for water, respectively. The coefficient of determination (R2) of CVAFS for the aqueous Hg was regularly kept larger than 0.998, the recovery was within 96.2–120%, the precision was within 0.04–5.60%.

2.4. Statistical Analysis

A one-way ANOVA, followed by a least significant difference (LSD) test (p < 0.05), was used to determine the significance differences among microcosm tests with various capping materials (IBM SPSS statistics).

3. Results and Discussion

3.1. Physicochemical Properties of Sorbents

The physical and chemical properties of the three test sorbents, AC, SAC, and FeS, were summarized in Table 1. Because FeS is a non-porous mineral, its surface area and pore volume were much smaller than those of AC and SAC. Elemental analyses of AC and SAC showed that the oxygen and sulfur contents in SAC were increased after impregnation of sulfur on AC, hence SAC should be more favored for Hg2+ uptake because sulfur-containing groups on SAC had high affinity towards mercuric sulfide formation. The oxygenated groups are also known beneficial for Hg adsorption. The increase in the oxygen content after sulfur impregnation could be due to the reaction of S with C to form vaporized CS2 evolved from the SAC surface.

3.2. Aqueous Batch Adsorption Experiment

3.2.1. The Effects of the Sorbent Dosage

The influence of sorbent dosage on Hg removal has been investigated to find out the appropriate dosage of sorbents as a basis for subsequently study. The sorbent dosage determines the sorption capacity of sorbents for a given concentration of Hg2+ because it controls the sorbent-sorbate equilibrium of a system [37]. The effects of sorbents dosage on Hg sorption were studied in the dosage range of 5−60 mg in 50 mL Hg2+ solution. The results of AC, SAC, and FeS dosage are presented in Figure 2, and all experimental data are performed in triplicate. The Hg sorption capacity of AC first increased and then decreased as the Hg removal efficiency increased, due to the increment of AC dosage would provide more sorption active sites to take up Hg in a fixed Hg2+ initial concentration. The SAC and FeS showed a similar tendency as AC. Based on the result, the suggested optimum dosages for AC, SAC and FeS at a fixed initial concentration of Hg2+ were 30, 10, and 10 mg, respectively. Owning to Hg removal efficiency may be affected by both the properties and dosage of sorbents, the normalization and comparison of different types sorbents in the same mass benchmark were needed. Therefore, the appropriate dosage of sorbents was determined as 20 mg for the subsequent experiments in this research.

3.2.2. Effect of Initial Concentration of Hg2+

The batch experiments were tested within the initial concentration of Hg2+ from 5 to 135 µg/L using a diluted standard Hg2+ solution. The Hg sorption capacity of sorbents and the initial Hg2+ concentration is shown in Figure 3. The experimental results showed that the Hg sorption capacity of sorbents increased with the increment of the initial concentration of Hg2+, with linear adsorption behaviors within the test concentration range. The FeS could maintain a high Hg removal efficiency of up to 90% in the range of the initial concentration of Hg2+ given, which illustrates that FeS is an excellent sorbent for Hg removal followed by SAC and AC.

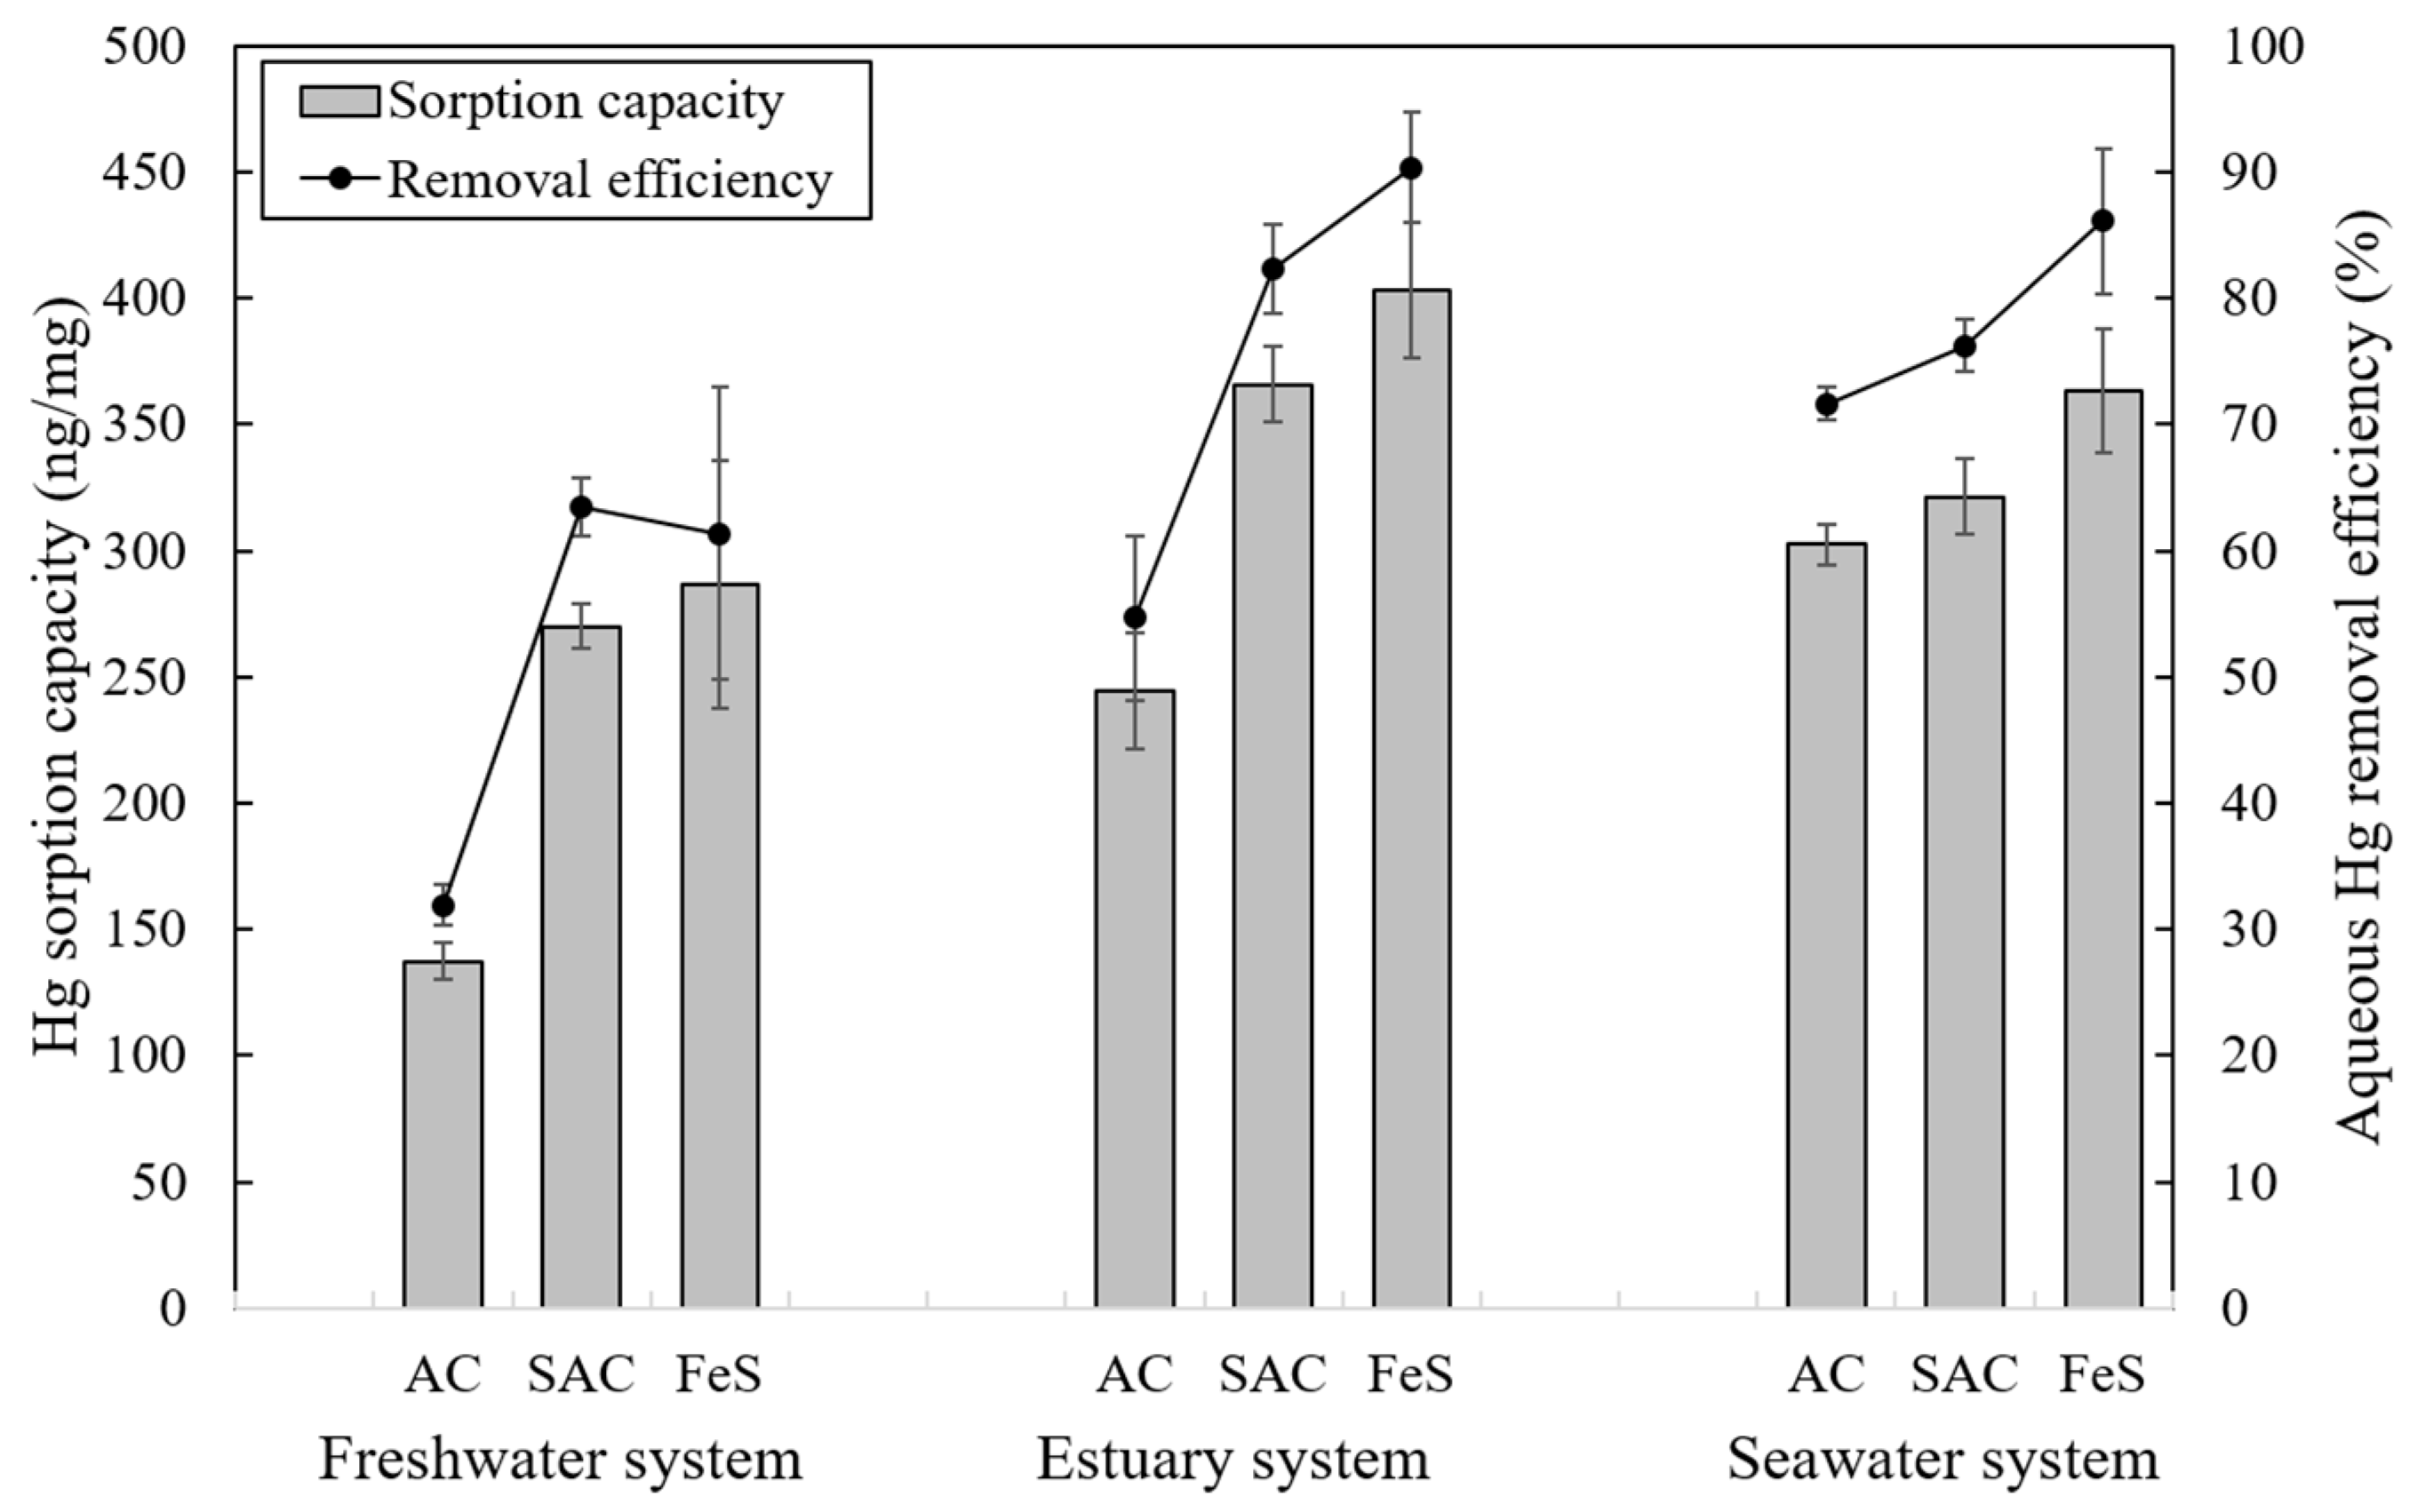
3.2.3. Effect of Salinity

The salinity level of water in the Hg-contaminated site may affect the Hg removal ability of sorbents. Thereby, three artificial synthetic waters, including freshwater, estuary water, and seawater with different salinity levels, were prepared to study the effects of salinity on Hg removal ability of sorbents. The Hg removal efficiency of sorbents for each water system are presented in Figure 4, indicating that FeS had the largest Hg removal efficiency, followed by SAC and then AC. From the lowest salinity (freshwater) to the highest salinity level (seawater), the Hg removal efficiency increased for both AC and SAC. Although the effect of salinity levels on FeS was insignificant, the Hg removal efficiency of FeS was still the highest as compared to AC and SAC. The calculated KD values are listed in Table S3, which shows that KD values increased as the salinity increased. FeS also performed the largest KD values, followed by SAC and then AC.
Notably, our results were contrary to those in previous studies, which have shown that a high level of salinity may decrease the removal efficiency of Hg by sorbents [38,39]. The previous studies have demonstrated that an increase in NaCl concentration would decrease the sorption efficiency of AC and kaolin. However in our research, the different salinity levels were prepared by adding various salts to form the artificial waters. Hence, the complexation and species of Hg in this study may be more complicated than the cases with only presence of NaCl. Table S2 displays the simulated speciation of Hg(II) compounds, indicating that the fraction of Hg(OH)2 in the freshwater system (i.e., 95.97%) was significantly higher than that in both systems of estuary water (i.e., 0.094%) and seawater (i.e., 0.014%). Hg(OH)2 has been reported that it could easily decompose to the elemental form as Hg0, Hg0 is more difficult to be captured from the water solution than other oxidized form because of its extremely low solubility (i.e., 5.6 × 10⁻⁵ g/L) [29]. Additionally, Thiem et al. [40] showed that the addition of calcium ion would enhance Hg removal of AC. They speculated that the calcium ion may react with the surface group on AC to form a new adsorption site, leading to an increment of Hg removal capacity in the solution. Besides, according to the KD values, the increase of salinity has a positive effect on the partition behavior of aqueous Hg to the adsorbent; furthermore, FeS has a fabulous capability for converting Hg from the liquid phase to the solid phase.

3.2.4. Effect of Dissolved Organic Matter on Hg Sorption at Various Salinity Levels

DOM is widely spread in environments and may control a number of essential processes relevant for Hg cycling. In this study, artificial waters with a DOM concentration of 2.6 mg-C/L was prepared with three salinity levels, and the results are shown in Figure 5. For the addition of DOM to the salinity test, the Hg removal by sorbents was relatively decreased as compared with those in the salinity test (Figure 4). In freshwater system, the sorption capacity of AC, SAC, and FeS was decreased from 286 to 137 ng/mg, 384 to 270 ng/mg, and 431 to 287 ng/mg, respectively. As for the estuary system, the sorption capacity of AC, SAC and FeS was decreased from 401 to 286 ng/mg, 408 to 366 ng/mg, and 441 to 403 ng/mg, respectively. While the sorption capacity of AC, SAC, and FeS were decreased from 355 to 302 ng/mg, 400 to 322 ng/mg, and 427 to 363 ng/mg in the seawater system, respectively (Figure 6). In Table S3, KD values also decreased significantly with the presence of DOM. Therefore, DOM may inhibit the Hg adsorption by complexation mechanism because it can compete with sorbents and complex with Hg2+ [41,42,43,44]. Hg2+ may form complex with organic thiol groups in DOM [45,46]. The phenolic hydroxyl groups in DOM may also complex with Hg easily to form a stable chelate that restrained the Hg adsorption [47].

3.3. Laboratory Microcosm Experiments

3.3.1. Physicochemical Properties of Sediments Used in Microcosm Experiments

The physicochemical properties of the An-Shun site sediment are summarized in Table 2. The pH value of the sediment was about 7.5, slightly alkaline due to the estuary water system of that region. The slightly alkaline condition may favor to immobilize and decrease the toxicity of most metals as they may precipitate in the alkaline environment. The OC content in the An-Shun site sediment was about 0.8 wt%, which was relatively low when compared to other sediments. The organic matter in the sediment may potentially affect the interaction between pollutants and sediment. The sand, silt and clay contents of the sediment were 71.4, 14.3, and 14.3 wt%, respectively. The An-Shun site sediment could thus be classified as a sandy loam according to the soil texture classification of the United States Department of Agriculture (USDA) (Figure S2). In general, the texture of sediment is tightly correlated with OC content and CEC. The fine-textured sediment may contain high OC and CEC due to its large surface areas, whereas the OC and CEC of sandy-textured sediment was relatively low. The results of physicochemical properties analysis of An-Shun site sediment were consistent with the fact that a sandy loam showed low OC content and low CEC.

3.3.2. Environmental Factor Variation during Microcosms Operation

The vertical up-flow microcosms with a closed circulation system are set up as shown in Figure 1 and Figure S1. Two kinds of waters were applied in the microcosms, including freshwater and estuary water. The microcosms were operated for 65 days. The operation time from days 1 to 25 was the process of sediment acclimation. After that, the capping materials were delivered to the microcosms and the water was collected periodically from the outflow as the overlying water sample. The appearance of the microcosms, which was capped with the AC, SAC, or no cap were seen to be clear, while the column capped with FeS was found to gradually appear in brown inside the microcosms. It has been speculated that the addition of FeS may promote a chemical reaction to form iron hydroxide or iron oxide, which was found attached on the wall of the column and the buffer tank.
The recorded temperature in the microcosms is shown in Figure S3. The range of temperature was between 20 and 27 °C during the test period between winter and spring. The DO results are shown in Figure S4. The DO value at the beginning of the experiment was approximately 4 mg/L, started to decrease and remained stable at 3 ± 0.5 mg/L as the operation time extended. This result could be explained by the microbial activity in the microcosms. The microbes would consume DO to carry out respiration process, thus its concentration decreased at the beginning. Owning to the operational defects, the oxygen outside the microcosm fluxed in and caused the increment of DO. The pH value of overlying water is shown in Figure S5. It was between 7.6 and 7.9 in all microcosms.
The results of EC in the freshwater system and estuary system are shown in Figure S6. In the freshwater system, the EC of overlying waters of microcosms was around 2300−3270 μS/cm. The EC values decreased as the operation time increased because the microcosms would be refilled with the artificial freshwater and get diluted after sampling periodically (Figure S6a). Moreover, the An-Shun site sediment was estuary sediment, thus it contained a portion of salt and contributed to the background levels of salinity. In the estuary water system of microcosms, the results of EC are shown in Figure S6b. The EC ranged from 37,000 to 38,000 μS/cm.
The ORP results of the overlying water from freshwater system and estuary system are shown in Figure S7. In the freshwater system, the ORP of overlying water of microcosms was around 40–160 mV. As for the estuary system, the ORP of overlying water of microcosms was about −22–145 mV.
The results of DOM in the overlying water are shown in Figure S8. The DOM content in the overlying water was low, mainly related to the low DOM content in An-Shun site sediment. The An-Shun site sediment contained less OC content according to the previous results shown; consequently, less DOM would be released from the sediment to the overlying water.
The total Fe in overlying water is shown in Figure S9. In the freshwater system, the microcosm capped with FeS would contribute significant dissolved Fe to the overlying water while the concentration of Fe in the microcosm with no capped was also high. The Fe content of those treatment were higher if compared to microcosms with AC and SAC. The similar trend was also observed in the estuary system.

3.3.3. Sequestration of Aqueous THg and MeHg by Thin Layer Capping

The effectiveness of capping materials to immobilize Hg is shown in Figure 7 and Table S4. For the freshwater system, the THg immobilization abilities of three capping materials greatly varied as compared to that of the no-capped control unit. The THg reduction efficiencies of the AC, SAC, and FeS, which were calculated based on the initial THg concentration of the microcosm started and the THg concentration in a given sampling date, fluctuated between −22−82%, −30−78% and −87−62%, respectively, in comparison to the control unit. As for the estuary system, THg reduction efficiencies of the AC, SAC and FeS reached −33−49%, 28−60% and −24−44%, respectively, in comparison to that of the control unit. Therefore, the fluctuation and uncertainty for Hg removal of capping sorbents were observed in both freshwater and estuary systems. According to our previous studies [17,48], the recommended amendment dosage of sorbents for Hg-sediment remediation was approximately 1−5%. The dosage of sorbents being used in this study was 3%, which was supposedly to show significant effect on Hg removal, but the results seemed not be similar to our previous studies. The horizontal flow microcosm set up was mostly used to stimulate the emission of Hg from the sediment according to the previous studied [48]. However, a different design, vertical up-flow microcosm was adapted in this study, in which the water moved in an up-flow direction and then recirculated back into the columns in a closed system. Therefore, a dynamic equilibrium among the sediment, capping material, and overlying water achieved in the closed circulation system. The Hg in the sediments will be released to the water continuously until an equilibrium was reached. The same process happened in the interface between water and capping material. These processes will lead to the depletion of Hg on the sediments because it was diffused and transferred to the capping materials. Owning to these process, the reduction of Hg in the overlying water of the microcosm was less evident, which was also demonstrated by the ANOVA analysis (Table S4); instant and marked releases of Hg from the caps were occasionally found. The dosage of sorbents applied in this microcosms may need to be reconsidered as it might not be capable to sorb Hg efficiently due to the characteristic of this microcosms system.
The Hg concentrations in sediment, sorbents and overlying water after 65 days in the microcosms are shown in Table 3. The Hg concentrations in the freshwater sediments at the end of experiment for AC, SAC, FeS and control unit were 65.35 ± 0.65, 68.87 ± 0.46, 50.38 ± 1.03 and 68.77 ± 2.03 mg/kg, respectively. In the estuary system, the Hg concentrations of sediment for AC, SAC, FeS and control unit were 56.16 ± 2.87, 57.55 ± 0.39, 54.80 ± 2.25 and 69.20 ± 4.02 mg/kg, respectively. The initial Hg content in sediment of the An-Shun site was 76.00 ± 2.59 mg/kg, thus, there were varying losses of Hg from sediment with different capping amendment in both freshwater and estuary systems. The sediment can be a reservoir of Hg, which would provide Hg to the water, capping materials, and the microcosm’s auxiliary equipment until an equilibrium reached. Hence, the decrease of Hg in the sediment of the study is reasonable. In the freshwater system, the loss of Hg in microcosms capped with AC and SAC was similar to that in the control unit while the loss of Hg in FeS capping was slightly higher than that in the control unit, AC, and SAC capping. As for the estuary system, the Hg loss from sediment with capping materials was decreased significantly as compared to that in the control unit. On the other hand, the contents of Hg in the sorbents of AC, SAC, and FeS were 4.84 ± 0.81, 6.86 ± 3.52, and 37.66 ± 8.34 mg/kg, respectively, in freshwater system. In the estuary system, the contents of Hg in the sorbents of AC, SAC, and FeS were 3.88 ± 1.82, 2.89 ± 1.49, and 43.83 ± 13.04 mg/kg, respectively. The Hg content in FeS was significantly greater as compared to those in AC and SAC in both freshwater and estuary systems. Notably, the Hg sorption capacity of sorbents in the batch experiments was relatively high when compared to those for the sorbents applied in the microcosms. Although the Hg concentration of overlying water, approximately 200 ng/L was relatively low as compared to the batch experiment test, the mechanism of Hg sorption might be different at the low Hg concentration. The recovery of Hg in the microcosms was approximately 67−90% in both freshwater and estuary systems. The low recovery in some cases can be explained by the phenomenon of bacteria respiration, which could produce a large portion of batting biomass and colloids that cause Hg to attach onto. Moreover, the Hg might be adhered to the surface of the microcosm’s auxiliary equipment, such as column surface, buffer tank, pipelines, and others that may cause the decreasing recovery of Hg (Figure S1). Therefore, although FeS showed great Hg sorption capacity during the batch and caused Hg partitioning from sediment to the cap during microcosm test, Hg may be released from cap again, through redissolution or release of small-scale FeS particles containing Hg, leading to not only the low recovery but also the risk of unexpected release of Hg for sediment with vertical up-flow.
The results of MeHg content in the overlying water of freshwater system and estuary system are shown in Figure 8. In the freshwater system, the amounts of MeHg in the overlying water from microcosms capped with AC, SAC, and FeS were significantly decreased when compared to that of the control unit; the MeHg concentrations of AC, SAC, FeS, and control unit were 0.04−0.70, 0.14−0.94, 0.13−1.64, and 2.26−11.35 ng/L, respectively. In contrast, the MeHg concentrations of AC, SAC, FeS, and control unit were 0.10−0.14, 0.15−0.87, 0.04−2.77, and 0.14−1.01 ng/L in the estuary system, respectively. Therefore, the production of MeHg under the treatment of AC and SAC capping was decreased tremendously, while the reduction efficiency of MeHg in the microcosms capped with FeS was not significant.
The production of MeHg of the control unit in the freshwater system was significant as compared with that in the estuary system. A previous study showed that the salinity level of the environment was negatively correlated with MeHg production [49]. In the high salinity condition, Hg has tendency to form complex with chlorine salt and sulfurous compounds, reducing the trends of Hg methylation [50]. The researchers suggested that a high-salinity condition may inhibit Hg methylation because sulfate with high concentration would reduce to toxic sulfides by microorganisms, and poisons the Hg methylating bacteria, reducing the formation of MeHg as well. In the freshwater system, the MeHg reduction efficiency in microcosms capped with AC was the best, SAC followed, and FeS the least, suggesting that the SAC and FeS provided a portion of the iron and sulfur elements to dissolve into water and enhanced the methylation ability of sulfate-reducing bacterial and Fe(III)-reducing bacteria. As a result, the MeHg reduction efficiency in microcosms capped with SAC and FeS was poorer as compared to that with AC.
The MeHg contents in the sediment are shown in Table 4. The formation of MeHg in the control unit of freshwater system was higher than that in the estuary system. The formation of MeHg capped with AC and FeS was low when compared to that in the control unit in freshwater system, except for the microcosm capped with SAC, which was slightly higher. As a results, the MeHg released to overlying water in freshwater system was inhibited by both limiting the MeHg formation and the effectiveness of caps. In the estuary system, the MeHg contents in both capped with sorbents and control unit were similar and smaller than those in freshwater system.

4. Conclusions

In this study, the aqueous batch experiments with the amendment of AC, SAC, and FeS sorbents were first carried out to comprehend the Hg removal efficiency in Hg-contaminated sediments influenced by salinity and DOM. The microcosms were then set up to examine the performance of these capping sorbents on Hg-contaminated sediment remediation. The experimental results showed that FeS on Hg removal was not significantly affected by salinity levels and maintained with high removal efficiency. The Hg removal efficiency of AC and SAC increased as salinity increased. In contrast, the Hg removal efficiency of sorbents decreased with the addition of DOM at different salinity levels because DOM competed with sorbents and may occupy the adsorption site, thus inhibited the Hg uptake by sorbents. The microcosm experiments showed that the THg immobilization abilities of three capping sorbents greatly varied as compared to that of control unit. The MeHg concentration of overlying water in the freshwater microcosm with no cap was higher than that in the estuary system. Therefore, Hg compounds in the freshwater system may be more bioavailable to microorganisms in methylated phase as compared to those in the estuary system. To summarize, the capping materials including AC, SAC, and FeS effectively decreased the concentration of overlying water MeHg in the freshwater system of microcosms. Because the production of MeHg in estuary system was low, the efficiency of materials on MeHg sorption was insignificant.
We suggest that future studies should be focused on scale-up design using large microcosms. Notably, because FeS showed the best Hg removal efficiency, resistance to salinity, and only slightly affected by DOM in aqueous adsorption experiments and AC showed as the best MeHg adsorption material, a “mixing cap” using both FeS and AC should be examined and the optimal mixing ratio should be obtained. A mixing cap of FeS and AC may also help preventing the leaching out of FeS from the cap layer, which was observed in our microcosm study.
It is also worth noting that for the vertical up-flow system, the accumulated Hg in capped layer may eventually breakthrough, which could cause sudden concentration shock that leads to instant risk of exposure. Long-term microcosm operation is critical and should be further conducted to obtain design parameters on subsequent pilot tests or full-scale application.

Supplementary Materials

The following are available online at https://www.mdpi.com/2073-4441/12/7/1991/s1, Table S1. Freshwater and seawater ion species concentration, Table S2. Hg(II) speciation at various salinity levels, Table S3. The partitioning coefficients for Hg adsorptions at various salinity levels, Table S4. A one-way ANOVA or one-way ANOVA on ranks based on normality test, followed by a post hoc test (p < 0.05) used to determine the significance differences among various sorbents, Figure S1. Photos of the microcosms on (a) day 25 as the capping materials were initially applied and (b) on day 65, Figure S2. An-Shun site sediment texture, Figure S3. The temperature of microcosms (the symbol F refers to freshwater system and the symbol E refers to estuary system), Figure S4. The dissolved oxygen for the microcosms (the symbol F refers to freshwater system and the symbol E refers to estuary system), Figure S5. The pH value variation of microcosms (the symbol F refers to freshwater system and the symbol E refers to estuary system), Figure S6. The electricity conductivity of overlying water in (a) freshwater system and (b) estuary system, Figure S7. The oxidation reduction potential of overlying water in (a) freshwater system and (b) estuary system, Figure S8. DOM variation of microcosms for (a) freshwater system; (b) estuary system, Figure S9. The total Fe variation of microcosms in (a) freshwater system and (b) estuary system.

Author Contributions

Conceptualization, B.-L.C., Y.T., T.C.C., and H.-C.H.; methodology, B.-L.C., C.-J.H., Y.T., Y.-L.W., and H.-C.H.; formal analysis, B.-L.C. and C.C.; resources, H.-C.H.; writing—original draft preparation, B.-L.C. and C.-J.H.; writing—review and editing, Y.-L.W. and H.-C.H.; supervision, T.-C.C. and H.-C.H.; funding acquisition, H.-C.H. All authors have read and agreed to the published version of the manuscript.

Funding

This research and the APC were funded by the Environmental Protection Administration, Taiwan under Grant no. 08BT547001 and the Ministry of Science and Technology of Taiwan, Taiwan under Grant no. MOST 105-2221-E-002-008-MY3.

Acknowledgments

We greatly appreciate the financial and technical supports from the Environmental Protection Administration, Taiwan and the Ministry of Science and Technology of Taiwan, Taiwan. The opinions expressed in this paper are not necessarily those of the sponsors.

Conflicts of Interest

The authors declare no conflict of interest.

References

  1. Nriagu, J.O. Biogeochemistry of Mercury in the Environment; Elsevier/North-Holland Biomedical Press: Amsterdam, The Netherlands, 1979. [Google Scholar]
  2. Compeau, G.C.; Bartha, R. Sulfate-reducing bacteria: Principal methylators of mercury in anoxic estuarine sediment. Appl. Environ. Microbiol. 1985, 50, 498–502. [Google Scholar] [CrossRef] [Green Version]
  3. Gilmour, C.C.; Henry, E.A.; Mitchell, R. Sulfate stimulation of mercury methylation in freshwater sediments. Environ. Sci. Technol. 1992, 26, 2281–2287. [Google Scholar] [CrossRef]
  4. Gilmour, C.C.; Podar, M.; Bullock, A.L.; Graham, A.M.; Brown, S.D.; Somenahally, A.C.; Johs, A.; Hurt, R.A.; Bailey, K.L.; Elias, D.A. Mercury methylation by novel microorganisms from new environments. Environ. Sci. Technol. 2013, 47, 11810–11820. [Google Scholar] [CrossRef] [PubMed]
  5. Podar, M.; Gilmour, C.C.; Brandt, C.C.; Soren, A.; Brown, S.D.; Crable, B.R.; Palumbo, A.V.; Somenahally, A.C.; Elias, D.A. Global prevalence and distribution of genes and microorganisms involved in mercury methylation. Sci. Adv. 2015, 1, e1500675. [Google Scholar] [CrossRef] [PubMed] [Green Version]
  6. Fitzgerald, W.F.; Lamborg, C.H.; Hammerschmidt, C.R. Marine biogeochemical cycling of mercury. Chem. Rev. 2007, 107, 641–662. [Google Scholar] [CrossRef] [PubMed]
  7. Stein, E.D.; Cohen, Y.; Winer, A.M. Environmental distribution and transformation of mercury compounds. Crit. Rev. Environ. Sci. Technol. 1996, 26, 1–43. [Google Scholar] [CrossRef]
  8. Zhang, C.; Zhu, M.Y.; Zeng, G.M.; Yu, Z.G.; Cui, F.; Yang, Z.Z.; Shen, L.Q. Active capping technology: A new environmental remediation of contaminated sediment. Environ. Sci. Pollut. Res. 2016, 23, 4370–4386. [Google Scholar] [CrossRef] [PubMed]
  9. McDonough, K.M.; Murphy, P.; Olsta, J.; Zhu, Y.; Reible, D.; Lowry, G.V. Development and placement of a sorbent-amended thin layer sediment cap in the Anacostia River. Soil Sediment Contam. 2007, 16, 313–322. [Google Scholar] [CrossRef] [Green Version]
  10. Gilmour, C.; Bell, T.; Soren, A.; Riedel, G.; Riedel, G.; Kopec, D.; Bodaly, D.; Ghosh, U. Activated carbon thin-layer placement as an in situ mercury remediation tool in a Penobscot River salt marsh. Sci. Total Environ. 2018, 621, 839–848. [Google Scholar] [CrossRef]
  11. Ghosh, U.; Luthy, R.G.; Cornelissen, G.; Werner, D.; Menzie, C.A. In-situ sorbent amendments: A new direction in contaminated sediment management. Environ. Sci. Technol. 2011, 45, 1163–1168. [Google Scholar] [CrossRef]
  12. Gomez-Eyles, J.L.; Yu, P.Q.; Beckingham, B.; Riedel, G.; Gilmour, C.C.; Ghosh, U. Evaluation of biochars and activated carbons for in situ remediation of sediments impacted with organics, mercury, and methylmercury. Environ. Sci. Technol. 2013, 47, 13721–13729. [Google Scholar] [CrossRef] [PubMed]
  13. Ie, I.R.; Hung, C.H.; Jen, Y.S.; Yuan, C.S.; Chen, W.H. Adsorption of vapor-phase elemental mercury (Hg0) and mercury chloride (HgCl2) with innovative composite activated carbons impregnated with Na2S and S0 in different sequences. Chem. Eng. J. 2013, 229, 469–476. [Google Scholar] [CrossRef]
  14. Puri, B.R.; Hazra, R.S. Carbon-sulphur surface complexes on charcoal. Carbon 1971, 9, 123–134. [Google Scholar] [CrossRef]
  15. Li, Z.; Wu, L.; Liu, H.; Lan, H.; Qu, J. Improvement of aqueous mercury adsorption on activated coke by thiol-functionalization. Chem. Eng. J. 2013, 228, 925–934. [Google Scholar] [CrossRef]
  16. Macıas-Garcıa, A.; Gomez-Serrano, V.; Alexandre-Franco, M.F.; Valenzuela-Calahorro, C. Adsorption of cadmium by sulphur dioxide treated activated carbon. J. Hazard. Mater. 2003, 103, 141–152. [Google Scholar] [CrossRef]
  17. Ting, Y.; Chen, C.; Ch’ng, B.L.; Wang, Y.L.; Hsi, H.C. Using raw and sulfur-impregnated activated carbon as active cap for leaching inhibition of mercury and methylmercury from contaminated sediment. J. Hazard. Mater. 2018, 354, 116–124. [Google Scholar] [CrossRef]
  18. Gong, Y.; Liu, Y.; Xiong, Z.; Kaback, D.; Zhao, D. Immobilization of mercury in field soil and sediment using carboxymethyl cellulose stabilized iron sulfide nanoparticles. Nanotechnology 2012, 23, 294007. [Google Scholar] [CrossRef]
  19. Gong, Y.; Liu, Y.; Xiong, Z.; Zhao, D. Immobilization of mercury by carboxymethyl cellulose stabilized iron sulfide nanoparticles: Reaction mechanisms and effects of stabilizer and water chemistry. Environ. Sci. Technol. 2014, 48, 3986–3994. [Google Scholar] [CrossRef]
  20. Han, D.S.; Orillano, M.; Khodary, A.; Duan, Y.; Batchelor, B.; Abdel-Wahab, A. Reactive iron sulfide (FeS)-supported ultrafiltration for removal of mercury (Hg (II)) from water. Water Res. 2014, 53, 310–321. [Google Scholar] [CrossRef]
  21. Liu, J.; Valsaraj, K.T.; Devai, I.; DeLaune, R.E. Immobilization of aqueous Hg (II) by mackinawite (FeS). J. Hazard. Mater. 2008, 157, 432–440. [Google Scholar] [CrossRef]
  22. Xiong, Z.; He, F.; Zhao, D.; Barnett, M.O. Immobilization of mercury in sediment using stabilized iron sulfide nanoparticles. Water Res. 2009, 43, 5171–5179. [Google Scholar] [CrossRef] [PubMed]
  23. Paquette, K.; Helz, G. Solubility of cinnabar (red HgS) and implications for mercury speciation in sulfidic waters. Water Air Soil Poll. 1995, 80, 1053–1056. [Google Scholar] [CrossRef]
  24. Benoit, J.M.; Gilmour, C.C.; Mason, R.P.; Heyes, A. Sulfide controls on mercury speciation and bioavailability to methylating bacteria in sediment pore waters. Environ. Sci. Technol. 1999, 33, 951–957. [Google Scholar] [CrossRef]
  25. Ravichandran, M.; Aiken, G.R.; Ryan, J.N.; Reddy, M.M. Inhibition of precipitation and aggregation of metacinnabar (mercuric sulfide) by dissolved organic matter isolated from the Florida Everglades. Environ. Sci. Technol. 1999, 33, 1418–1423. [Google Scholar] [CrossRef]
  26. Morse, J.W.; Arakaki, T. Adsorption and coprecipitation of divalent metals with mackinawite (FeS). Geochim. Cosmochim. Acta 1993, 57, 3635–3640. [Google Scholar] [CrossRef]
  27. Wolthers, M.; Van der Gaast, S.J.; Rickard, D. The structure of disordered mackinawite. Am. Mineral. 2003, 88, 2007–2015. [Google Scholar] [CrossRef]
  28. Hsi, H.C.; Rood, M.J.; Rostam-Abadi, M.; Chen, S.; Chang, R. Effects of sulfur impregnation temperature on the properties and mercury adsorption capacities of activated carbon fibers (ACFs). Environ. Sci. Technol. 2001, 35, 2785–2791. [Google Scholar] [CrossRef] [PubMed]
  29. Hsu, C.J.; Chiou, H.J.; Chen, Y.H.; Lin, K.S.; Rood, M.J.; Hsi, H.C. Mercury adsorption and re-emission inhibition from actual WFGD wastewater using sulfur-containing activated carbon. Environ. Res. 2019, 168, 319–328. [Google Scholar] [CrossRef]
  30. ASTM D6556–10. Standard Test Method for Carbon Black—Total and External Surface Area by Nitrogen Adsorption; ASTM International: West Conshohocken, PA, USA, 2012. [Google Scholar]
  31. Lippens, B.C.; de Boer, J.H. Studies on pore systems in catalysts: V. the t method. J. Catal. 1965, 4, 319–323. [Google Scholar] [CrossRef]
  32. Gee, G.W.; Bauder, J.W. Particle-size analysis. In Methods of Soil Analysis, Part 1. Physical and Mineralogical Methods, 2nd ed.; Klute, A., Ed.; Agronomy Monograph No. 9; American Society of Agronomy/Soil Science Society of America: Madison, WI, USA, 1986; pp. 383–411. [Google Scholar]
  33. Nelson, D.W.; Sommers, L.E. Total carbon, organic carbon, and organic matter. In Methods of Soil Analysis, Part 2. Chemical and Microbiological Properties, 2nd ed.; Page, A.L., Ed.; Agronomy Series No. 9; American Society of Agronomy/Soil Science Society of America: Madison, WI, USA, 1982; pp. 539–579. [Google Scholar]
  34. Lewis, P.A.; Klemm, D.J.; Lazorchak, J.M.; Norberg-King, T.J.; Peltier, W.H.; Heber, M.A. Short-Term Methods for Estimating the Chronic Toxicity of Effluents and Receiving Waters to Freshwater Organisms; US Environmental Protection Agency, Environmental Monitoring Systems Laboratory: Cincinnati, OH, USA, 1994.
  35. Kester, D.R.; Duedall, I.W.; Connors, D.N.; Pytkowicz, R.M. Preparation of artificial seawater 1. Limnol. Oceanogr. 1967, 12, 176–179. [Google Scholar] [CrossRef]
  36. Wang, Y.L.; Fang, M.D.; Chien, L.C.; Lin, C.C.; Hsi, H.C. Distribution of mercury and methylmercury in surface water and surface sediment of river, irrigation canal, reservoir and wetland in Taiwan. Environ. Sci. Pollut. Res. 2019, 26, 17762–17773. [Google Scholar] [CrossRef] [PubMed]
  37. Kazemi, F.; Younesi, H.; Ghoreyshi, A.A.; Bahramifar, N.; Heidari, A. Thiol-incorporated activated carbon derived from fir wood sawdust as an efficient adsorbent for the removal of mercury ion: Batch and fixed-bed column studies. Process Saf. Environ. Prot. 2016, 100, 22–35. [Google Scholar] [CrossRef]
  38. de Diego, A.; Tseng, C.M.; Dimov, N.; Amouroux, D.; Donard, O.F. Adsorption of aqueous inorganic mercury and methylmercury on suspended kaolin: Influence of sodium chloride, fulvic acid and particle content. Appl. Organomet. Chem. 2001, 15, 490–498. [Google Scholar] [CrossRef]
  39. Ranganathan, K. Adsorption of Hg (II) ions from aqueous chloride solutions using powdered activated carbons. Carbon 2003, 41, 1087–1092. [Google Scholar] [CrossRef]
  40. Thiem, L.; Badorek, D.; O’Connor, J.T. Removal of mercury from drinking water using activated carbon. J. Am. Water Works Assoc. 1976, 68, 447–451. [Google Scholar] [CrossRef]
  41. Moreno, F.N.; Anderson, C.W.; Stewart, R.B.; Robinson, B.H.; Ghomshei, M.; Meech, J.A. Induced plant uptake and transport of mercury in the presence of sulphur-containing ligands and humic acid. New Phytol. 2005, 166, 445–454. [Google Scholar] [CrossRef]
  42. Muller, K.A.; Brandt, C.C.; Mathews, T.J.; Brooks, S.C. Methylmercury sorption onto engineered materials. J. Environ. Manag. 2019, 245, 481–488. [Google Scholar] [CrossRef]
  43. Schwartz, G.E.; Sanders, J.P.; McBurney, A.M.; Brown, S.S.; Ghosh, U.; Gilmour, C.C. Impact of dissolved organic matter on mercury and methylmercury sorption to activated carbon in soils: Implications for remediation. Environ. Sci. Process. Impacts 2019, 21, 485–496. [Google Scholar] [CrossRef]
  44. Johs, A.; Eller, V.A.; Mehlhorn, T.L.; Brooks, S.C.; Harper, D.P.; Mayes, M.A.; Pierce, E.M.; Peterson, M.J. Dissolved organic matter reduces the effectiveness of sorbents for mercury removal. Sci. Total Environ. 2019, 690, 410–416. [Google Scholar] [CrossRef]
  45. Skyllberg, U.; Bloom, P.R.; Qian, J.; Lin, C.M.; Bleam, W.F. Complexation of mercury (II) in soil organic matter: EXAFS evidence for linear two-coordination with reduced sulfur groups. Environ. Sci. Technol. 2006, 40, 4174–4180. [Google Scholar] [CrossRef]
  46. Skyllberg, U.; Drott, A. Competition between disordered iron sulfide and natural organic matter associated thiols for mercury (II): An EXAFS study. Environ. Sci. Technol. 2010, 44, 1254–1259. [Google Scholar] [CrossRef] [PubMed]
  47. Pandey, A.K.; Pandey, S.D.; Misra, V. Stability constants of metal–humic acid complexes and its role in environmental detoxification. Ecotoxicol. Environ. Saf. 2000, 47, 195–200. [Google Scholar] [CrossRef]
  48. Ting, Y.; Ch’ng, B.L.; Chen, C.; Ou, M.Y.; Cheng, Y.H.; Hsu, C.J.; Hsi, H.C. A simulation study of mercury immobilization in estuary sediment microcosm by activated carbon/clay-based thin-layer capping under artificial flow and turbation. Sci. Total Environ. 2020, 708, 135068. [Google Scholar] [CrossRef] [PubMed]
  49. Compeau, G.C.; Bartha, R. Effect of salinity on mercury-methylating activity of sulfate-reducing bacteria in estuarine sediments. Appl. Environ. Microbiol. 1987, 53, 261–265. [Google Scholar] [CrossRef] [PubMed] [Green Version]
  50. Ullrich, S.M.; Tanton, T.W.; Abdrashitova, S.A. Mercury in the aquatic environment: A review of factors affecting methylation. Crit. Rev. Environ. Sci. Technol. 2001, 31, 241–293. [Google Scholar] [CrossRef]
Figure 1. The diagram of vertical up-flow microcosms construction.
Water 12 01991 g001
Figure 2. Effect of (a) AC; (b) SAC; (c) FeS dosage on Hg removal efficiency.
Water 12 01991 g002
Figure 3. Hg sorption at different Hg2+ concentrations.
Water 12 01991 g003
Figure 4. Comparison of various salinity levels affecting the sorbents’ Hg removal.
Water 12 01991 g004
Figure 5. Comparison of the Hg sorption capacity at various salinity levels affected by DOM.
Water 12 01991 g005
Figure 6. Comparison of the influence of various salinity levels and DOM on Hg sorption capacity in the aqueous batch experiments.
Water 12 01991 g006
Figure 7. THg concentration in overlying water of (a) freshwater system and (b) estuary system.
Water 12 01991 g007
Figure 8. MeHg concentration in overlying water of (a) freshwater system and (b) estuary system.
Water 12 01991 g008
Table 1. The physicochemical properties of sorbents.
SBET (m2/g) *SMicro (m2/g) *VTotal (cm3/g) *Vmicro (cm3/g) *
AC1024.1634.10.5400.284
SAC903.3528.90.5020.267
FeS2.8110.3560.04-
C (%)H (%)O (%)N (%)S (%)
AC78.31.617.720.7910.672
SAC74.91.8013.80.365.75
FeS----36.4
* SBET: specific BET surface area; SMicro: micropore area; VTotal: total pore volume; Vmicro: micropore volume.
Table 2. The physicochemical properties of An-Shun site sediment.
ParametersValue
Water content (wt%)2.33 ± 0.01
pH7.5 ± 0.03
Organic carbon (wt%)0.80 ± 0.65
Cation exchange capacity (cmol(+)/kg)3.3 ± 0.2
Sand (wt%)71.4 ± 2.9
Silt (wt%)14.3 ± 0.0
Clay (wt%)14.3 ± 2.9
THg (mg/kg)76.0 ± 2.59
MeHg (μg/kg)1.17 ± 0.31
Table 3. Recovery calculation based on the Hg content in sediment, sorbents and overlying water after 65 days in the microcosms.
Sediment 1SorbentsOverlying WaterRecovery 2
mg/kgmgmg/kgmgmg%
F-AC65.35 ± 0.6519.614.84 ± 0.810.040.00286.19
F-SAC68.87 ± 0.4620.666.86 ± 3.520.060.0290.89
F-FeS50.38 ± 1.0315.1137.66 ± 8.340.340.0267.78
F-Control68.77 ± 2.0320.63--0.0290.50
E-AC56.16 ± 2.8716.853.88 ± 1.820.030.00274.05
E-SAC57.55 ± 0.3917.272.89 ± 1.490.030.00375.85
E-FeS54.80 ± 2.2516.4443.83 ± 13.040.390.00273.84
E-Control69.20 ± 4.0220.70--0.00290.80
1 The Hg content in sediment for the day 65. 2 Recovery was obtained by the sum of Hg content in sediment, sorbents and overlying water divided by the total Hg content in initial sediment (i.e., 76.0 ± 2.59 mg/kg and 22.8 mg) then multiplying by 100.
Table 4. The MeHg content in sediment on day 65.
Freshwater SystemMeHg (μg/kg)Estuary SystemMeHg (μg/kg)
AC1.43 ± 0.75AC1.03 ± 0.52
SAC5.42 ± 1.92SAC1.16 ± 0.07
FeS2.61 ± 0.65FeS2.07 ± 0.52
Control unit3.97 ± 1.68Control unit1.99 ± 1.15

