Assessing Regional Scale Water Balances through Remote Sensing Techniques: A Case Study of Boufakrane River Watershed, Meknes Region, Morocco


 ,
,  ,
,  ,
,
Abstract
:1. Introduction
2. Materials and Methods
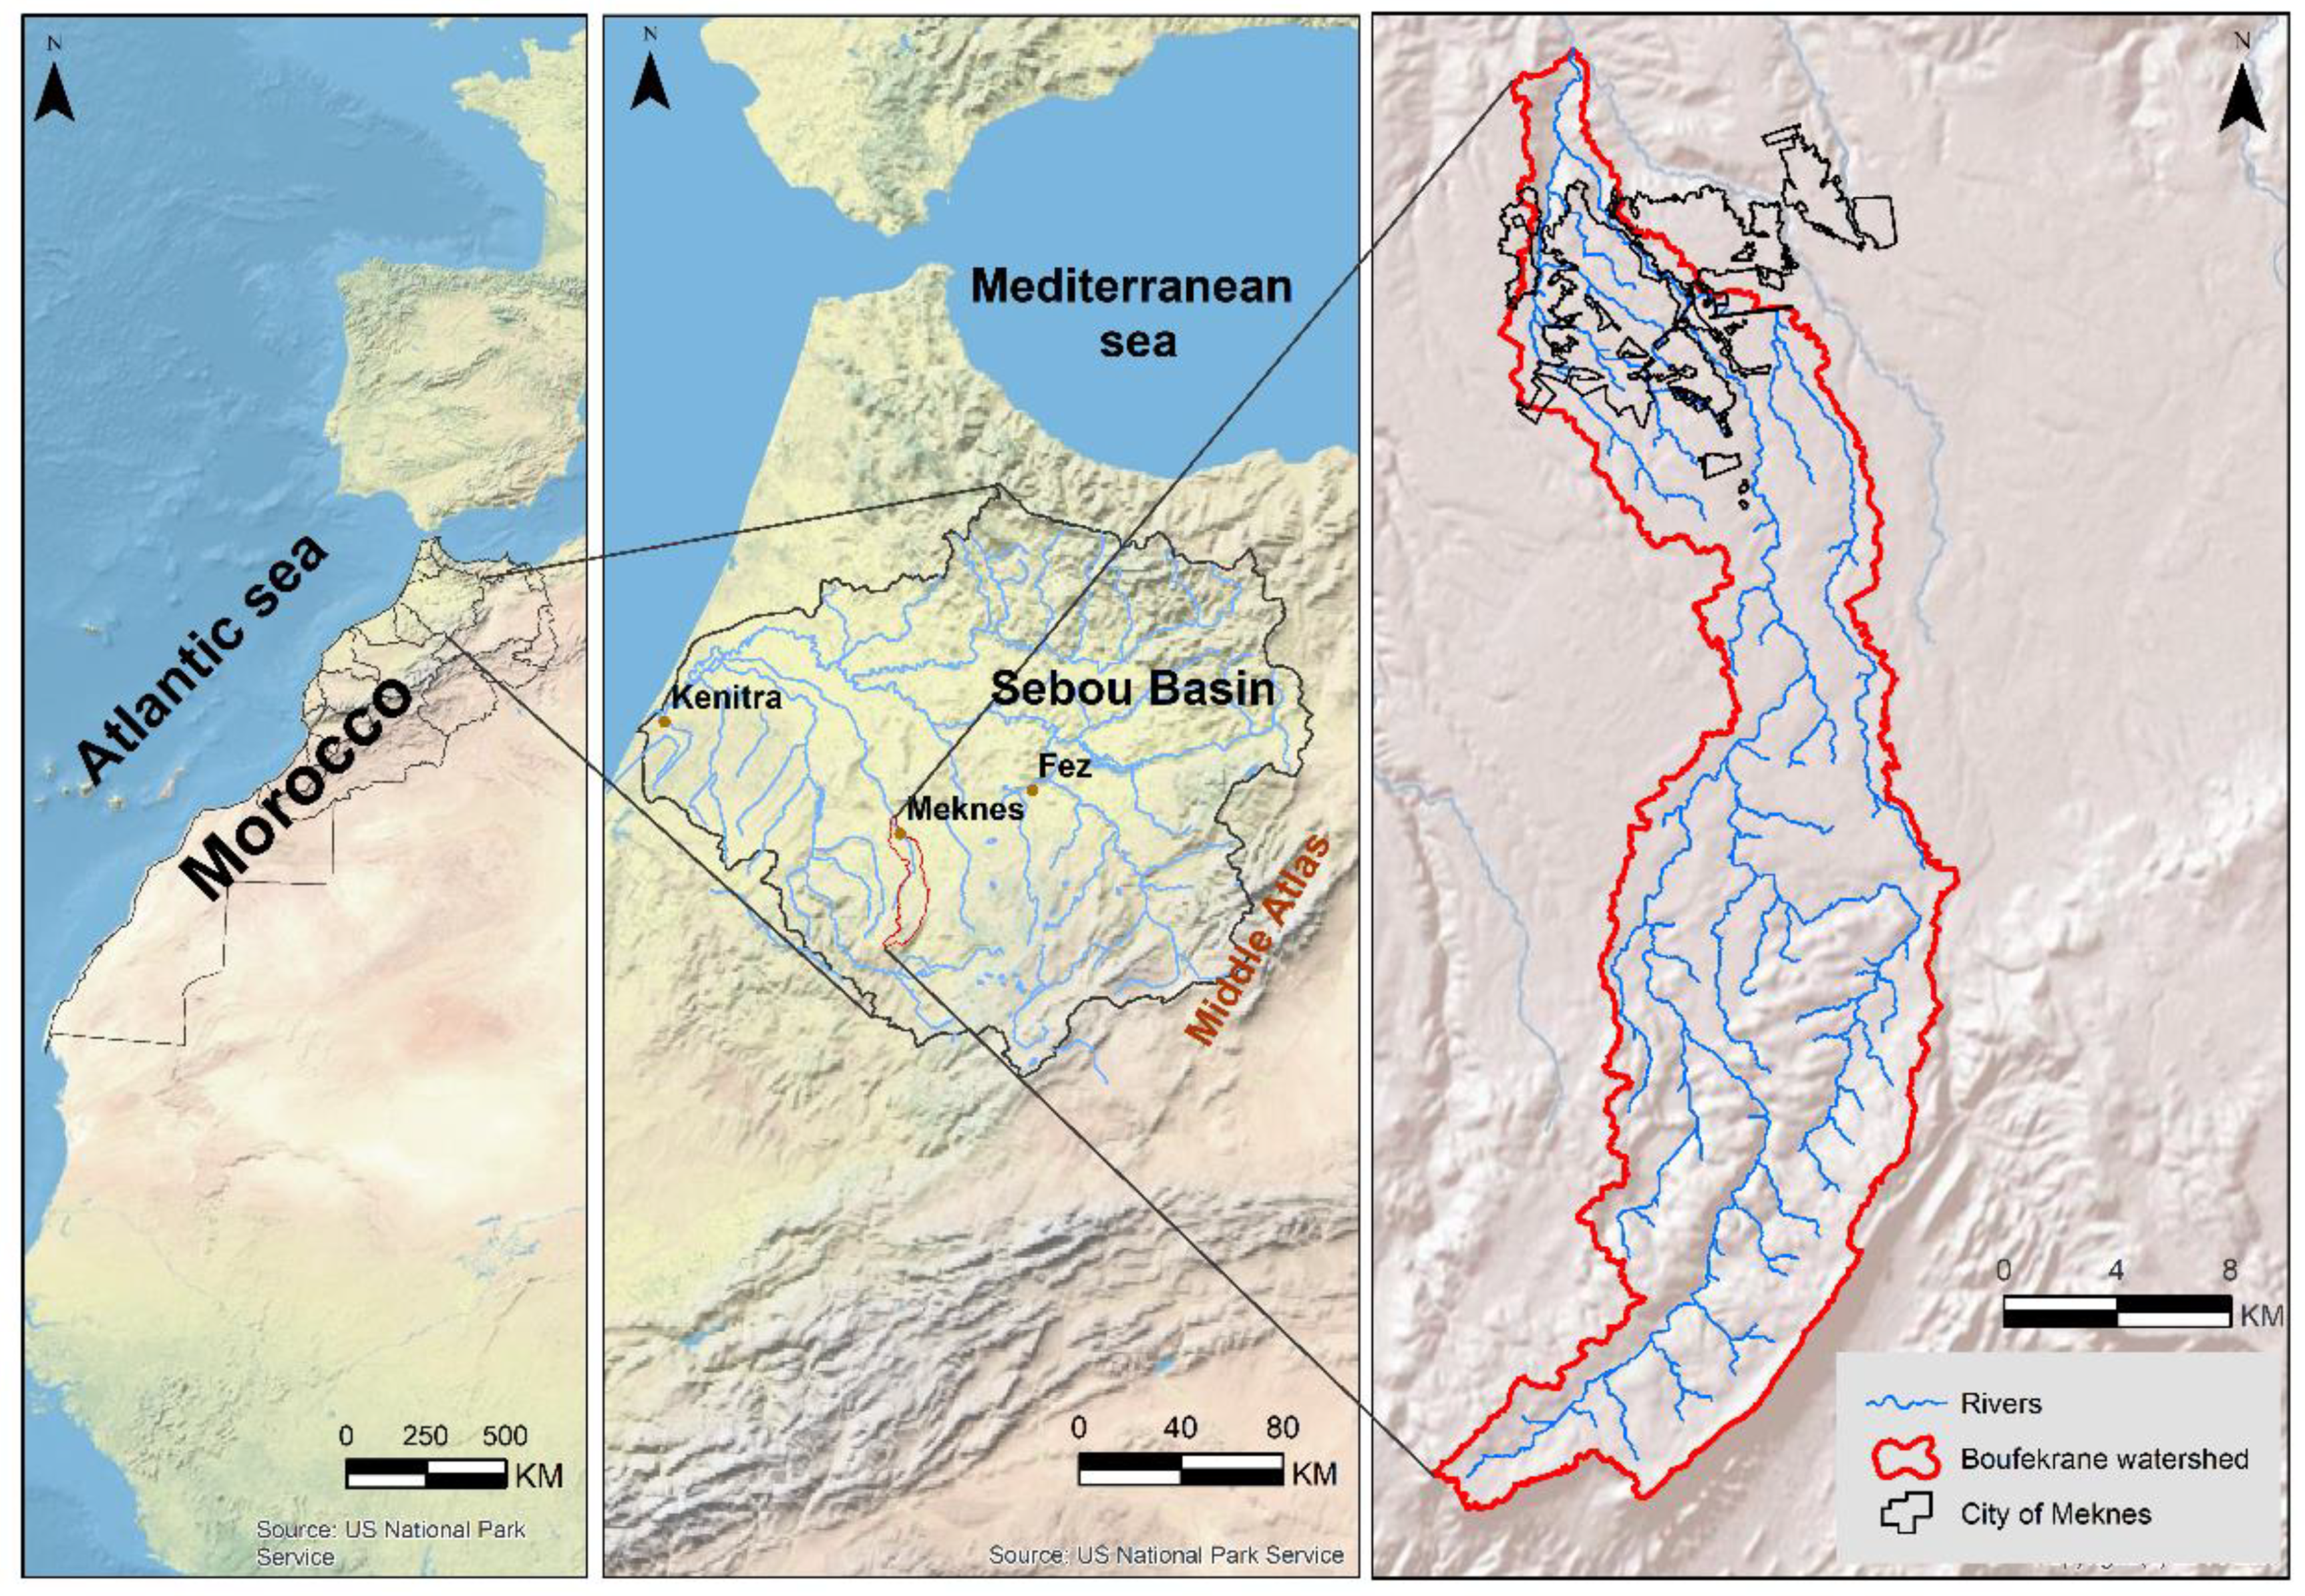
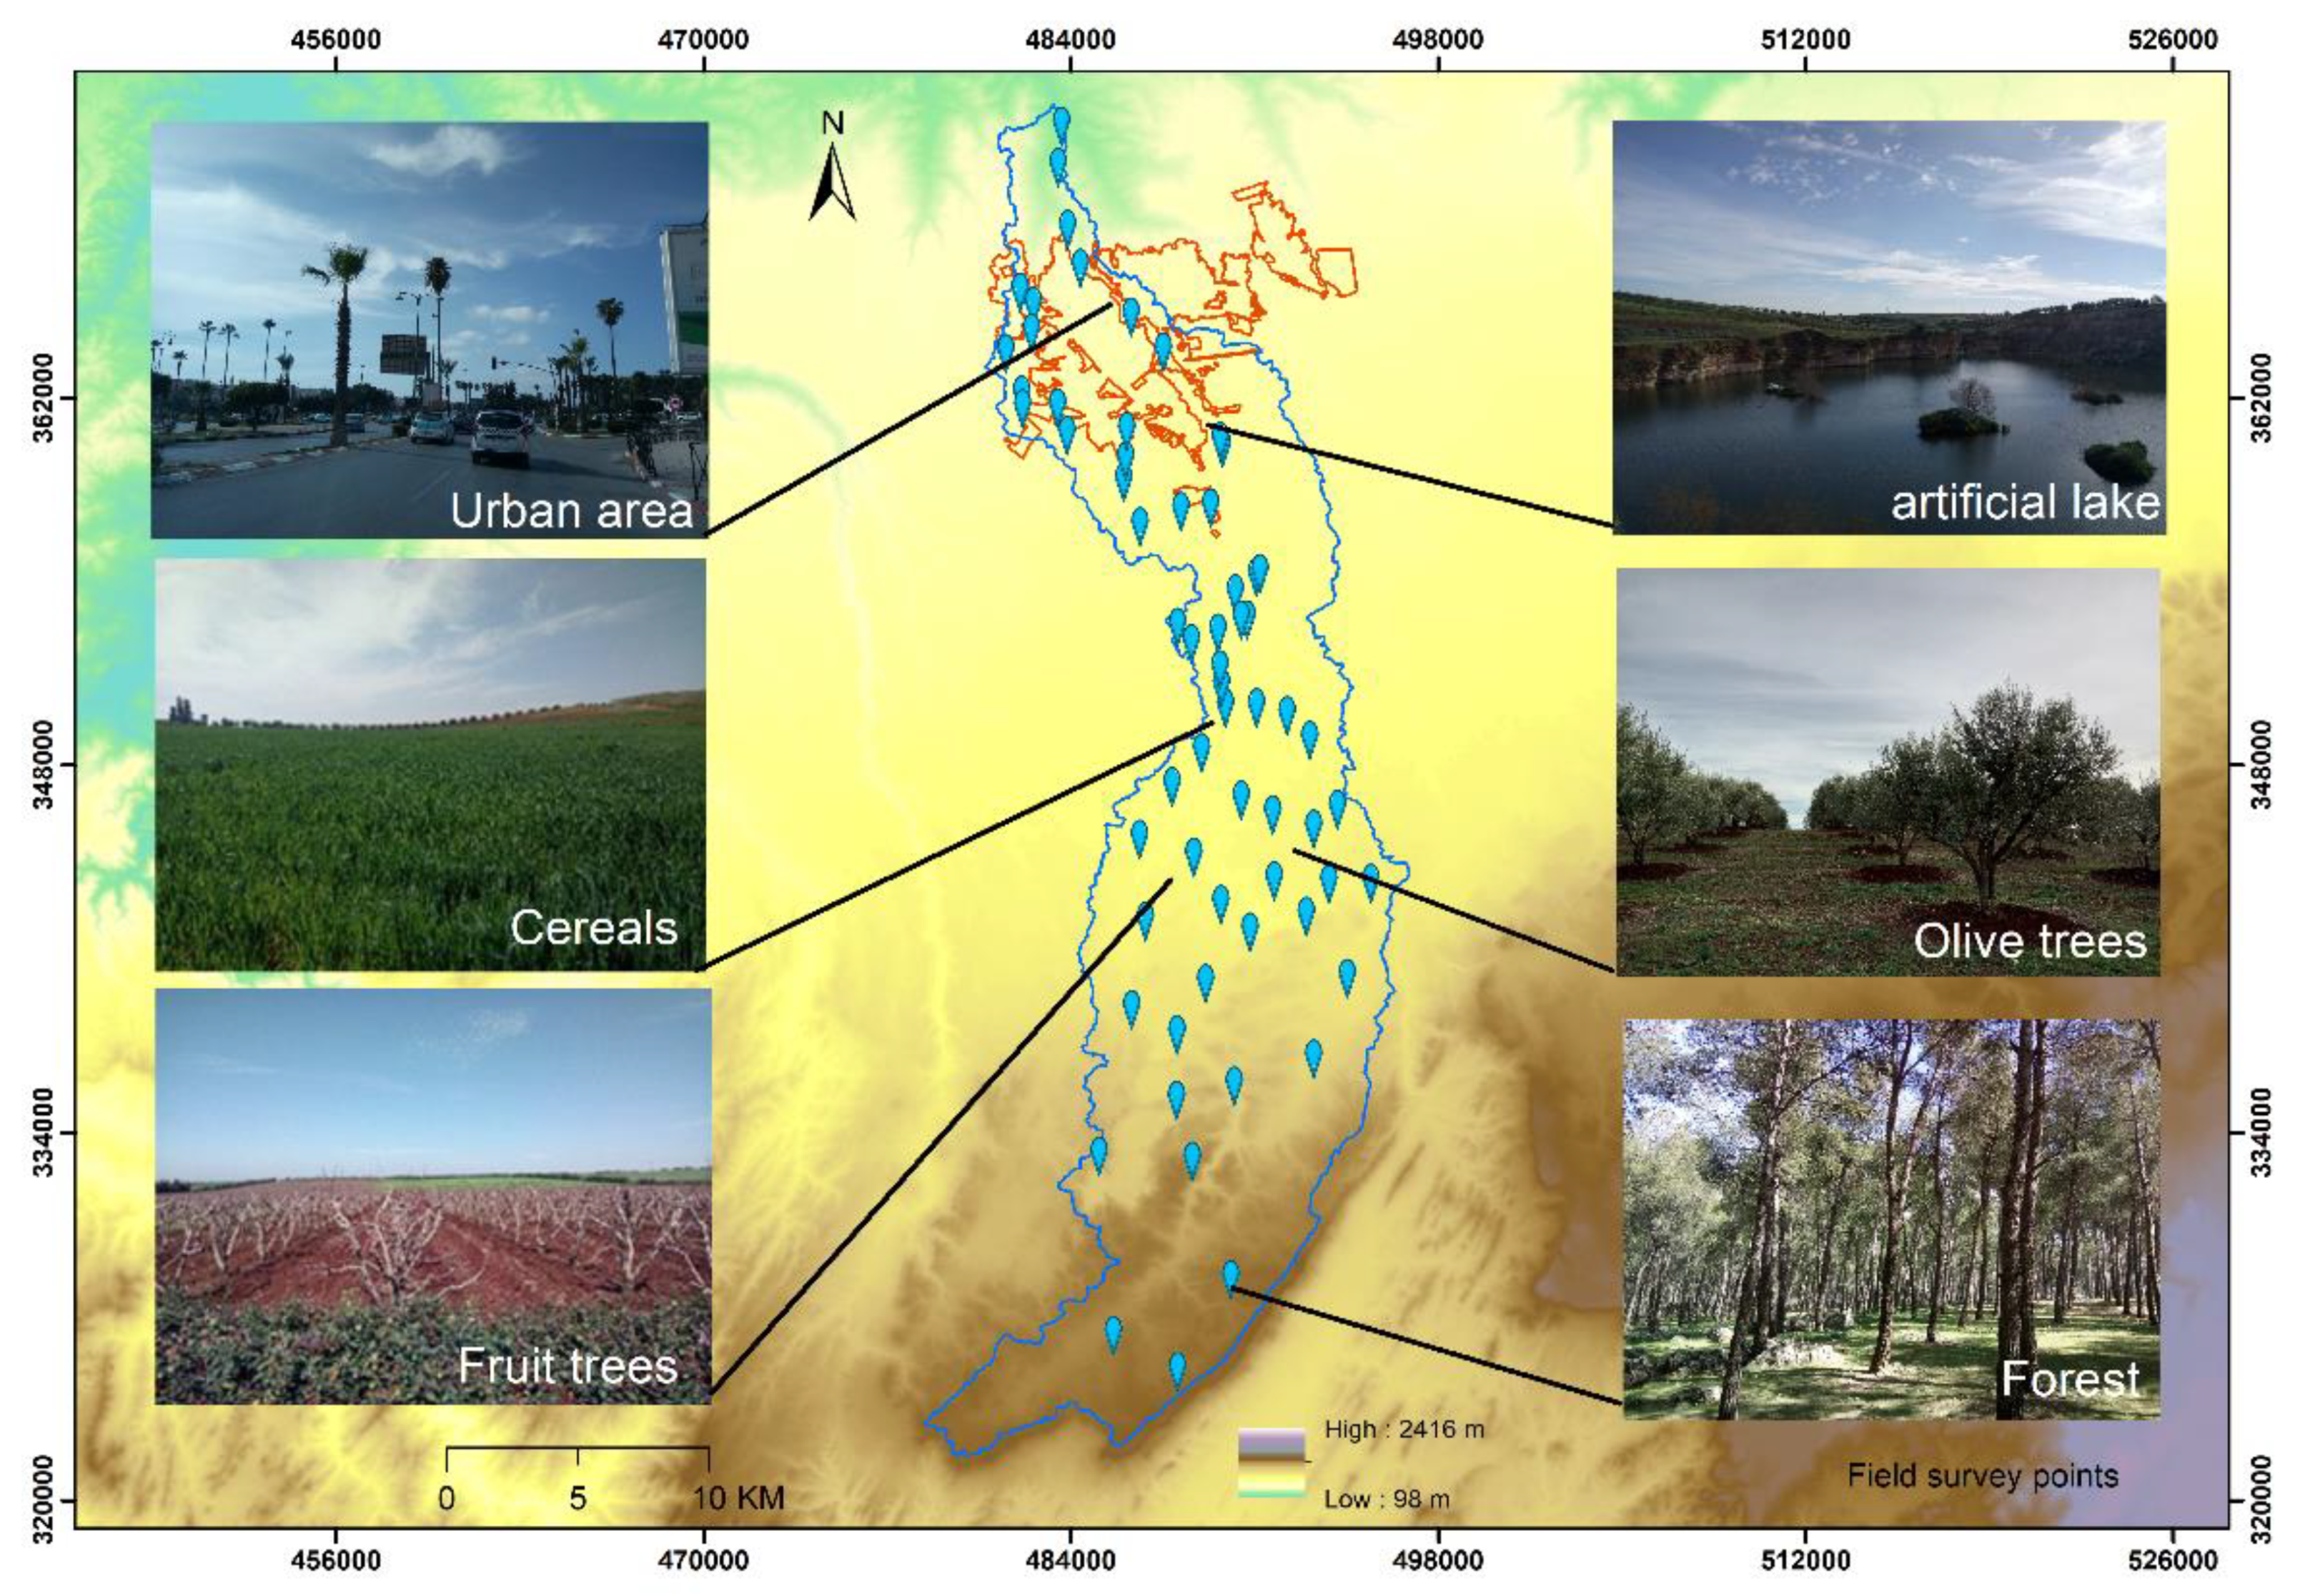
2.1. Study Area
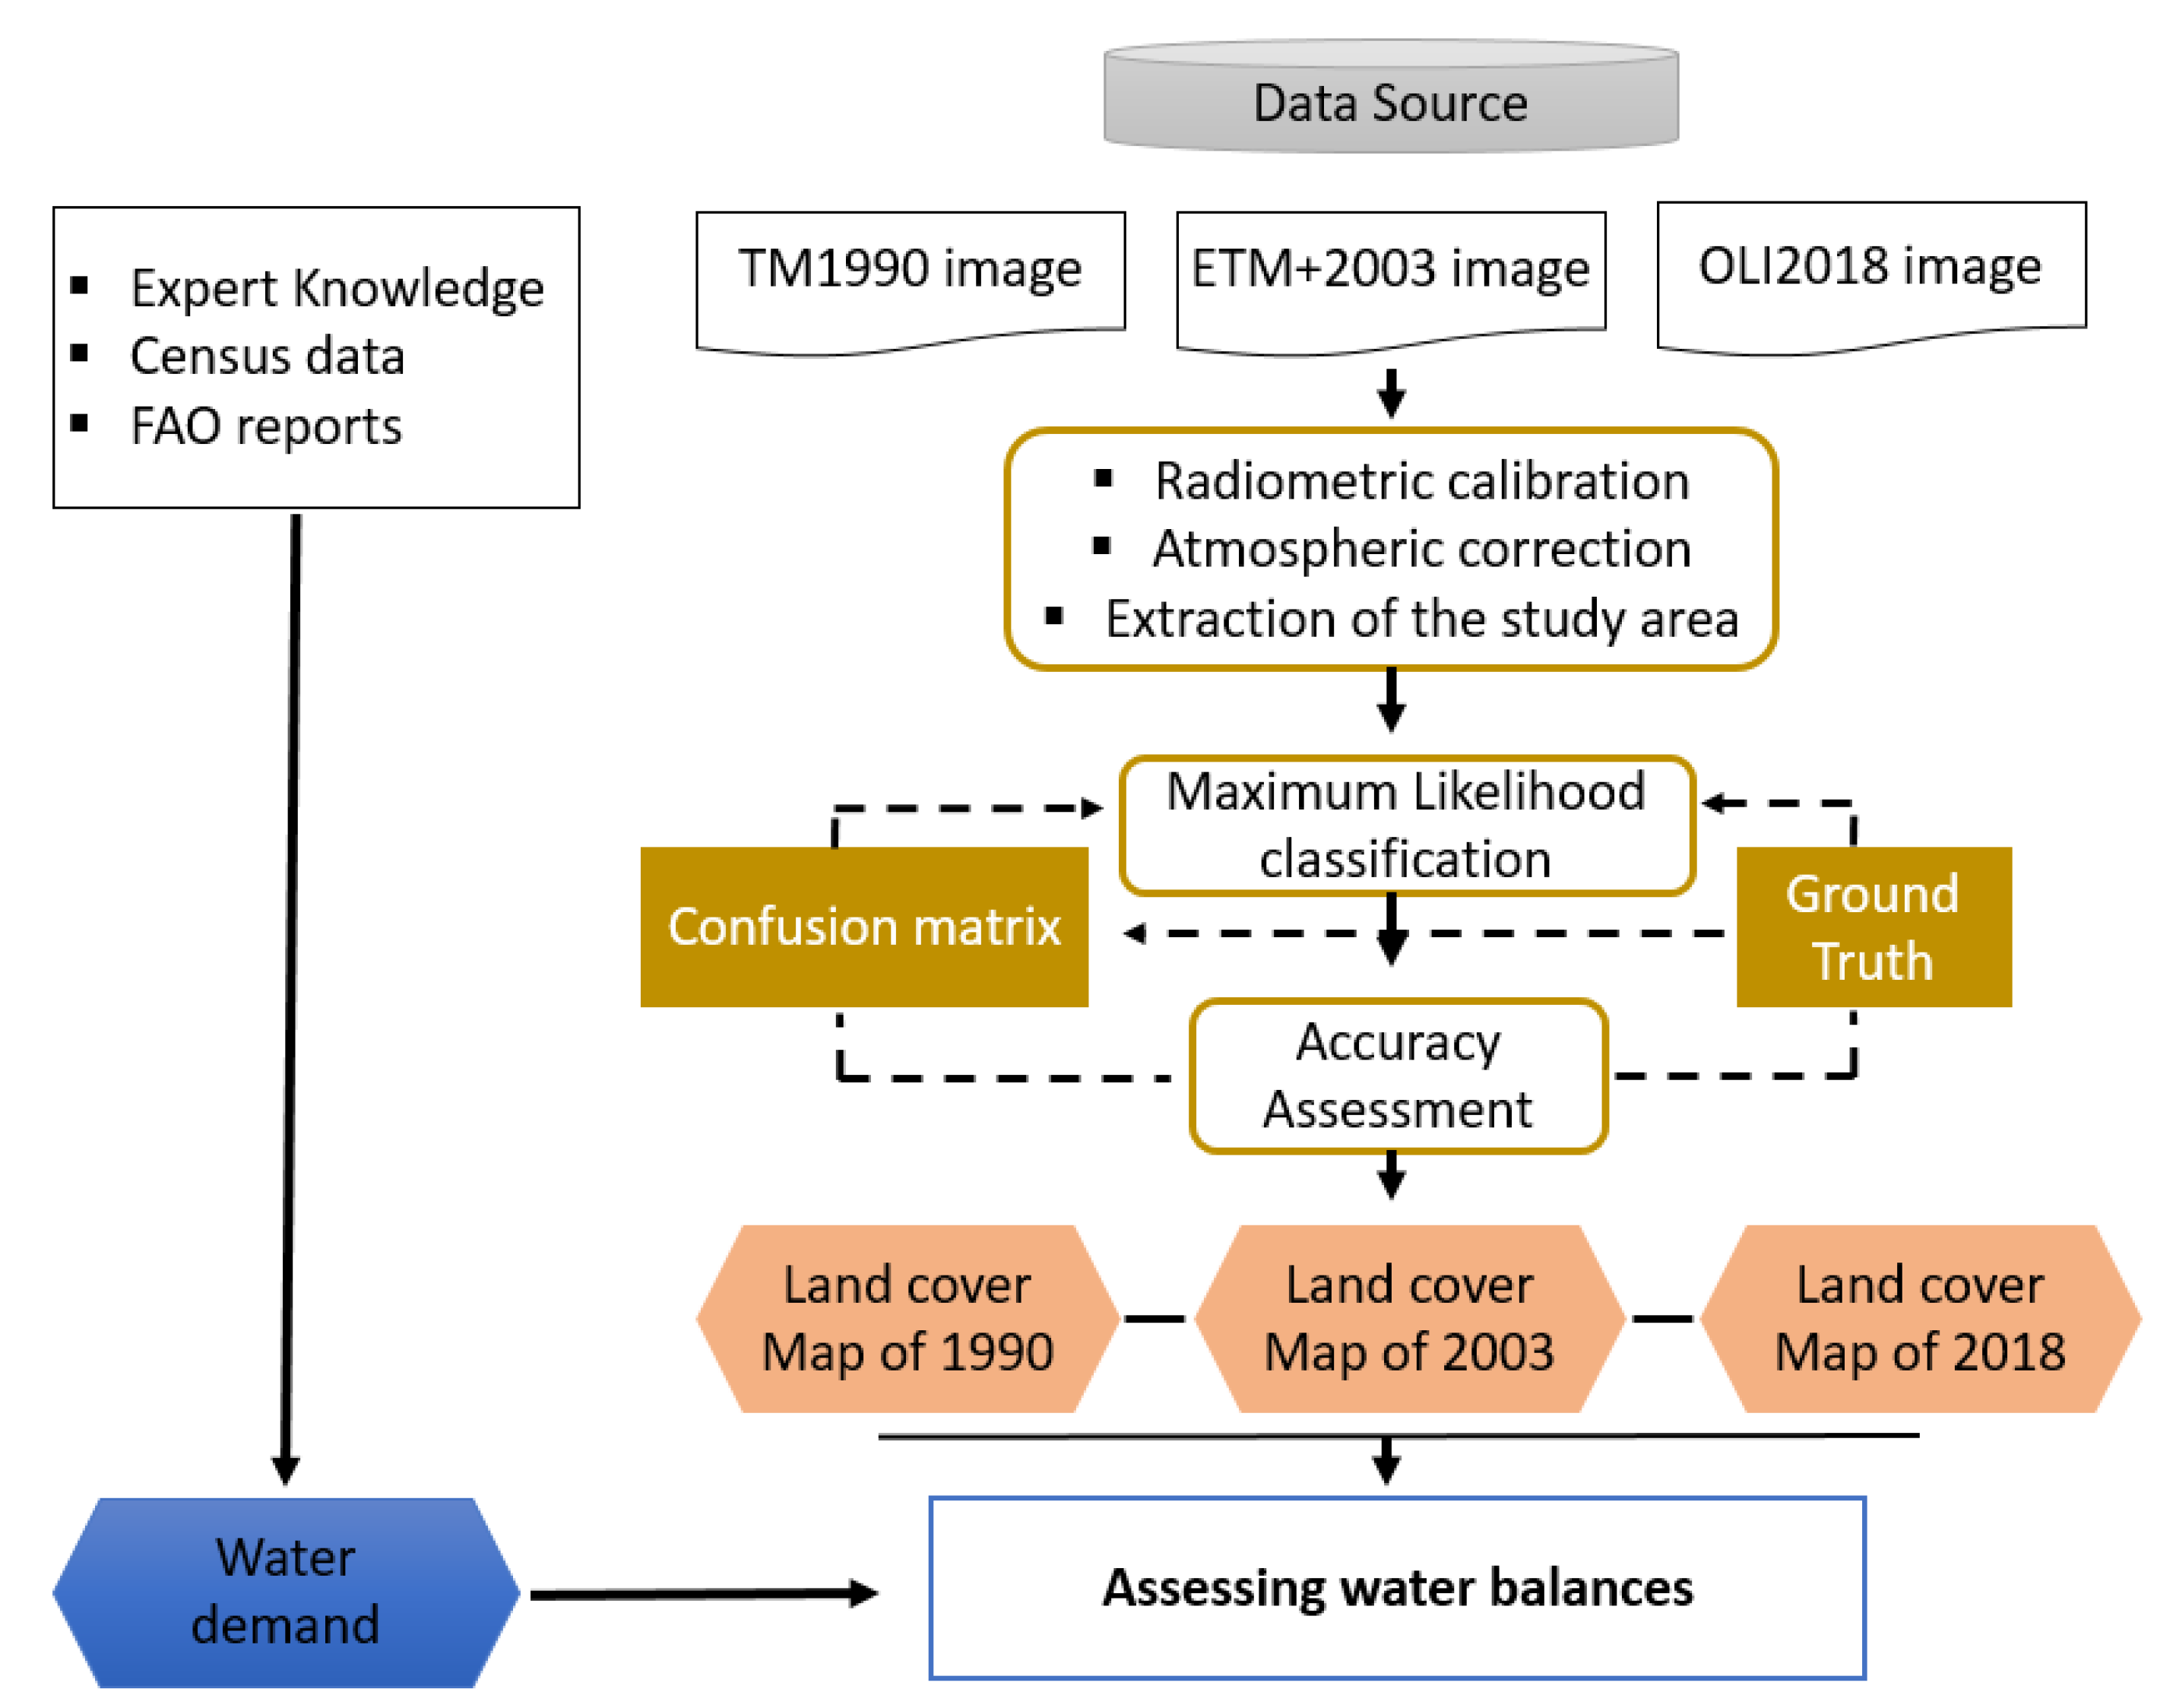
2.2. Methodology
3. Results and Discussion
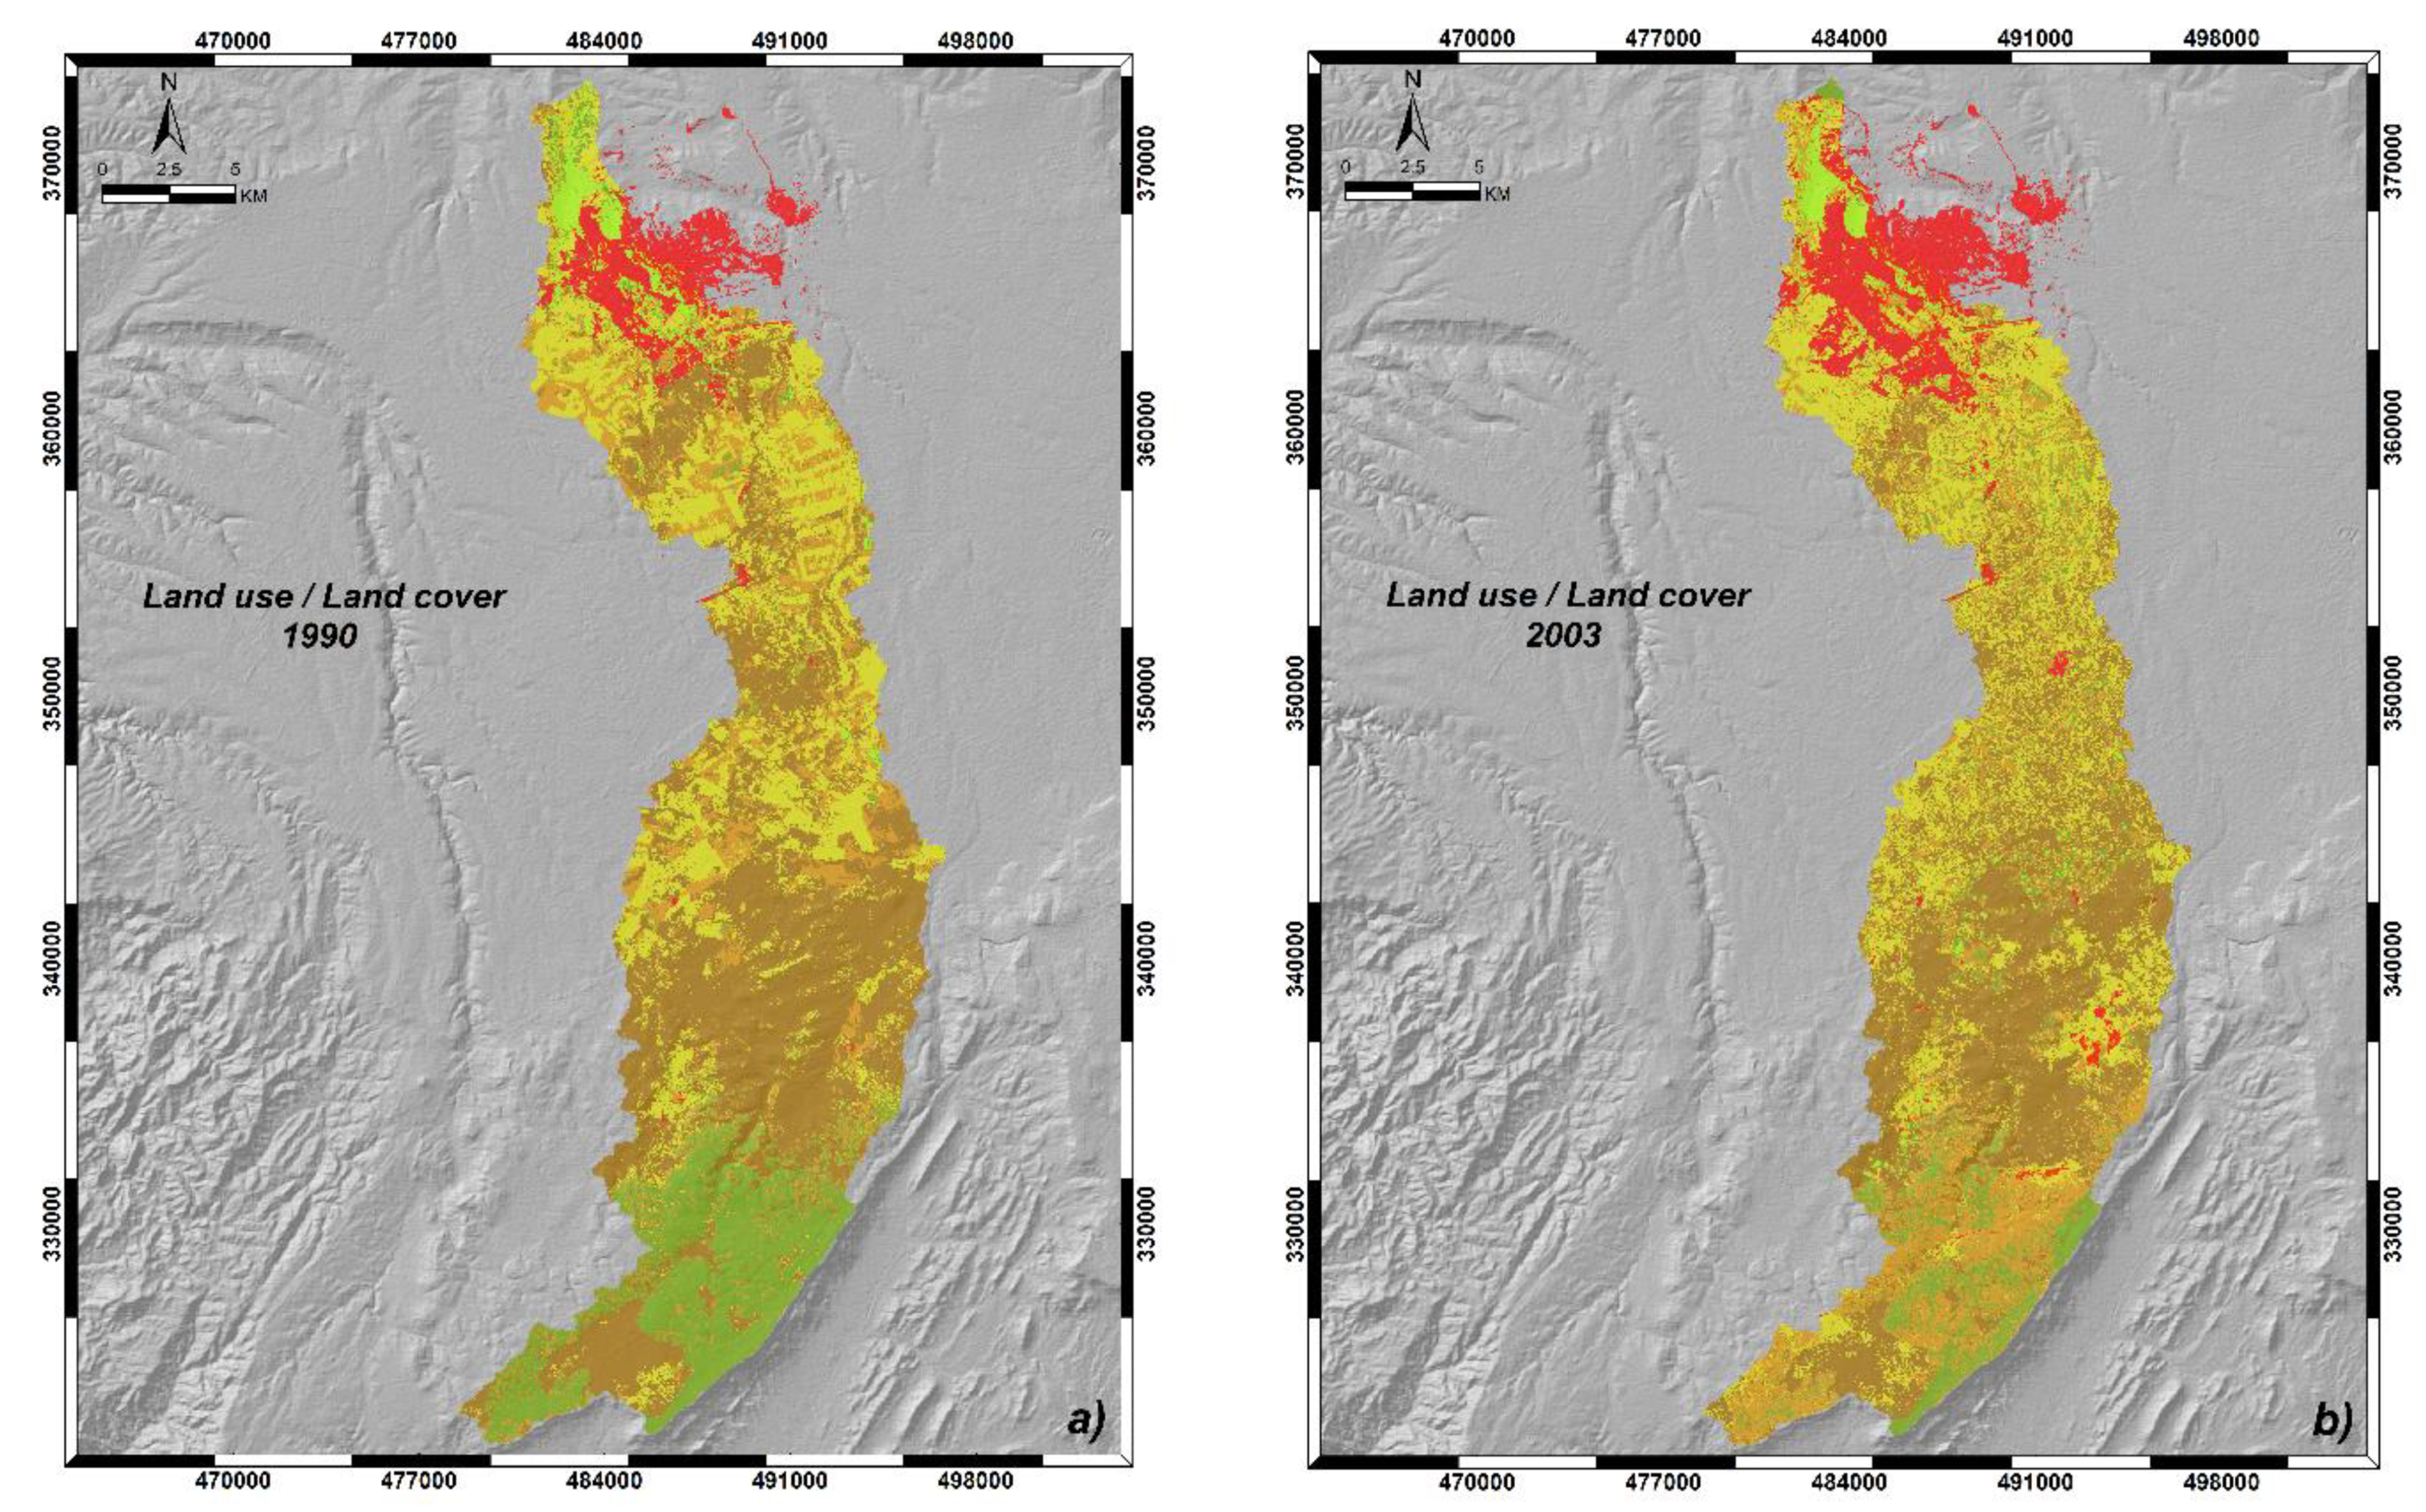
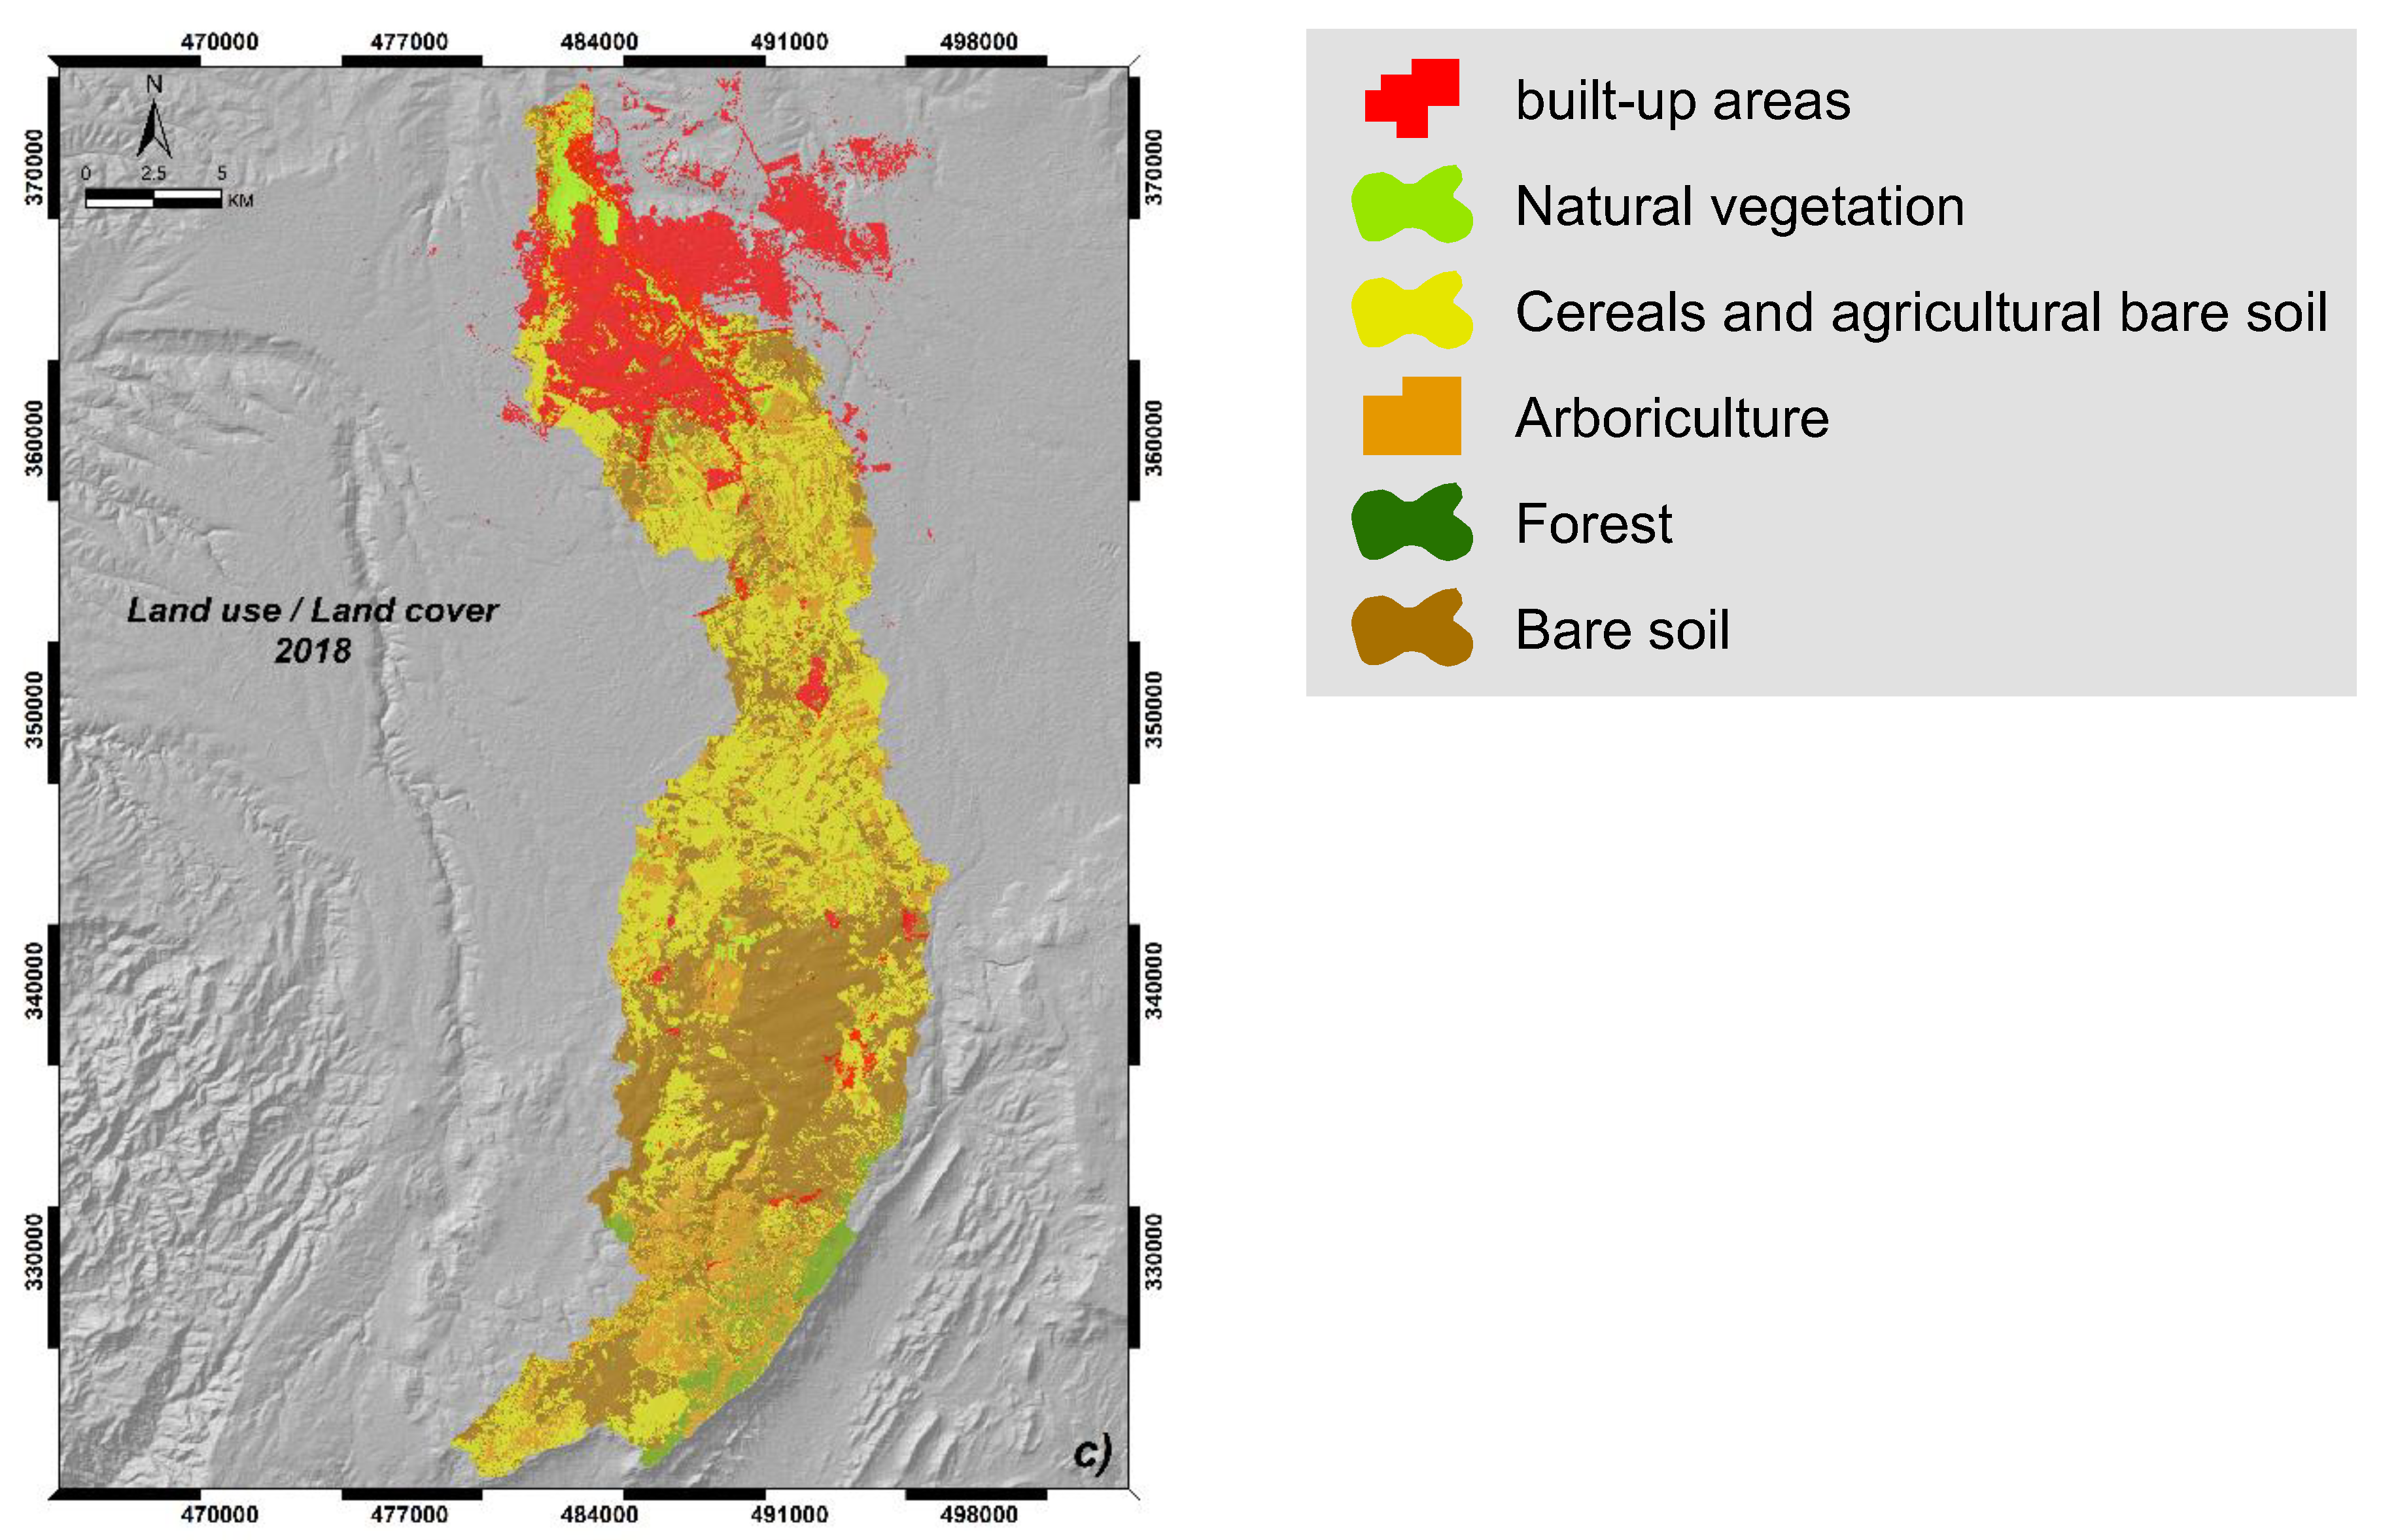
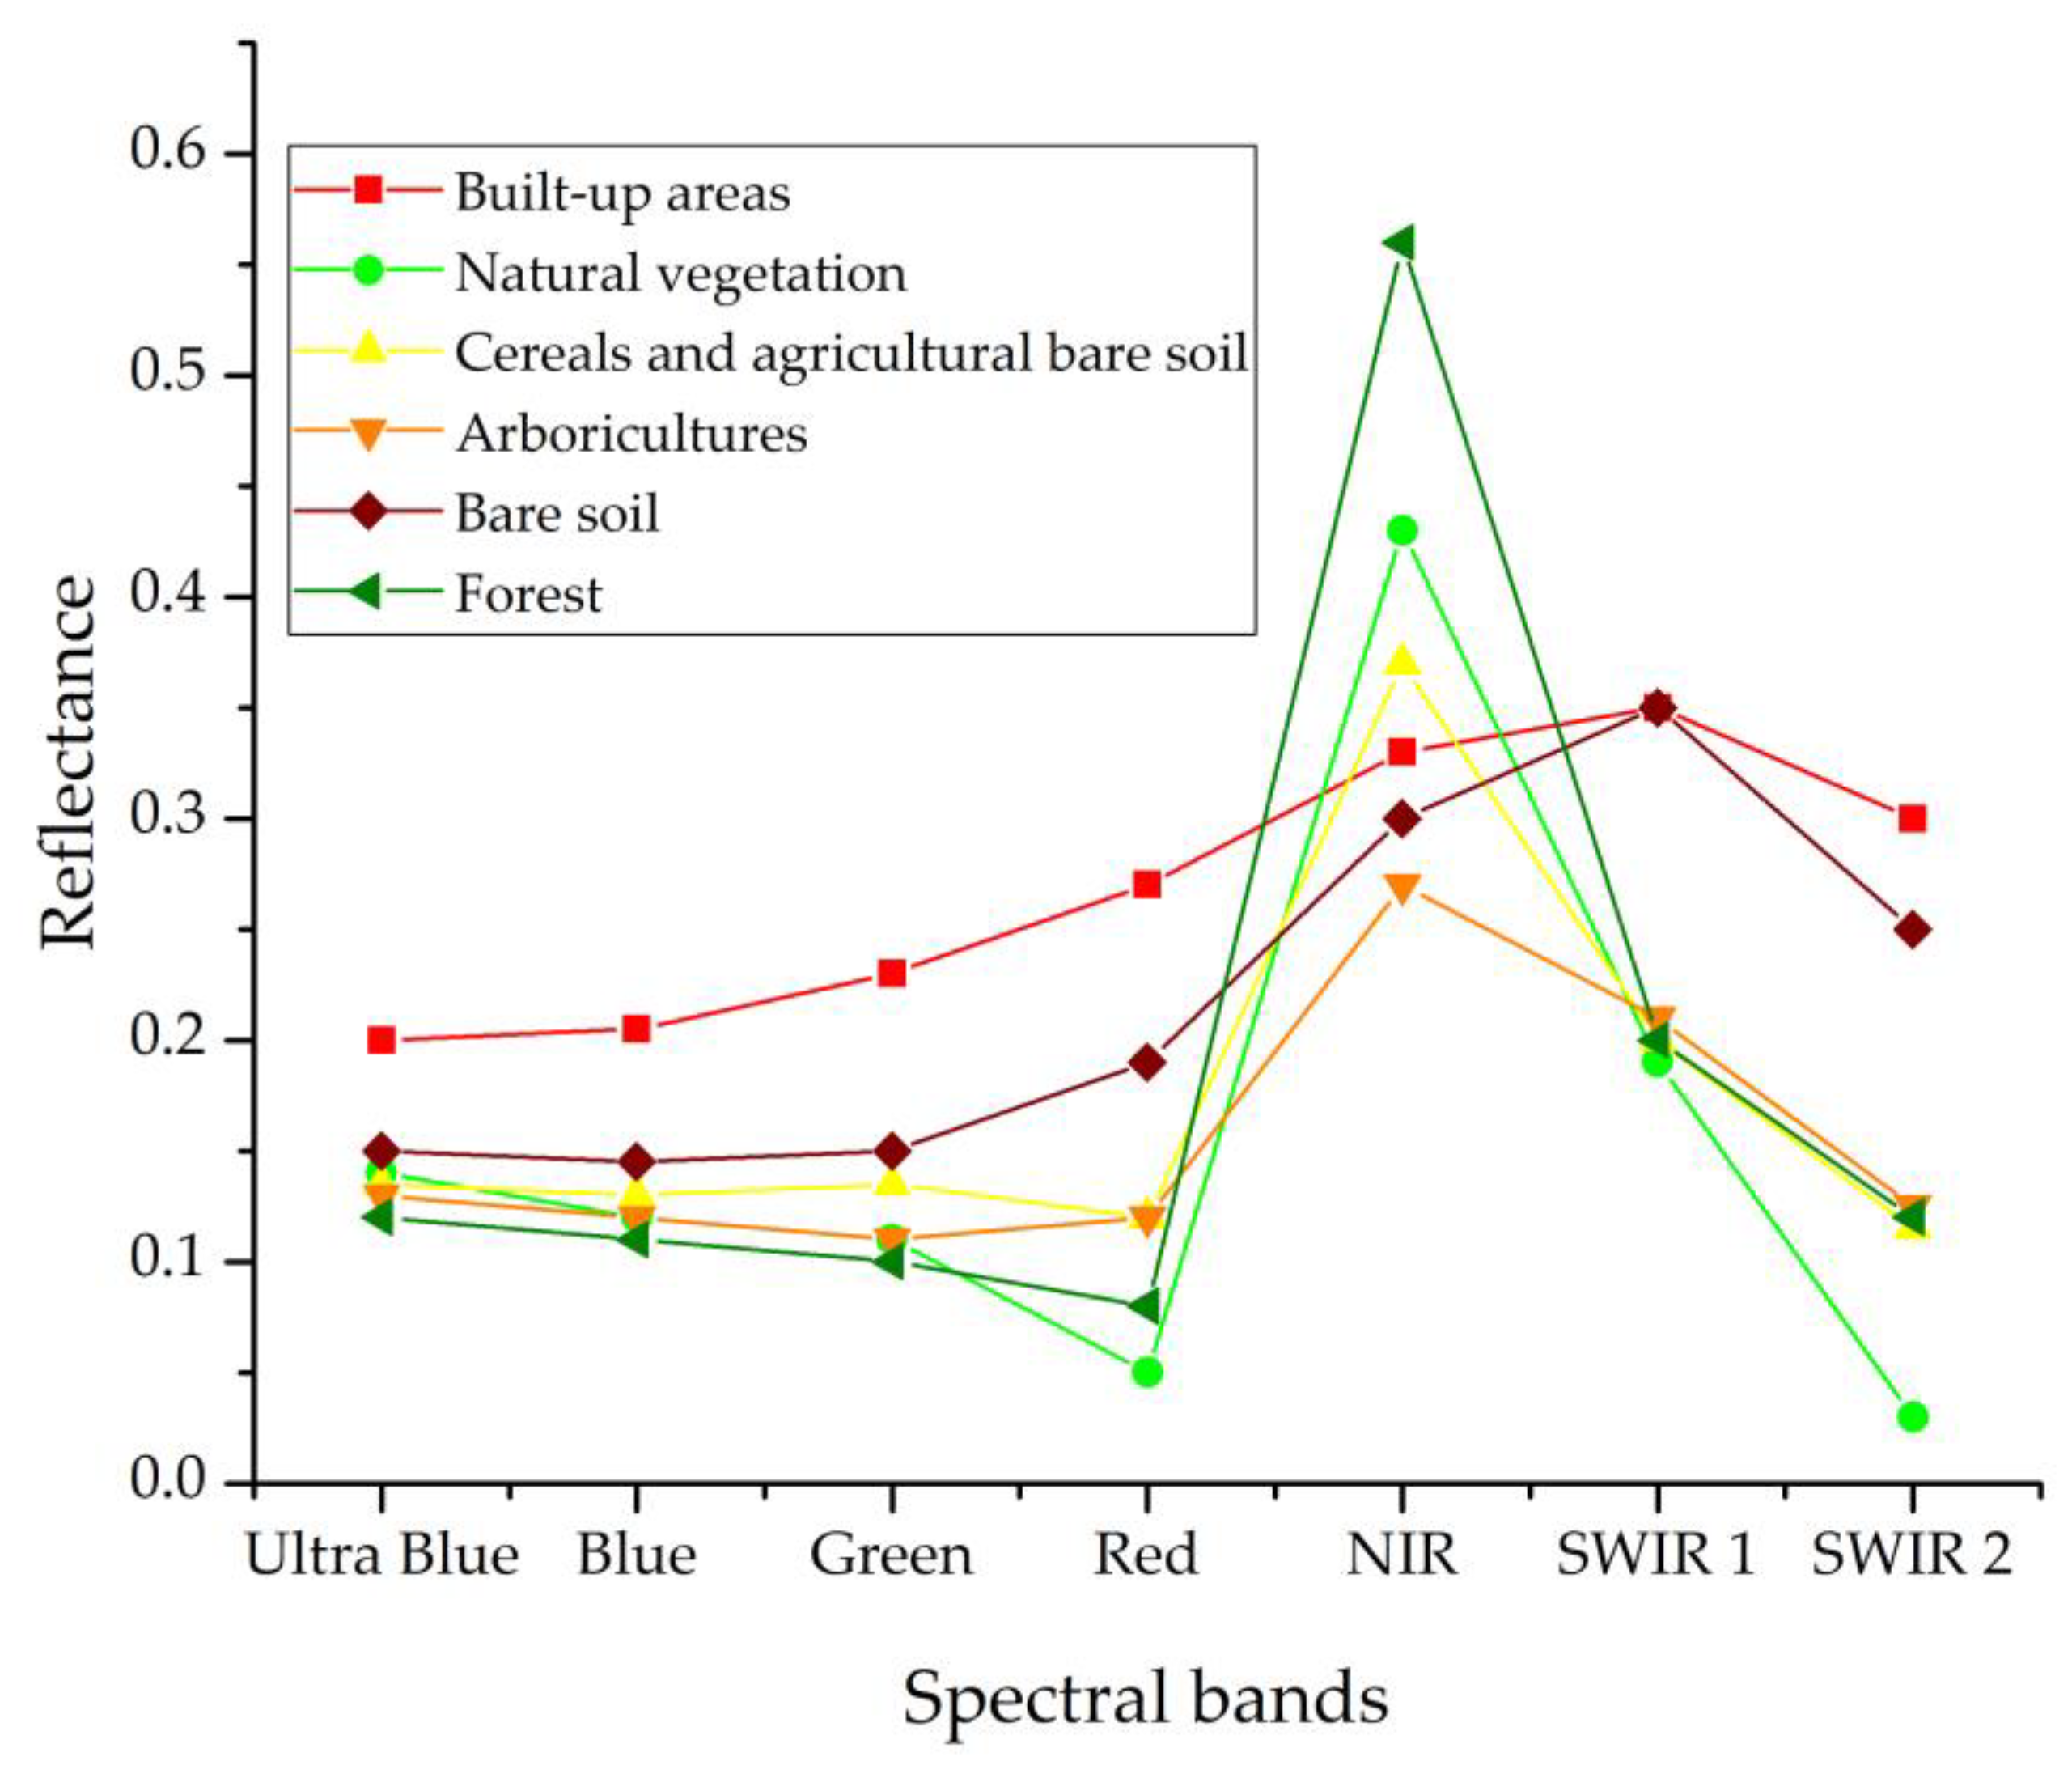
3.1. Land Use Land Cover Changes (LULCC)
3.2. Overall Accuracy
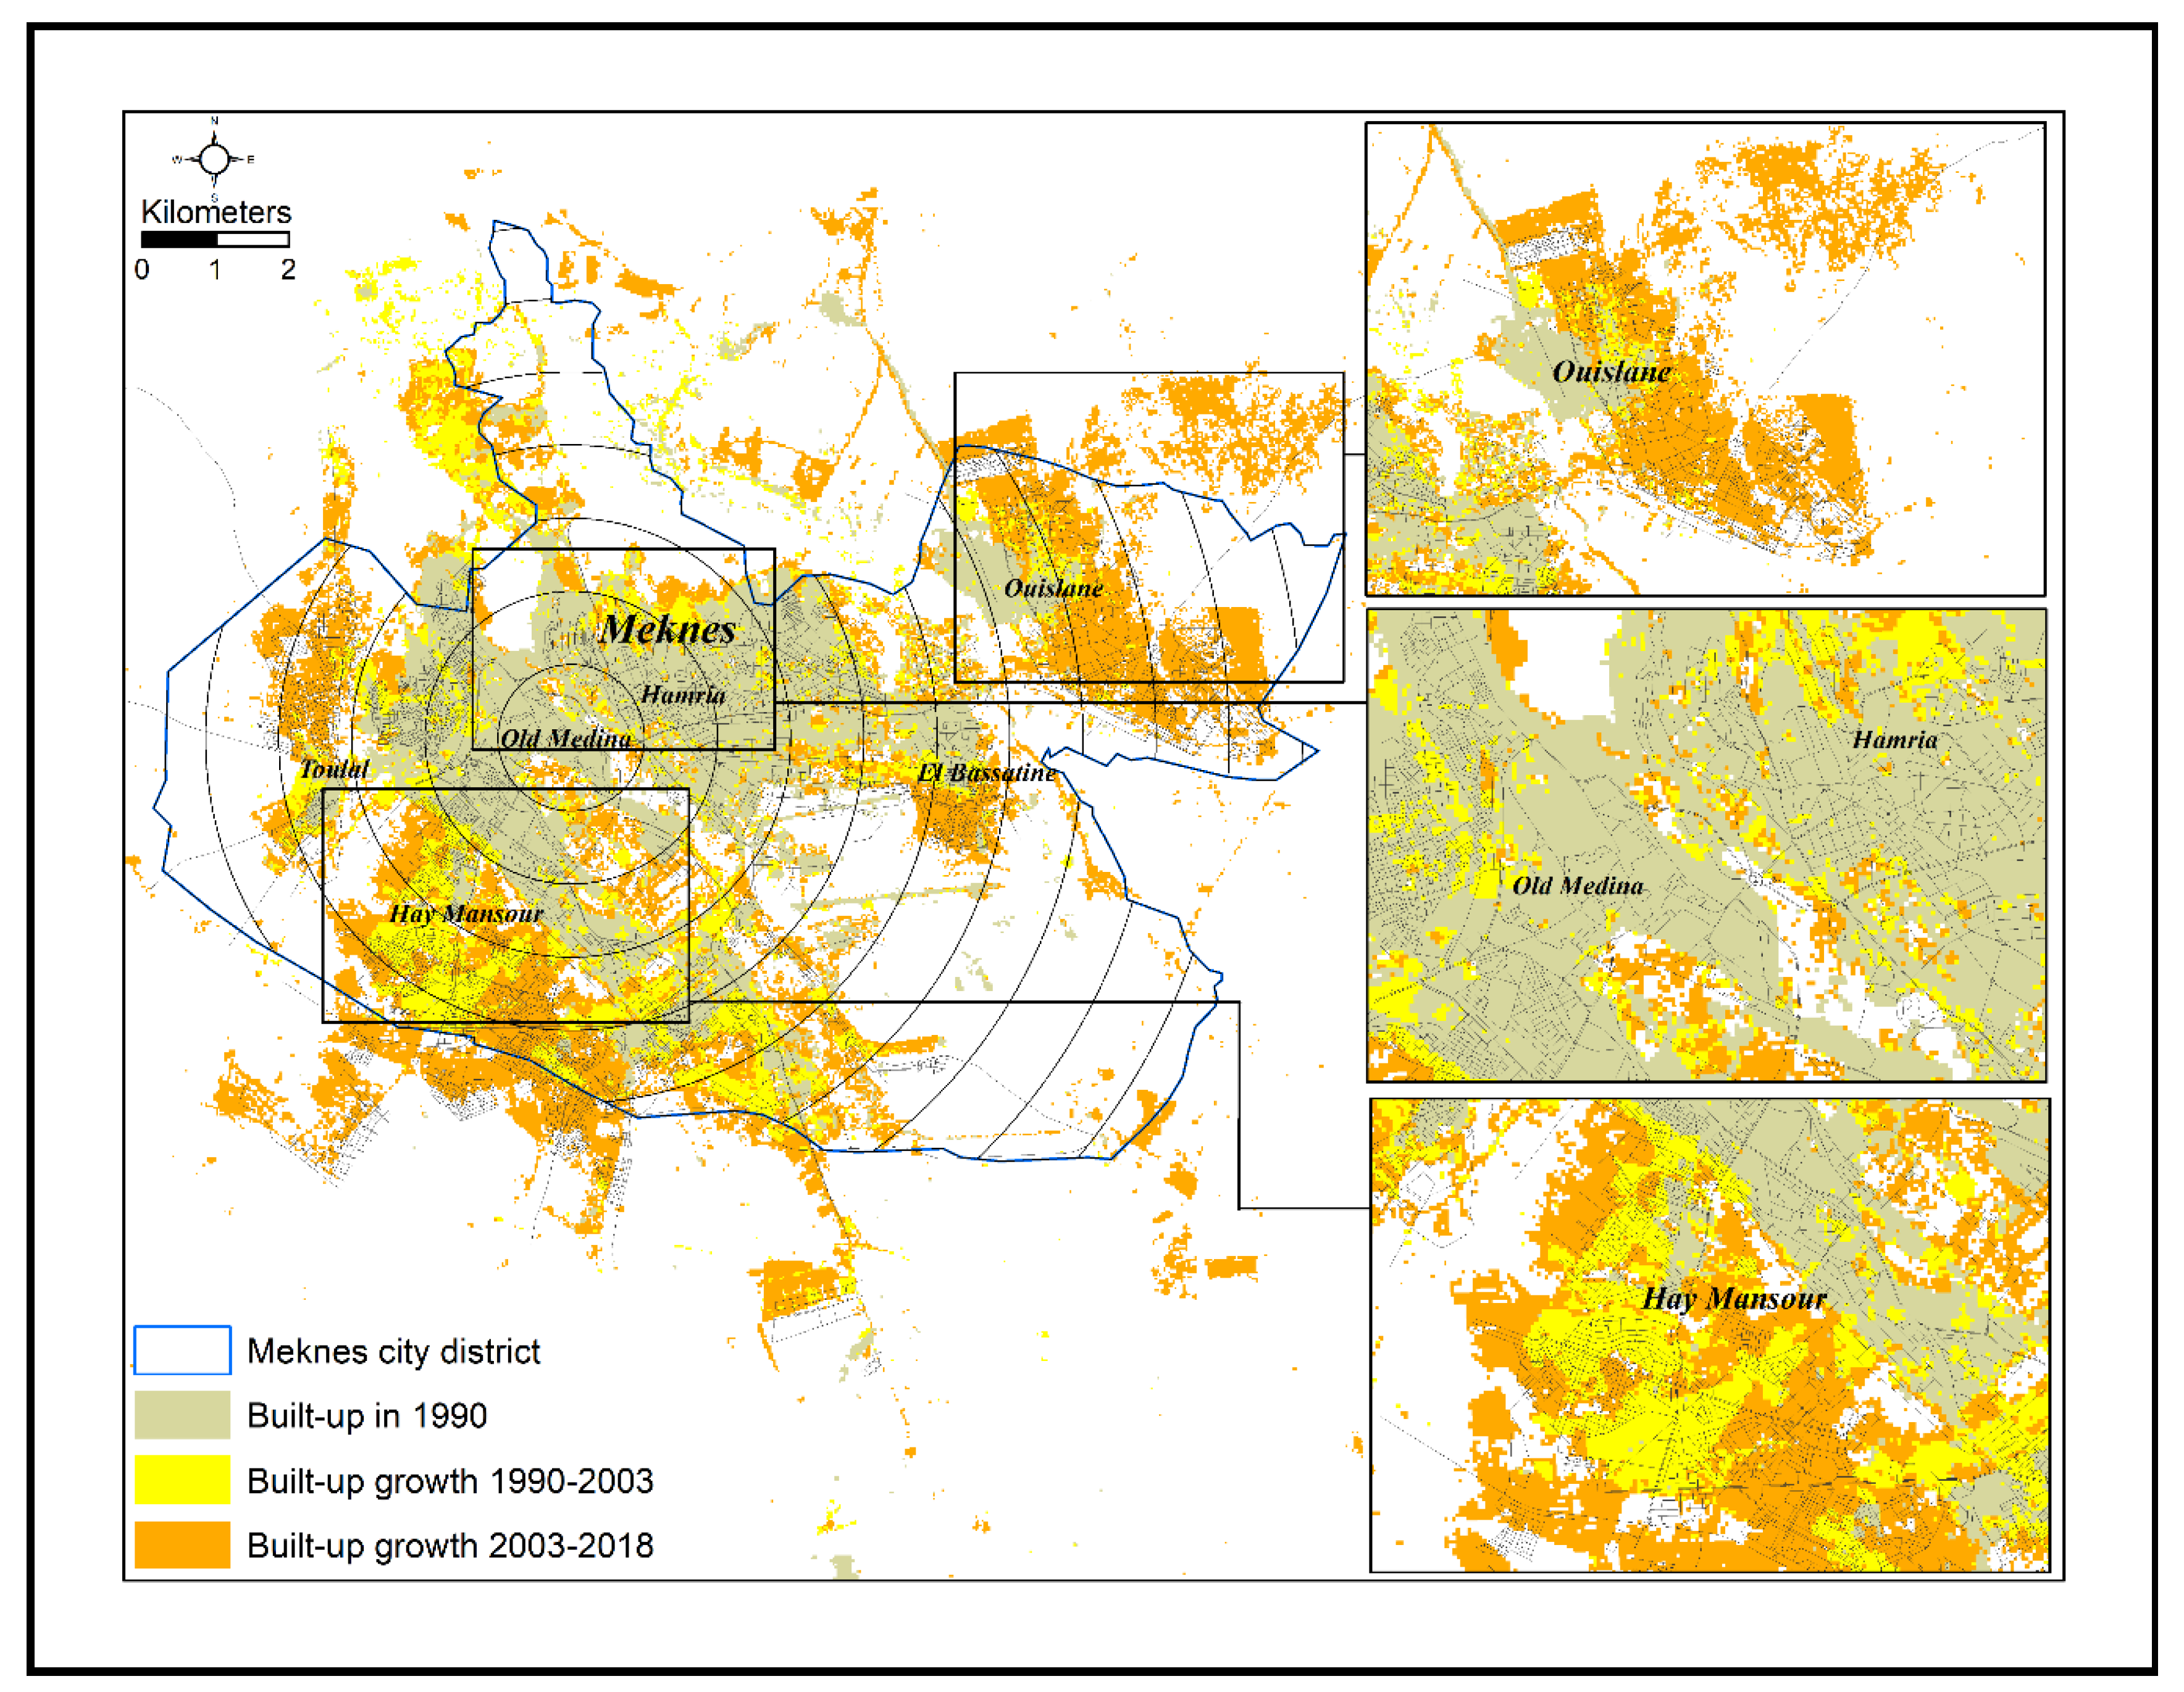
3.3. Urban Growth of Meknes City 1990–2018
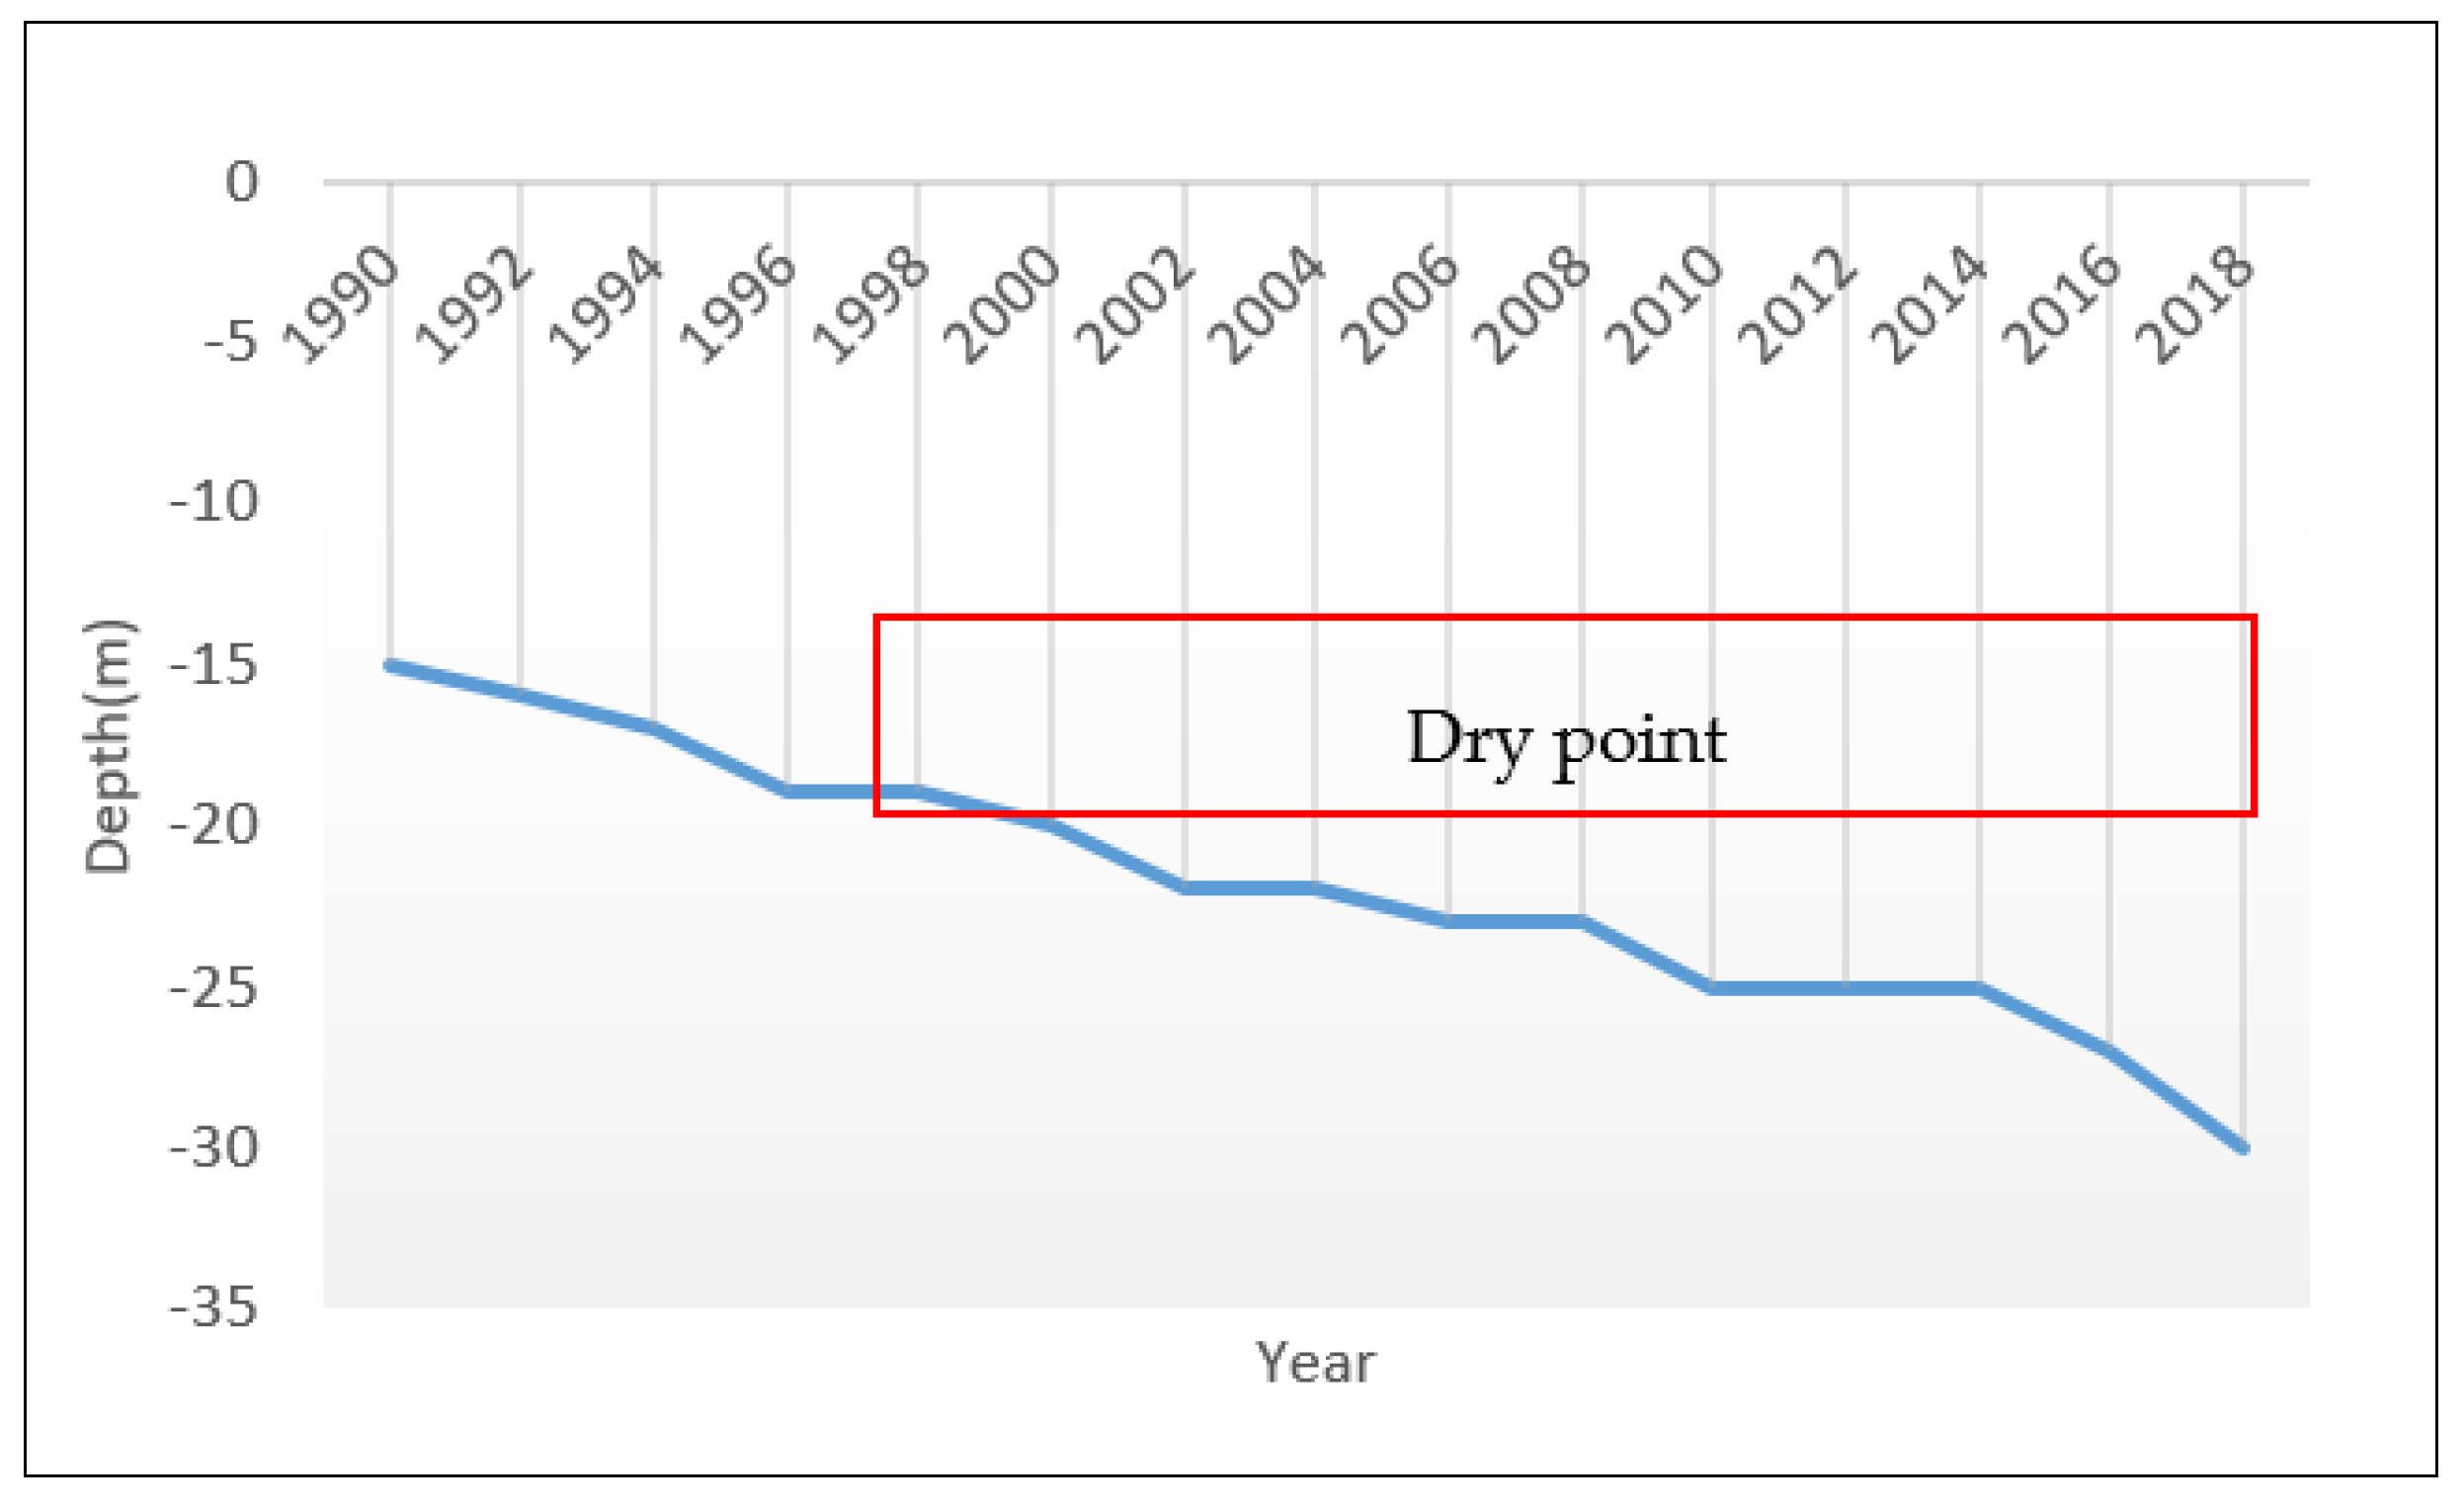
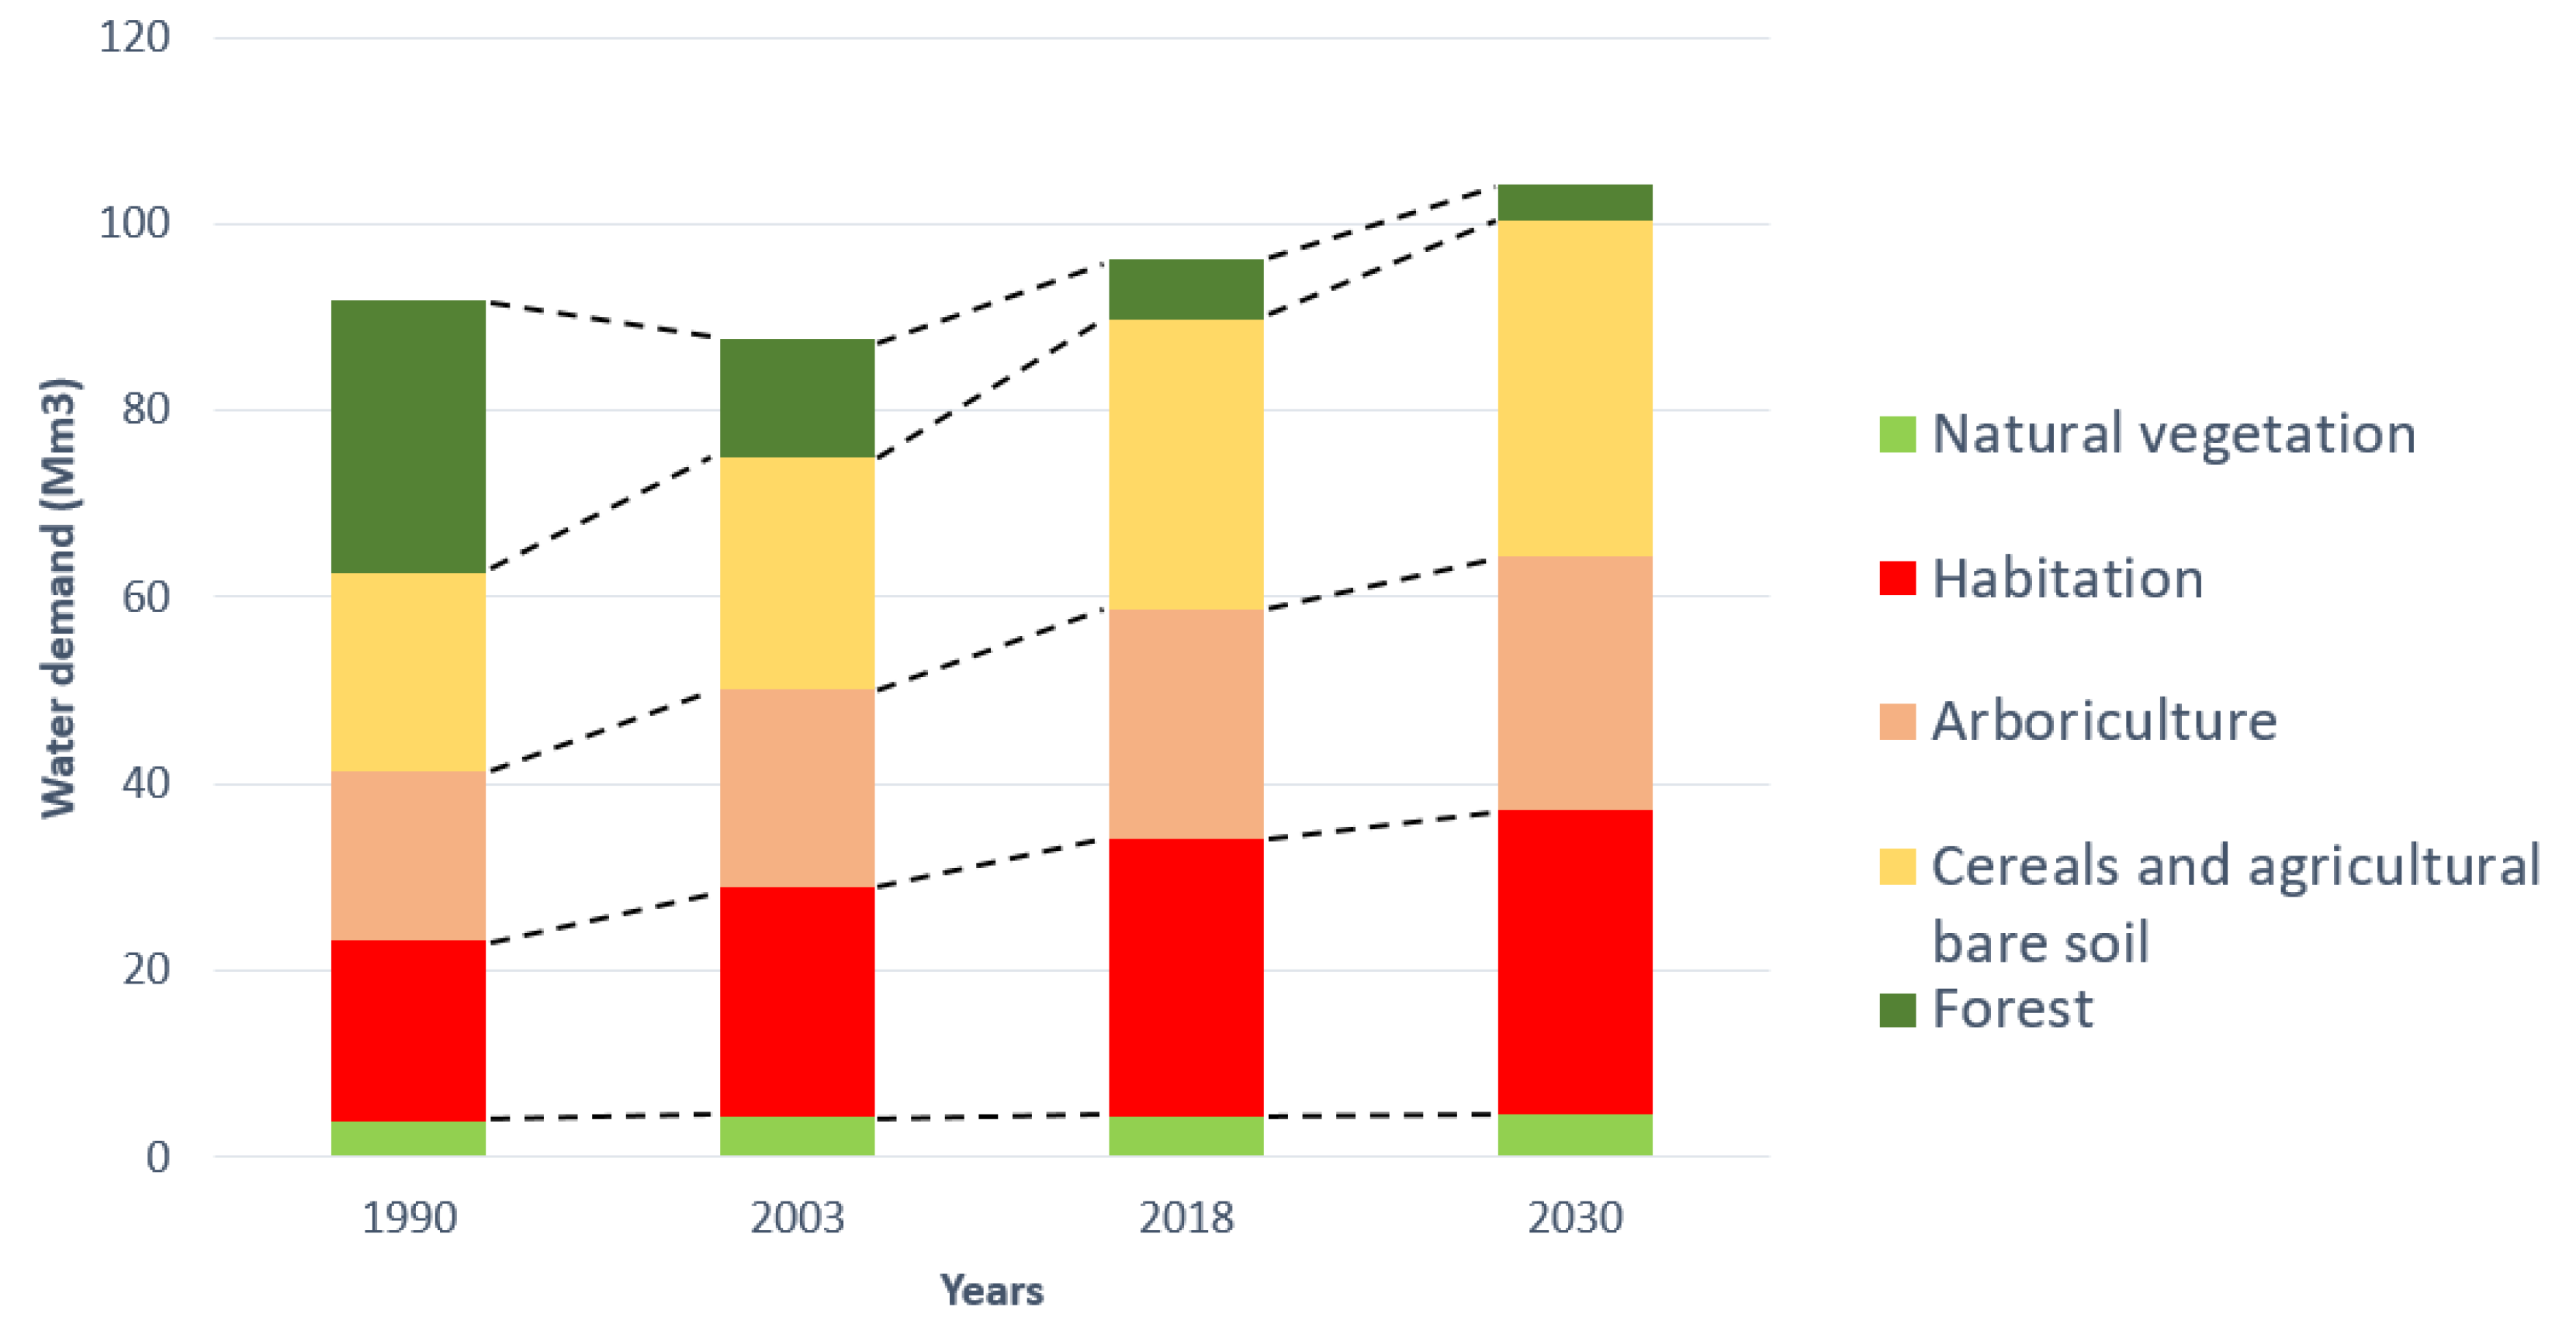
3.4. Water Availability and Water Demand
3.5. Results’ Interpretation
4. Conclusions
Author Contributions
Funding
Acknowledgments
Conflicts of Interest
References
- Cuenca, J.C.; de Murcia, R.; del Campo García, A.; España, D.R.M. Euro-Mediterranean Information System on Know How in the Water Sector. Available online: https://www.riob.org/fr/node/3071 (accessed on 18 January 2020).
- Martinez, M.G.; Poole, N. The development of private fresh produce safety standards: Implications for developing Mediterranean exporting countries. Food Policy 2004, 29, 229–255. [Google Scholar] [CrossRef] [Green Version]
- Cramer, W.; Guiot, J.; Fader, M.; Garrabou, J.; Gattuso, J.P.; Iglesias, A.; Lange, M.A.; Lionello, P.; Llasat, M.C.; Paz, S.; et al. Climate change and interconnected risks to sustainable development in the Mediterranean. Nat. Clim. Chang. 2018, 8, 972–980. [Google Scholar] [CrossRef] [Green Version]
- Anderson, R.G.; Jin, Y.; Goulden, M.L. Assessing regional evapotranspiration and water balance across a Mediterranean montane climate gradient. Agric. For. Meteorol. 2012, 166, 10–22. [Google Scholar] [CrossRef] [Green Version]
- Bolle, H.-J. Climate, climate variability, and impacts in the Mediterranean area: An overview. In Mediterranean Climate; Springer: Berlin/Heidelberg, Germany, 2003; pp. 5–86. [Google Scholar]
- Ouatiki, H.; Boudhar, A.; Tramblay, Y.; Jarlan, L.; Benabdelouhab, T.; Hanich, L.; El Meslouhi, M.; Chehbouni, A. Evaluation of TRMM 3B42 v7 rainfall product over the Oum Er Rbia watershed in Morocco. Climate 2017, 5, 1. [Google Scholar] [CrossRef]
- Schilling, J.; Freier, K.P.; Hertig, E.; Scheffran, J. Climate change, vulnerability and adaptation in North Africa with focus on Morocco. Agric. Ecosyst. Environ. 2012, 156, 12–26. [Google Scholar] [CrossRef]
- Jellali, M.M. Développement des ressources en eau au Maroc. In Aspects Économiques de la Gestion de l’Eau dans le Bassin Méditerranéen; CIHEAM: Bari, Italy, 1997; pp. 51–68. [Google Scholar]
- Giorgi, F.; Lionello, P. Climate change projections for the Mediterranean region. Glob. Planet. Chang. 2008, 63, 90–104. [Google Scholar] [CrossRef]
- Marcè, R.; RODRÍGUEZ-ARIAS, M.À.; García, J.C.; Armengol, J.O.A.N. El Niño Southern Oscillation and climate trends impact reservoir water quality. Glob. Chang. Biol. 2010, 16, 2857–2865. [Google Scholar] [CrossRef]
- Rivas-Tabares, D.; Tarquis, A.M.; Willaarts, B.; De Miguel, Á. An accurate evaluation of water availability in sub-arid Mediterranean watersheds through SWAT: Cega-Eresma-Adaja. Agric. Water Manag. 2019, 212, 211–225. [Google Scholar] [CrossRef] [Green Version]
- FAO (Ed.) Forests and Agriculture: Land-Use Challenges and Opportunities; FAO: Rome, Italy, 2016. [Google Scholar]
- Bakr, N.; Afifi, A.A. Quantifying land use/land cover change and its potential impact on rice production in the Northern Nile Delta, Egypt. Remote Sens. Appl. Soc. Environ. 2019, 13, 348–360. [Google Scholar] [CrossRef]
- Barakat, A.; Ouargaf, Z.; Khellouk, R.; El Jazouli, A.; Touhami, F. Land use/land cover change and environmental impact assessment in béni-mellal district (Morocco) using remote sensing and gis. Earth Syst. Environ. 2019, 3, 113–125. [Google Scholar] [CrossRef]
- Barakat, A.; Khellouk, R.; El Jazouli, A.; Touhami, F.; Nadem, S. Monitoring of forest cover dynamics in eastern area of Béni-Mellal Province using ASTER and Sentinel-2A multispectral data. Geol. Ecol. Landsc. 2018, 2, 203–215. [Google Scholar] [CrossRef] [Green Version]
- El Jazouli, A.; Barakat, A.; Khellouk, R.; Rais, J.; El Baghdadi, M. Remote sensing and GIS techniques for prediction of land use land cover change effects on soil erosion in the high basin of the Oum Er Rbia River (Morocco). Remote Sens. Appl. Soc. Environ. 2019, 13, 361–374. [Google Scholar] [CrossRef]
- Mohajane, M.; Essahlaoui, A.; Oudija, F.; El Hafyani, M.; Hmaidi, A.E.; El Ouali, A.; Randazzo, G.; Teodoro, A.C. Land Use/Land Cover (LULC) Using Landsat Data Series (MSS, TM, ETM+ and OLI) in Azrou Forest, in the Central Middle Atlas of Morocco. Environments 2018, 5, 131. [Google Scholar] [CrossRef] [Green Version]
- Rogan, J.; Chen, D. Remote sensing technology for mapping and monitoring land-cover and land-use change. Prog. Plan. 2004, 61, 301–325. [Google Scholar] [CrossRef]
- Wu, Q.; Li, H.Q.; Wang, R.S.; Paulussen, J.; He, Y.; Wang, M.; Wang, B.H.; Wang, Z. Monitoring and Predicting Land Use Change in Beijing Using Remote Sensing. Landsc. Urban Planing 2006, 78, 322–333. [Google Scholar] [CrossRef]
- Balthazar, V.; Vanacker, V.; Molina, A.; Lambin, E.F. Impacts of forest cover change on ecosystem services in high Andean mountains. Ecol. Indic. 2015, 48, 63–75. [Google Scholar] [CrossRef]
- Gerard, F.; Petit, S.; Smith, G.; Thomson, A.; Brown, N.; Manchester, S.; Wadsworth, R.; Bugar, G.; Halada, L.; Bezak, P.; et al. Land cover change in Europe between 1950 and 2000 determined employing aerial photography. Prog. Phys. Geogr. 2010, 34, 183–205. [Google Scholar] [CrossRef] [Green Version]
- Muttitanon, W.; Tripathi, N.K. Land use/land cover changes in the coastal zone of Ban Don Bay, Thailand using Landsat 5 TM data. Int. J. Remote Sens. 2005, 26, 2311–2323. [Google Scholar] [CrossRef]
- Pervez, M.S.; Henebry, G.M. Assessing the impacts of climate and land use and land cover change on the freshwater availability in the Brahmaputra River basin. J. Hydrol. Reg. Stud. 2015, 3, 285–311. [Google Scholar] [CrossRef] [Green Version]
- Essahlaoui, A.; Teodoro, A.C.; Mohajane, M. Modeling and mapping of soil salinity in Tafilalet plain (Morocco). Arab. J. Geosci. 2019, 12, 35. [Google Scholar]
- Mohajane, M.; Essahlaoui, A.; Oudija, F.; El Hafyani, M.; Cláudia Teodoro, A. Mapping forest species in the central middle atlas of Morocco (Azrou Forest) through remote sensing techniques. ISPRS Int. J. Geo-Inf. 2017, 6, 275. [Google Scholar] [CrossRef] [Green Version]
- Liang, D.; Zuo, Y.; Huang, L.; Zhao, J.; Teng, L.; Yang, F. Evaluation of the consistency of MODIS Land Cover Product (MCD12Q1) based on Chinese 30 m GlobeLand30 datasets: A case study in Anhui Province, China. ISPRS Int. J. Geo-Inf. 2015, 4, 2519–2541. [Google Scholar] [CrossRef] [Green Version]
- Satyanarayana, B.; Thierry, B.; Seen, D.L.; Raman, A.V.; Muthusankar, G. Remote sensing in mangrove research–relationship between vegetation indices and dendrometric parameters: A Case for Coringa, East Coast of India. In Proceedings of the 22nd Asian Conference on Remote Sensing, Singapore, 5–9 November 2001; pp. 5–9. [Google Scholar]
- Reis, S. Analyzing land use/land cover changes using remote sensing and GIS in Rize, North-East Turkey. Sensors 2008, 8, 6188–6202. [Google Scholar] [CrossRef] [PubMed]
- Dewany, A.M. Yamaguchi, Land use and land cover change in Greater Dhaka, Bangladesh: Using remote sensing to promote sustainable urbanization. Appl. Geogr. 2009, 29, 390–401. [Google Scholar] [CrossRef]
- Baldi, G.; Paruelo, J.M. Land-use and land cover dynamics in South American temperate grasslands. Ecol. Soc. 2008, 13, 6. [Google Scholar] [CrossRef]
- Rawat, J.S.; Manish, K. Monitoring land use/cover change using remote sensing and GIS techniques: A case study of Hawalbagh block, district Almora, Uttarakhand, India. Egypt. J. Remote Sens. Space Sci. 2015, 18, 77–84. [Google Scholar] [CrossRef] [Green Version]
- Shalaby, A.; Tateishi, R. Remote sensing and GIS for mapping and monitoring land cover and land-use changes in the Northwestern coastal zone of Egypt. Appl. Geogr. 2007, 27, 28–41. [Google Scholar] [CrossRef]
- Diouf, A.; Lambin, E.F. Monitoring land-cover changes in semi-arid regions: Remote sensing data and field observations in the Ferlo, Senegal. J. Arid Environ. 2001, 48, 129–148. [Google Scholar] [CrossRef]
- Seitzinger, S.P.; Gaffney, O.; Brasseur, G.; Broadgate, W.; Ciais, P.; Claussen, M.; Erisman, J.W.; Kiefer, T.; Lancelot, C.; Monks, P.S.; et al. International Geosphere–Biosphere Programme and Earth system science: Three decades of co-evolution. Anthropocene 2015, 12, 3–16. [Google Scholar] [CrossRef]
- Woldesenbet, T.A.; Elagib, N.A.; Ribbe, L.; Heinrich, J. Hydrological responses to land use/cover changes in the source region of the Upper Blue Nile Basin, Ethiopia. Sci. Total Environ. 2017, 575, 724–741. [Google Scholar] [CrossRef]
- Van Ty, T.; Sunada, K.; Ichikawa, Y.; Oishi, S. Scenario-based impact assessment of land use/cover and climate changes on water resources and demand: A case study in the Srepok River Basin, Vietnam—Cambodia. Water Resour. Manag. 2012, 26, 1387–1407. [Google Scholar]
- Li, Z.; Deng, X.; Wu, F.; Hasan, S. Scenario analysis for water resources in response to land use change in the middle and upper reaches of the Heihe River Basin. Sustainability 2015, 7, 3086–3108. [Google Scholar] [CrossRef] [Green Version]
- Essahlaoui, A.; Sahbi, H.; Bahi, L.; El-Yamine, N. Reconnaissance de la structure géologique du bassin de Saiss occidental, Maroc, par sondages électriques. J. Afr. Earth Sci. 2001, 32, 777–789. [Google Scholar] [CrossRef]
- Population Légale d’après les Résultats du RGPH 2014 sur le Bulletin Officiel N°. Available online: https://rgph2014.hcp.ma/downloads/Resultats-RGPH-2014_t18649.html (accessed on 18 January 2020).
- Erbek, F.S.; Özkan, C.; Taberner, M. Comparison of maximum likelihood classification method with supervised artificial neural network algorithms for land use activities. Int. J. Remote Sens. 2004, 25, 1733–1748. [Google Scholar] [CrossRef]
- Otukei, J.R.; Blaschke, T. Land cover change assessment using decision trees, support vector machines and maximum likelihood classification algorithms. Int. J. Appl. Earth Obs. Geoinf. 2010, 12, S27–S31. [Google Scholar] [CrossRef]
- Paola, J.D.; Schowengerdt, R.A. A review and analysis of backpropagation neural networks for classification of remotely-sensed multi-spectral imagery. Int. J. Remote Sens. 1995, 16, 3033–3058. [Google Scholar] [CrossRef]
- Lewis, H.G.; Brown, M. A generalized confusion matrix for assessing area estimates from remotely sensed data. Int. J. Remote Sens. 2001, 22, 3223–3235. [Google Scholar] [CrossRef]
- Card, D.H. Using known map category marginal frequencies to improve estimates of thematic map accuracy. Photogramm. Eng. Remote Sens. 1982, 48, 431–439. [Google Scholar]
- Titus, K.; Mosher, J.A.; Williams, B.K. Chance-corrected classification for use in discriminant analysis: Ecological applications. Am. Midl. Nat. 1984, 111, 1–7. [Google Scholar] [CrossRef]
- Bwangoy, J.R.B.; Hansen, M.C.; Roy, D.P.; De Grandi, G.; Justice, C.O. Wetland mapping in the Congo Basin using optical and radar remotely sensed data and derived topographical indices. Remote Sens. Environ. 2010, 114, 73–86. [Google Scholar] [CrossRef]
- Agence Urbaine. Projet de Plan D’action de Développement Local Meknès; Meknès, Maroc, 2009. Available online: https://www.hcp.ma/region-meknes/attachment/428604/ (accessed on 18 January 2020).
- Ministère Délègue Charge de l’Habitat et de l’Habitat et de l’Urbanisme, 2004, «Villes sans Bidonvilles». Available online: https://mirror.unhabitat.org/downloads/docs/11592_4_594598.pdf (accessed on 18 January 2020).
- FAO. Food and Agricultural Organization of the United Nations FAO AQUASTAT Database; FAO: Rome, Italy, 2014; Available online: https://www.fao.orgnraquastat.pdf (accessed on 11 November 2018).
- MAPM. Ministère de l’Agriculture et de la Pèche Maritime, Rapport Plan Maroc Vert; MAPM: Rabat, Morocco, May 2011. [Google Scholar]
- Plan Bleu. Environnement et Développement en Méditerranée. Les Notes du Plan Bleu, No 11. 2009. Available online: https://planbleu.org/sites/default/files/publications/soed2009-fr.pdf (accessed on 18 January 2020).
- Régie Autonome de Distribution d’Eau et d’Électricité de Meknès, Rapport de Gestion 2016 & Comptes Annuels. Available online: https://www.radeema.ma/documents/56925/56948/RG2016+web.pdf/2bc8116b-3429-459f-997a-783226946cbc (accessed on 18 January 2020).
- Oñate-Valdivieso, F.; Sendra, J.B. Application of GIS and remote sensing techniques in generation of land use scenarios for hydrological modeling. J. Hydrol. 2010, 395, 256–263. [Google Scholar] [CrossRef]
- Haque, M.M.; Egodawatta, P.; Rahman, A.; Goonetilleke, A. Assessing the significance of climate and community factors on urban water demand. Int. J. Sustain. Built Environ. 2015, 4, 222–230. [Google Scholar] [CrossRef]
- Xiao, J.; Shen, Y.; Ge, J.; Tateishi, R.; Tang, C.; Liang, Y.; Huang, Z. Evaluating urban expansion and land use change in Shijiazhuang, China, by using GIS and remote sensing. Landsc. Urban Plan. 2006, 75, 69–80. [Google Scholar] [CrossRef]
- Fung-Loy, K.; Van Rompaey, A.; Hemerijckx, L.M. Detection and Simulation of Urban Expansion and Socioeconomic Segregation in the Greater Paramaribo Region, Suriname. Tijdschr. Voor Econ. En Soc. Geogr. 2019, 110, 339–358. [Google Scholar] [CrossRef]
- El Garouani, A.; Mulla, D.J.; El Garouani, S.; Knight, J. Analysis of urban growth and sprawl from remote sensing data: Case of Fez, Morocco. Int. J. Sustain. Built Environ. 2017, 6, 160–169. [Google Scholar] [CrossRef]
- Höpfner, C.; Scherer, D. Analysis of vegetation and land cover dynamics in north-western Morocco during the last decade using MODIS NDVI time series data. Biogeosciences 2011, 8, 3359–3373. [Google Scholar] [CrossRef] [Green Version]


| Area 1990 (ha) | Area 2003 (ha) | Area 2018 (ha) | Chang 1990–2018 | ||
|---|---|---|---|---|---|
| (ha) | (%) | ||||
| Built-up area | 2577 | 3758 | 7314 | +4736 | +183 |
| Natural vegetation | 941 | 1022 | 1059 | +118 | +12 |
| Cereals and agricultural bare soil | 9720 | 11,420 | 14,262 | +4541 | +48 |
| Arboriculture | 5733 | 6707 | 7740 | +2006 | +34 |
| Forest | 7026 | 3026 | 1500 | −5526 | −78 |
| Bare soil | 16,217 | 14,535 | 13,499 | −2718 | −16 |
| Ground Truth (%) | Total (%) | ||||||||||||||||||||
|---|---|---|---|---|---|---|---|---|---|---|---|---|---|---|---|---|---|---|---|---|---|
| Class | Cereals and Agricultural Bare Soil | Arboriculture | Forest | Urban Area | Bare Soil | Natural Vegetation | |||||||||||||||
| Year | 1990 | 2003 | 2018 | 1990 | 2003 | 2018 | 1990 | 2003 | 2018 | 1990 | 2003 | 2018 | 1990 | 2003 | 2018 | 1990 | 2003 | 2018 | 1990 | 2003 | 2018 |
| Cereals and agricultural bare soil | 57.83 | 76.45 | 82.14 | 19.57 | 19.57 | 2.46 | 1.95 | 0 | 0.19 | 0.52 | 0.78 | 0.56 | 17 | 21.63 | 7.77 | 0.26 | 0 | 0 | 30.67 | 40.06 | 30.67 |
| Arboriculture | 28.16 | 4.74 | 7.7 | 55 | 26.24 | 86.26 | 9.53 | 11.09 | 27.63 | 3.3 | 2.86 | 0.15 | 1.61 | 1.94 | 0.33 | 0.77 | 1.02 | 8.18 | 19.42 | 6.83 | 19.42 |
| Forest | 2.13 | 1.31 | 0.59 | 4.51 | 18.85 | 0.03 | 81.13 | 88.91 | 72.18 | 0.67 | 0 | 0.11 | 0.98 | 0.48 | 0.36 | 2.3 | 5.12 | 0 | 3.74 | 5.61 | 3.74 |
| Urban area | 0 | 0.09 | 0.59 | 0.42 | 0.09 | 0.03 | 0 | 0 | 0 | 96.18 | 96.01 | 99 | 0.05 | 0.01 | 0 | 0 | 0 | 0 | 5.04 | 5.02 | 5.04 |
| Bare soil | 11.87 | 16.76 | 8.63 | 16.17 | 21.16 | 1.2 | 7.39 | 0 | 0 | 0 | 0 | 0.19 | 80.36 | 75.94 | 91.55 | 0 | 0 | 0 | 38.79 | 39.38 | 38.79 |
| Natural vegetation | 0.01 | 0.61 | 0.64 | 4.33 | 8.21 | 10.01 | 0 | 0 | 0 | 0 | 0.35 | 0 | 0 | 0 | 0 | 96.88 | 93.86 | 91.82 | 2.34 | 3.1 | 2.34 |
© 2020 by the authors. Licensee MDPI, Basel, Switzerland. This article is an open access article distributed under the terms and conditions of the Creative Commons Attribution (CC BY) license (http://creativecommons.org/licenses/by/4.0/).
Share and Cite
El Hafyani, M.; Essahlaoui, A.; Van Rompaey, A.; Mohajane, M.; El Hmaidi, A.; El Ouali, A.; Moudden, F.; Serrhini, N.-E. Assessing Regional Scale Water Balances through Remote Sensing Techniques: A Case Study of Boufakrane River Watershed, Meknes Region, Morocco. Water 2020, 12, 320. https://doi.org/10.3390/w12020320
El Hafyani M, Essahlaoui A, Van Rompaey A, Mohajane M, El Hmaidi A, El Ouali A, Moudden F, Serrhini N-E. Assessing Regional Scale Water Balances through Remote Sensing Techniques: A Case Study of Boufakrane River Watershed, Meknes Region, Morocco. Water. 2020; 12(2):320. https://doi.org/10.3390/w12020320
Chicago/Turabian StyleEl Hafyani, Mohammed, Ali Essahlaoui, Anton Van Rompaey, Meriame Mohajane, Abdellah El Hmaidi, Abdelhadi El Ouali, Fouad Moudden, and Nour-Eddine Serrhini. 2020. "Assessing Regional Scale Water Balances through Remote Sensing Techniques: A Case Study of Boufakrane River Watershed, Meknes Region, Morocco" Water 12, no. 2: 320. https://doi.org/10.3390/w12020320
APA StyleEl Hafyani, M., Essahlaoui, A., Van Rompaey, A., Mohajane, M., El Hmaidi, A., El Ouali, A., Moudden, F., & Serrhini, N.-E. (2020). Assessing Regional Scale Water Balances through Remote Sensing Techniques: A Case Study of Boufakrane River Watershed, Meknes Region, Morocco. Water, 12(2), 320. https://doi.org/10.3390/w12020320