Article

Removing Nutrients from Crab-Breeding Wastewater by a Floating Plant–Effective Microorganism Bed

1
College of Agricultural Engineering, Hohai University, Nanjing 210098, China
2
Key Laboratory of Integrated Regulation and Resource Development on Shallow Lake of Ministry of Education, College of Environment, Hohai University, Nanjing 210098, China
3
Jiangsu Provincial Key Laboratory of Environmental Engineering, Jiangsu Provincial Academy of Environmental Sciences, Nanjing 210036, China
4
Jiangsu Engineering Consulting Center, Nanjing 210000, China
*
Author to whom correspondence should be addressed.
Water 2020, 12(12), 3384; https://doi.org/10.3390/w12123384
Submission received: 30 September 2020 / Revised: 7 November 2020 / Accepted: 26 November 2020 / Published: 2 December 2020
(This article belongs to the Section Water, Agriculture and Aquaculture)

Abstract

:
Effective microorganism treatment, a low-cost and remediation measure that with no secondary pollution, was conducted in aquaculture wastewater. Unfortunately, effective microorganism erosion caused by the momentum of water flow under in situ conditions limits the treatment effect. In the channel test, a floating plant bed coupled with the effective microorganism was used to treat crab-breeding wastewater. This study explored the effect of plant coverage and hydraulic loading on aquaculture wastewater purification in the floating plant bed–effective microorganism coupled system. The results show that the effect of the coupled treatment effect is much better than pure microorganism treatment. The pollutant degradation coefficient has a significantly positive correlation with the length of the floating plant bed. A plant coverage rate of 30% and effluent hydraulic loading of 1.0 m3/m2·day are optimum floating plant bed–effective microorganism test conditions. Once the coverage rate exceeded 30%, the increase in the CODMn removal efficiency was not clear. At the same time, the high plant coverage inhibited the oxygen capacity in the water body, which directly led to a decrease in the degradation ability of organic matter by the plant. The biology–ecology coupled technology proposed in this study overcame the shortcomings of the easy-to-lose effective microorganism during the traditional unfixed process and improved the stability of the processing system. It strengthened the crab-breeding wastewater remediation effect. For an in situ application, the artificial restoration system 1 km in length was efficient, and the discharge met the standard at the end of the river.

1. Introduction

Intensive aquaculture has developed rapidly, providing high economic benefits. However, it can also lead to a high level of eutrophication of the aquaculture water [1], which not only destroys the ecological balance of the aquatic environment but also potentially impacts receiving waters [2]. Aquaculture wastewater treatment technology mainly relies on physical technology [3], chemical technology [4] and biotechnology [5,6,7]. Among them, physical and chemical technologies often involve new chemical reagents or materials and lead to secondary pollution. As an alternative, biotechnology has been widely used due to its low cost, high security and easy implementation.
Effective microorganisms can effectively decompose organic substances in water bodies as well as reduce the content of harmful substances, such as ammonia nitrogen, nitrite, hydrogen sulfide and so on. During this process, harmful substances in the water can be transformed into harmless substances by microbial enzymes. In addition, effective microorganisms can inhibit the effect of pathogenic bacteria breeding and ammonia or other humus production. In aquaculture water habitats, the long-term application of effective microorganisms can rebuild the aquaculture water ecosystem to maintain the ecological water balance and enhance the self-purification ability. The bioremediation of aquaculture wastewater utilizing natural bacteria has been adopted in open, uncontrolled systems such as remediation ponds [8]. However, the traditional spraying or mixing method of effective microorganisms limited the effect of aquaculture wastewater treatment. To deal with this issue, Wu and Chen et al. attempted to employ immobilized microorganisms to purify aquaculture wastewater [9,10]. In addition, phytoremediation is an eco-friendly approach for the remediation of contaminated water using plants [11,12]. Close-to-nature management is becoming the dominant idea to improve aquatic environments worldwide. Naturally, effective microorganisms required a continuous air supply to maintain growth. Conversely, phytoremediation produces and consumes CO2. Thus, the combination of these two treatment methods could reduce the requirement for additional aeration due to the associative function between them [8]. Aquatic plants are capable of purifying and beautifying water, releasing extracellular enzymes into the environment to degrade the organic contaminants [13,14]. Wei et al. [15] studied the remediation of contaminated water on a floating plant bed–effective microorganism in Nanhu Park, Tangshan city. Artificial fillers were hung under the floating plant bed, forming the combination of plants and an effective microorganism remedial system. Its remedial effectiveness was visibly better than phytoremediation alone. Rehman et al. [16] inoculated bacteria in floating treatment wetlands and positively modulated the phytoremediation effect of oil field wastewater. The increase of bacteria in the wetland enhanced wastewater remediation and showed significant persistence and activity in the water–plant system.
With the development of the aquaculture industry, a large number of aquaculture water effluents produced containing a huge amount of pollutants are produced. In this paper, taking the crab-breeding effluent as an example, the feasibility and enhanced purification effect of effective microorganisms and phytoremediation coupled technology was investigated.

2. Materials and Methods

2.1. Flume Test

2.1.1. Aquaculture Wastewater Preparation

The aquaculture wastewater was prepared using deionized water, glucose, ammonium chloride, sodium nitrate, potassium hydrogen phosphate and potassium dihydrogen phosphate to meet the relevant concentration based on the field measurement. The concentration ranges of CODMn, TN and TP are shown in Table 1. The mixed aquaculture wastewater was used in the flume test under laboratory conditions. The mixed wastewater used in the flume test also measured the pollutant concentration.

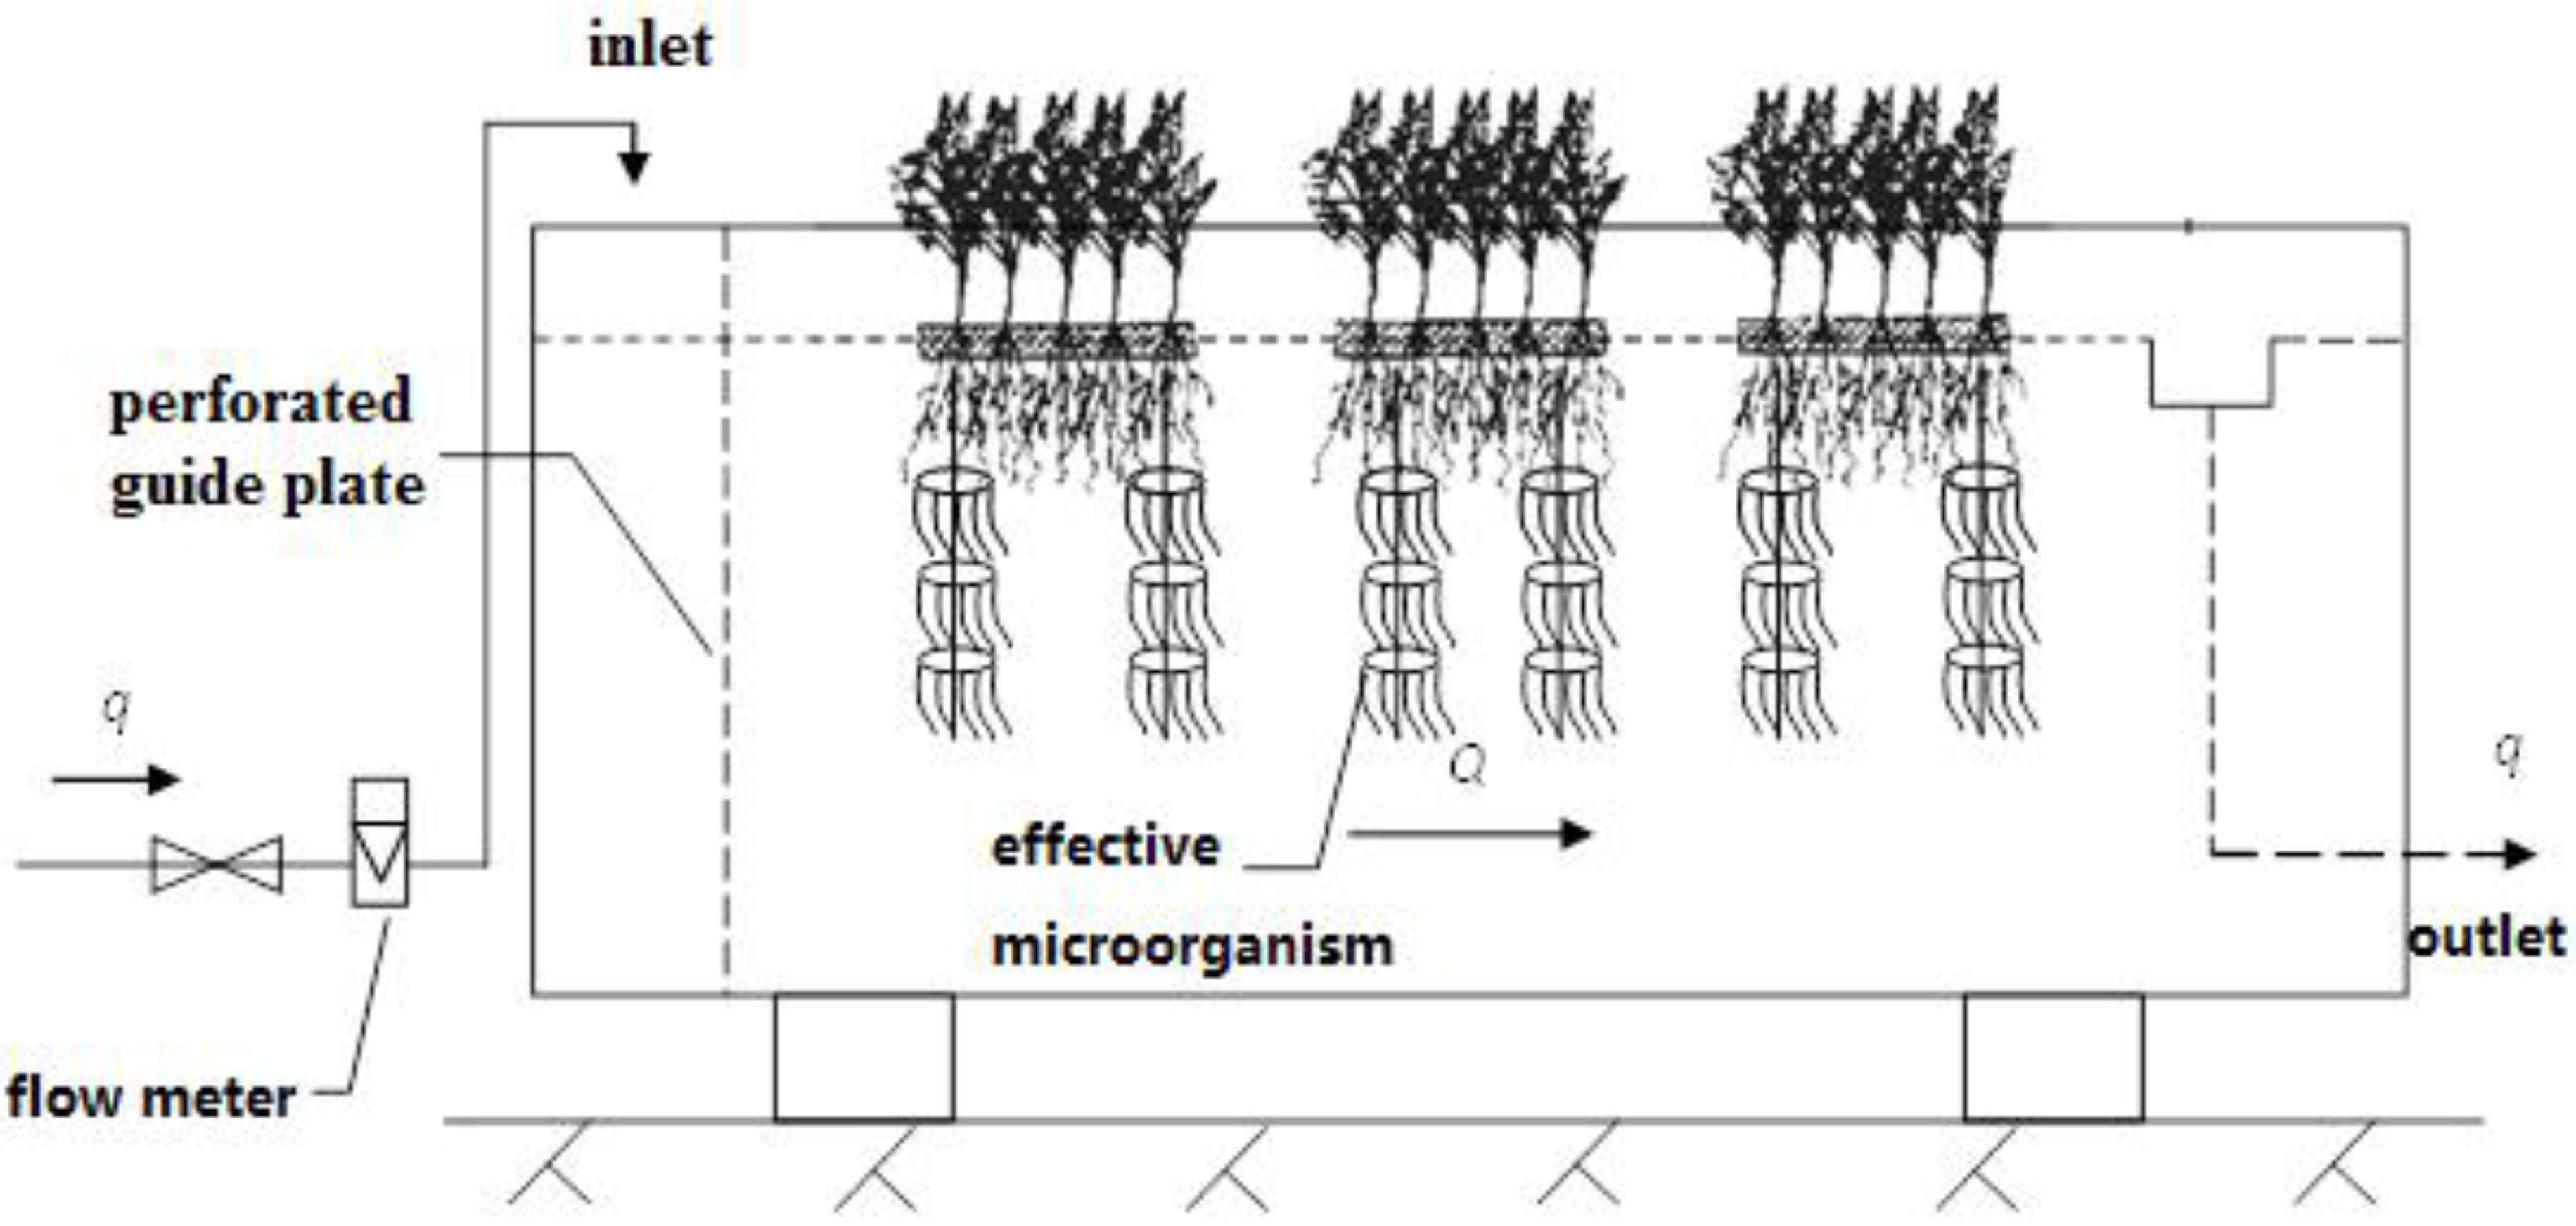
2.1.2. Flume Equipment

The simulated flume was made of PVC panels with a length of 3 m, a width of 0.5 m and a height of 1.2 m (Figure 1). The designed water depth was 1.0 m, and the effective volume was 1.5 m3. The water was discharged into the flume and controlled by a flow meter. The perforated guide plate, arranged at the inlet, had the function of uniformly distributing water. At the same time, the outlet part was equipped with an overflow weir and two adjustable outlets. Using this flume, the flow state, velocity and residence time could all be controlled by the inlet water flow.

2.1.3. Floating Bed–Effective Microorganism Treatment System

The objective was to study the coupling effect of effective microorganism together with a floating plant bed. The test was conducted as follows.
The effective microorganism amount in the flume system was maintained at 0.003 m3/m2·day. In the laboratory flume, using the Canna indica Linn floating bed, the plant coverage rate was set at 0% (control group, no plants, microorganism alone), 10%, 30%, 60% and 90%, respectively. Canna indica Linn is usually the used plant species because of its long flowering duration, ease of growth and it can be cultivated in constructed wetlands to improve water quality [17,18]. The flume system then ran for 7 consecutive ds under a hydraulic loading of 1.0 m3/m2·day. Our reasoning for choosing this value is explained in Section 3.2. The water was sampled daily to measure the concentration of TN, TP, CODMn and DO, respectively. Here, TN was determined by alkaline potassium persulfate digestion ultraviolet spectrophotometry (GB11894-89), CODMn was determined by the acidic potassium permanganate method (GB11892-89) and TP was determined by ammonium molybdate spectrophotometry (GB11893-89). DO was measured using a portable dissolved oxygen meter (DO200A, USA).

2.1.4. Treatment under Various Hydraulic Loadings

This experiment was designed to explore the effect of the crab aquaculture wastewater treatment under various effluent hydraulic loading conditions in the floating plant bed–effective microorganism system. According to the results of the floating plant bed coverage effect, a coverage rate of 30% was adopted. The effluent hydraulic loadings were 0.25 m3/m2·day, 0.5 m3/m2·day, 1.0 m3/m2·day, 1.5 m3/m2·day and 2.0 m3/m2·day. Similarly, each set ran for 7 consecutive ds. The disposal samples were collected and measured once a day, including the concentrations of TN, TP and CODMn, respectively. The target pollutant concentrations for TN, TP and CODMn were detected as described in Section 2.1.2.

2.1.5. Calculation of the Pollutant Removal Efficiency and Removal Load
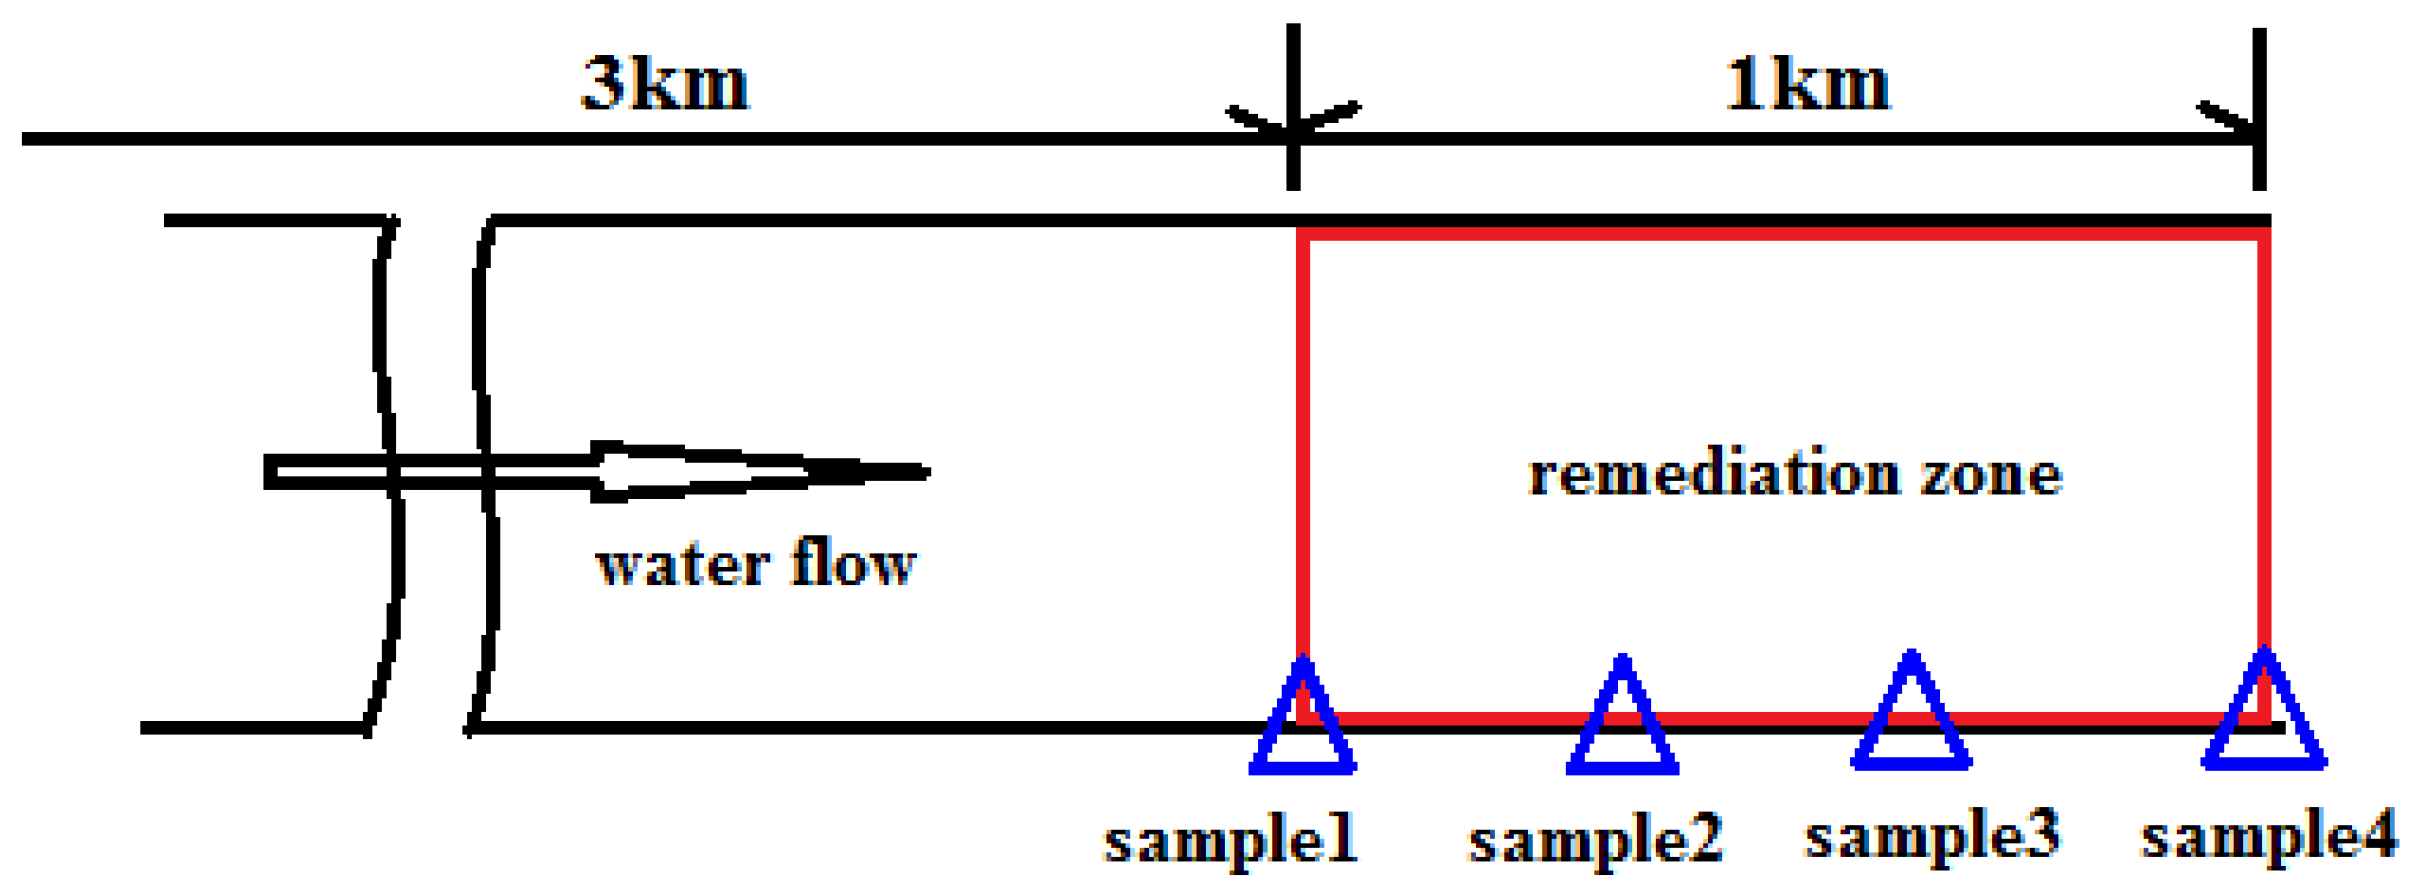
Pollutant removal efficiency (η) refers to the change in water concentration, and removal load (L) reflects the total loss of pollutants. Removal efficiency (η) and removal load (L) can be calculated using Equations (1) and (2) as follows:
η = C i C e C i × 100 %
L = Q C i C e A
where η is the pollutant removal efficiency, L is the pollutant removal load (mg/m2·s), A is the cross-sectional area (m2), Q is the inlet flow (m3/s), Ci is the pollutant concentration for inlet water (mg/L) and Ce is the pollutant concentration for the outlet water (mg/L).

2.2. Field Test

The selected crab aquaculture wastewater used to conduct the field test flowed into Gucheng Lake, Nanjing, China. The concentration ranges of CODMn, TN and TP are 7.5–10.5 mg/L, 6.0–7.5 mg/L and 0.4–0.6 mg/L, respectively. These field measurement values directed the laboratory-scale testing process. According to the results of the flume simulation test in the laboratory, the in situ river floating plant bed–effective microorganism remediation project was built by selecting the plant coverage rate (30%) and hydraulic loading condition (1.0 m3/m2·day).
The remediation river has a length of 4 km and receives wastewater from the surrounding crab aquaculture (Figure 2). At the end of the river, a floating plant bed 1 km in length and an effective microorganism system were established to purify the crab aquaculture wastewater. TN, TP and COD concentrations were measured along the remediated river.

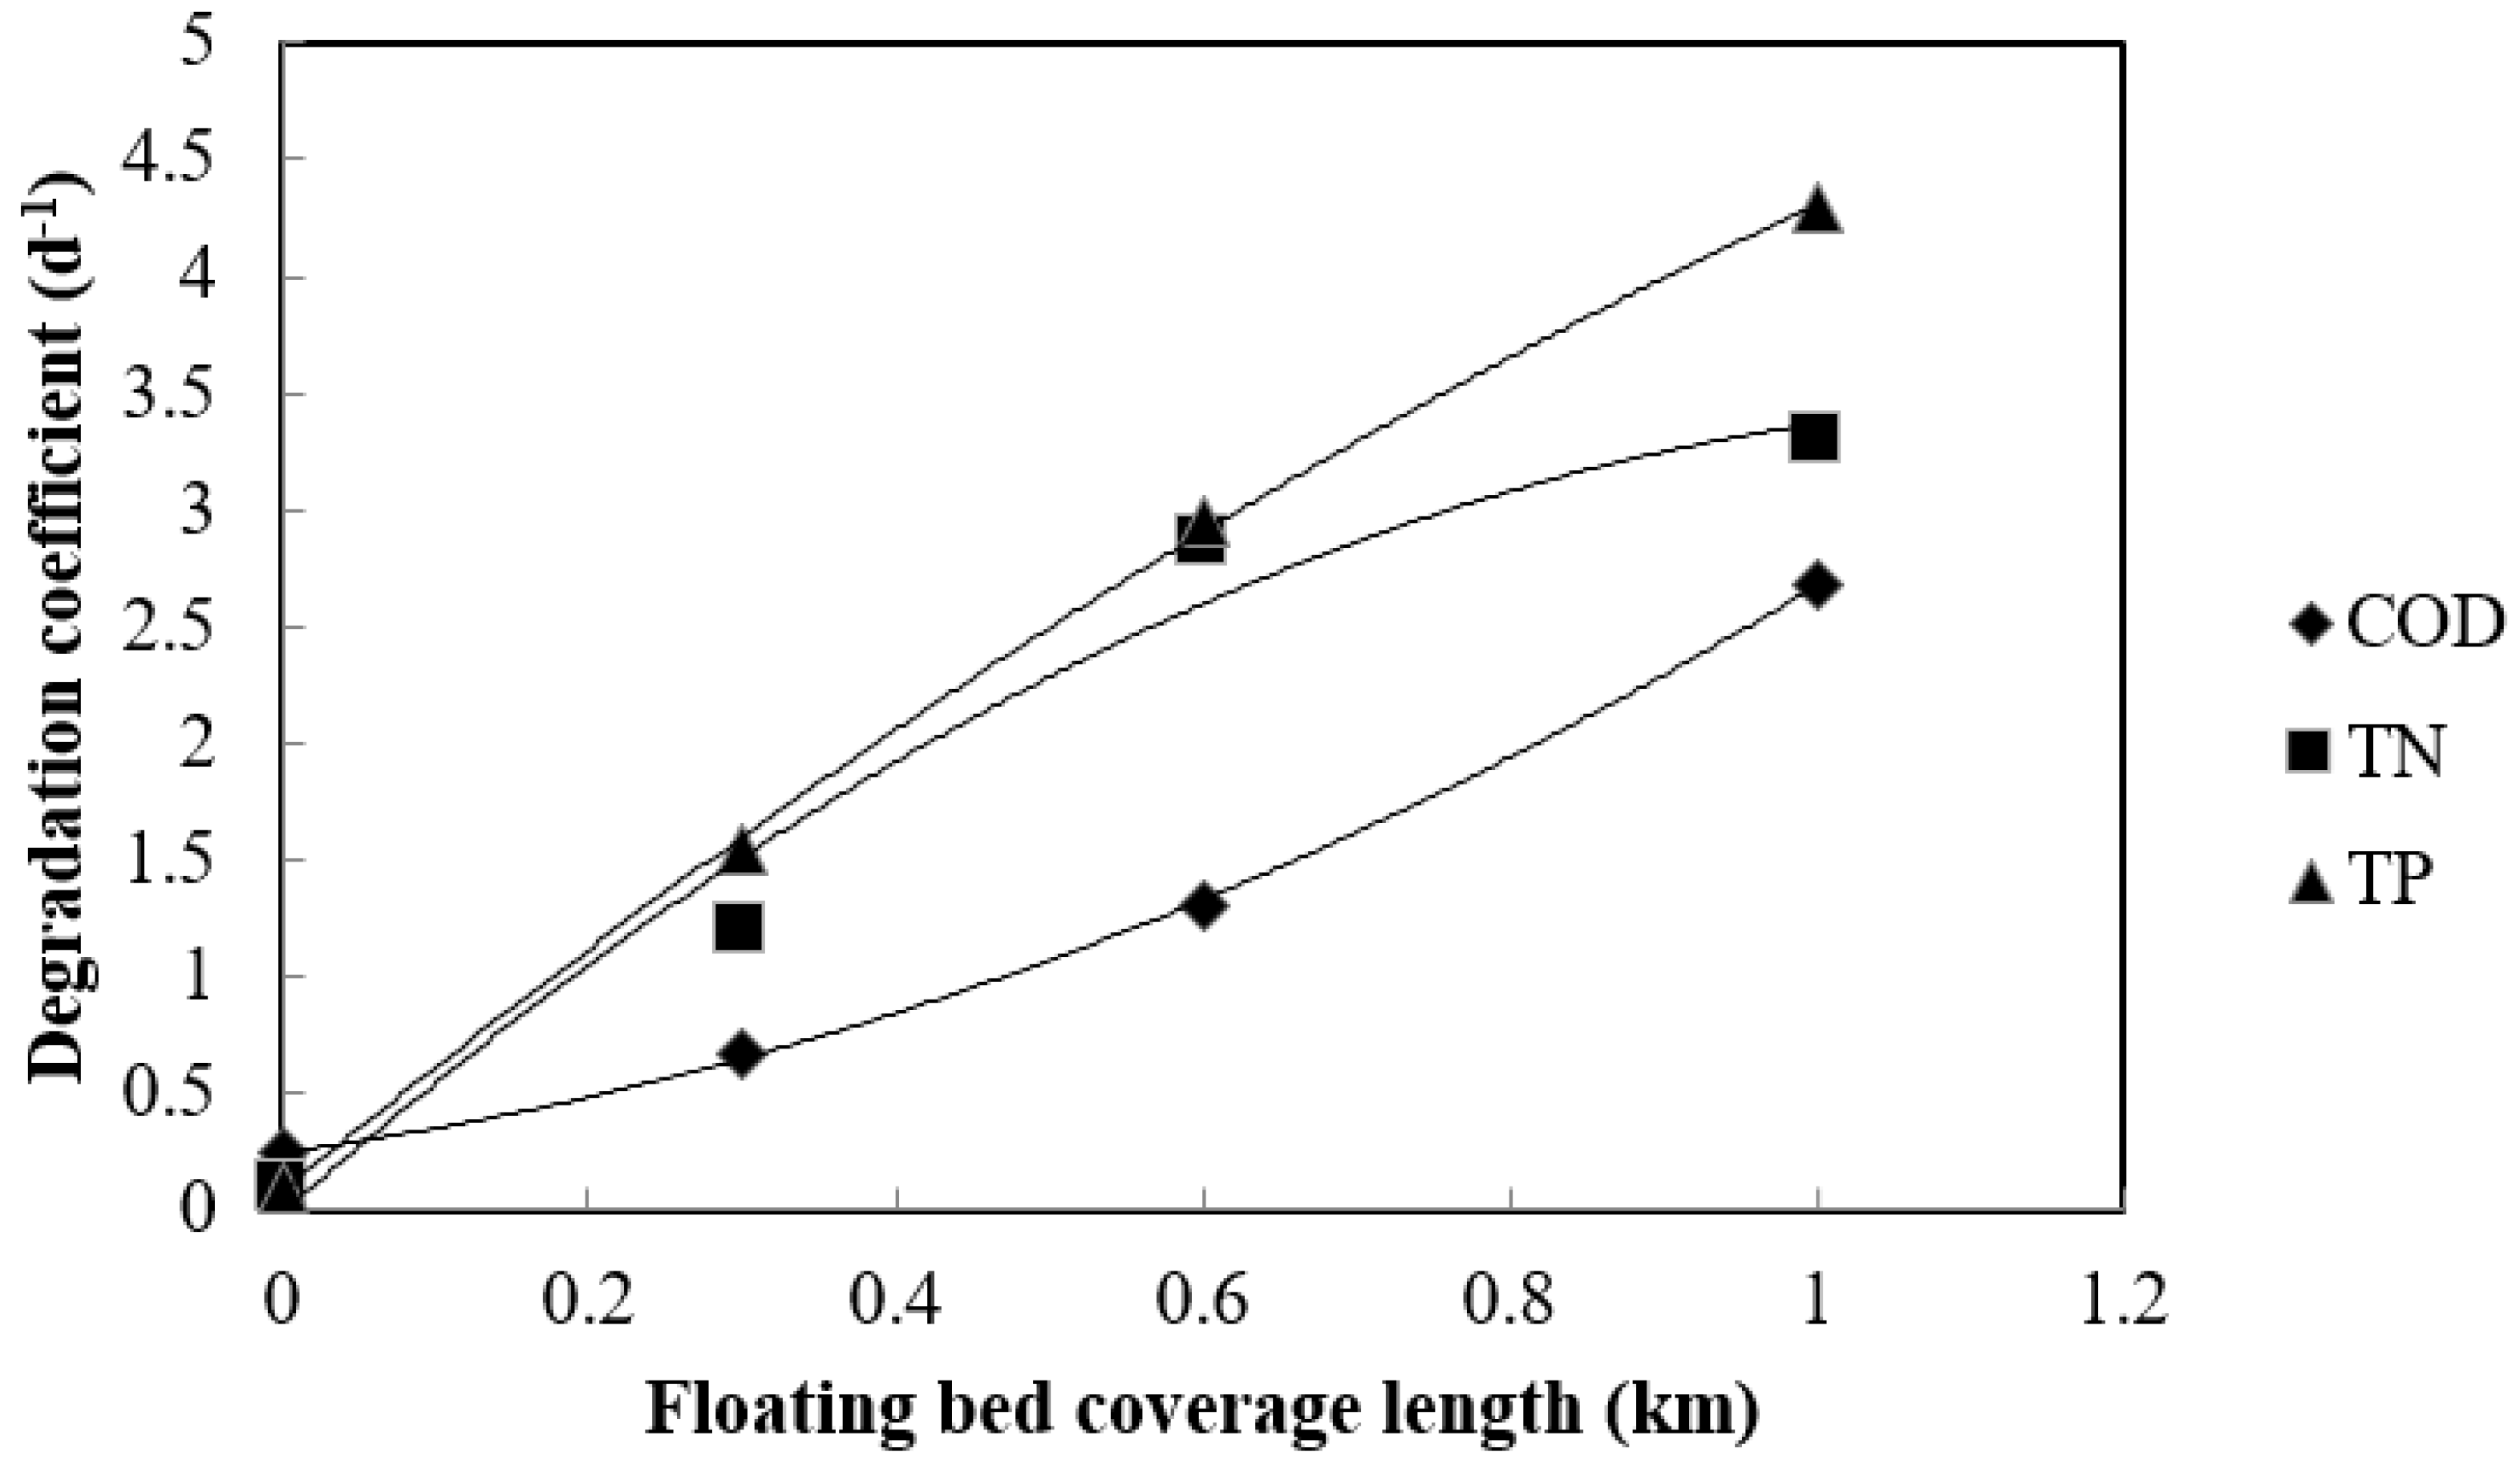
2.3. Calculation of the Pollutant Comprehensive Degradation Coefficient

The degradation coefficient calculated by the one-dimensional water quality model is shown in Equation (3):
C = C 0 × exp ( kx 86400 u )
where C is the concentration in the sample site (mg/L), Co is the initial concentration (mg/L), k is the comprehensive degradation coefficient (d−1) and u is the flow velocity (m/s).
In order to predict the quality of effluent water after the remediation system and determine the minimum floating bed coverage length according to the corresponding water quality standard, the relationship between the pollutant comprehensive degradation coefficient and the floating bed coverage length was fitted by the regression equation.

3. Results and Discussion

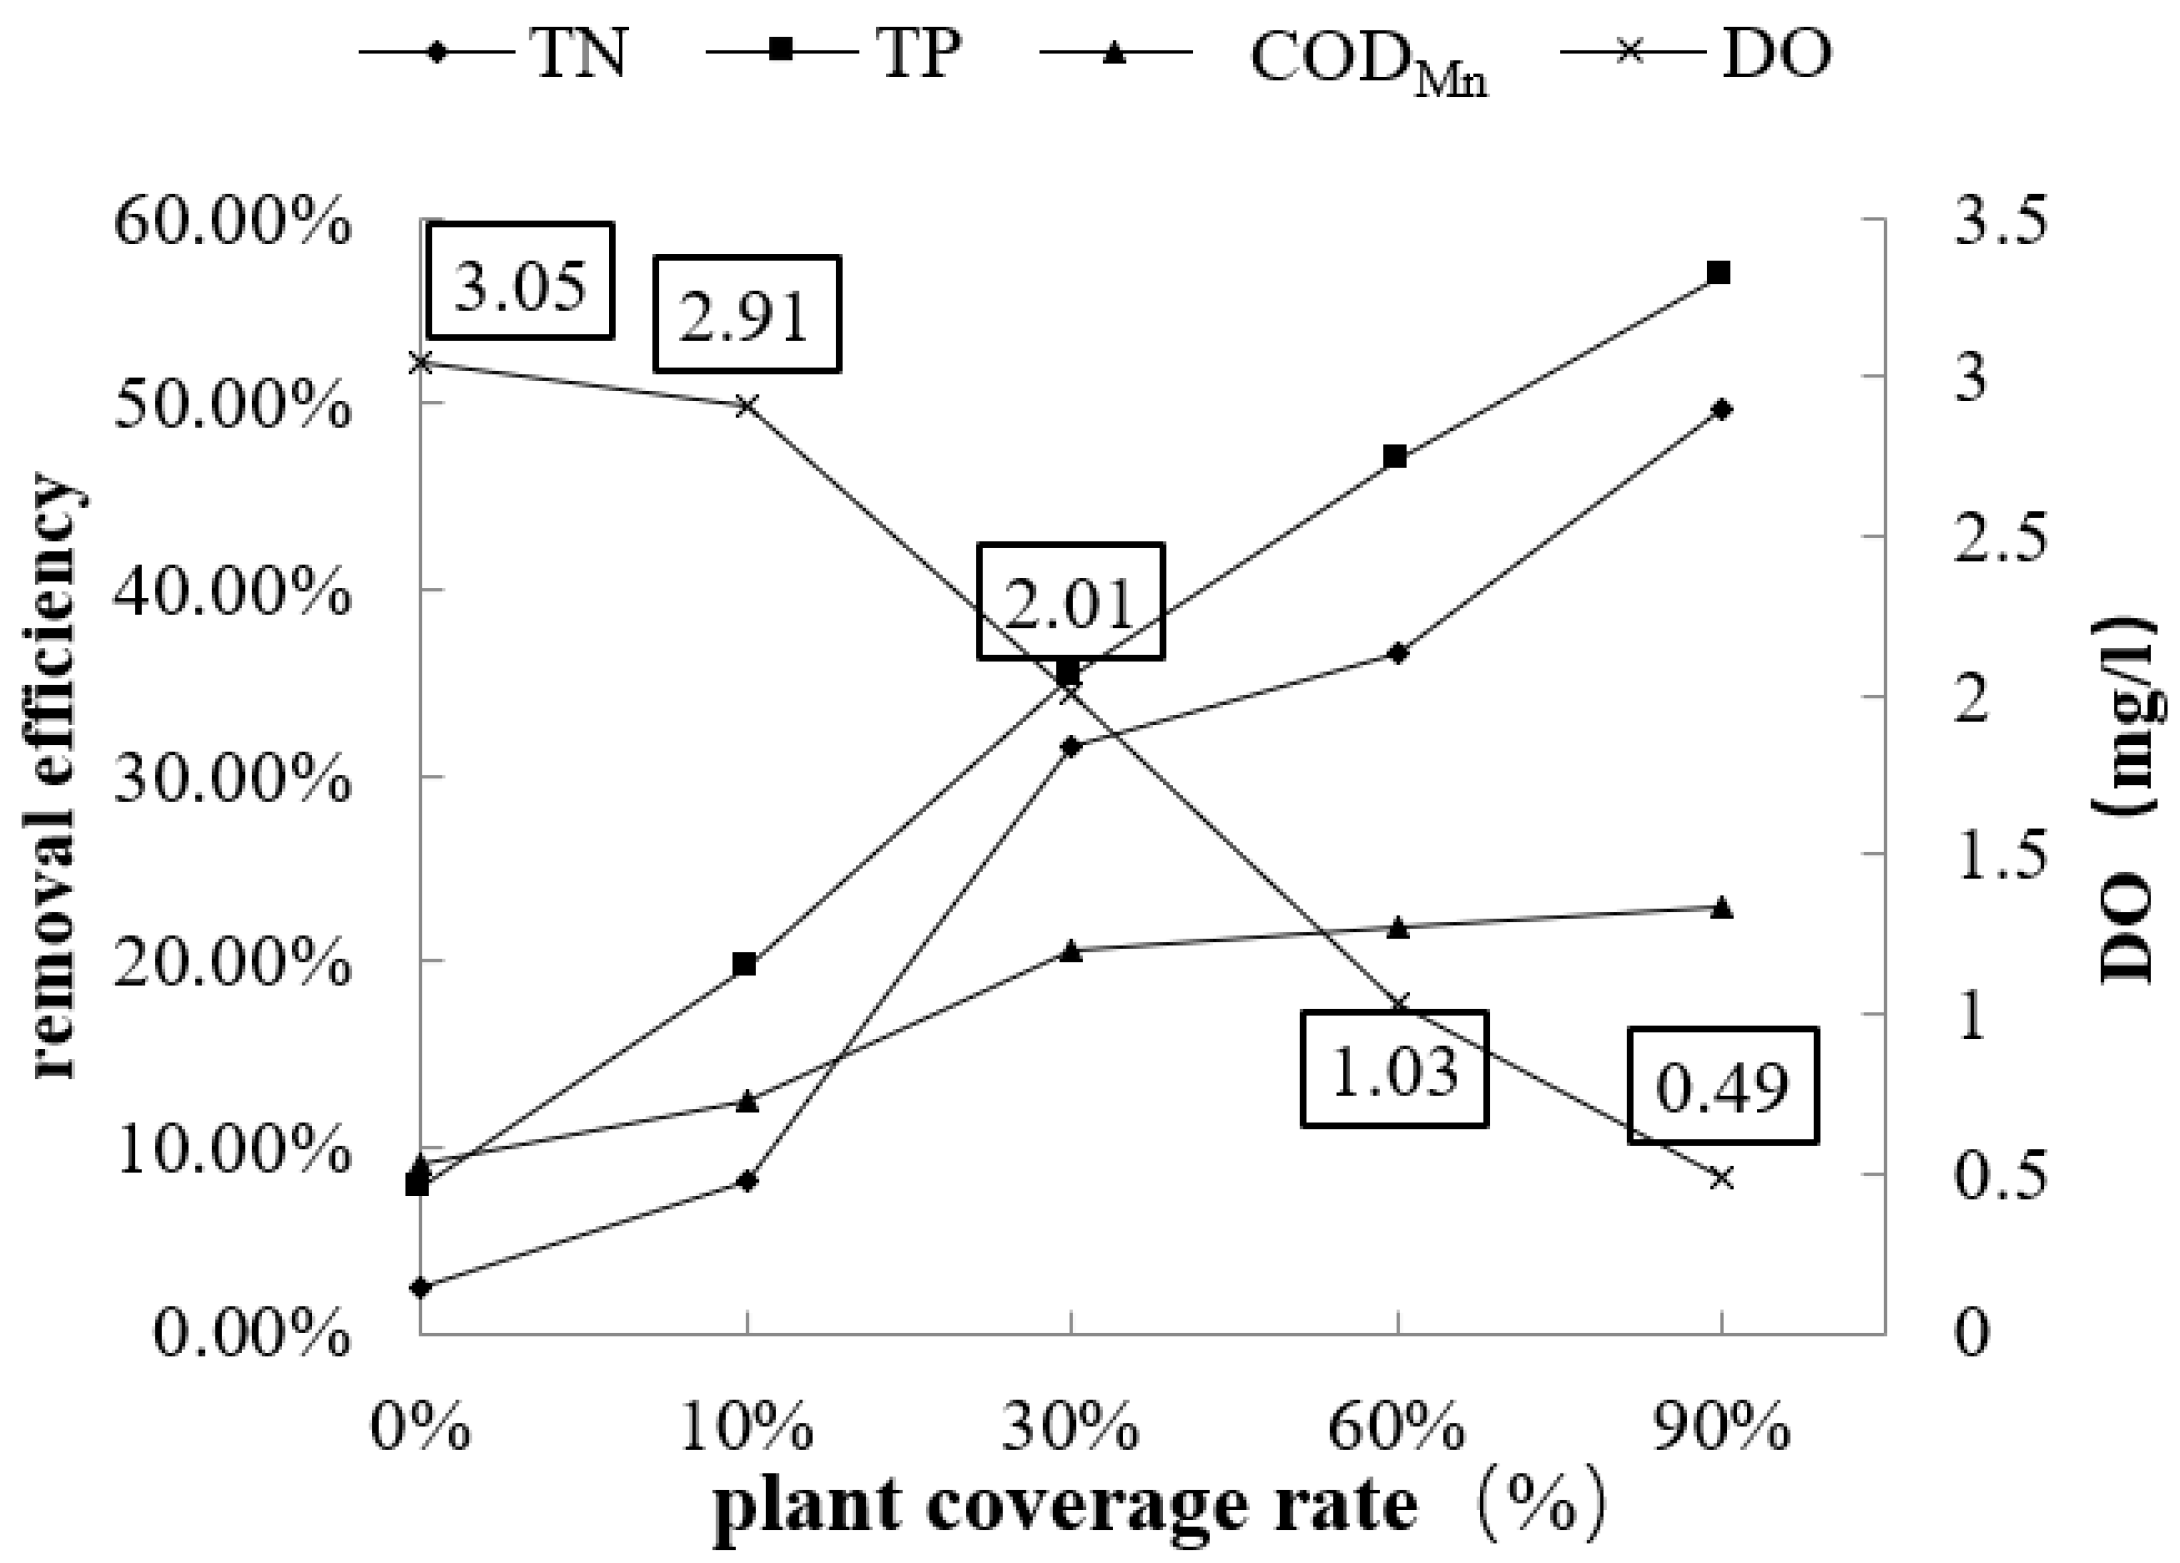
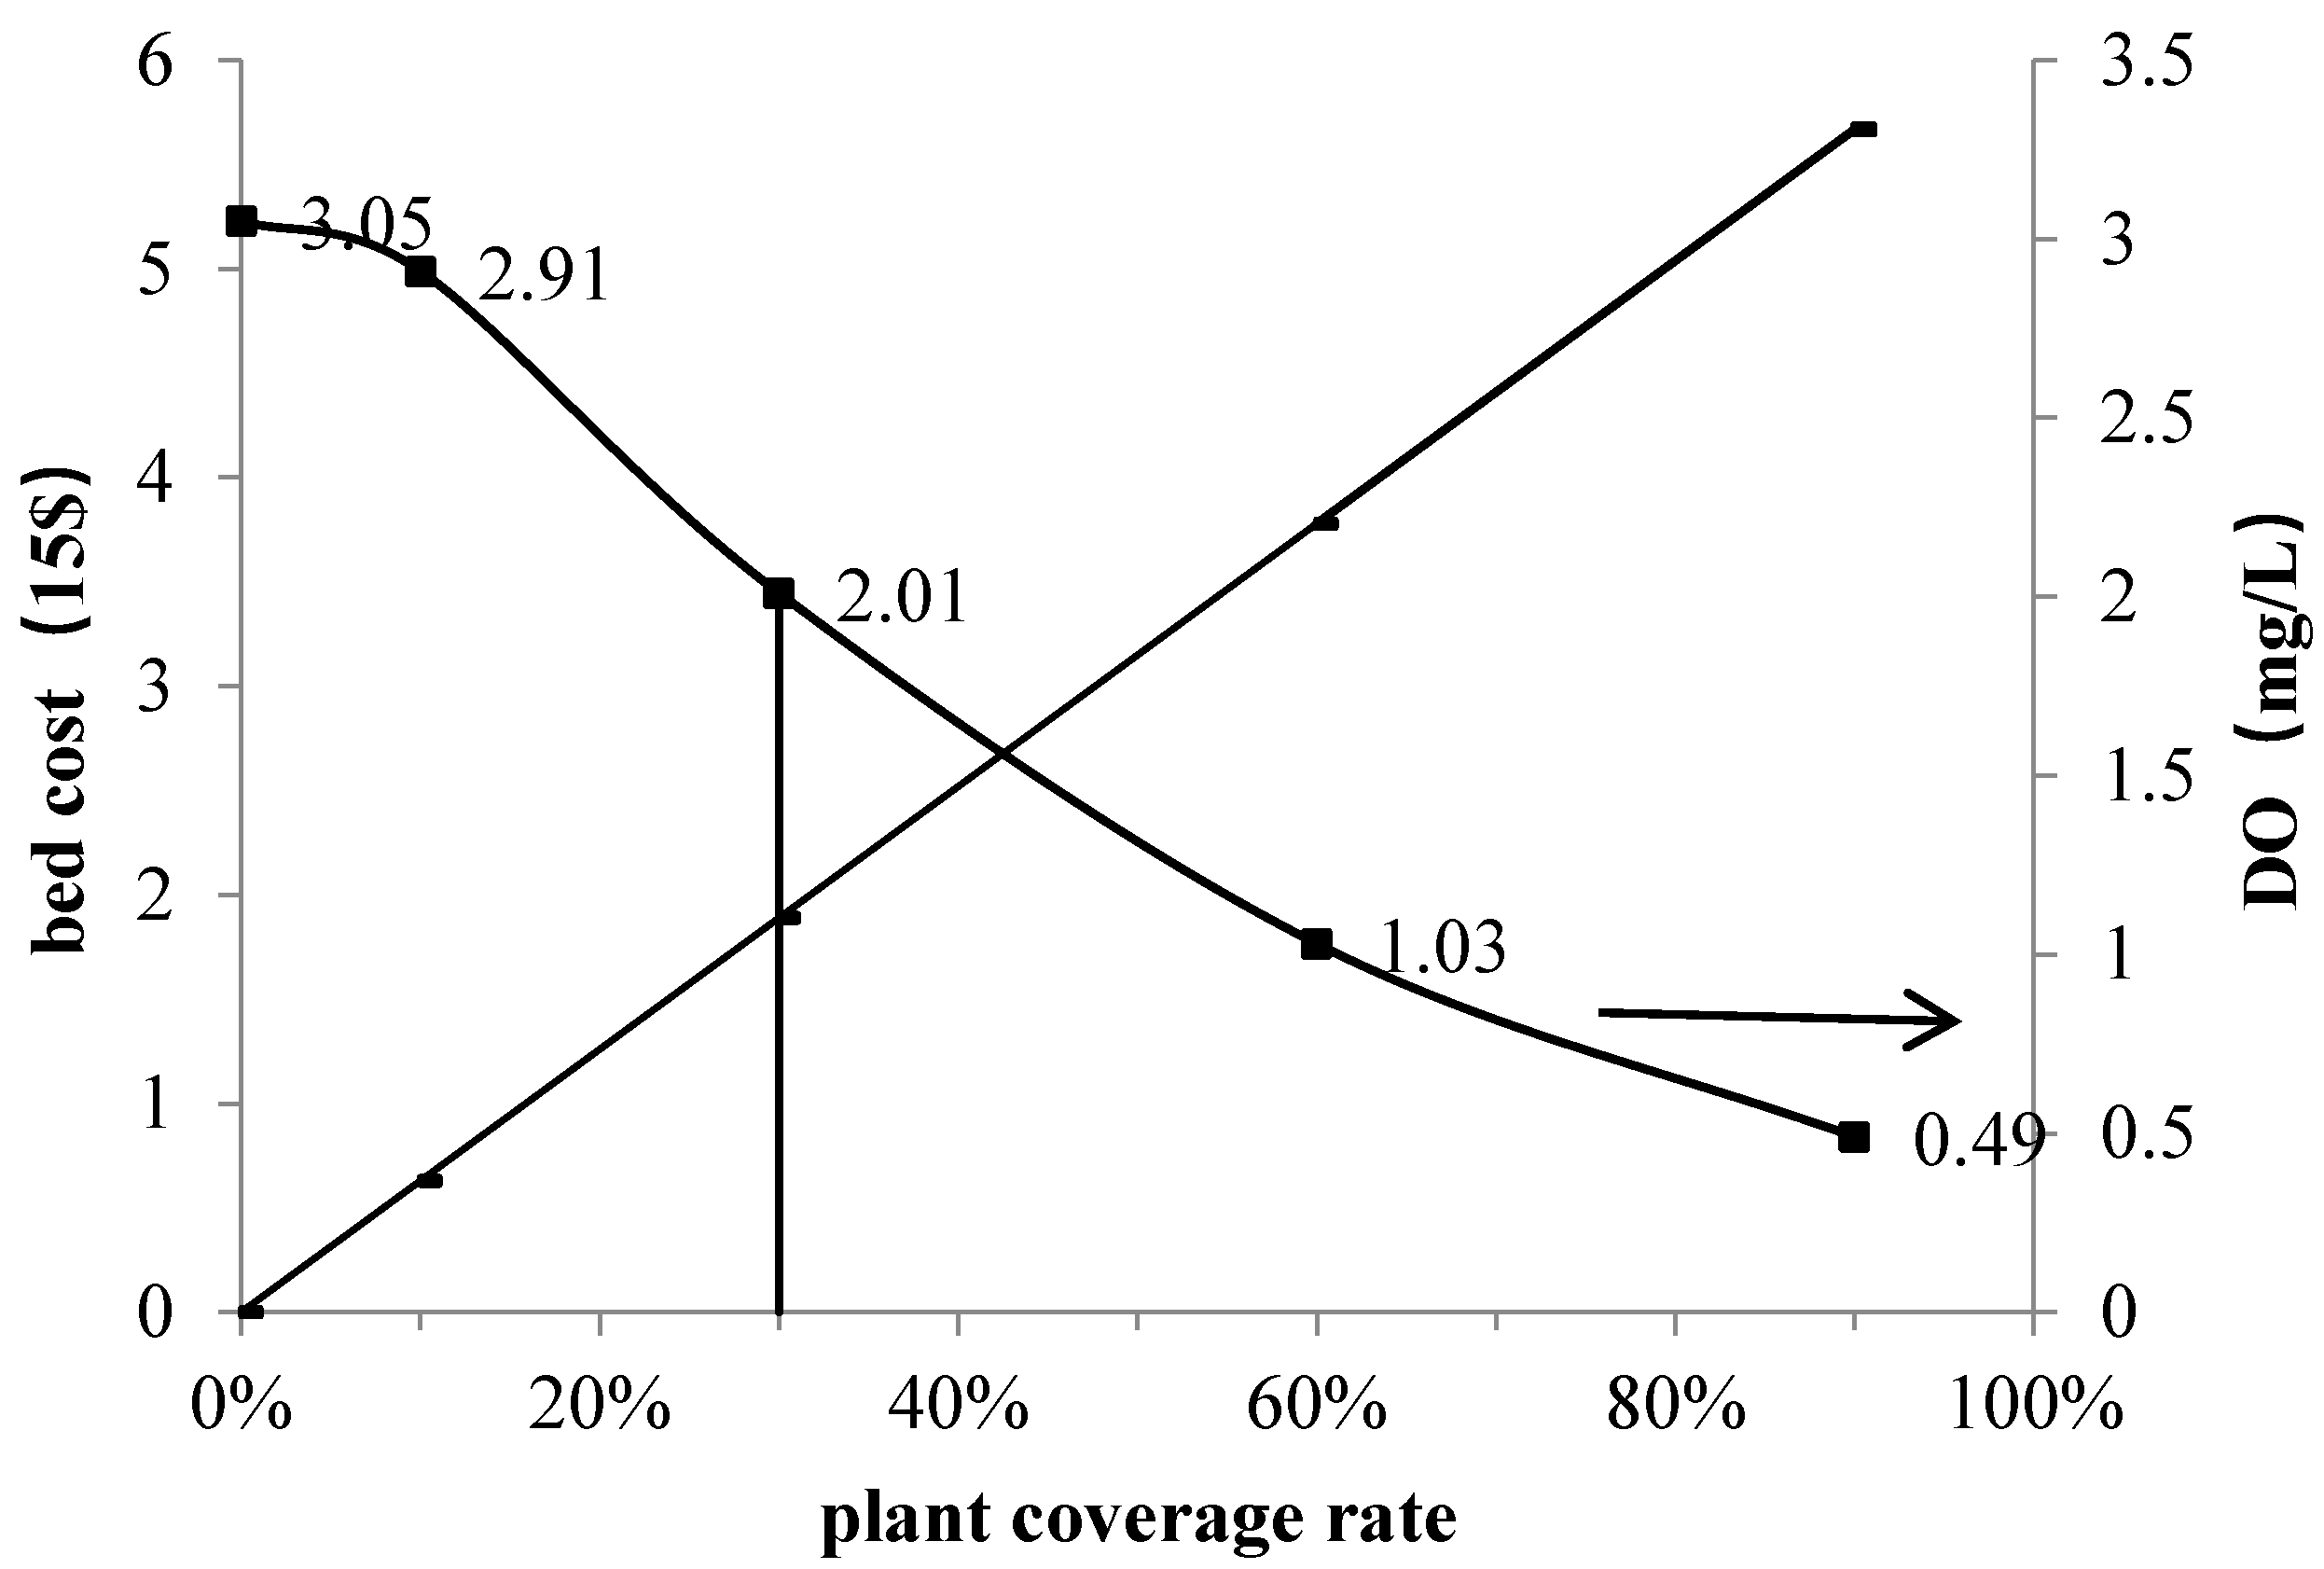
3.1. Effect of the Plant Coverage Rate on Purification Performance

As shown in Table 2 and Figure 3, the removal efficiency of TN, TP and CODMn increases with the increase of the coverage rate. Once the coverage rate exceeds 30%, the removal efficiency of CODMn continues to increase, though it is not clear. In general, the increase in the removal efficiency of TN, TP and CODMn is due to the increase in organic matter degradation and nutrient absorption capacity as well as adsorption, caused by the increase of Canna biomass.
Dissolved oxygen (DO) is an important index that represents the pollution status of water. The change in DO reflects the self-purification process of the river. DO in the water generally comes from atmospheric oxygen and photosynthesis of aquatic plants. Atmospheric oxygen is the main source of water-dissolved oxygen. When there is dissolved oxygen in the water, organic matter is decomposed by aerobic bacteria, thereby reducing the content of dissolved oxygen in the water. At this moment, the DO concentration is lower than the saturation value, and it can be supplemented with atmospheric oxygen. However, if the DO consumption of the decomposition of organic matter is higher than the reoxygenation of the surrounding environment, it will damage the balance of the water ecosystem [19].
In this test, the DO concentration of the control group and the 10% coverage group increased from the initial 1.98 mg/L to 3.05 mg/L and 2.91 mg/L. At 30% coverage, DO is 2.01 mg/L, almost the same as the original. As the coverage rate increases to 60% and 90%, the DO drops to 1.03 mg/L and 0.49 mg/L, respectively. The increase in the floating bed coverage can seriously affect the reoxygenation of water bodies in the atmosphere. At the same time, the sheltering effect of the floating bed carrier will limit the photosynthesis of the plants or algae in the water. As a result, it will affect water-dissolved oxygen levels.
As shown in Figure 3, low plant coverage limits the effectiveness of wastewater purification treatment. The pollutant removal efficiency improved with the increase in the coverage rate, albeit with a higher coverage rate, more costs and less reoxygenation efficiency (Figure 4). The removal efficiency of CODMn improved by 2.3%, and the coverage rate ranged from 30% to 90%. On the contrary, the removal efficiency of TN and TP improved by 21.5% and 26.7%, respectively. The reason for this may be that a lower DO reoxygenation capacity under high coverage reduces the degradation efficiency of organic matter in the floating bed–effective microorganism system. A coverage rate of 60% or 90% also damages the original water landscape and may increase the flood risk. Therefore, in order to purify the polluted river water, it is recommended to control the coverage of the floating bed to approximately 30%.

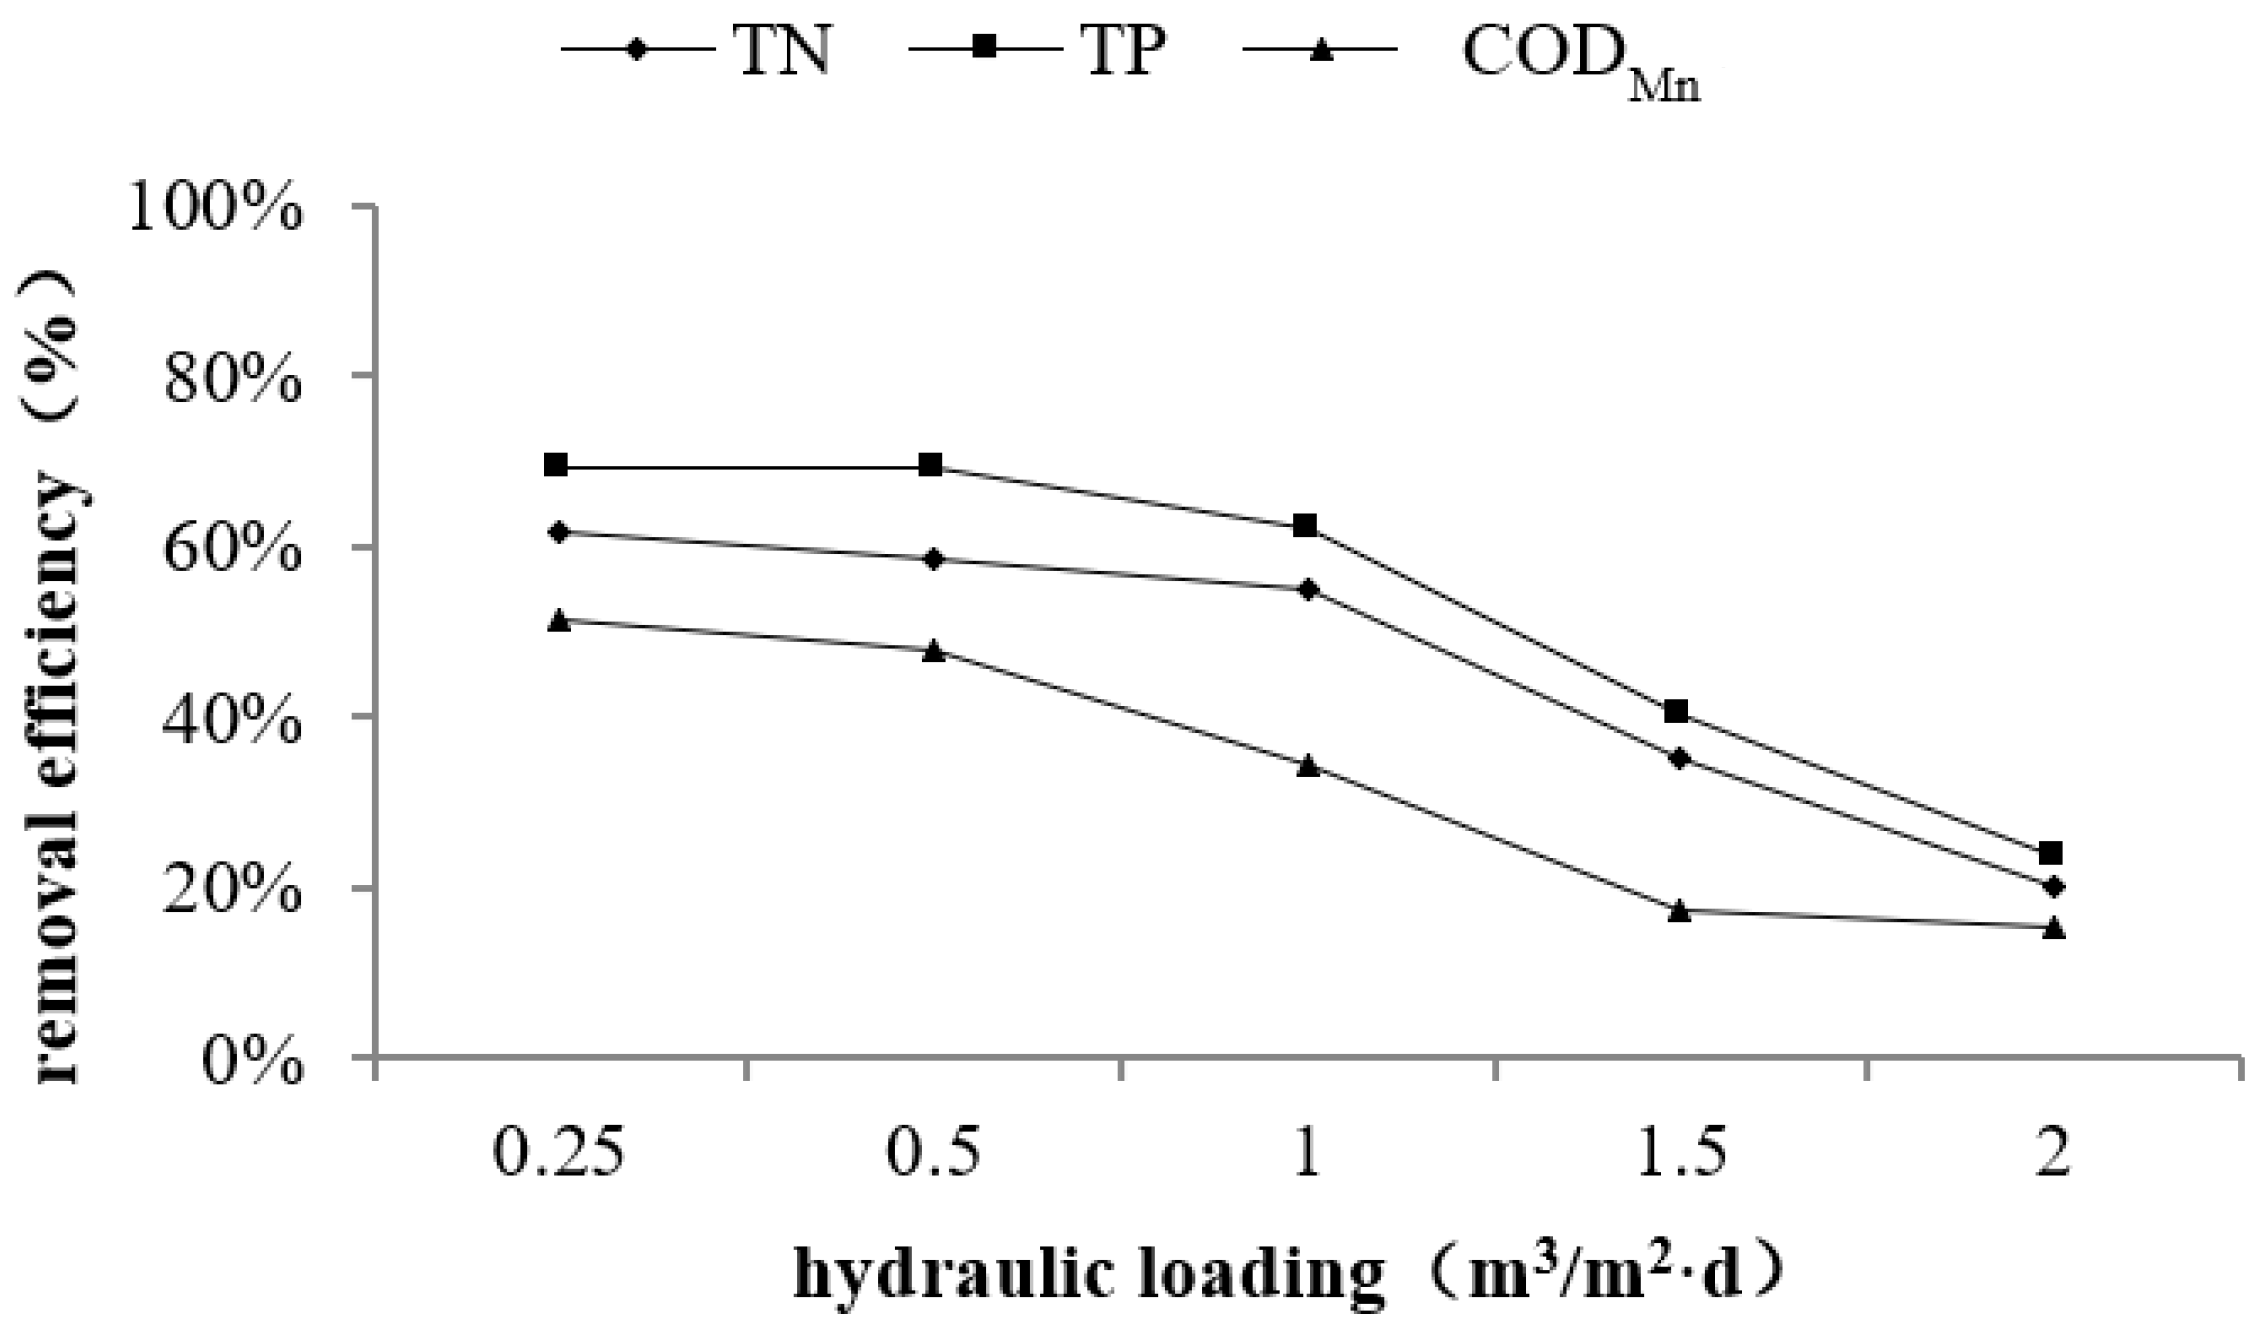
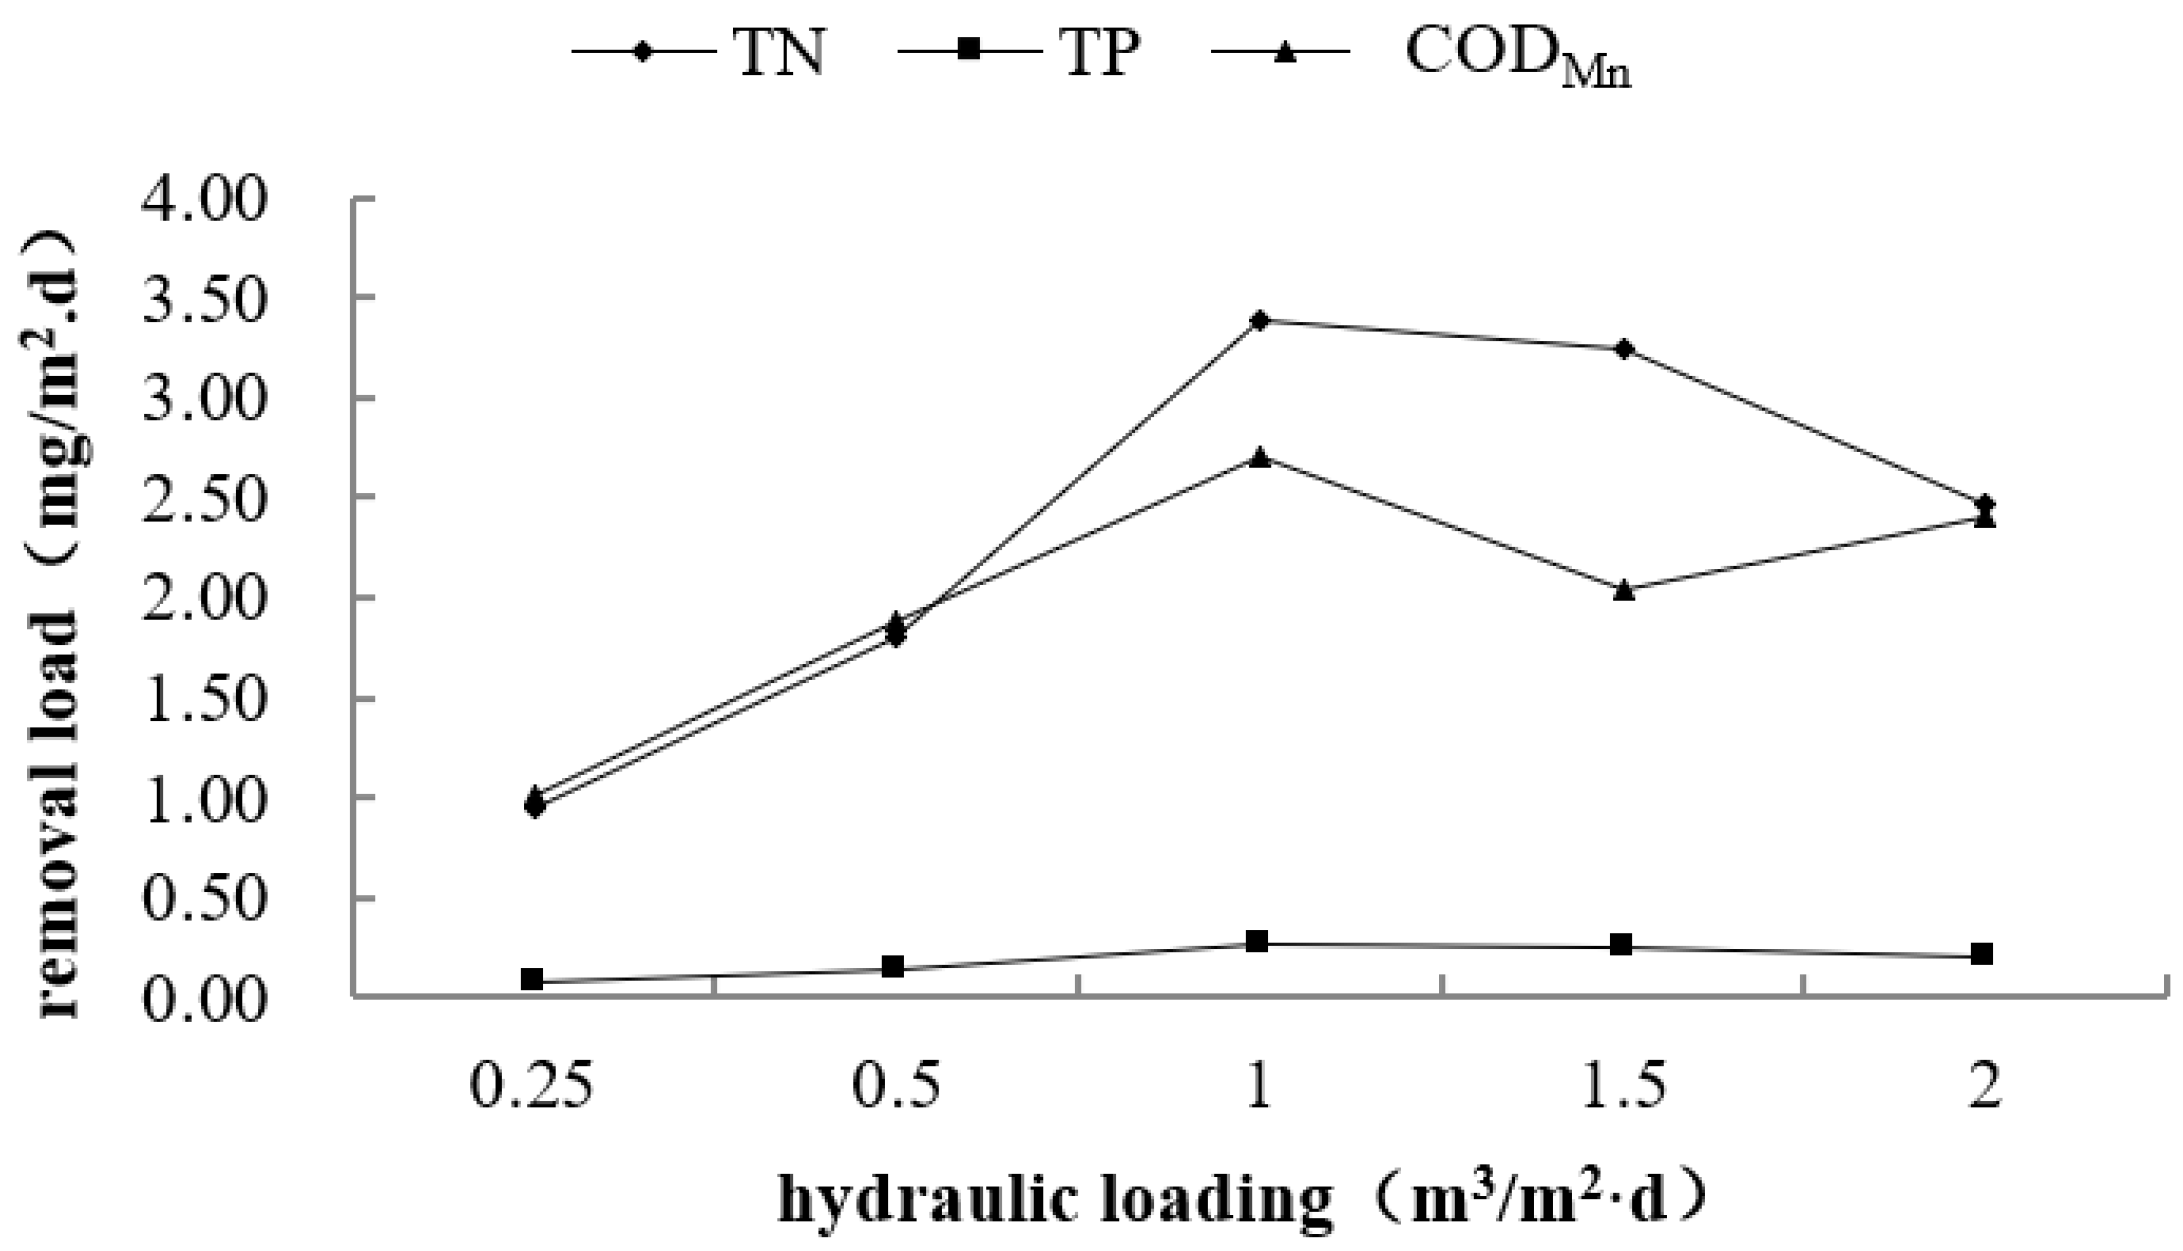
3.2. Effect of Hydraulic Loading on Purification Performance

Figure 5 and Table 3 show the target pollutant removal ability of the floating bed–effective microorganism technology (TP > TN > CODMn). As demonstrated in previous studies, due to the high consumption of phosphate and ammonia, aquaculture wastewater has the potential for development in the generation of microalgal biomass and can be used as a suitable nutrient substrate [20]. With the increase of effluent hydraulic loading, the removal efficiency of each pollutant displays a downward trend. Under a hydraulic loading of less than 1.0 m3/m2·day, the removal efficiency of TN and TP slowly decreased. On the contrary, once the hydraulic loading exceeded 1.0 m3/m2·day, the pollutant removal efficiency decreased sharply. This is mainly ascribed to the shorter hydraulic retention time as the hydraulic loading increased.
As mentioned above, the removal efficiency reflects the change in the pollutant concentration in the water, and the removal load reflects the mass removal efficiency of the pollutants (as indicated in Equation (2)). In Figure 6, the relationship between the removal load and hydraulic loading is shown. Compared with the removal efficiency, the removal load of the pollutants immediately shows the mass change of the pollutants under the disposal system. For the removal load, TN, TP and CODMn all shared the same change trend shown in Figure 6, with an increase in the early stage followed by a decrease. Under the hydraulic loading of 1.0 m3/m2·day, the target pollutant removal load reached the peaks of 3.38 m3/m2·day, 0.26 m3/m2·day and 2.69 m3/m2·day for TN, TP and CODMn, respectively.
For the TN, TP and CODMn removal loads, when the hydraulic loading was less than 1.0 m3/m2·day, the river hydraulic retention time was high due to the small water flow velocity. It had sufficient contact time for floating bed–effective microorganism systems and pollutants. A longer contact time takes advantage of the root system of the aquatic plant to absorb and adsorb the target pollutants [21]. Unfavorably, due to nutrient deficiencies, the relatively low nitrogen and phosphorus load limits microbial activity. On the other hand, once the hydraulic loading exceeds 1.0 m3/m2·day, pollutants pass through the purification system quickly, leading to insufficient contact time. In this case, a large number of pollutants cannot fully react with the floating bed–effective microorganism system. Degrading too quickly will significantly reduce the removal load.

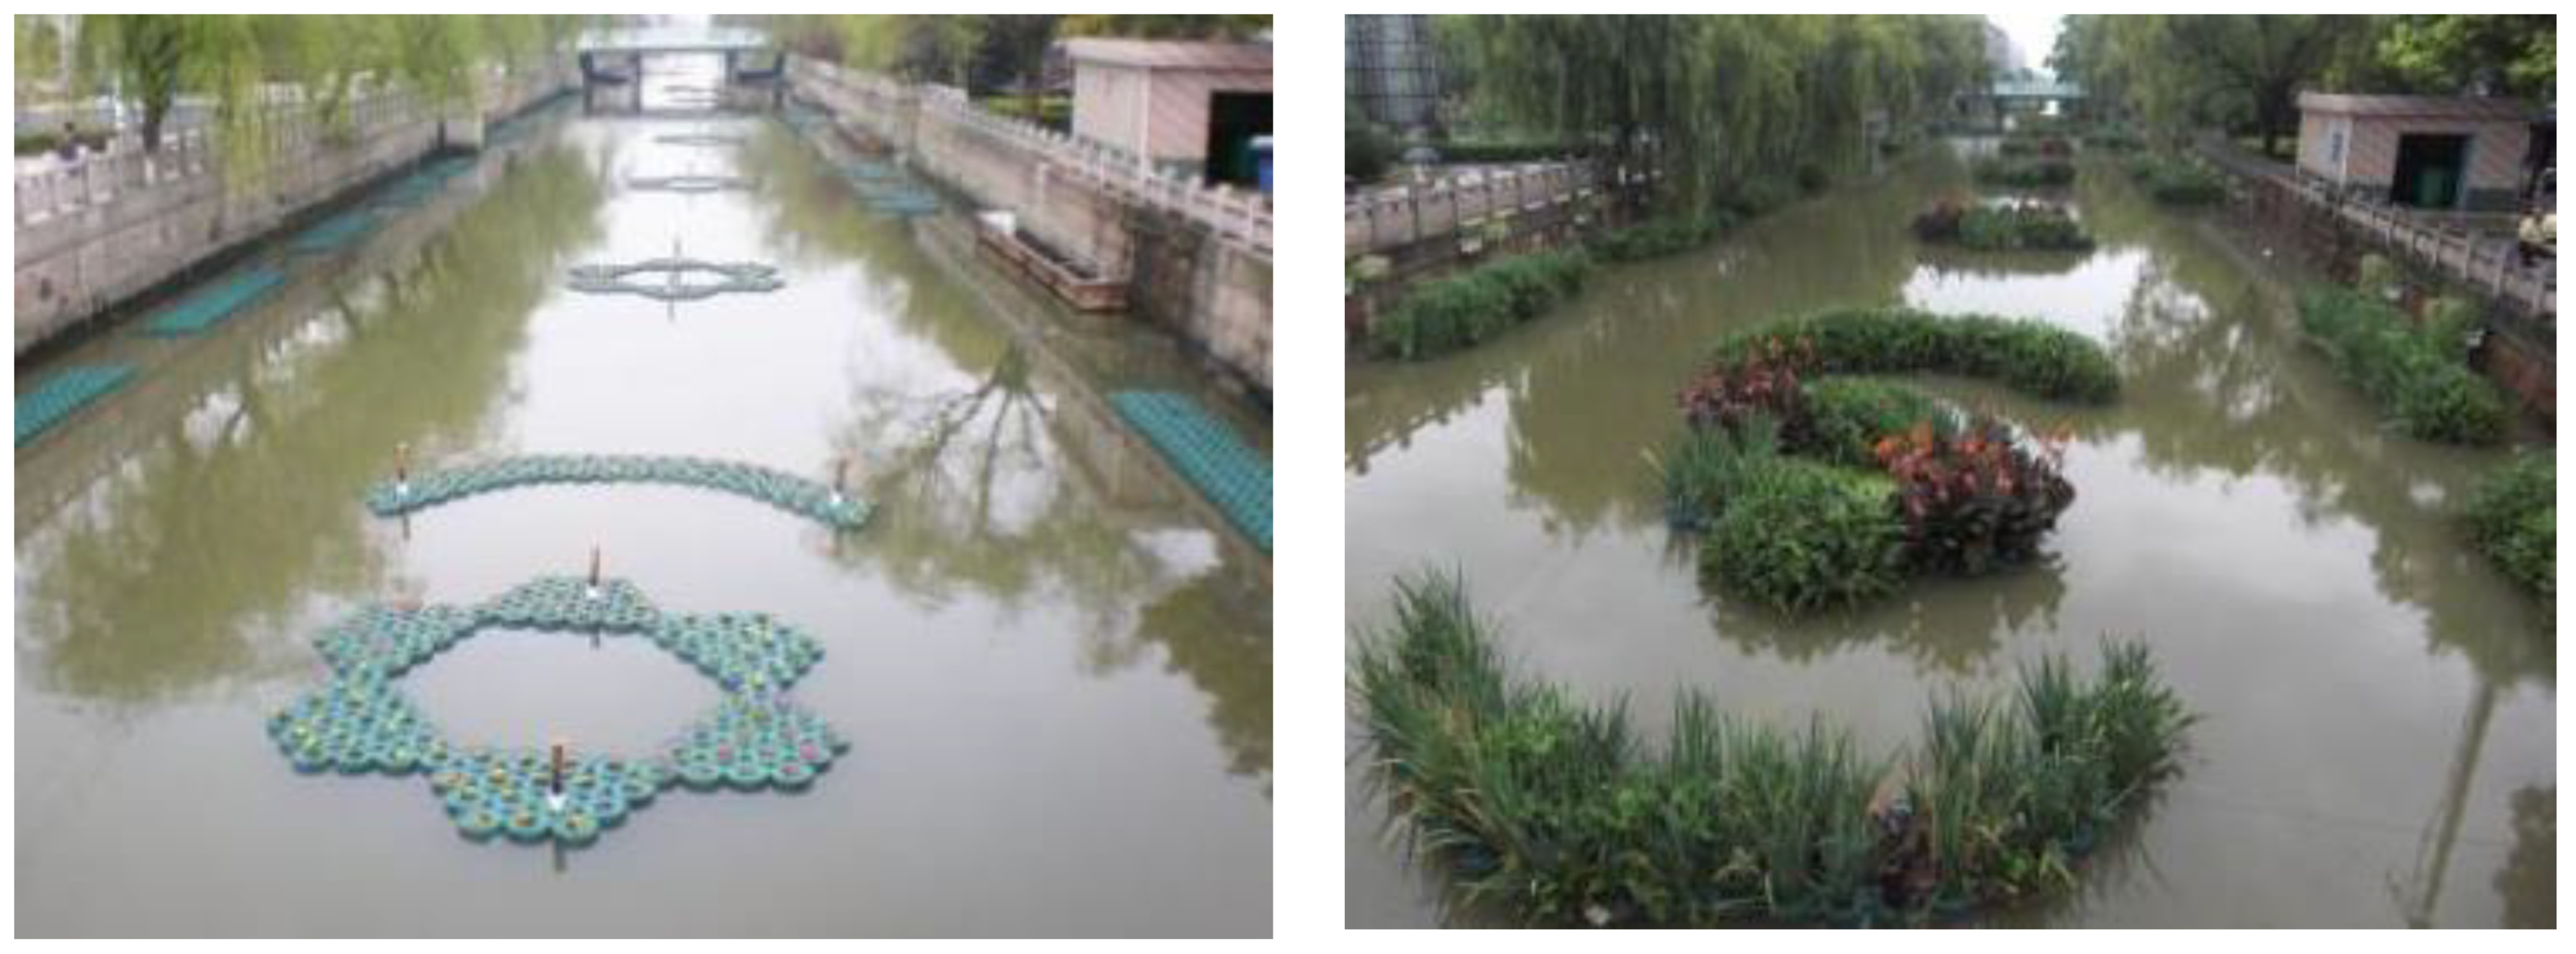
3.3. Floating Bed–Effective Microorganism Field Application

For field application (see Figure 7), the floating plant bed–effective microorganism treatment structure was placed in the carb aquaculture wastewater of the receiving river at a floating bed coverage rate of 30% (Figure 3). As shown in Table 4, the target pollutant concentration changes with the water flow path were measured.
The pollutant comprehensive degradation coefficient positively correlated with the length of the floating bed coverage (Figure 8). According to the regression equation in Table 5, it is possible to predict the quality of effluent water through the remediation system under 30% plant coverage. By using this regression, we can calculate the minimum floating bed coverage length that meets the water quality standard.
As the coverage length of the floating plant bed increases, the pollutant comprehensive degradation coefficient increased significantly. In this case, high pollutant degradation efficiency means that the corresponding construction costs are greatly increased. Therefore, it is necessary to determine the length of the repair system in practical use according to economic efficiency and environmental improvement efficiency. Once the water quality concentration exceeds the limit value during the operation period based on the regular water quality monitoring, the floating plant bed–effective microorganism system length can be extended to reduce the risk, using the regression equation provided above as a guide.

4. Conclusions

For crab aquaculture wastewater remediation, the treatment efficiency of floating plant bed–effective microorganism technology demonstrated better performance than microbial treatment alone. Therefore, the joint processing treatment technology can strengthen the treatment of aquaculture wastewater.
With the increase of the plant coverage rate in the flume, the removal efficiency of TN, TP and CODMn in the water increased significantly. Once the plant coverage exceeds 30%, the increase of the CODMn removal efficiency is not clear. At the same time, the high plant coverage inhibits the oxygen capacity in the water, which directly led to a decline of the plant’s organic matter degradation ability. Therefore, considering the effects of the water landscape, the cost of floating beds and the flood control requirements of rivers, the coverage of ecological floating plant beds should be controlled at 30%. Since the hydraulic retention time reduced with the increase of the hydraulic loading, the removal efficiency of the target pollutants revealed a general downward trend. However, under lower hydraulic loading, the removal load of pollutants in water increased with the increase of the hydraulic load. Under higher hydraulic loading, the removal load of pollutants decreased with the increase of the hydraulic load. In summary, at the hydraulic loading of 1.0 m3/m2·day, the pollutant removal load reached the maximum, thereby achieving the maximum possible pollutant elimination. For in situ applications, an artificial restoration system with a length of 1 km can stably meet the aquaculture water discharge standards at the end of the river.

Author Contributions

Conceptualization, L.C. and H.L.; methodology, L.C. and X.S.; investigation, J.T. and X.S.; data curation, J.T.; writing—original draft preparation, L.C.; writing—review and editing, H.L.; project administration, H.L.; funding acquisition, L.C. All authors have read and agreed to the published version of the manuscript.

Funding

This research was funded by “The Fundamental Research Funds for the Central Universities (No. B19020074)”, “The Fundamental Research Funds for the Central Universities (No. B200204033)” and “The Priority Academic Program Development of Jiangsu Higher Education Institutions”. Also, we appreciate “the Taihu Lake water pollution control special funds (TH2018402)” and “Nanjing Water Science and Technology Project: Key technologies research and application for water conservation and pollution reduction in Yaxihe basin, Gaochun”.

Conflicts of Interest

The authors declare no conflict of interest.

References

  1. Nasir, N.M.; Bakar, N.S.A.; Lananan, F.; Abdul Hamid, S.H.; Lam, S.S.; Jusoh, A. Treatment of African catfish, Clarias gariepinus wastewater utilizing phytoremediation of microalgae, Chlorella sp. with Aspergillus niger bio-harvesting. Bioresour. Technol. 2015, 190, 492–498. [Google Scholar] [CrossRef]
  2. Gondwe, M.J.; Guildford, S.J.; Hecky, R.E. Tracing the flux of aquaculture-derived organic wastes in the southeast arm of Lake Malawi using carbon and nitrogen stable isotopes. Aquaculture 2012, 350–353, 8–18. [Google Scholar] [CrossRef]
  3. Ghasemi, Z.; Sourinejad, I.; Kazemian, H.; Rohani, S. Application of zeolites in aquaculture industry: A review. Rev. Aquac. 2018, 10, 75–95. [Google Scholar] [CrossRef]
  4. Zhang, P.; Wang, S.; Chen, S.B.; Zhang, L.; Zhu, J.X. The effects of current density on the efficiency of aquaculture wastewater treatment by electrochemical technology. Fish. Mod. 2018, 2, 13–20. [Google Scholar]
  5. Rodziewicz, J.; Filipkowska, U.; Janczukowicz, W. Application of rotating biological contactor for treatment of wastewater from fish breeding. Rocz. Ochr. Srodowiska 2011, 13, 1233–1244. [Google Scholar]
  6. Li, Z.; Yu, E.; Zhang, K.; Gong, W.; Xie, J. Water treatment effect, microbial community structure, and metabolic characteristics in a field-scale aquaculture wastewater treatment system. Front. Microbiol. 2020, 11, 930. [Google Scholar] [CrossRef]
  7. Nizam, N.U.M.; Hanafiah, M.M.; Noor, I.M.; Karim, H.I.A. Efficiency of Five Selected Aquatic Plants in Phytoremediation of Aquaculture Wastewater. Appl. Sci. 2020, 10, 1–11. [Google Scholar]
  8. Lananan, F.; Hamid, S.H.A.; Din, W.N.S.; Ali, N.; Khatoon, H.; Jusoh, A.; Endut, A. Symbiotic bioremediation of aquaculture wastewater in reducing ammonia and phosphorus utilizing Effective Microorganism (EM-1) and microalgae (Chlorella sp.). Int. Biodeterior. Biodegrad. 2014, 95, 127–134. [Google Scholar] [CrossRef]
  9. Wu, H.; Lu, K.; Qian, W.; Zheng, Z.; Chen, H.; Wan, L. Effectiveness of remediating aquaculture wastewater by immobi-lized microorganisms and Myriophyllum aquaticum. J. Fish. Sci. China 2013, 20, 316–326. [Google Scholar] [CrossRef]
  10. Chen, T.; Yang, J.; Huang, B.; Liu, W.; Lu, C. Combined process of biofilm+roots for aquaculture wastewater remediation. IOP Conf. Ser. Earth Environ. Sci. 2020, 508, 012102. [Google Scholar] [CrossRef]
  11. Suresh, B.; Ravishankar, G.A. Phytoremediation-a novel and promising approach for environmental clean-up. Crit. Rev. Biotechnol. 2004, 24, 97–124. [Google Scholar] [CrossRef]
  12. Aken, V.B. Transgenic plants for phytoremediation: Helping nature to clean up environmental pollution. Trends Biotechnol. 2008, 26, 225–227. [Google Scholar] [CrossRef]
  13. Cheng, S.P.; Xiao, J.; Xiao, H.P.; Zhang, L.P.; Wu, Z.B. Phytoremediation of triazophos by Canna Indica Linn. In a hydroponic system. Int. J. Phytoremed. 2007, 9, 453–463. [Google Scholar] [CrossRef]
  14. Fraser, L.H.; Carty, S.M.; Steer, D. A test of four plant species to reduce total nitrogen and total phosphorus from soil leachate in subsurface wetland microcosms. Bioresour. Technol. 2004, 94, 185–192. [Google Scholar] [CrossRef]
  15. Wei, R.X.; Wu, H.Q.; Zhang, J.R.; Li, F.P. Remediation effects of plant floating bed-microorganism on contaminated water. Ecol. Environ. Sci. 2009, 18, 68–74. [Google Scholar]
  16. Rehman, K.; Imran, A.; Amin, I.; Afzal, M. Inoculation with bacteria in floating treatment wetlands positively modulates the phytoremediation of oil field wastewater. J. Hazard. Mater. 2018, 349, 242–251. [Google Scholar] [CrossRef]
  17. Grosse, W.; Wissing, F.W.; Perfler, R.; Wu, Z.; Chang, J.; Lei, Z. Waterqualityimprovement in tropical and subtropical areas for reuse and rehabilitation of aquatic ecosystem. In Freshwater Contamination in China, Chapter III; Gawlik, B.M., Platzer, B., Muntau, H., Eds.; Office for Official Publications of the European Communities, European Communities: Brussells, Belgium, 2001; pp. 19–32. [Google Scholar]
  18. Cheng, S.; Ren, F.; Grosse, W.; Wu, Z. Effects of cadmium on chlorophyll content, photochemical efficiency, and photosynthetic intensity of Canna indica Linn. Int. J. Phytoremed. 2002, 4, 239–246. [Google Scholar] [CrossRef]
  19. Huang, Z.T.; Jiang, Y.L.; Song, X.F. Research progress of aquaculture wastewater treatment with aerobic denitrification technology. Fish. Mod. 2018, 5, 7–13. [Google Scholar]
  20. Ansari, F.A.; Singh, P.; Guldhe, A.; Bux, F. Microalgal cultivation using aquaculture wastewater: Integrated biomass generation and nutrient remediation. Algal Res. 2017, 21, 169–177. [Google Scholar] [CrossRef]
  21. Hu, Z.Y.; Lu, K.H.; Liang, J.J. Role of rhizosphere microorganisms of aquatic plants in phytoremediation of wastewater. Environ. Sci. Technol. 2010, 33, 75–80. [Google Scholar]
Figure 1. Flume sketch.
Water 12 03384 g001
Figure 2. Field test scheme.
Water 12 03384 g002
Figure 3. Effect of plant coverage on pollutant removal efficiency.
Water 12 03384 g003
Figure 4. Relationship between plant coverage rate and cost.
Water 12 03384 g004
Figure 5. Effect of hydraulic loading on pollutant removal efficiency.
Water 12 03384 g005
Figure 6. Effect of hydraulic loading on pollutant removal load.
Water 12 03384 g006
Figure 7. Test site river before and after setting-up the floating plant bed.
Water 12 03384 g007
Figure 8. Fitting curve for the coverage length and pollutant degradation coefficient.
Water 12 03384 g008
Table 1. Pollutant content of mixed wastewater.
PollutantCODMnTNTP
Concentration (mg/L)7.5–10.56.0–7.50.4–0.6
Table 2. Concentration of outlet pollutants under various plant coverage rates.
IndexInlet ConcentrationPlant Coverage Rate
0%10%30%60%90%
DO (mg/L)1.983.052.912.011.030.49
TN (mg/L)7.166.996.574.904.543.60
TP (mg/L)0.510.470.410.330.270.22
CODMn (mg/L)10.059.138.797.987.857.75
cost(*×15$)00.631.893.785.67
Table 3. Concentrations of outlet pollutants under various hydraulic loadings.
IndexInlet ConcentrationHydraulic Loading (m3/m2·day)
0.250.51.01.52.0
TN (mg/L)6.132.362.542.753.974.90
TP (mg/L)0.420.130.130.160.250.32
CODMn (mg/L)7.863.834.115.166.506.66
Table 4. Degradation coefficient of CODMn, TN and TP.
PollutantsFloating Bed Coverage Length (km)
00.30.61
CODMnConcentration (mg/L)9.0408.9708.7808.420
Degradation coefficient (d−1)0.2440.6711.3132.681
TNConcentration (mg/L)1.9441.9381.8651.702
Degradation coefficient (d−1)0.0971.2042.8683.300
TPConcentration (mg/L)0.12310.12270.11680.1063
Degradation coefficient (d−1)0.1021.5452.9544.293
Table 5. Regression equation of the bed length change on the pollutant degradation coefficient.
PollutantRegression EquationR2
CODMny = 1.5636x2 + 0.8615x + 0.25120.9998
TNy = −2.4222x2 + 5.8022x − 0.01080.9723
TPy = −1.2010x2 + 5.4245x + 0.08220.9994
Publisher’s Note: MDPI stays neutral with regard to jurisdictional claims in published maps and institutional affiliations.

