1. Introduction
Water quality is a key issue in environmental problems, and remote sensing optical sensors can be used to quantify, among others, one fundamental water quality parameter such as Total Suspended Matter (TSM). TSM can be defined as the net weight of the material, including organic (detritus and phytoplankton) and non-organic fractions (minerals), collected by a 0.7 µm GF/F filter after water filtration [
1,
2]. The importance of TSM for water quality management is recognized by several authors: high values of TSM significantly contribute to the filling-in of streambeds, and also dams, reducing water body capacity and expanding the temporal intensity and the strength of floods, thus requiring expensive water treatment plants, bigger basins and frequent maintenance operations [
3,
4,
5,
6,
7]. In addition to the previous statements, TSM influences primary production, pollutants transport [
1], and water clarity/opacity.
The Three Gorges Dam (TGD) along the Yangtze river (China) project was implemented to contain the major threat posed by the heavy floods to the populations of the riverine cities and to tackle with the necessity of a drastic change in Chinese energy generation policy. However, TGD also affects two more aspects of the Yangtze River, flow regulation and sediment transport, thus influencing the downstream discharge and water level, and also the ecological environment with soil erosion and sediments depositions [
8]. Many authors discuss the variations of solid discharges (sediment) in respect to the hydrological regimes (discharges and rainfall) before and after the Three Gorges dam construction; mainly reporting a gradual decline in sediment production of Yangtze prior to TGD building, partially due to building of many dams, and to the reduced amount of rainfall in the Jialing basin, one of the most important tributaries of Yangtze river [
8,
9,
10,
11,
12,
13,
14,
15,
16,
17,
18,
19,
20,
21,
22,
23,
24]. The TGD is operational since 2003, and, after that period, the mean annual sediment load at Yichang gauging station decreases drastically by 84% compared to the pre-TGD period (1986–2002), from an average value of 500 million tons/year to 60 million tons/year [
21]; the Yangtze sediment discharge drastically declines too. Compared to the pre-1970 values, the sediment load after 2003 dropped by about 70% [
14,
17]. It is then reasonable to assume that 2003 is a critical year [
22,
23,
24]. All these papers rely on ground measurements or hydrological-hydraulic modeling to assess these changes, without any involvement of satellite data.
Traditionally, TSM has been quantified with in-situ monitoring which requires a network of gauging stations or the organization of sampling ship-based cruises, leading to data with wide temporal extent but related to one single point, or to transects valid only for the time of the measurement. Since the first years of 1970s, remote sensing techniques allowed to go beyond the limits of the traditional monitoring of several physicochemical indicators. Thanks to the constant improvements in the spectral and spatial resolutions of the sensors and in the development of dedicated algorithms, in recent years [
25,
26,
27,
28,
29,
30,
31], remote sensing techniques have been successfully and progressively extended from open to inland waters [
3,
27,
28,
29,
30,
31,
32,
33,
34,
35,
36,
37,
38,
39]. Satellite TSM retrieval presents several advantages over traditional methods in monitoring TSM concentration at high spatiotemporal resolution: one of the main benefits of the application of satellite remote sensing to water quality monitoring is the characterization of spatial and temporal variability of TSM and turbidity at the same time, which leads to synoptic views characterized by high temporal frequency, reducing the cost of in-situ sampling to the minimum and allowing us to reconstruct water quality variations at a big spatial and temporal scales. Moreover, the revisit time of many remote sensors was progressively reduced, intensifying the frequency of availability of water quality data, and allowing us to organize them in vast and easily accessible archives. However, some limitations should be considered, as the satellite-derived TSM concentrations are sensitive to the satellite sensor’s radiometric properties and its spatial resolution [
39], atmospheric correction approaches, and temporal resolution, which are limited by the cloud coverage and the intrinsic limitations of specific TSM algorithms [
27,
37]. Different procedures exist to retrieve TSM from satellite: a first distinction can be made between empirical models, using the relations between the reflectance of one or more bands and TSM, and IOP-based (inherent optical properties (IOP)) or semi-analytical models. The reflectance response at a given band is influenced by color, dimension, and shape of the suspended sediment and by its concentration as well. For these reasons, regional relationships are usually developed, valid for similar sediments. As an example, the single-band empirical model developed by [
34] established a robust linear relationship between the MODIS Terra Band 1 (0.62–0.67 μm) surface reflectance and in situ measurements of TSM, but the relation quickly saturates with the increase in TSM. To go beyond the above-mentioned limitations, some models include two or more algorithms based on two bands in visible and near-infrared (NIR) differences or ratios [
35], taking the resulting value of one or another algorithm according to the ranges of TSM. These models are more insensitive to backscatter variability. Some authors [
36,
37,
38] developed semi-analytical models defining reflectance as function of inherent optical properties, such as absorption and backscattering, applying an inversion to establish the reflectance spectra best fitting the measured reflectance. The retrieval of TSM in inland waters, especially along rivers network, is still an open issue in remote sensing, mainly due to the problem of distinguishing land from water caused by the low satellite spatial resolution and the changing water levels of rivers. In literature, different studies are available on the analysis of the variability of TSM along the Yangtze river by the means of remote sensing information [
11,
12,
13,
25,
30,
40], which are mainly focusing on the estimation of TSM along the river and especially on the estuary [
13,
40,
41,
42] or its main lakes [
11], or evaluating the effect of TGD on suspended sediment in the Yangtze Estuary and its adjacent coastal waters [
12].
However, very few papers use satellite data, or even multi-satellite data, to evaluate the effect of TGD on sediments just downstream of the dam, with an analysis on the comparison of TSM differences among the reservoir and the upstream and downstream areas. To authors’ knowledge, in literature, there is just one paper, by Chen et al. [
43], which uses the coarse resolution MODIS data to retrieve TSM with a Neural Network algorithm and then to investigate the sediment changes downstream of TGD from Yichang to the estuary area.
In this context, the aim of this paper is the time continuous estimation of the variations of total suspended matter concentrations induced by the construction of the Three Gorges Dam, one of the biggest dams in the world, and also by flood events along the middle Yangtze river and in the Three Gorges Dam Reservoir, China. Remote sensing data at different spatial and temporal resolutions are used to estimate TSM: daily MODIS data at 250 m, and Landsat 5 and 7 data every 16 days at 30 m. These estimates are subsequently correlated to daily discharge values measured along the Yangtze river to obtain continuous daily estimations of TSM values, covering also the days for which satellite scenes are lacking, allowing to compute the annual solid sediments volumes.
With respect to previous studies, three important innovations are introduced:
- (1)
Estimates of the effect of the Three Gorges Dam on total solid sediments volumes using only remote sensing information from MODIS and Landsat, since 99% of solid transport in Yangtze river occurs in suspension [
19];
- (2)
Time continuous estimates of TSM from remote sensing along the Yangtze river, thanks to the correlations between TSM satellite estimates and ground measured river discharges, which were used as a proxy to obtain daily TSM values with very limited dependence from cloud cover and satellite overpass time;
- (3)
Impact of the different remote sensing data spatial and temporal resolution on the derived TSM products.
Study Area
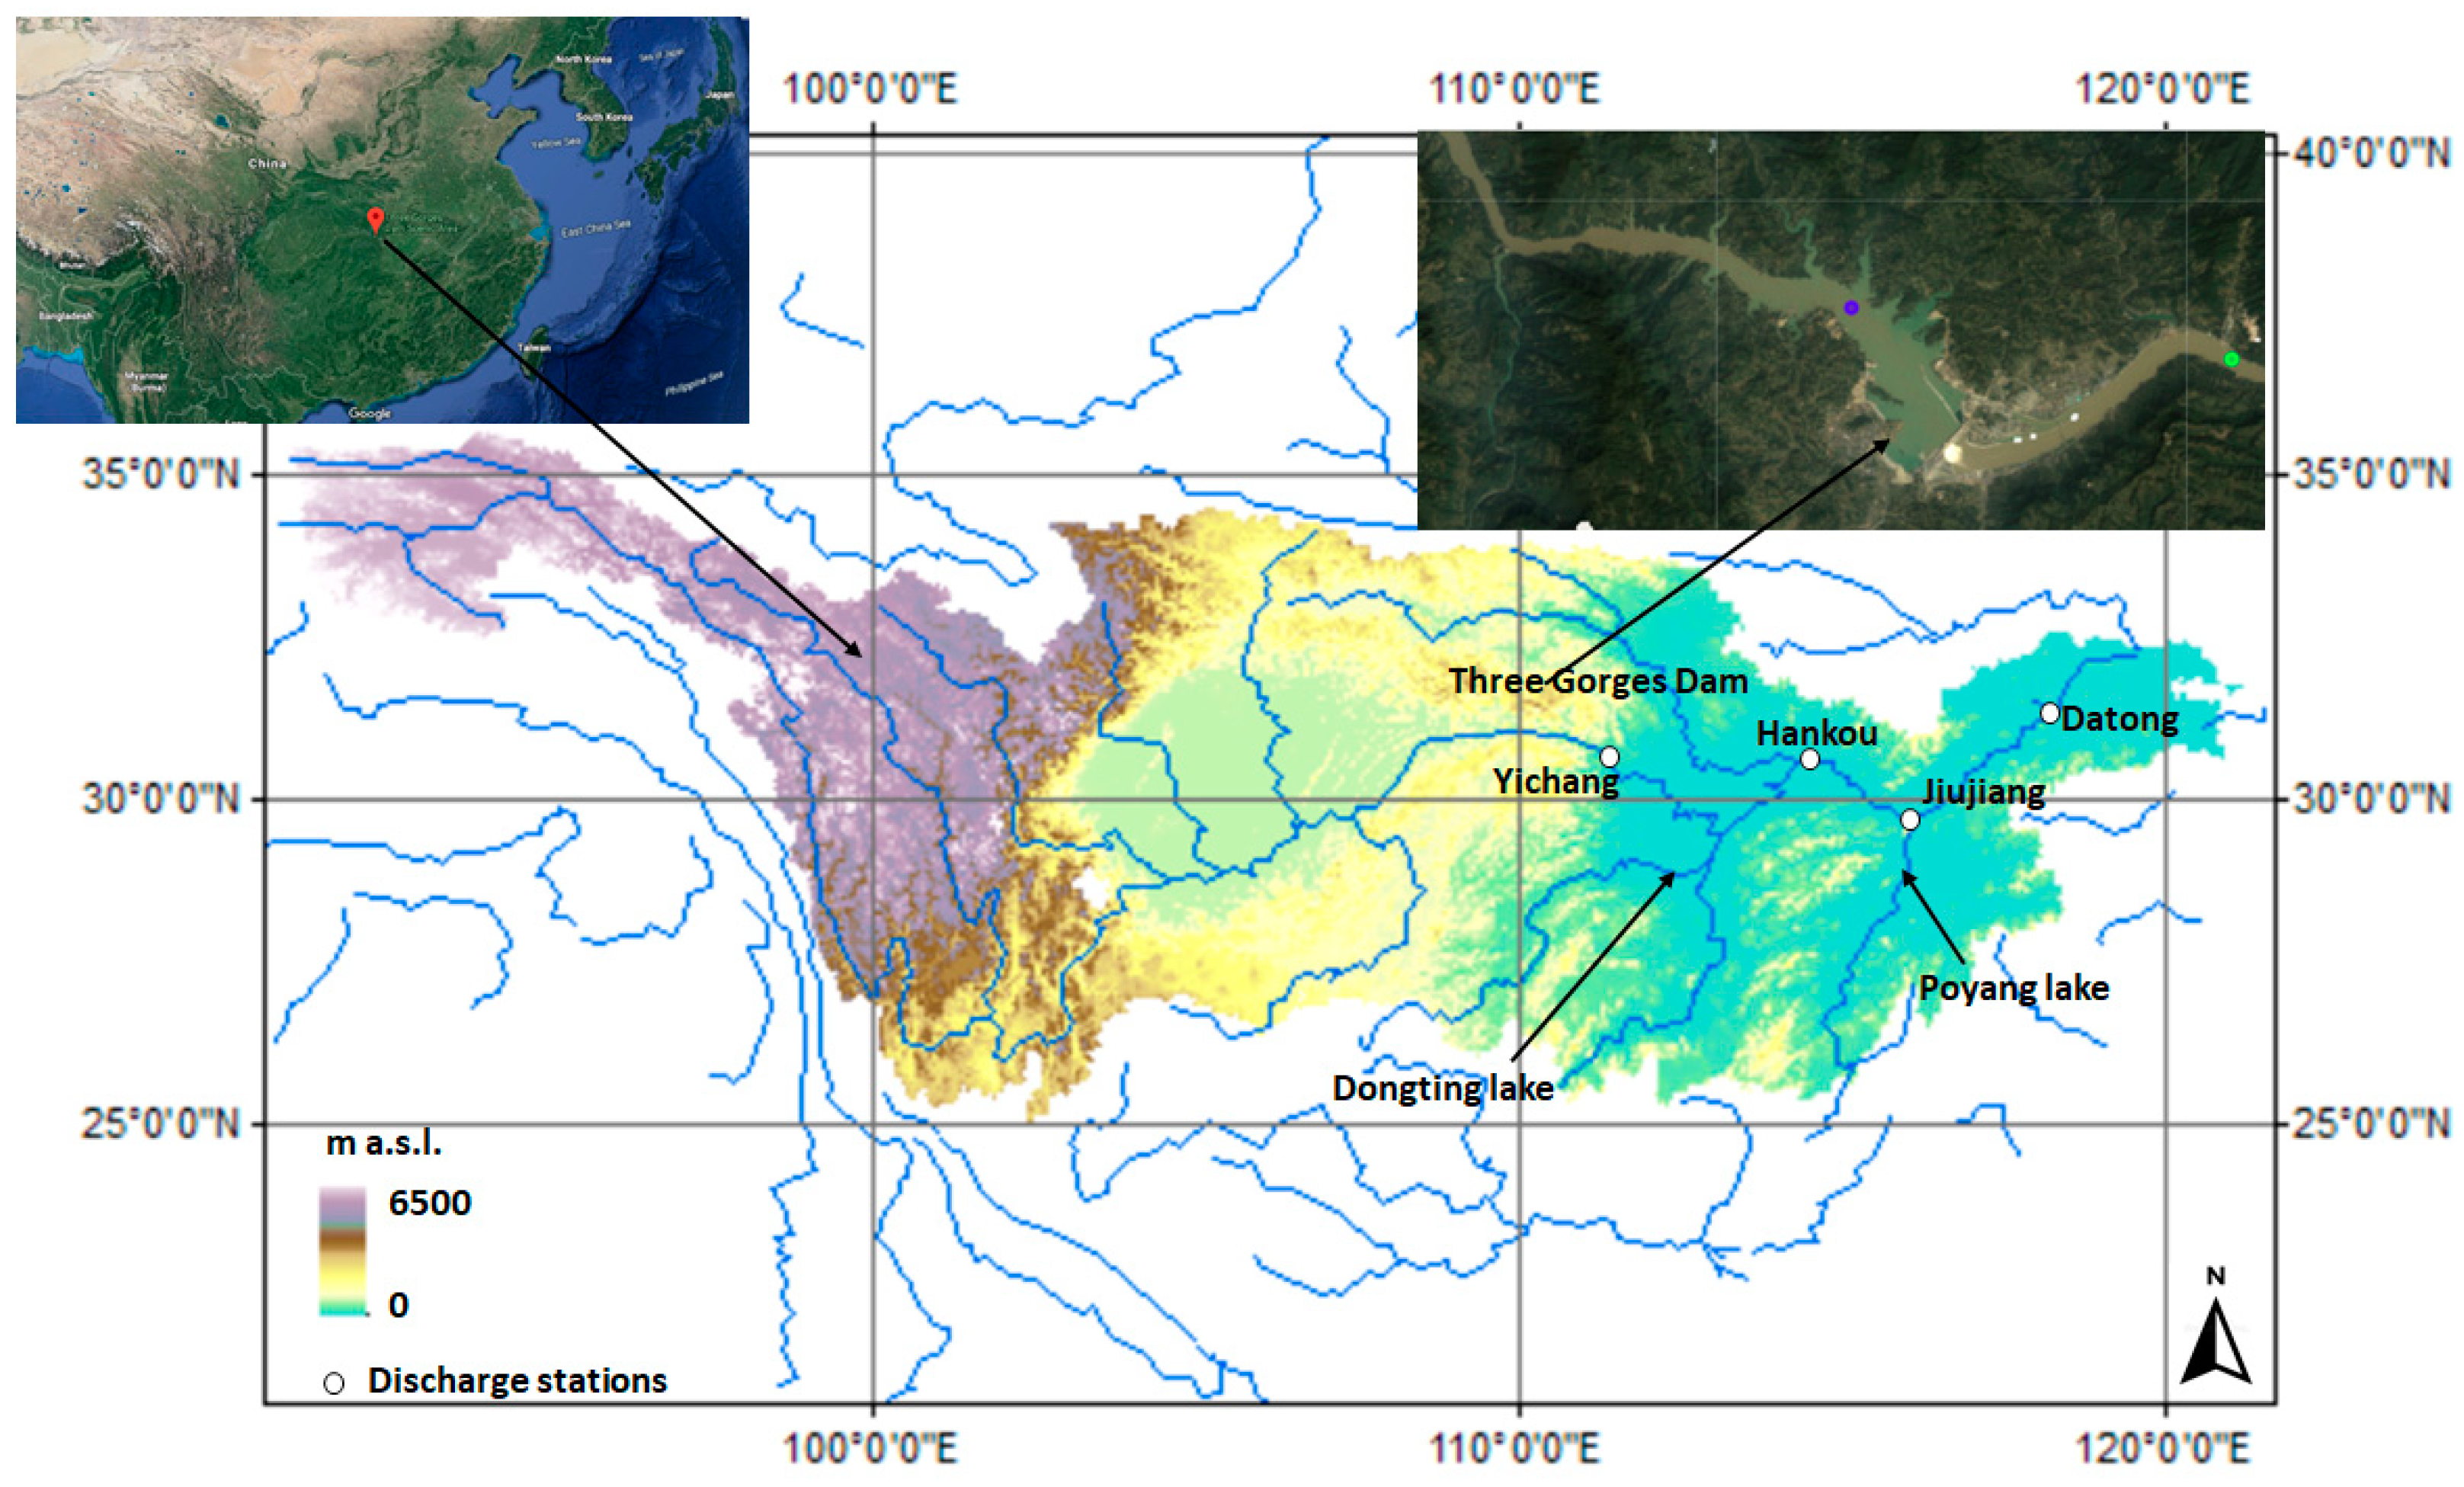
The Yangtze River, the longest river in Asia, originates on the Qinghai-Tibet Plateau at 5100 m above sea level, spanning 6300 km eastward before flowing into the East China Sea (
Figure 1). The whole river basin spans for 1,722,115 km
2 and it is conventionally subdivided into three sub-basins: the upper one, where the river flows in mountain areas with a steep river channel from the spring to Yichang, the middle one from Yichang to Hankou, and the lower basin from Hankou to the estuary [
9,
10,
11,
12,
13]. Rainfall in the Yangtze Basin follows a typical monsoonal regime [
16], with more than 60% of annual precipitation falling during the wet season between June and July [
17,
18]. The annual areal precipitation ranges from 859 mm in the upper reach to 1528 mm in the lower reach [
16].
Water and sediment discharge from affluents of the Yangtze vary considerably along the river course and during the year. The major sediment supply is originated from the Tibetan plateau western affluents upstream of Yichang, as well as from highly-erodible loess deposits in northern affluents [
17]. The increasing use of mineral compounds for agriculture such as herbicides and pesticides, together with the massive discharge of heavy metals and POP (persistent organic pollutants) as a consequence of the population growth and the intensive industrial activity, made the Yangtze river one of the most polluted rivers in the world: the considerable impacts on the river are attenuated by the notable dilution effect originated by the big water discharge of the river, although the pollutants may accumulate in trophic chains and sediments [
18].
The TGD achieved operational status in 2003, it is actually the world’s largest dam in terms of installed power capacity, and it closes the upper sub-basin of Yangtze River with its 185 m high wall that stores a water volume of 39.3 × 10
9 m
3 [
9,
44]. On the other hand, the dam building required the relocation of millions of people, and its socio-economic and environmental aspects are still under investigation: for instance, the TGD building could aggravate the fragmentation of aquatic biodiversity caused by the Gezhouba Dam building [
45], modifying also flow regulation and decreasing downstream sediment transport, [
8,
21,
22,
23,
24].
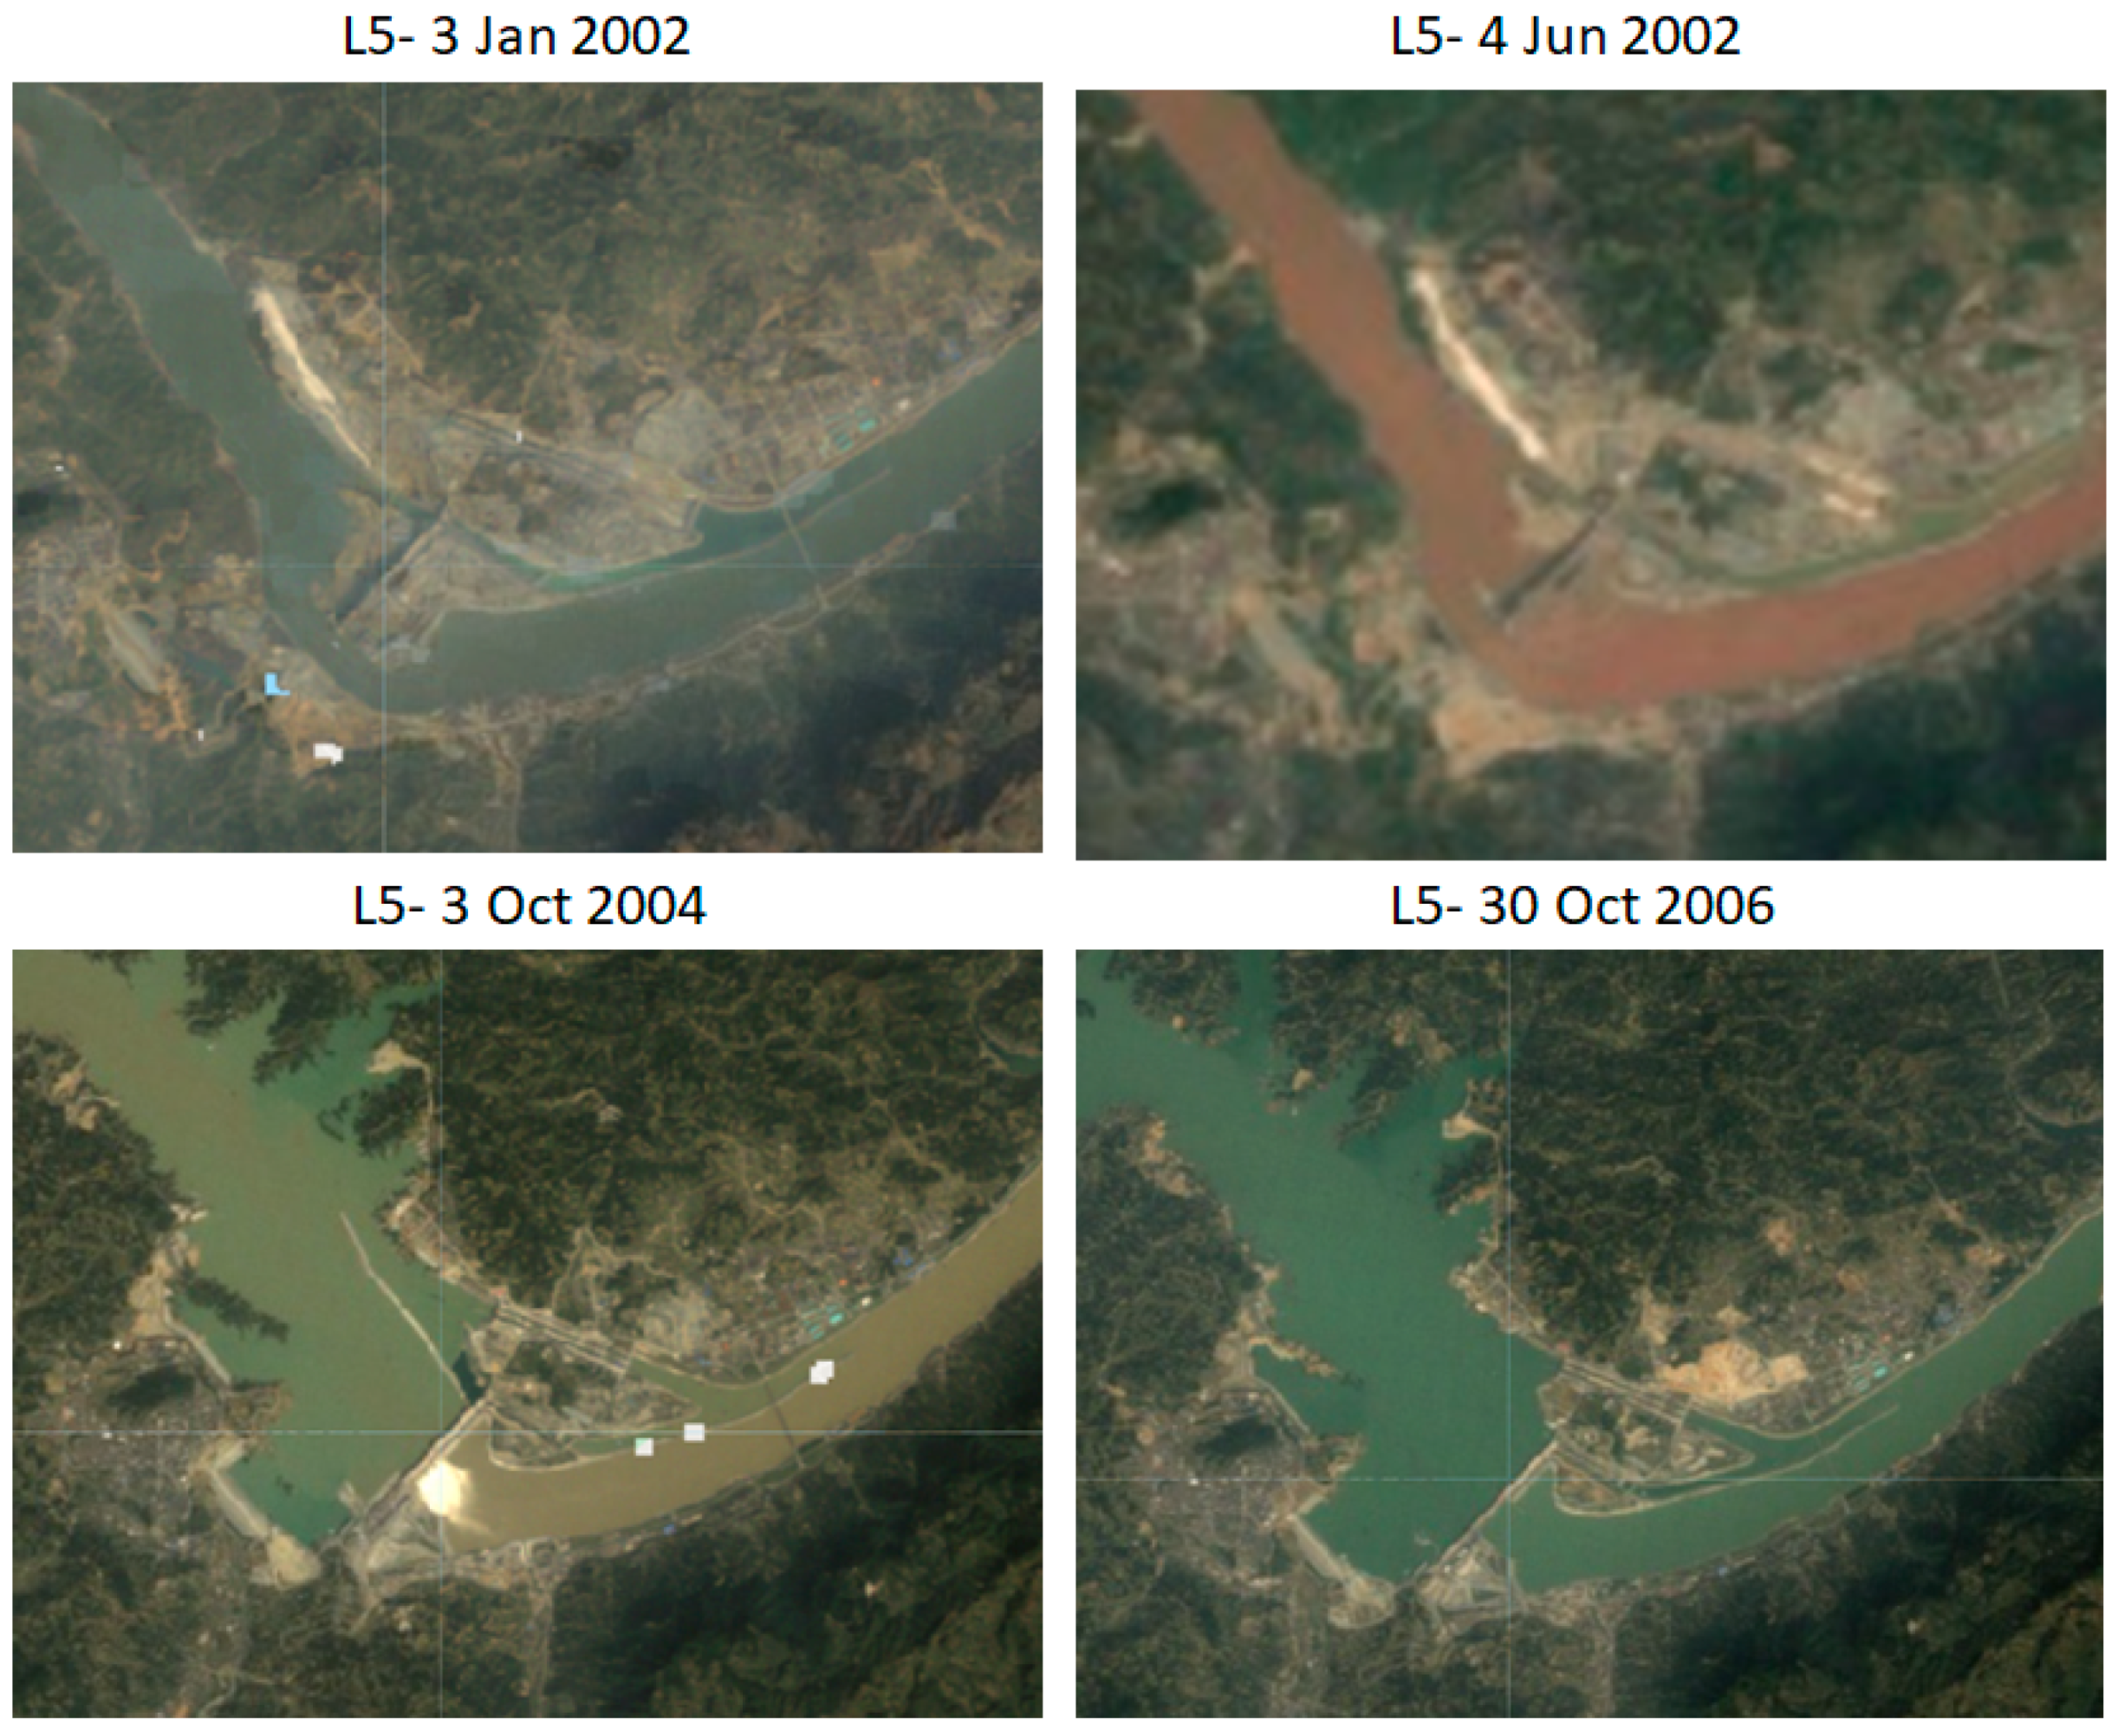
In the current study, three scenarios are investigated: the year 2002 was selected as pre-impoundment year with “ordinary” discharge, 2004 was post–impoundment with severe floods, and 2006 was chosen as post-impoundment with severe droughts. This variability of TGD behavior is clearly visible from
Figure 2, where different Landsat images are shown. During the year 2002, visible are the TGD still under construction and the absence of the reservoir; while in the 2004 and 2006 images both the dam and the lake are clearly detectable. As an example, the RGB image of 3 January 2002 shows a water color of the river clearer than on 4 June 2002. The RGB image of 3 October 2004 shows what happens in case of flood, the white glint originating from the dam wall is caused by the discharge water flowing through the spillway gates to regulate the flood: in addition to this, the impact of the turbulent water makes the downstream water more turbid. The RGB image of 30 October 2006 shows the ends of the flood season.
3. Results
3.1. MODIS and Landsat 5 and 7 Reflectances Extraction and Comparison
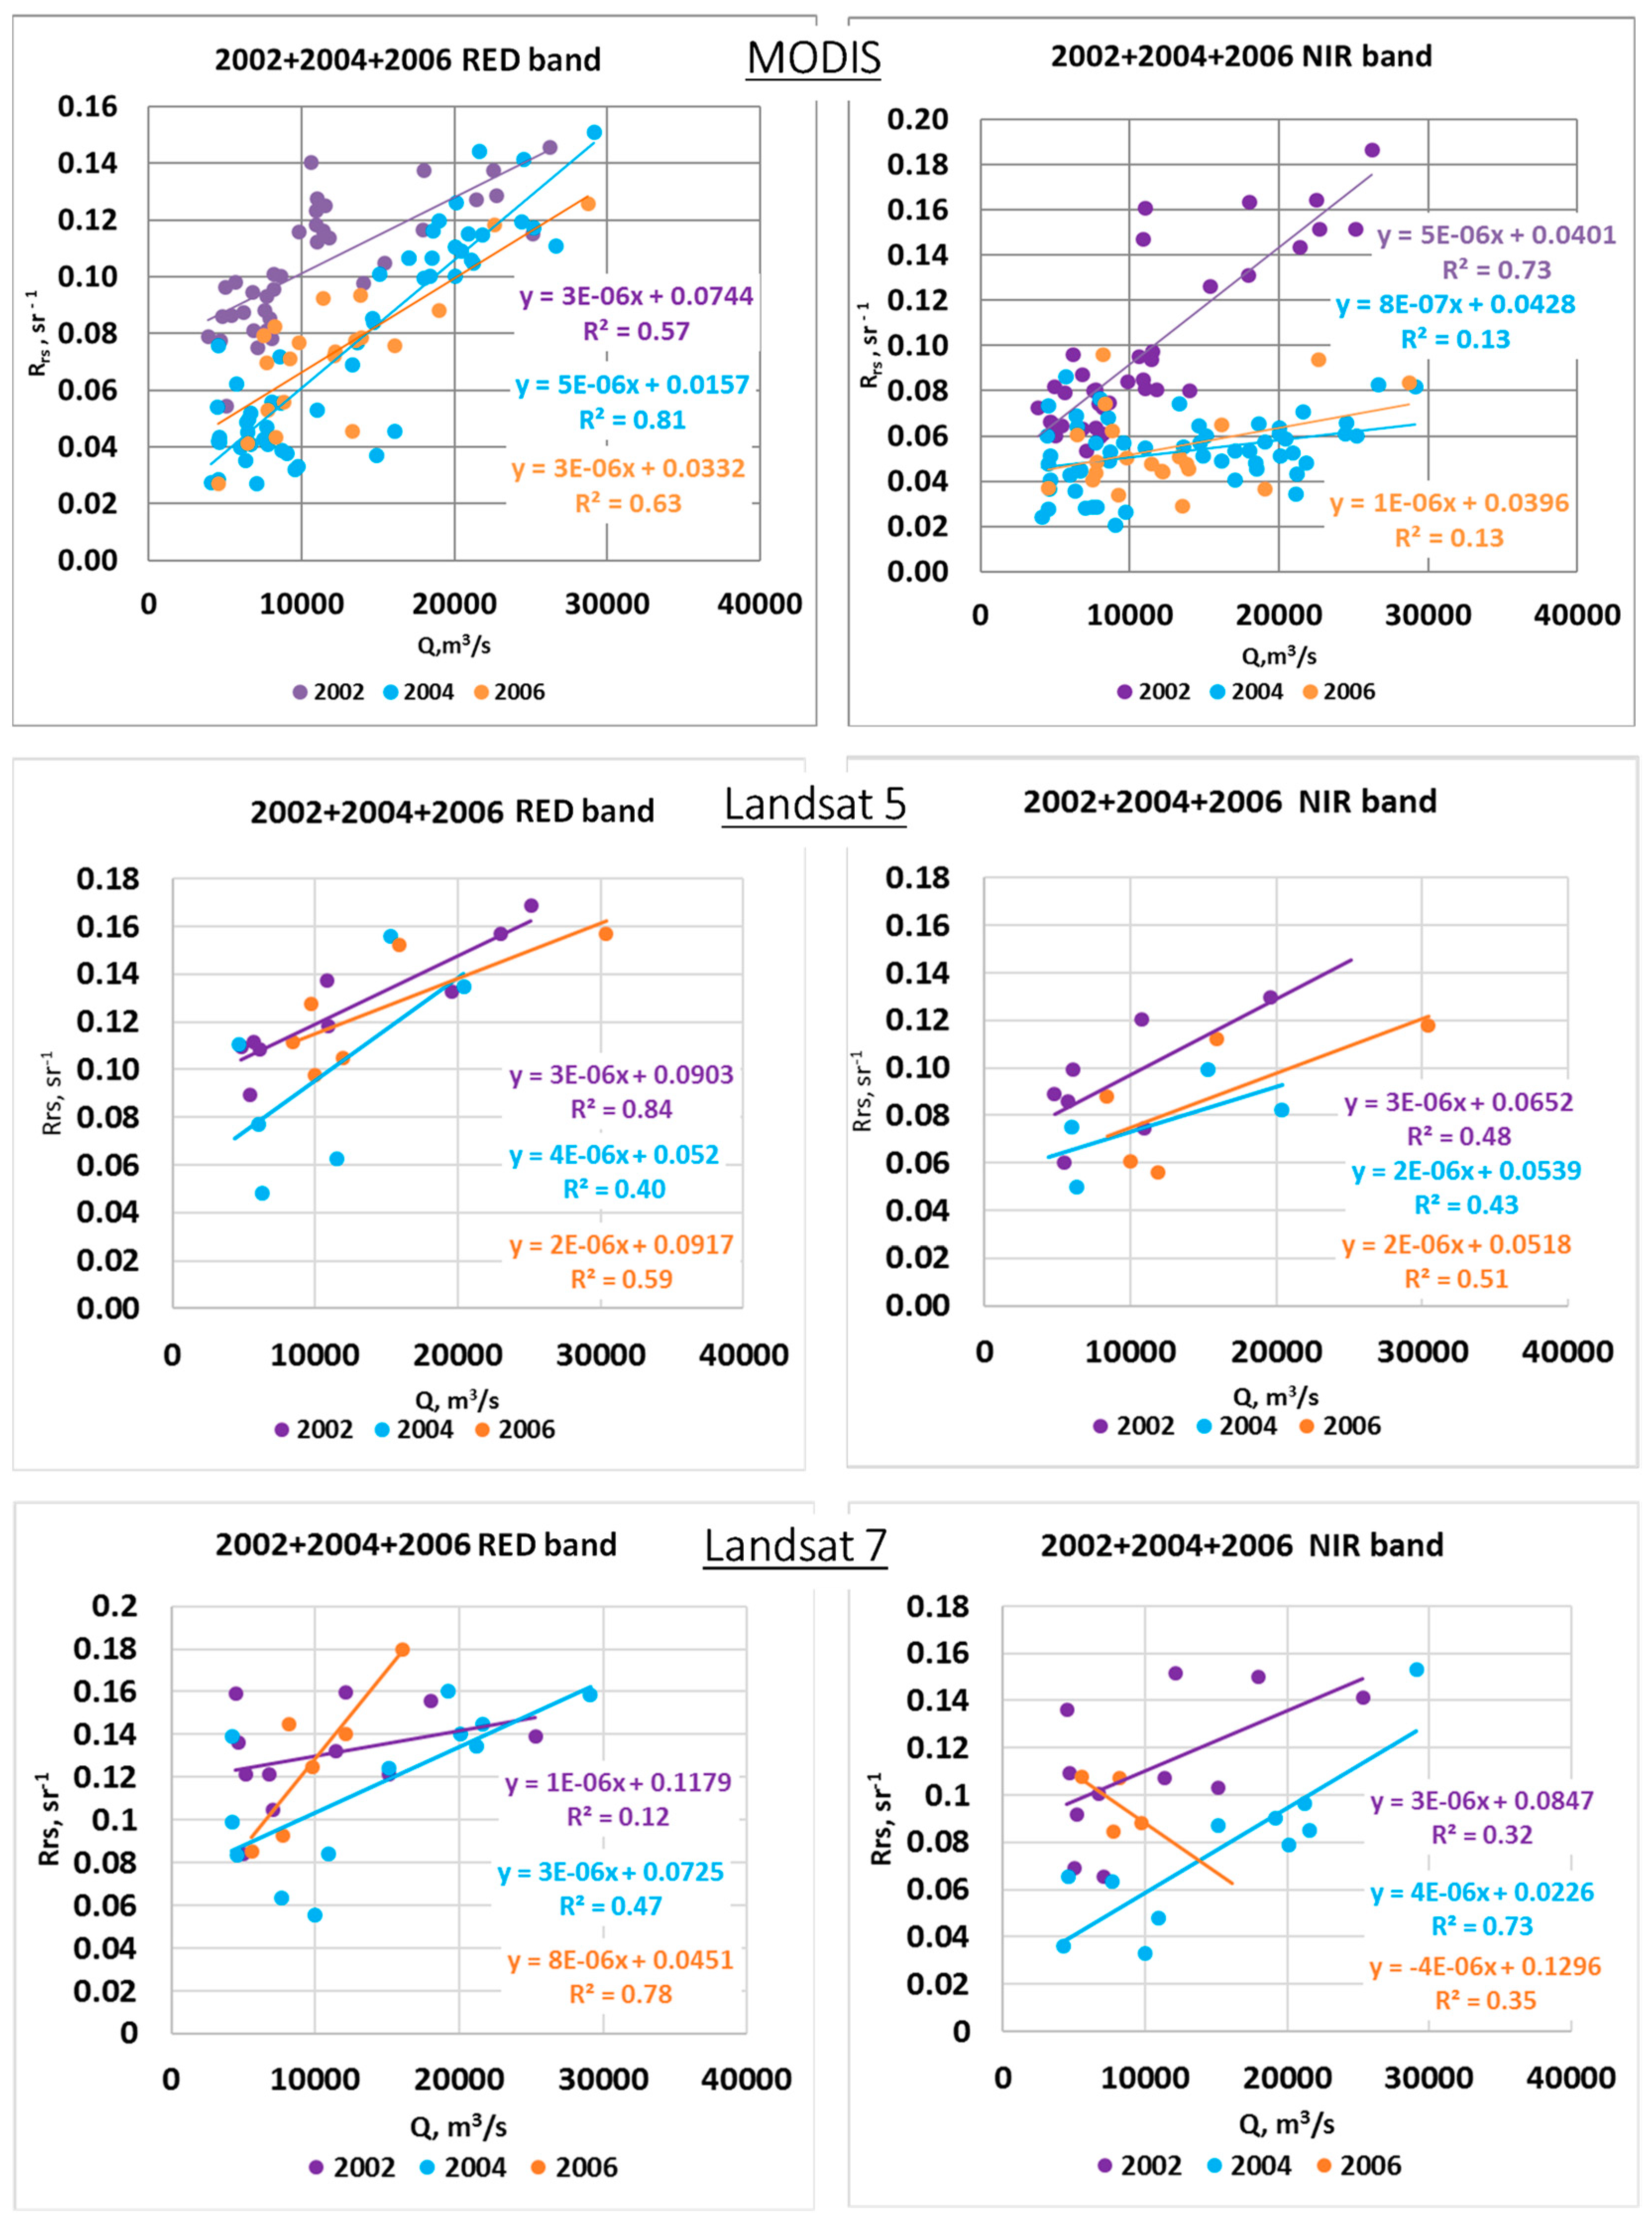
Prior to the application of any retrieval algorithm, the remote sensing reflectances Rrs from MODIS, Landsat 5, and Landsat 7 are compared with discharge data to verify the effective variation of Rrs with discharge, the reflectance being the base for TSM retrieval. Rrs of RED and NIR bands are firstly averaged over the entire area of study; then, the reflectances are plotted versus the observed discharge at Yichang station (
Figure 4). For MODIS data, Rrs in the RED band shows a constant variation and a good linear correlation with discharge for each examined year (R
2 always greater than 0.6). Interestingly, the linear relation of NIR band with discharge is strong for 2002, before the dam reached the operational state, and it becomes weaker for 2004 and 2006. Data from Landsat 5 and Landsat 7 are characterized by a bigger uncertainness given by the very low number of available images. For Landsat 5, the relations between reflectance and discharge exhibit a strong linearity (R
2 > 0.6) in the RED band for 2002 and 2006, slightly decreasing in 2004, with R
2 = 0.4. Reflectance in the NIR band appears moderately linear for all the three years considered.
For Landsat 7, a high correlation is observed just in 2006 for RED band (R2 = 0.78) and in 2004 for the NIR band (R2 = 0.73). In 2004, the multiple reflectance values of the RED band do not show linear correlation with discharge values inferior to 10,000 m3/s, giving an overall R2 = 0.47, while in 2006, the linearity of the RED band reflectance with discharge is suggested by R2 = 0.78. The different accuracy of the relationship between the reflectances from different satellites and discharge data may be mainly due to the number of available images each year (e.g., satellite temporal resolution).
3.2. TSM Retrieval and Correlation with Discharge
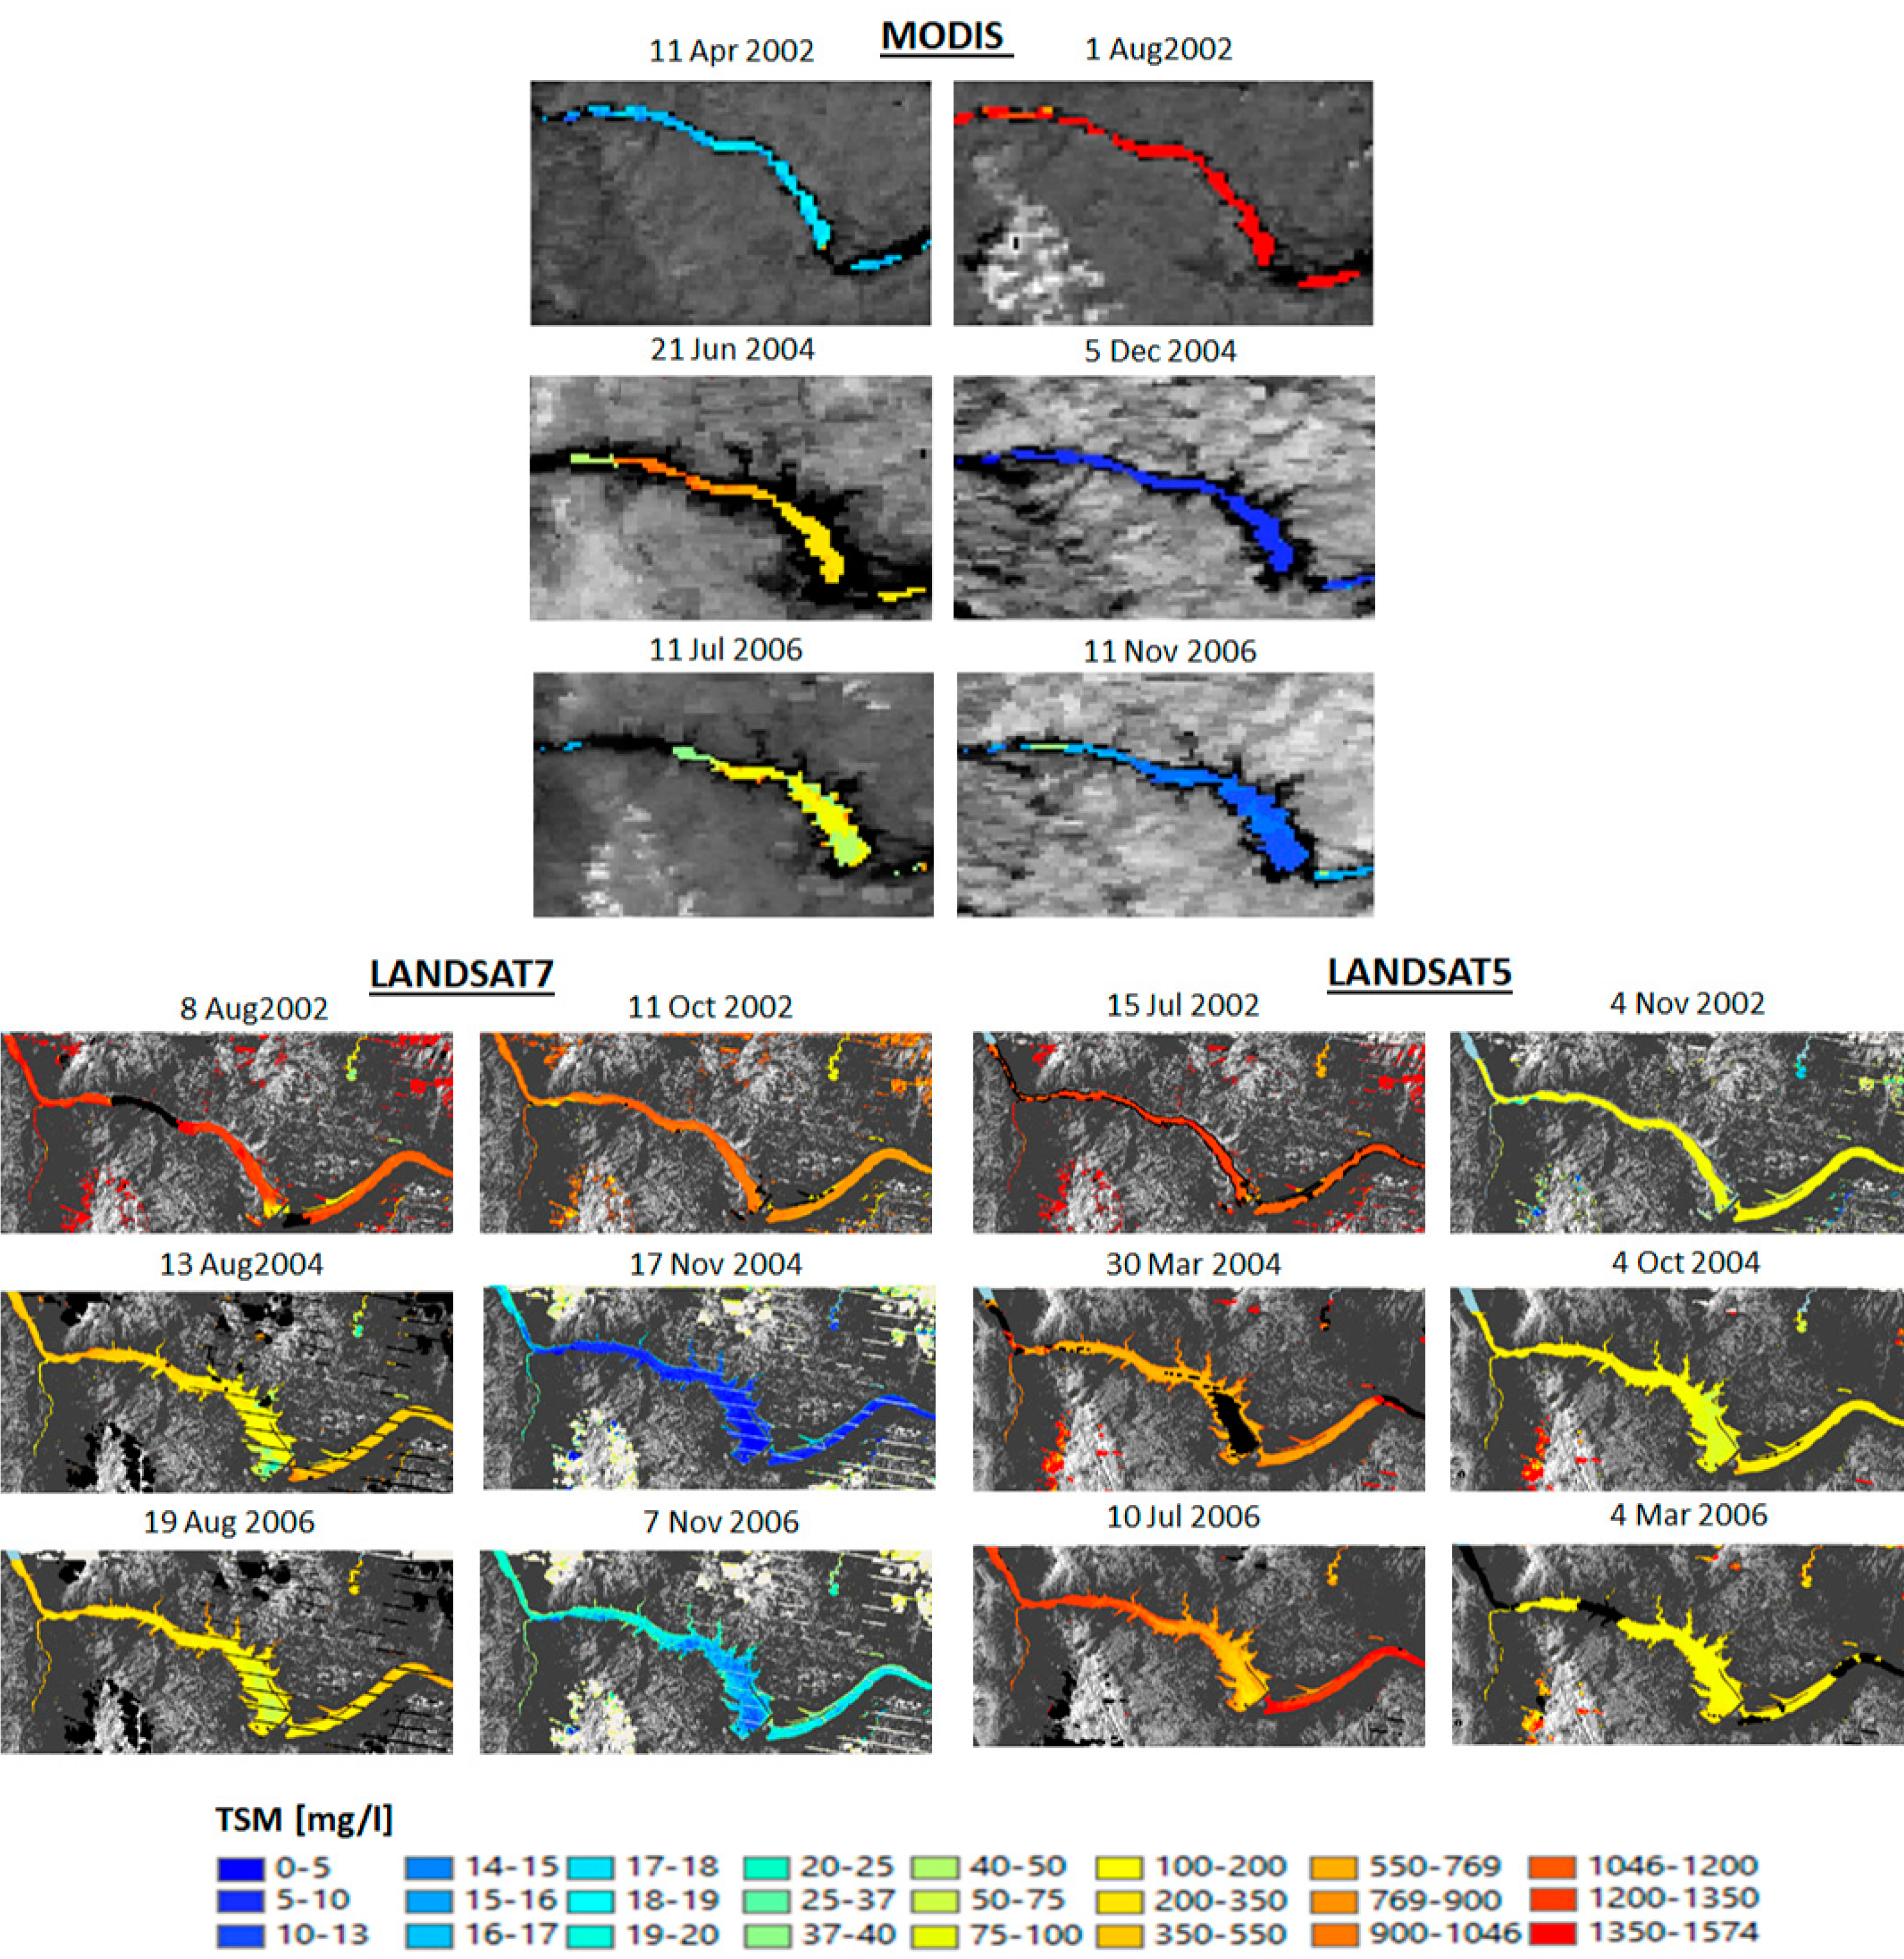
In
Figure 5, TSM maps from MODIS and Landsat 5 and 7 are depicted, showing its spatial distribution in different representative periods of the year (e.g., flood and dry periods): the lowest values are always located in the reservoir, due to the sedimentation induced by the dam; the highest values are registered during summer, with monsoonal rains.
The first noticeable features are the morphology of the river after 2002 and the striking difference between the local TSM values in March 2002—always lower than 20 mg/L, rising to no more than 30 mg/L in the following months—and the extremely high TSM values registered in the end of the monsoonal season of 2002, reaching a homogeneous maximum of 1574 mg/L. Even in September and October 2002, there is still a strong mixing of high–very high TSM along the whole river. All satellites are detecting similar TSM variations and absolute values. In the first and last months of 2004 and 2006, TSM values are sensibly lower than the corresponding ones in 2002. This depends on the reduction of the stream velocity caused by the full operability of the dam and on the morphological changes of the hydraulic section, resulting in an increased sedimentation rate. MODIS and Landsat 7 images are almost in agreement, while Landsat 5 images seem to produce a little overestimation. Comparing the summer months of the three years, a diminishing in TSM of one order of magnitude is noticeable, partially due to the previously exposed reasons, and also because of the drastic reduction of regulated discharge during the three years.
The produced maps allow us to appreciate the effect of the differences in spatial resolution between MODIS and Landsat 5 and 7, especially on finer features such as differences inside the sediment plumes and near the river bank and the dam (
Figure 5). In fact, from Landsat data, it is possible to observe along the river how TSM values are slightly lower near the banks with respect to the middle of the reservoir; a fact almost unnoticed with MODIS imagery. This is allegedly caused by the lower stream velocity along the banks, coupled with the hydrodynamic shadowing created by the numerous docks built perpendicularly to the river.
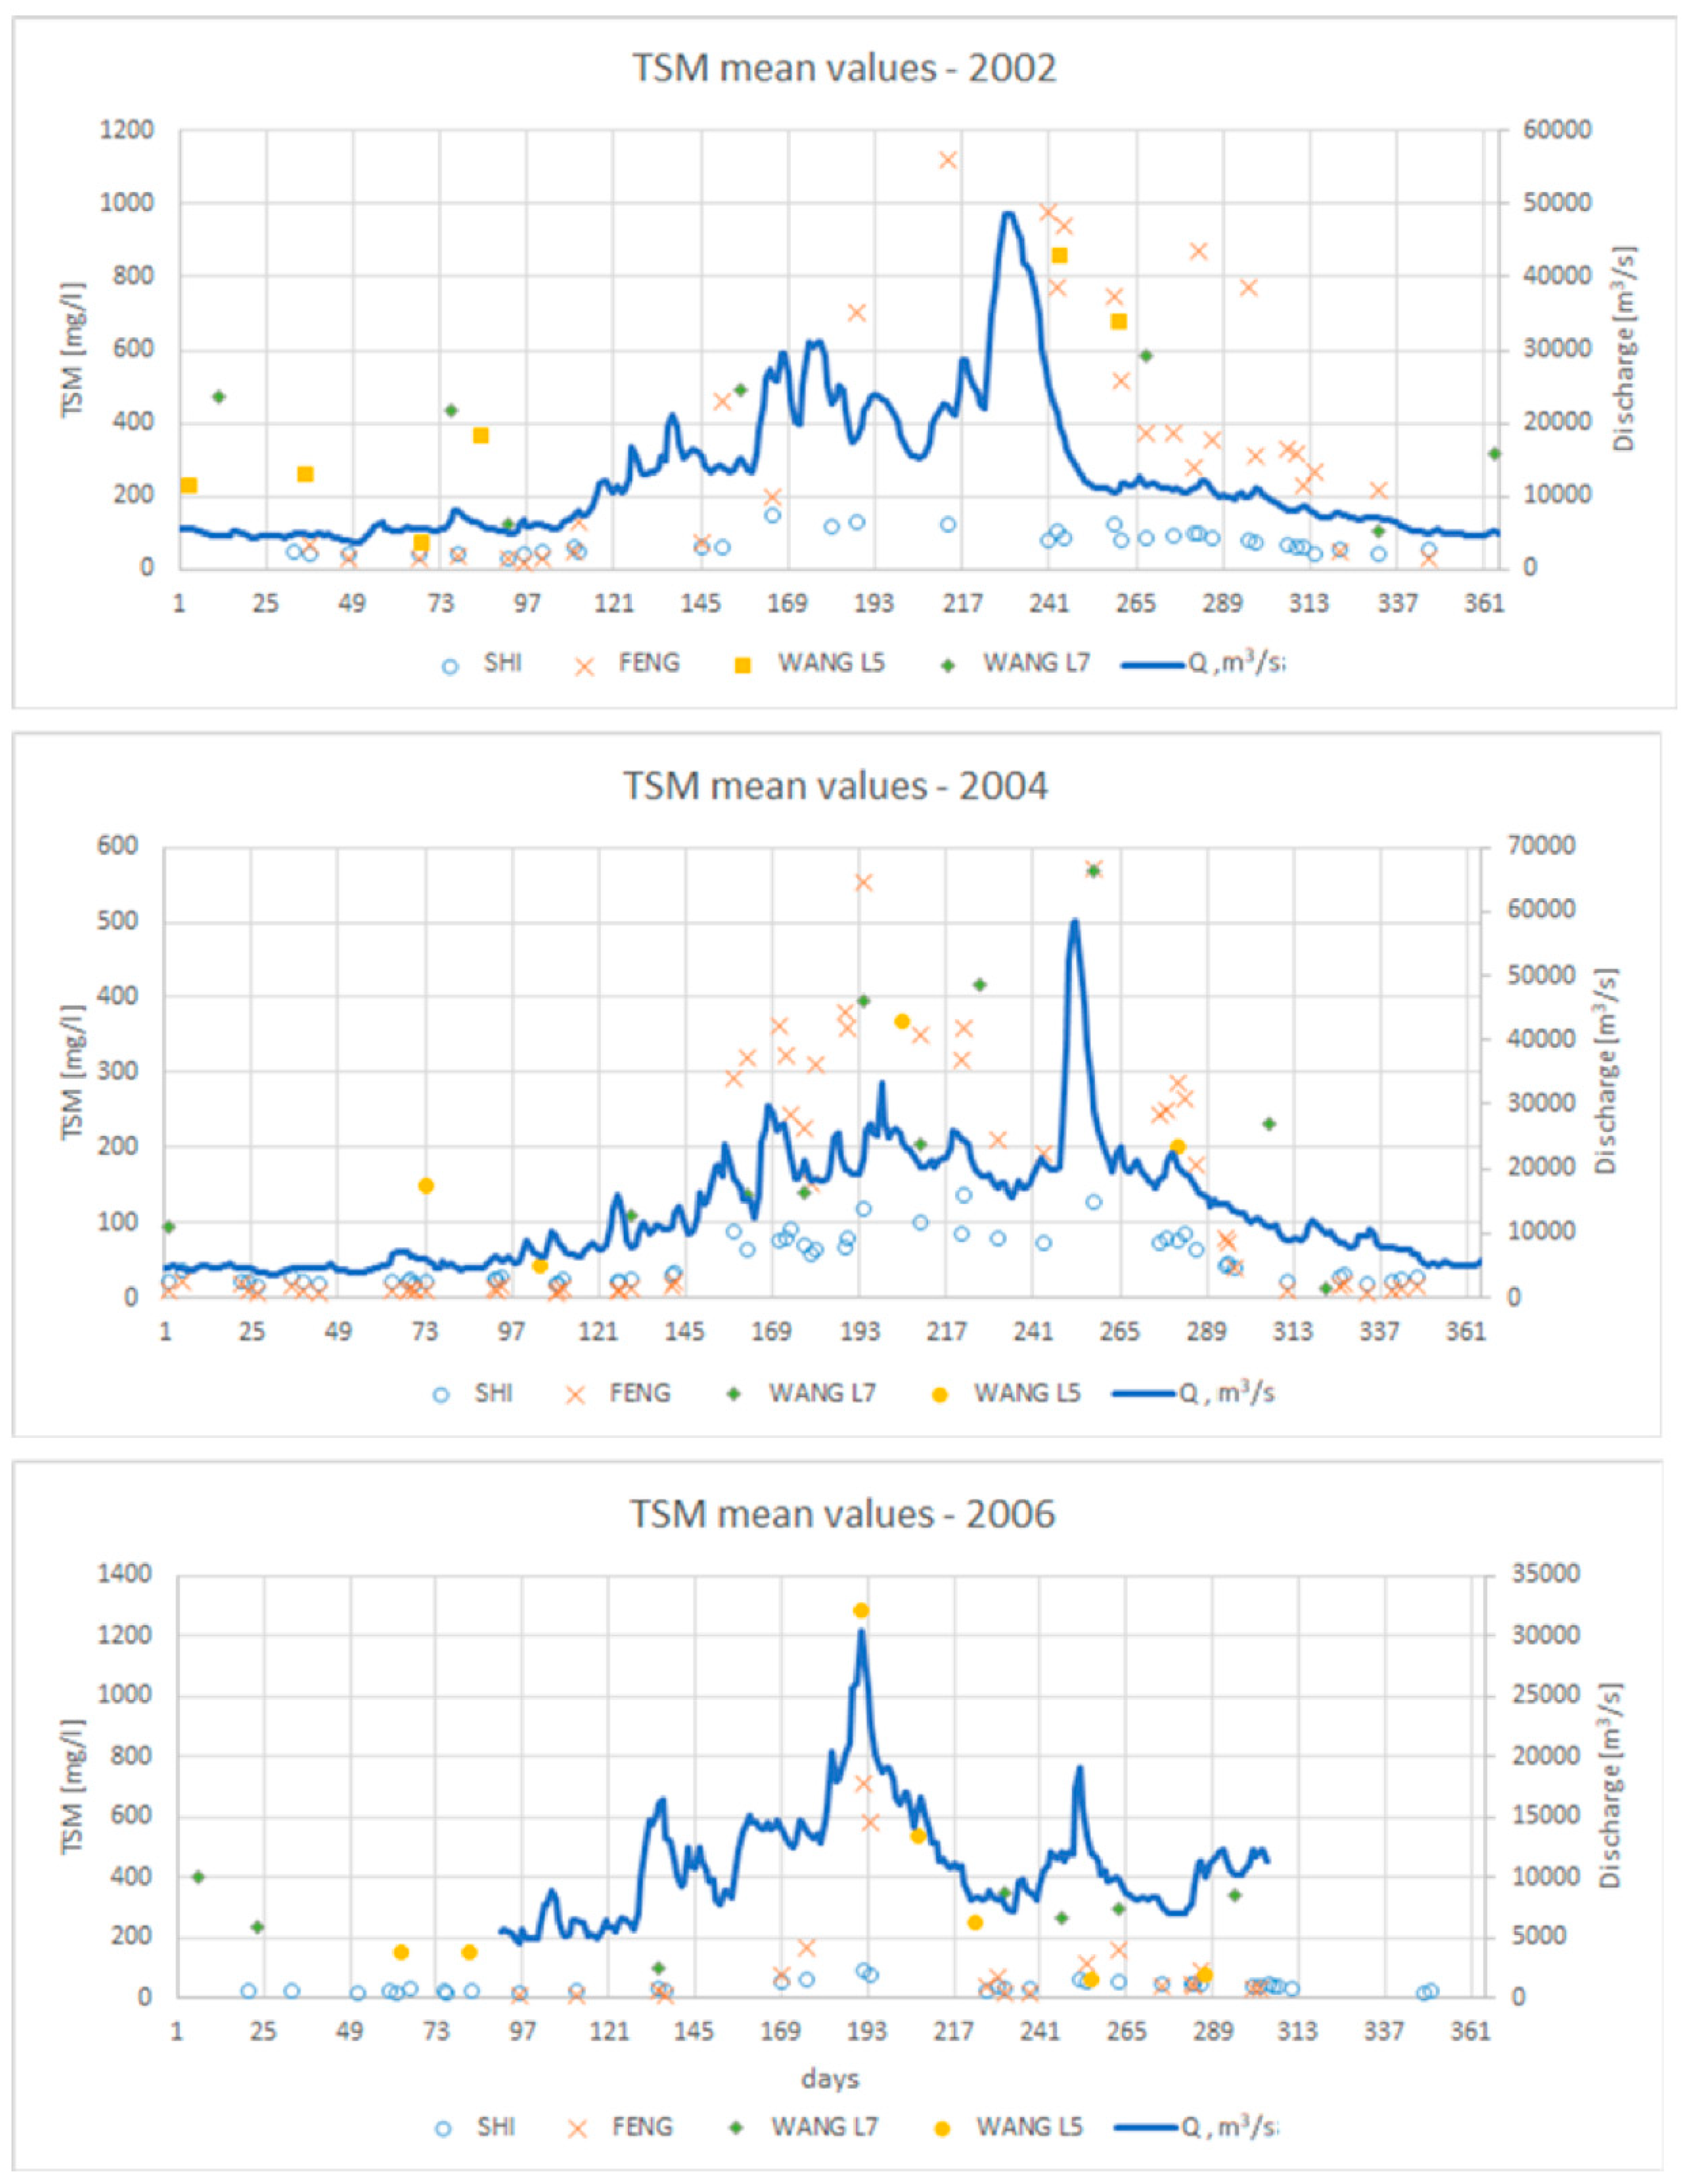
Daily TSM mean area values are then plotted against the in-situ daily discharge values at Yichang station to examine daily relative variations (in
Figure 6) for the three satellites estimates. The most immediate outcome is that discharge in 2006 is significantly lower, and for every year any major discharge peak is followed by increments of TSM mean values, while a decrease in TSM and discharge is observed at basin scale. Moreover, is interesting to note that, even for the lowest discharge values (~5000 m
3/s), TSM mean values never drop below 30 mg/L. TSM increases after each discharge peak. For MODIS, the Feng 2014 algorithm seems to be able to reproduce to discharge dynamic, on the contrary to the MODIS-Shi algorithm [
11] due to the problems the saturation for MODIS reflectances corresponding to 50 mg/L and beyond. Landsat 5 and 7 are both able to follow the discharge dynamic, with a similar behavior to MODIS data.
The correlations are then identified between daily discharge and TSM values in order to obtain daily estimations of TSM values, also covering the days for which satellite scenes were lacking. Linear relations are calculated at basin scale, and also for the three sub-areas, considering 2004 and 2006 together due to differences in discharge respect to 2002 and because the two years are following to the operational status of the dam:
where Q is the daily liquid discharge, a and b coefficients (
Table 2).
The scatter plots are computed and highlight how relations between TSM values generated by the algorithms and discharge appear weaker for pre-dam period than the post-dam period. For MODIS data the determination coefficients are computed, with R2 = 0.57 and R2 = 0.69 for MODIS-Shi and MODIS-Feng in 2002, and R2 = 0.77 and R2 = 0.75 for the post-dam period, respectively. For Landsat 5, the computation showed R2 = 0.83 in 2002 and R2 = 0.58 in the post-dam period, and for Landsat 7 R2 = 0.47 in 2002 and R2 = 0.19 in the post-dam period. The results may be related to the operational state reached by TGD in 2003: the sedimentation induced by the dam provokes a lowering of turbidity inside the reservoir, while the turbulent waters discharged by the power station increase the turbidity in the area immediately downstream to the TGD. The lowest correlations with discharge are correctly found in the reservoir lake, which is characterized mainly by still water, either from MODIS and Landsat datasets. Moreover, it is important to note that the relationships obtained with Landsat data, especially Landsat 7, are generated considering a small number of data, which may decrease the robustness of the retrieved correlation between TSM and discharge.
Hence, applying the best reliable empirical relations of
Table 2, daily TSM mean values are calculated with the different methods for each day of the analyzed period, taking advantage of the continuity of the discharge dataset for the days in which satellite information is missing due to cloud coverage or satellite problems. The inferred daily TSM values will allow us to calculate the monthly average values of TSM, which will be compared to monthly sediment discharge values available from literature.
Comparison of Daily Estimates between Different Satellites
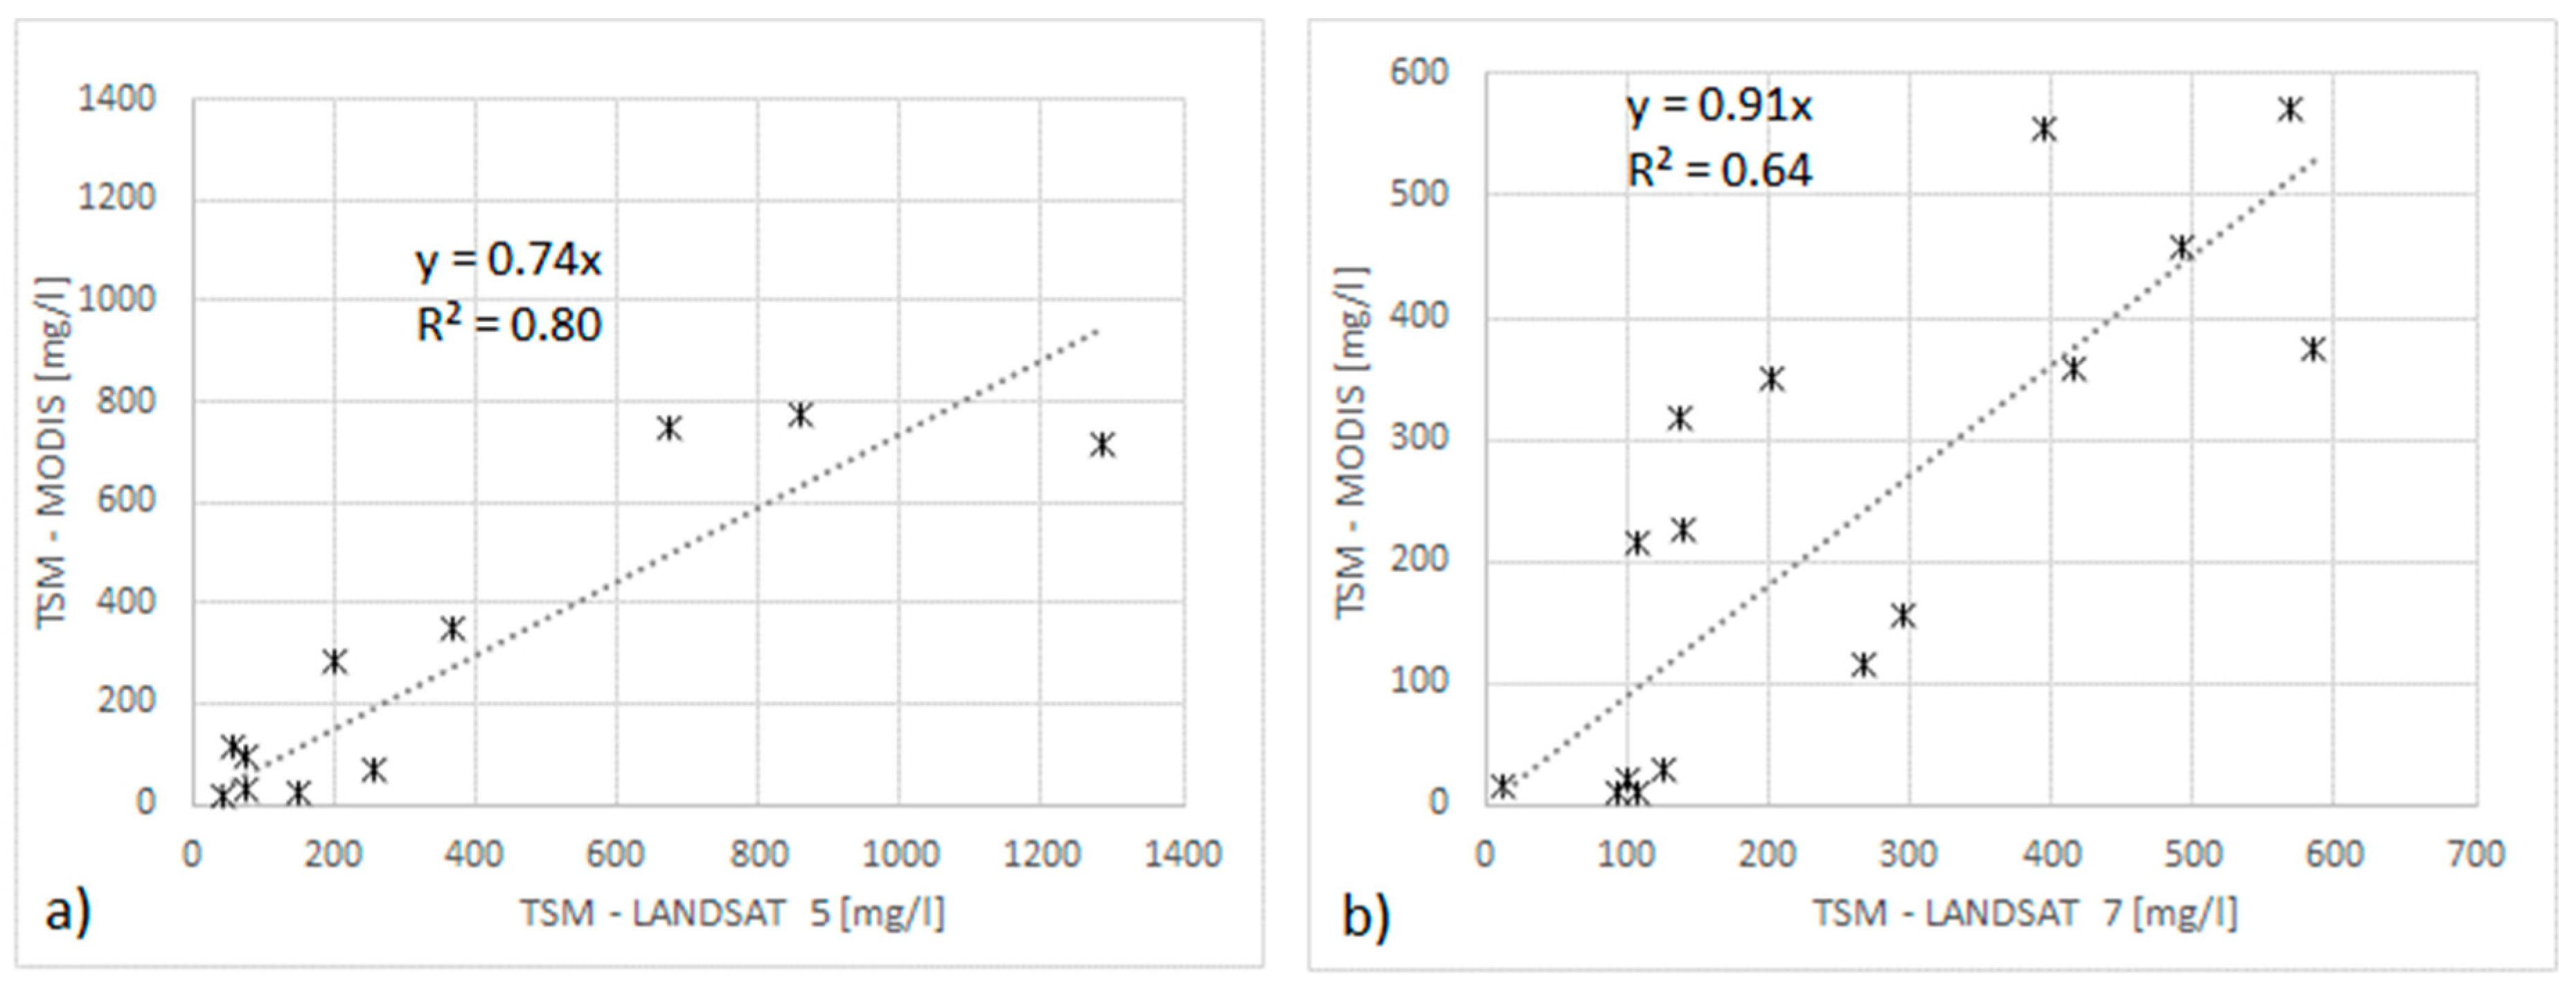
An inter-sensor validation of the TSM estimated products is shown in
Figure 7 to evaluate the impact of different spatial resolutions of the satellite sensor, the sensor’s radiometric properties, and atmospheric corrections, on the quantification of TSS concentration in riverine waters of Yangtze river. As previously mentioned (Paragraph 2.1), only 16 dates are comparable between Landsat 7 and MODIS along the three analyzed years, while even fewer images, 11 dates, are available for the comparison with Landsat 5.
The comparison between MODIS data and Landsat 7 (
Figure 7a) a R
2 = 0.64, an angular coefficient of 0.91 showing a good agreement of the two estimates with most of the points falling along the 1:1 line, and a MAD 96.3 mg/L report better results than the comparison between MODIS and Landsat 5 (
Figure 7b) data with a R
2 = 0.8, an angular coefficient of 0.74, and a MAD of 117.3 mg/L.
Due to high intra annual variation of TSM (e.g., discharge), an inter-comparison among the satellite estimates is performed considering the high (TSM > 400 mg/L) and low (TSM < 400 mg/L) TSM values. These high values are measured during the Monsoon season, approximately between the days 145 and 265. Both Landsat 5 and Landsat 7 in comparison with MODIS have a better agreement during low TSM values period than high value period. R2 of 0.5 and 0.81 are found for low TSM values for Landsat 5 and 7, respectively, while R2 around 0.1 are obtained for both satellites for high TSM values.
3.3. Seasonal Variations of Total Suspended Matter
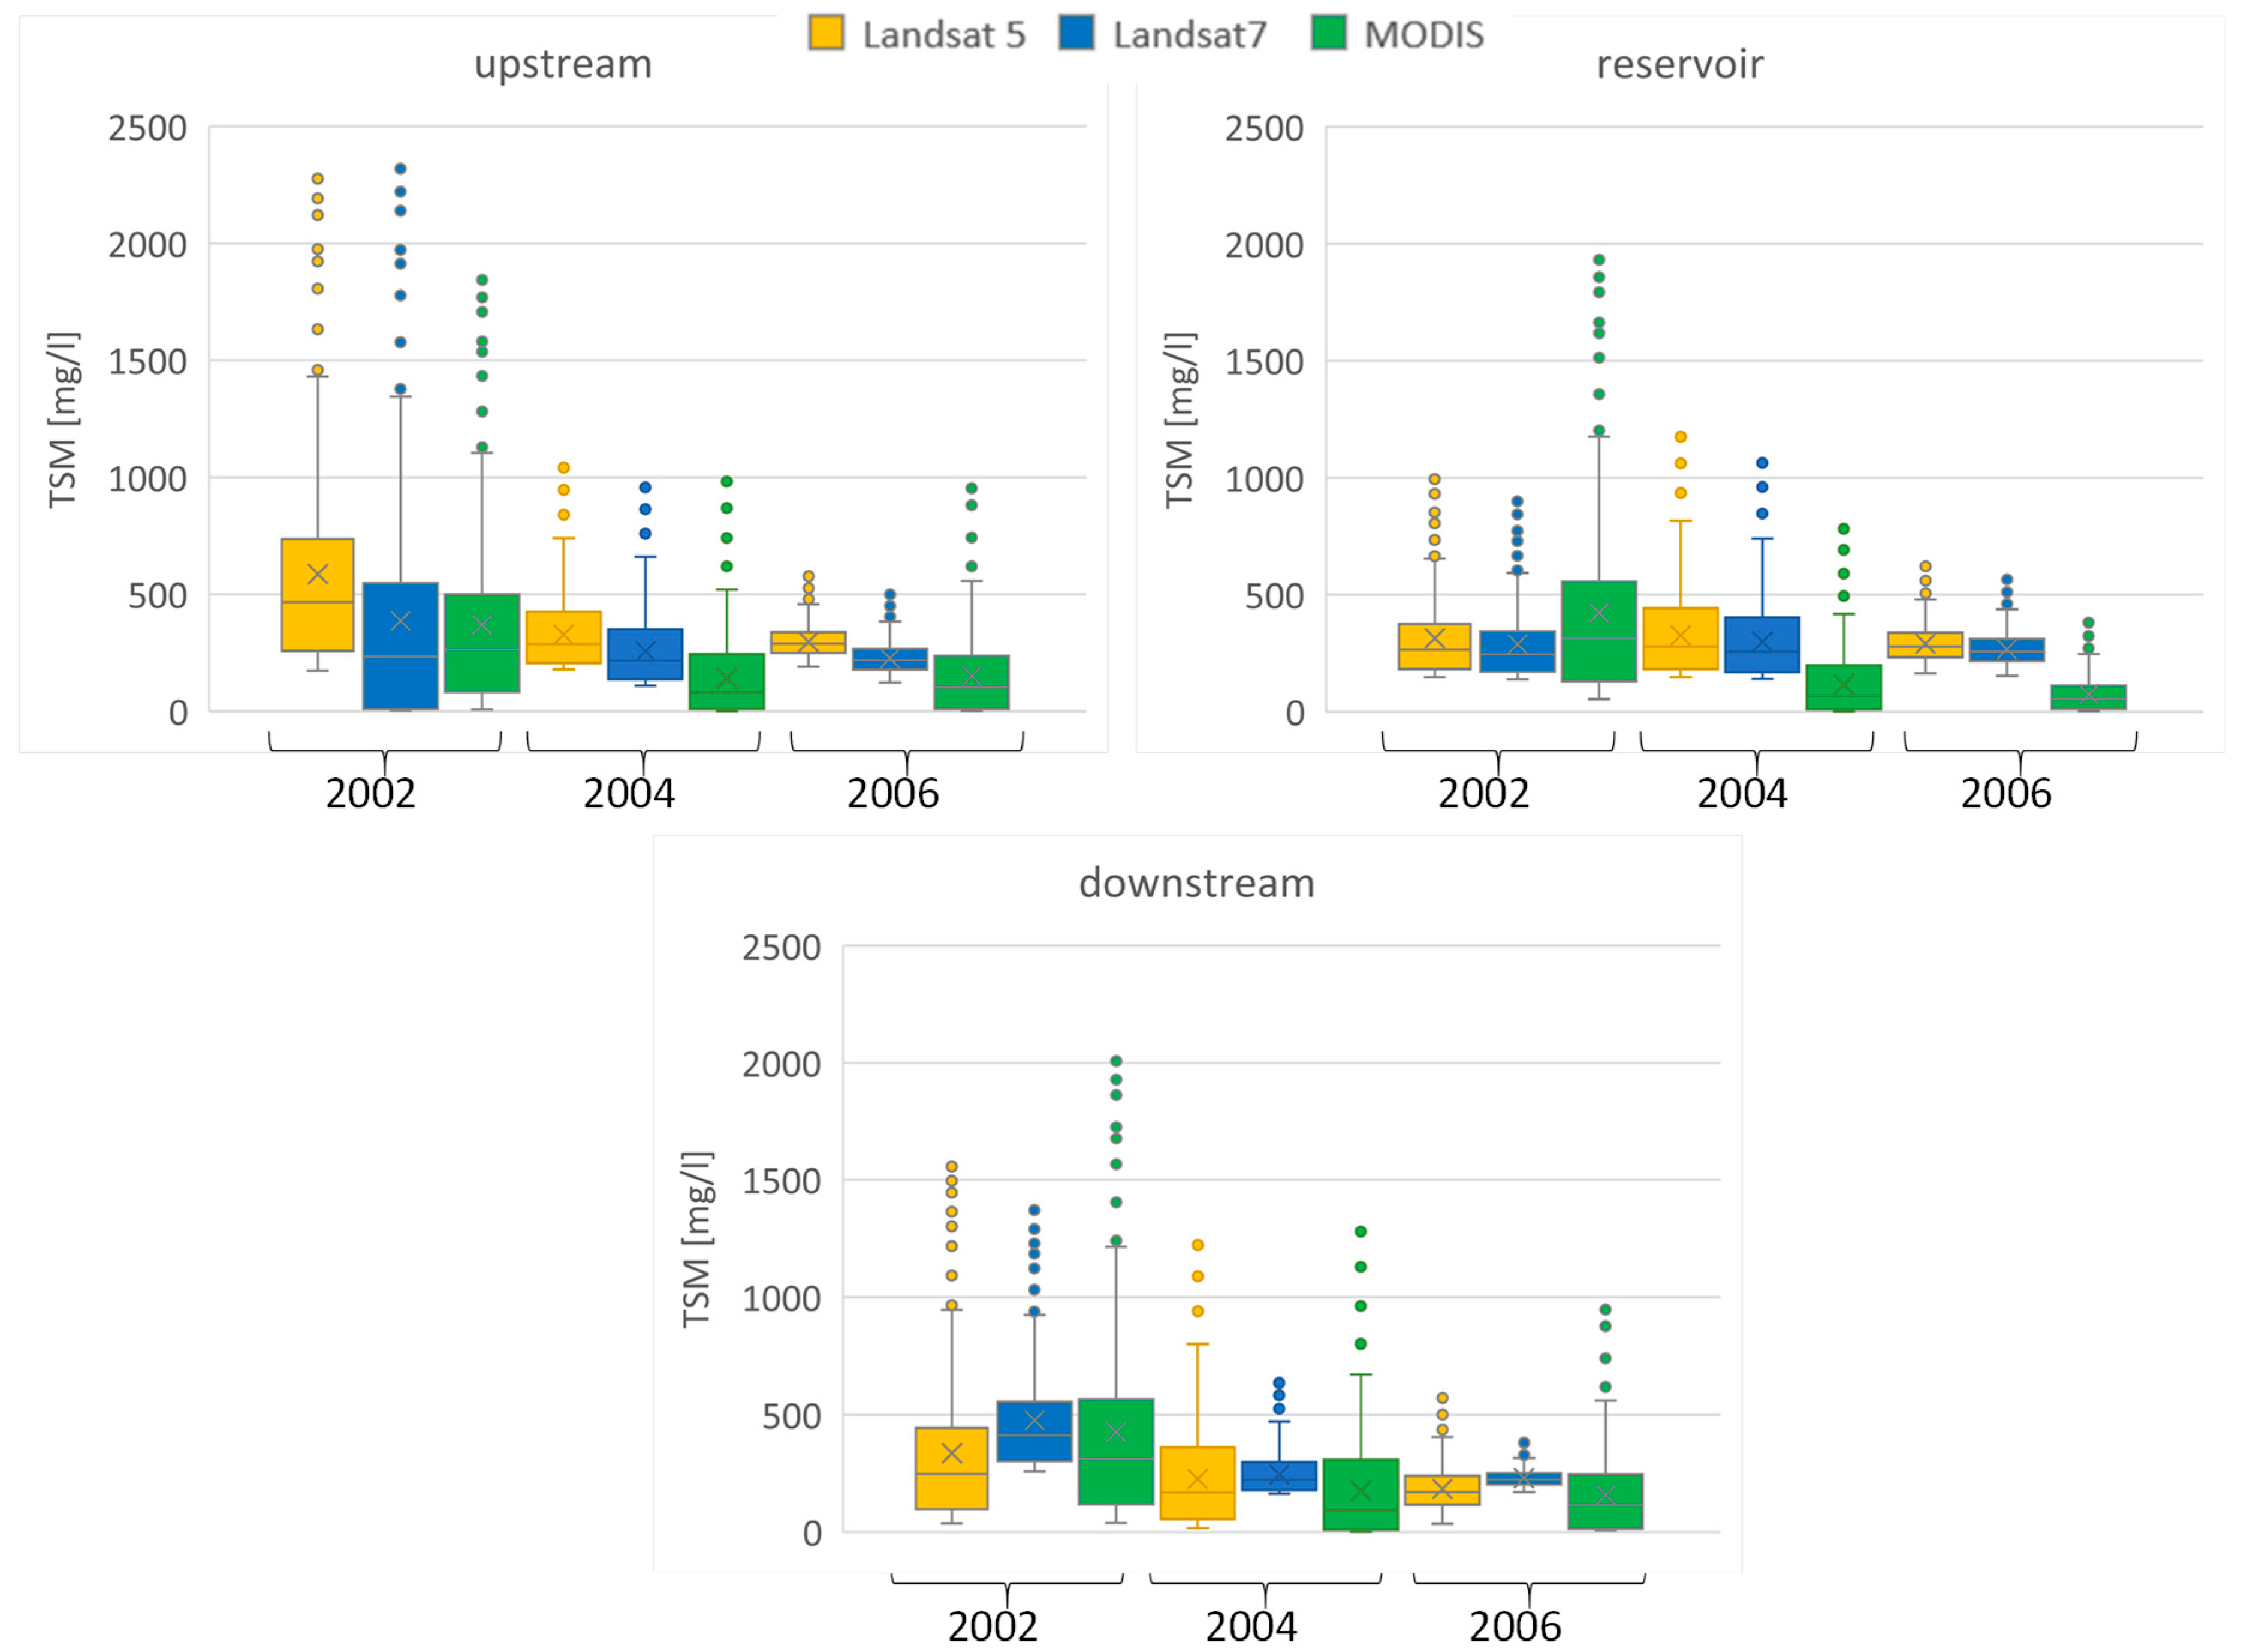
To better understand TSM variability in space and time, a Box-plot comparison of TSM estimates from the MODIS-Feng algorithm by [
12] and the Landsat 5 and 7 for the different years and areas of interest is shown in
Figure 8. In general, all estimates are able to trace the decrease in the TSM from 2002 to 2006 in the three sub-areas examined. The statistics also highlight the small number of Landsat data with respect to MODIS data, as well as a high number of outliers and the relative abundance of data for 2002 compared to other years. Mean upstream TSM values decrease ofabout 200 mg/L, while downstream values decrease of about100 mg/L. Interestingly, the lake sub-area presents the highest TSM value of in 2002, while during the years following the TGD operational activity the same area shows the lowest value. Similar statistical values (mean, median, max, and min) are of the same order of magnitude for the different satellites in the same year and same area of analysis.
For MODIS, the difference between the TSM mean values calculated over the three sub-areas varies even by 70 mg/L, showing the smallest TSM value in the lake sub-area. For Landsat data, similar results are obtained with differences of about 60 mg/L for Landsat 5 and of 40 mg/L for Landsat 7. For flood events with high liquid discharges (Q > 30,000 m3/s), the total suspended sediments are considerably more abundant than during the other periods and are similarly estimated by the different satellites. The TGD construction attenuated the TSM peaks from a maximum value of 1900 mg/L to 1000 mg/L.
Furthermore, to analyze the seasonal variability of TSM, seasonal mean TSM maps are obtained averaging the daily values of TSM for each season (e.g., winter from December to February; spring from March to May; summer from June to August, and autumn from September to November). Seasonally averaged values show that TSM typically ranges from 1 to 90 mg/L considering the different years and satellites (
Table 3).
TSM shows a cycle, being low during the first months of the year, increasing to maximum in spring and summer, and gradually decreasing during autumn. After the reaching of the dam’s operational status in 2003, the TSM distribution changed over the year, with low values classes standing out in a quasi-normal distribution during winter and spring, and the highest class cut out from the distributions compared to the pre-dam period. In fact, the effect of the Three Gorges Dam operational working is dramatically evident looking at the summer period, especially August, in 2004 and 2006, where the differences in TSM is striking in respect to summer 2002: 27 mg/L in 2004 and 60 mg/L in 2006.
During the whole of 2002, the total suspended sediment appears heavily influenced by the works in the dam’s construction site. In fact, the spring 2002 mean value of 11 mg/L shows how high TSM values are compared to the 2.5 mg/L obtained for spring 2004. TSM reaches its yearly maximum in the summer 2002, ranging between 60 and 90 mg/L depending on the satellite. This summer tendency is constant for all the three years examined, even with an important decrease in the mean values in 2004 and 2006, reaching 19 and 8 mg/L, respectively. This fact is of course due to the monsoonal discharge peaks, especially because 2004 is a flood year compared to the other ones investigated, during which higher TSM values should have been expected. In autumn 2002, TSM shows a spatial pattern comparable to the spring one, and also similar values are obtained in autumn 2004 and 2006. Interestingly, the area immediately downstream of the Three Gorges Dam is frequently characterized by TSM values higher than in the reservoir, allegedly because of the sediment re-suspended by the dam spillways and a consequence of the sedimentation induced by the dam [
13].
3.4. Comparison of Satellite Retrieved TSM with Literature Data
Literature values of monthly sediment discharge from [
8,
21,
22,
23,
24] are compared with the daily satellite continuous estimates obtained from the relationships in
Table 2. In
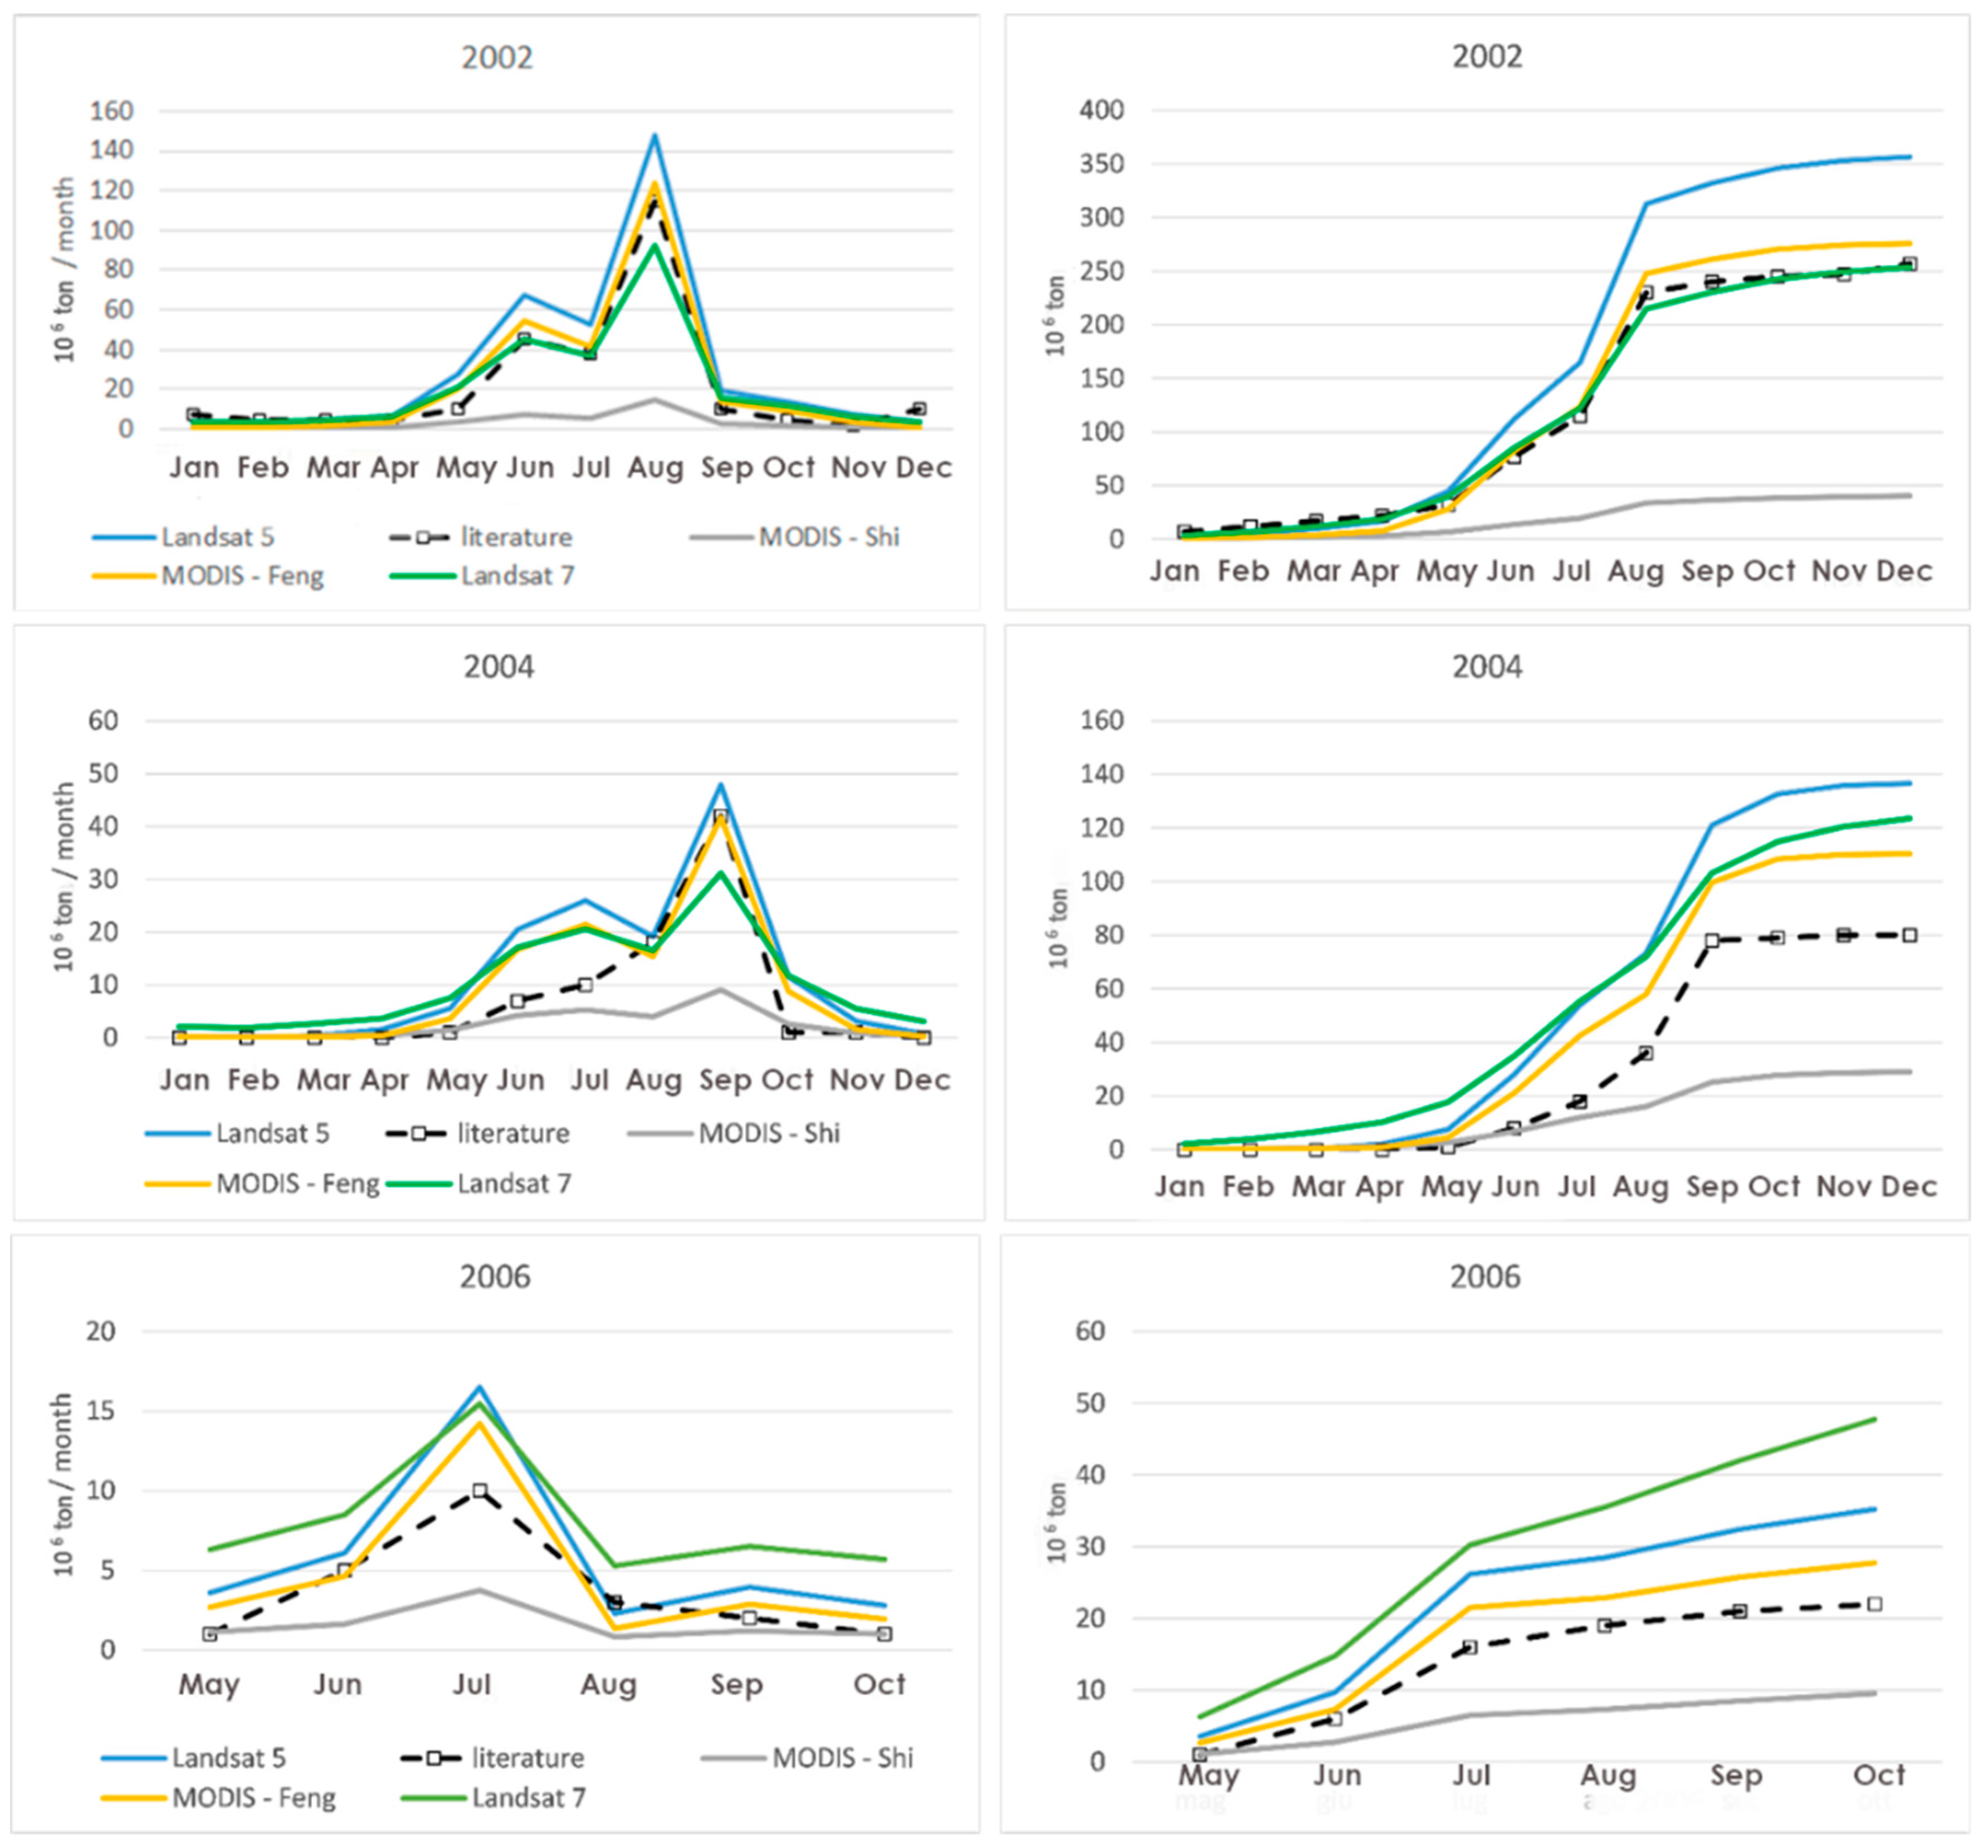
Figure 9, monthly sediment discharge values in millions of tons are reported at Yichang station for 2002, 2004, and 2006 for the three satellites.
Literature values confirm the diminishing of the sediment discharge in Yangtze river during the three years examined due to the Three Gorges Dam and also the variability during the year with higher values during summer than the other seasons.
Looking at MODIS results, in the first four months of 2002, TSM values generated by the MODIS-Shi algorithm are constantly lower than the real values, and the major difference is observed in summer, characterized by monsoons. In fact, the MODIS-Shi algorithm predicts values of 7, 6, and 14 Mtons/month for June, July and August while the corresponding literature values are 45, 38, and 115 Mtons/month, respectively. After the monsoonal peak the underestimation progressively decreases, until November and December when the values practically correspond to literature values.
The TSM values generated by the MODIS-Feng algorithm for the 2002 appear to be in a closer accordance to literature values compared to the ones generated by the MODIS-Shi algorithm, even if they are overestimated of an order of 10 Mtons/month during the monsoonal peak. During the first four months of 2004 both MODIS algorithms give values in good agreement with literature values, while in May and June they overestimate literature values: from July to September MODIS-Shi algorithm did not match the peak value of TSM, while the MODIS-Feng algorithm performs very good. In the following months the two algorithms slightly overestimate literature values. For the whole year the entity of the distance of TSM values from the MODIS algorithms from literature values decreases compared to 2002. In 2006 the measured discharge dataset covers only the period from May to October, thus the relations are applied only for the same period. In May and June both MODIS algorithms overestimate literature values: in July the peak value of TSM is underestimated by MODIS-Shi algorithm and overestimated by MODIS-Feng algorithm. TSM literature value in August is underestimated by both MODIS algorithms, in September it is underestimated by MODIS-Shi algorithm and overestimated by the MODIS-Feng algorithm. In October values from MODIS-Shi algorithm match literature values, while the MODIS-Feng algorithm overestimates it.
TSM estimations resulting from the application of the algorithm by Wang et al. [
13] are examined both for Landsat 5 and Landsat 7: just as for the MODIS results for the first months of 2002, there is no relevant difference between the results of the two satellites, and TSM values appear even closer to those in the literature than MODIS results. In May 2002, the significant increase in TSM values registered by literature—allegedly caused by the start of the Monsoon—is overestimated by both Landsat satellites, although Landsat 7 results show perfect accordance with the values from the MODIS dual-band algorithm. Following this fluctuation, Landsat 7 values fully match the literature values, both in June and July, while Landsat 5 constantly overestimates the values. The August peak reflects the same tendency to overestimation of Landsat 5, while it is underestimated by Landsat 7. In the last four months, both Landsat satellites converge on very similar values, but are still high compared to literature values.
During the first four months of 2004, both Landsat satellites overestimate the TSM values, giving values very similar each other: in June, July, and August, the Landsat 7 shows the very same overestimation rate of the MODIS-Feng results, but it underestimates the biggest peak recorded in September, which is, by contrast, precisely matched by the Landsat 5. The following drop in TSM values is overestimated by all the algorithms, with the Landsat values producing results resembling each other and a more contained overestimation by MODIS algorithms. In the reduced period of 2006, a constant and rather contained overestimation of the TSM values by the Landsat algorithms is noticeable, once again with very few differences between the two Landsat estimations. This overestimation is probably due to the few satellite images available for correlation purpose.
It is interesting to note that differences between literature values and retrieved values progressively diminish during the years. The statistical analysis shows (
Table 4) that the Landsat 7 retains the minimum volume error in percentage in 2002 and 2004 while, on the contrary, this parameter reaches the absolute maximum in 2006. The MODIS-Feng algorithm and the Landsat show generally comparable efficiency, although, in 2006, Landsat 5 efficiency drops to 0.1. With equal efficiencies, the most suitable result for 2002 and 2004 would be Landsat 7, while for 2006, the MODIS-Feng algorithm leads to fewer volume errors in percentage and lesser RMSE. The NSE results confirmed the best performances of the MODIS-Feng algorithm, and the medium-low efficiency of the MODIS-Shi algorithm.
A comparison between the cumulated solid discharge volumes calculated from literature and the ones calculated from the retrieved values of TSM shows the significant volume reduction during the three years, and the systematic underestimation of the MODIS-Shi algorithm. Looking at the cumulated values for all the three years, the good performance of the MODIS-Feng algorithm clearly emerges, but it is interesting to note how, for 2002, the best performance overall is given by Wang et al.’s [
13] algorithm applied to Landsat 7. More available satellite scenes would surely improve the results, predicting TSM mean values more accurately, and leading to better overall TSM estimations. In 2002 and 2004, the overestimation of the MODIS-Feng algorithm presents the same order of magnitude (about 50 Mtons). Comparing the slopes of the cumulative curves, it can be seen that 2006 is characterized by a very low slope, meaning that, beside the significant observed reduction in volume, the major volume input is also ceased, or at least delayed in time.
4. Discussion
In this paper, the effect of Three Gorges Dam along the Yangtze river network on suspended sediments has been analyzed using multi-satellite information at different spatial and temporal resolutions, which, thanks to the correlation to daily river discharges, allowed obtaining continuous daily estimations of TSM values, also covering the days for which satellite scenes are lacking, allowing us to compute the annual solid sediments volumes.
The obtained results are in line with the literature where the impact on the hydrological regimes of TGD construction, impoundment, and operation has been extensively studied [
8,
9,
10,
11,
12,
13,
14,
15,
16,
17,
18,
19,
20,
21,
22,
23,
24], altering the hydrodynamic conditions, increasing the sediments deposition, and thus reshaping the riverscape. In particular, Zhou et al. [
48], observed a significant reduction on the incoming sediment with the flushing ratio of sediment being only 24.2% from June 2003 to December 2015 suggesting that a large amount of sediment has been retained by TGD after water impoundment. Yang et al. [
19] and Guo et al. [
49] found that 65% of the sediment flux decline since 2003 can be attributed to the TGD and that this reduction notably accelerated since 2003. According to different authors [
16,
17,
19] the highest values of TSM are located upstream of the dam, while, in the Three Gorges Reservoir, TSM appears constantly lower than in the rest of the river. Xu and Milliman [
8] found that during 2003–2006, the decreased water discharge led to a drop of 110 Mt in sediment discharge upstream of the TGD. Before TGD impoundment, sediment discharge at the two stations of Qingxichang and Yichang (just upstream and downstream of TGD), was similar, while, after 2003, a sensible decrease has been observed at Yichang station. Downstream of the TGD prior to 2000, sediment transport was only dependent on climatological seasonal variation, with high peaks during the Monsoon season; while, after 2003, a sensible decrease is observable. Similar results are obtained in the present paper (
Figure 8), even though a possible point of uncertainty may be related to the selection of the upstream basin, which in this paper has been defined from the Badong city to the TGD reservoir. Generally, TSM concentrations follow a decreasing gradient from Badong to the dam, with a local maximum in the river stretch after Badong due to the sediment input of the Xiangxi river, increasing after the dam due to the resuspension caused by the hydropower activity. However, this area may also be affected by the backwater effect of the reservoir: the flow velocity at Badong is thus reduced since the reservoir was created, causing sedimentation upstream of Badong. Sedimentation in TGD reservoirs has been studied by different methods showing quite different values among each other [
8,
19,
22,
50], mainly due to the different stations used as the upstream limit of the reservoir and the influence of the sediment from the ungauged areas.
A source of uncertainty in the applied methodology is the underlying assumption that the total sediment load in the Yangtze river is represented by 99% of the suspended sediments, while the riverbed load is less than 1% of the suspended load [
19]. This allowed us to estimate the total annual sediment volumes using only remote sensing data, obtaining good agreements with ground observed data (RMSE in between 2 to 14 mg/L). These estimates are based on the robustness of the linear relations between solid transport and TSM (in some cases weakened just by the lack of data), which were used as a proxy to obtain daily TSM values with no dependence from cloud cover. This different accuracy of the relationship between the reflectances of different satellites and discharge data may be mainly due to the number of available images each year (e.g., satellite temporal resolution).
Another factor, influencing the TSM variability during the seasons of the year, may be the local meteorological conditions, especially wind and precipitation, which are negatively and positively correlated with TSM, respectively [
51]. Precipitation was, on average, 3% lower after TGD function than before, but the decreased precipitation can explain only 14% of the post-TGD decreased sediment flux relative to 1993–2002 [
19].
The advantage of using satellite information for TSM retrieval is given by its spatial and temporal sampling, while several uncertainties should be considered, ranging from TSM algorithm retrieval, land/water mask separation, clouds, and atmospheric correction [
39]. Discriminating between water and land for inland waters is still an open issue [
51]. This is usually based on automatic classifications of combination of bands or vegetation indices (like NDVI and/or NDWI) that lead to large uncertainties, mainly due to the frequent changes in water level of river, and thus to its width. Thus, the procedure developed in this paper allows us to overcome this problem, taking advantage of very high-resolution data.
The main uncertainty of satellite data is that they do not provide direct measurements of the physical variables. Generally, site-specific empirical relationships between TSM and reflectance (in one or two bands) are used, depending on water characteristics (e.g., suspended solids, chlorophyll, and yellow substance) [
40]. The RED region (645 nm) is the best correlated with TSM, while in very turbid waters (exceeding 50 mg/m
3) the NIR bands (689 nm) is higher correlated [
3,
52], also with a lesser influence from chlorophyll and colored dissolved organic matter [
53]. In addition to single bands, reflectance ratios between the NIR and visible bands are also well correlated to TSM [
27], also allowing us to reduce the effect of sky light reflection and the influence of particle grain-size, especially for highly turbid waters [
54]. The present study found similar results for MODIS data, where the dual-bands algorithm by Feng [
12] is able to reproduce the discharge dynamic while, on the contrary, the single band Shi algorithm [
11] does not have the same ability due to some problems of saturation for MODIS reflectances corresponding to 50 mg/L and beyond [
13,
40]. TSM from Landsat 5 and 7, whose algorithm is based on NIR data, are both able to follow the discharge dynamic. Due to their high variability and uncertainty between the remotely sensed reflectance and the sediment concentration, these retrieval algorithms are usually site-specific and need to be calibrated against ground data [
31,
32,
34,
38,
40,
41]. Additionally, the various nature of sediment (i.e., the very fine sediment coming from the Loess plateau, sometimes mixed with coarser sediments detached by runoff of the heavy rains) could create variability in the relation discharge-reflectance.
Atmospheric correction of satellite data is another source of uncertainty that can impact the TSM retrieval, especially in an area, like the middle Yangtze river, characterized by several days of partial cloud cover [
35,
47]. Indeed, the uncertainties induced by the atmospheric correction are implicitly compensated by the empirical regression coefficients in
Table 2.
Satellite temporal and spatial resolutions are another point of discussion that could impact the variability and robustness of TSM estimates. MODIS data have been selected thanks to their very high temporal resolution (twice a day during daytime hours considering Aqua and Terra satellites), a characteristic of paramount importance due to the frequency of cloud cover in the area. This aspect is of extreme importance for the correlation with liquid discharge and the estimates of total sediment volumes. In the analyzed area, the Yangtze river upstream and downstream the Three Gorges Dam has a mean width of 700 m, ranging from 500 to 1500 m: this guarantees at least two pixels of width in the maps. Of course, Landsat 5 and 7 data with their higher spatial resolution allow us to have a better spatial representation but the low temporal frequency degrades the quality of correlations with discharge, especially if during floods events no images are available.
Horowitz [
54] found that at least 20 TSM data covering a broad range of values are required to build a reliable correlation between TSM and river discharge. The present study demonstrates that about 25 clear sky MODIS images allow to derive a robust correlation with river discharge, which is weaker with the about 10 images of Landsat 5 and 7. Nonetheless, the value of 10% is a reasonable estimate of the upper limit of the differences in TSS to be expected simply due to differences between sensor algorithms. The difference between MODIS and Landsat spatial resolutions is clearly visible from the results on the ability in identifying and mapping the fine features near the river banks and the dam itself, and also the differences inside the sediment plumes (
Figure 5). The choice of using different spatial and temporal resolutions sensors should be weighted on the cost and benefits of a more defined and detailed TSM distribution versus more robust correlation with discharge data.


