Article

Empirical Analysis and Countermeasures of the Irrigation Efficiency Paradox in the Shenwu Irrigation Area, China

1
Institute of Management Science, Hohai University, Nanjing 210098, China
2
Business School, Nanjing Normal University, Qixia District, Nanjing 210023, China
3
School of Management, Jiangsu University, Zhenjiang 212013, China
4
College of Management and Economics, Tianjin University, Tianjin 300072, China
*
Author to whom correspondence should be addressed.
Water 2020, 12(11), 3142; https://doi.org/10.3390/w12113142
Submission received: 7 October 2020 / Revised: 3 November 2020 / Accepted: 5 November 2020 / Published: 10 November 2020
(This article belongs to the Special Issue Machine Learning for Hydro-Systems)

Abstract

:
Water-saving in agriculture is critical for building a water-conserving society. However, the application of high-efficiency water-saving technology in agriculture may create a paradox of irrigation efficiency. Efficiency improvement in agricultural water utilization may not lead to the expected agricultural water-saving. In this paper, a rebound intensity model of the irrigation efficiency paradox is established and combined with remote sensing measurement to verify the irrigation efficiency paradox caused by expanding the irrigation area in the Shenwu Irrigation Area, China. Based on ideas in the principal–agent theory and stakeholder theory, it is concluded that the essence of the irrigation efficiency paradox is the conflict of interests among stakeholders with asymmetric information due to inadequate regulatory capacity. A dual principal–agent model is formulated to optimize the conflict among heterogeneous stakeholders in the paradox. The results show that the paradox should be restrained by a suitable distribution mechanism of water-saving gains, improved irrigation water metering, and enhanced water-use monitoring.

1. Introduction

Water is an essential natural resource and strategic economic resource to the national economy and people’s livelihood [1]. UN World Water Development Report 2017 [2] revealed that two-thirds of the world’s population live in drylands with varying water shortage degrees. UN World Water Development Report 2020 [3] further pointed out that water security and climate change will be a sustained and profound crisis facing the world in the coming decades. In 2014, the FAO (Food and Agriculture Organization of the United Nations) [4] indicated that water shortage is becoming increasingly severe with global population growth and economic development. Meanwhile, the risks of food, energy, and ecology are also intensified. Systematic recognition of the comprehensive utilization of water resources has attracted widespread attention in academia. In 2018, Grafton et al. [5] wrote an article in Science, which revealed that irrigation efficiency improvement did not increase the total amount of available water resources at the basin scale, and the traditional high-efficiency use of water resources may trigger an irrigation efficiency paradox. The irrigation efficiency paradox is even more deadly for arid areas where water resources and ecosystems are fragile, accounting for 41% of the global land area. Simultaneously, the scarcity of water resources will create a vicious circle of competition between humans and ecology, making it more challenging to achieve sustainable development goals for 38% of the world’s population in arid areas [6,7].
Meanwhile, climate change has an important impact on arid areas. In 2016, Huang [8] pointed out in Nature Climate Change that global arid and semi-arid areas will expand along with accelerated greenhouse gas emissions and account for more than 50% of the global land surface by the end of the 21st century. Among the expansion, three-quarters will occur in developing countries. The induced risks on land, ecology, and society will significantly reduce the sustainable development capacity in these areas. Therefore, it is of great theoretical and practical value to systematically understand water resource utilization, comprehensively improve the governance capacity, and effectively solve the paradox of irrigation efficiency for sustainable development in arid areas.
The paradox of irrigation efficiency refers to a phenomenon that new water use offsets the water-saving effect produced by improving irrigation efficiency. This phenomenon is a hot topic in water resource management, and there have been some research outcomes on this issue. In 2008, Ward and Pulido-Velazquez [9] investigated the impact of the Upper Rio Grande Basin of North America’s water-saving policies on irrigation water and water-saving effects and found that policies aimed at reducing water use can increase water consumption. In 2013, Pfeiffer and Cynthia [10] evaluated a drip irrigation system’s effect in western Kansas, USA. It was found that the transition to efficient irrigation technology resulted in changes in crop patterns, which, in turn, increased the extraction of groundwater. In 2014, Scott et al. [11] analyzed and compared the paradox of irrigation efficiency in three different regions—central Chile, southwestern U.S., and south-central Spain. In the absence of a firm policy to limit irrigation area expansion, efficiency improvement will aggravate the shortage and worsen water resource quality. In 2015, García et al. [12] analyzed five irrigation districts in Andalusia, southern Spain. Moreover, they found that irrigation technology improvements have transformed farmers’ planting patterns to cash crops that consume more water. In 2017, Perry et al. [13] summarized the paradox of irrigation efficiency in the Near East and North Africa. It was pointed out that only relying on high-efficiency water-saving technology cannot reduce agricultural irrigation water consumption, but measures such as limiting water distribution should be taken to ensure sustainable water utilization. In 2018, Grafton et al. [5] wrote an article in Science, pointing out that improved irrigation efficiency often led to farmers planting water-consuming crops and expanding irrigation areas. However, it may not necessarily increase the total amount of available water resources at the basin scale. Koech and Langat [14] also pointed out that water savings are being reused to expand irrigation area, resulting in a net increase in the total water consumption at the basin scale. Sear et al. [15] discussed the Jevons’ paradox caused by the application of efficient irrigation technology.
Previous studies have shown that the rebound effect of irrigation water can effectively represent the degree of the paradox of irrigation efficiency. In 2012, the FAO and European Union warned about the paradox of irrigation efficiency caused by irrigation water’s rebound effect [16,17]. In 2015, Berbel et al. [18] summarized the theoretical basis of the rebound effect of irrigation water and investigated methods to avoid the rebound effect using cases in Spain. Loch and Adamson [19] evaluated the rebound effect of the current water-efficiency-centric policy in Australia’s Murray–Darling Basin. The policy’s incentive to encourage water-use efficiency paradoxically reduces environmental flow volumes on average. In 2018, Li [20] emphasized water rights’ role in restraining irrigation water’s rebound effect. Song et al. [21] analyzed and measured the rebound effect of water-use in China’s agricultural sector and pointed out that having caps on water consumption is an effective means to control the rebound effect. Existing research on the rebound effect of irrigation water mainly focuses on the quantitative evaluation of the paradox of irrigation efficiency. However, there is little research on the formation mechanism and driving mechanism of the paradox.
The principal–agent theory is a classical method to analyze the interactions among multiple stakeholders. In 2009, Zhu and Ma [22] analyzed the multiple-agency relationships among small shareholders, large shareholders, and a board of directors and studied the conduction effect of large shareholders’ plundering in the relationship between corporate governance and corporate value. In 2013, Li and Huang [23] investigated a pollution supervision mechanism under a centralized governance model and established a multi-principle–agent pollution supervision game model. In 2014, Green [24] used a multiple principal–agent theory to analyze an incentive system in the medical industry and put forward improvement suggestions. In 2017, Zhao et al. [25] established a chain-like multiple principal–agent structure based on the Holmstrom–Milgrom model and reconstructed a chain-like dual principal–agent model considering procedural fairness preferences. It can be seen that the multiple principal–agent theory has been extensively applied to various fields, such as corporate governance, the medical industry, and pollution supervision, but its application in irrigation water-saving is still relatively scarce.
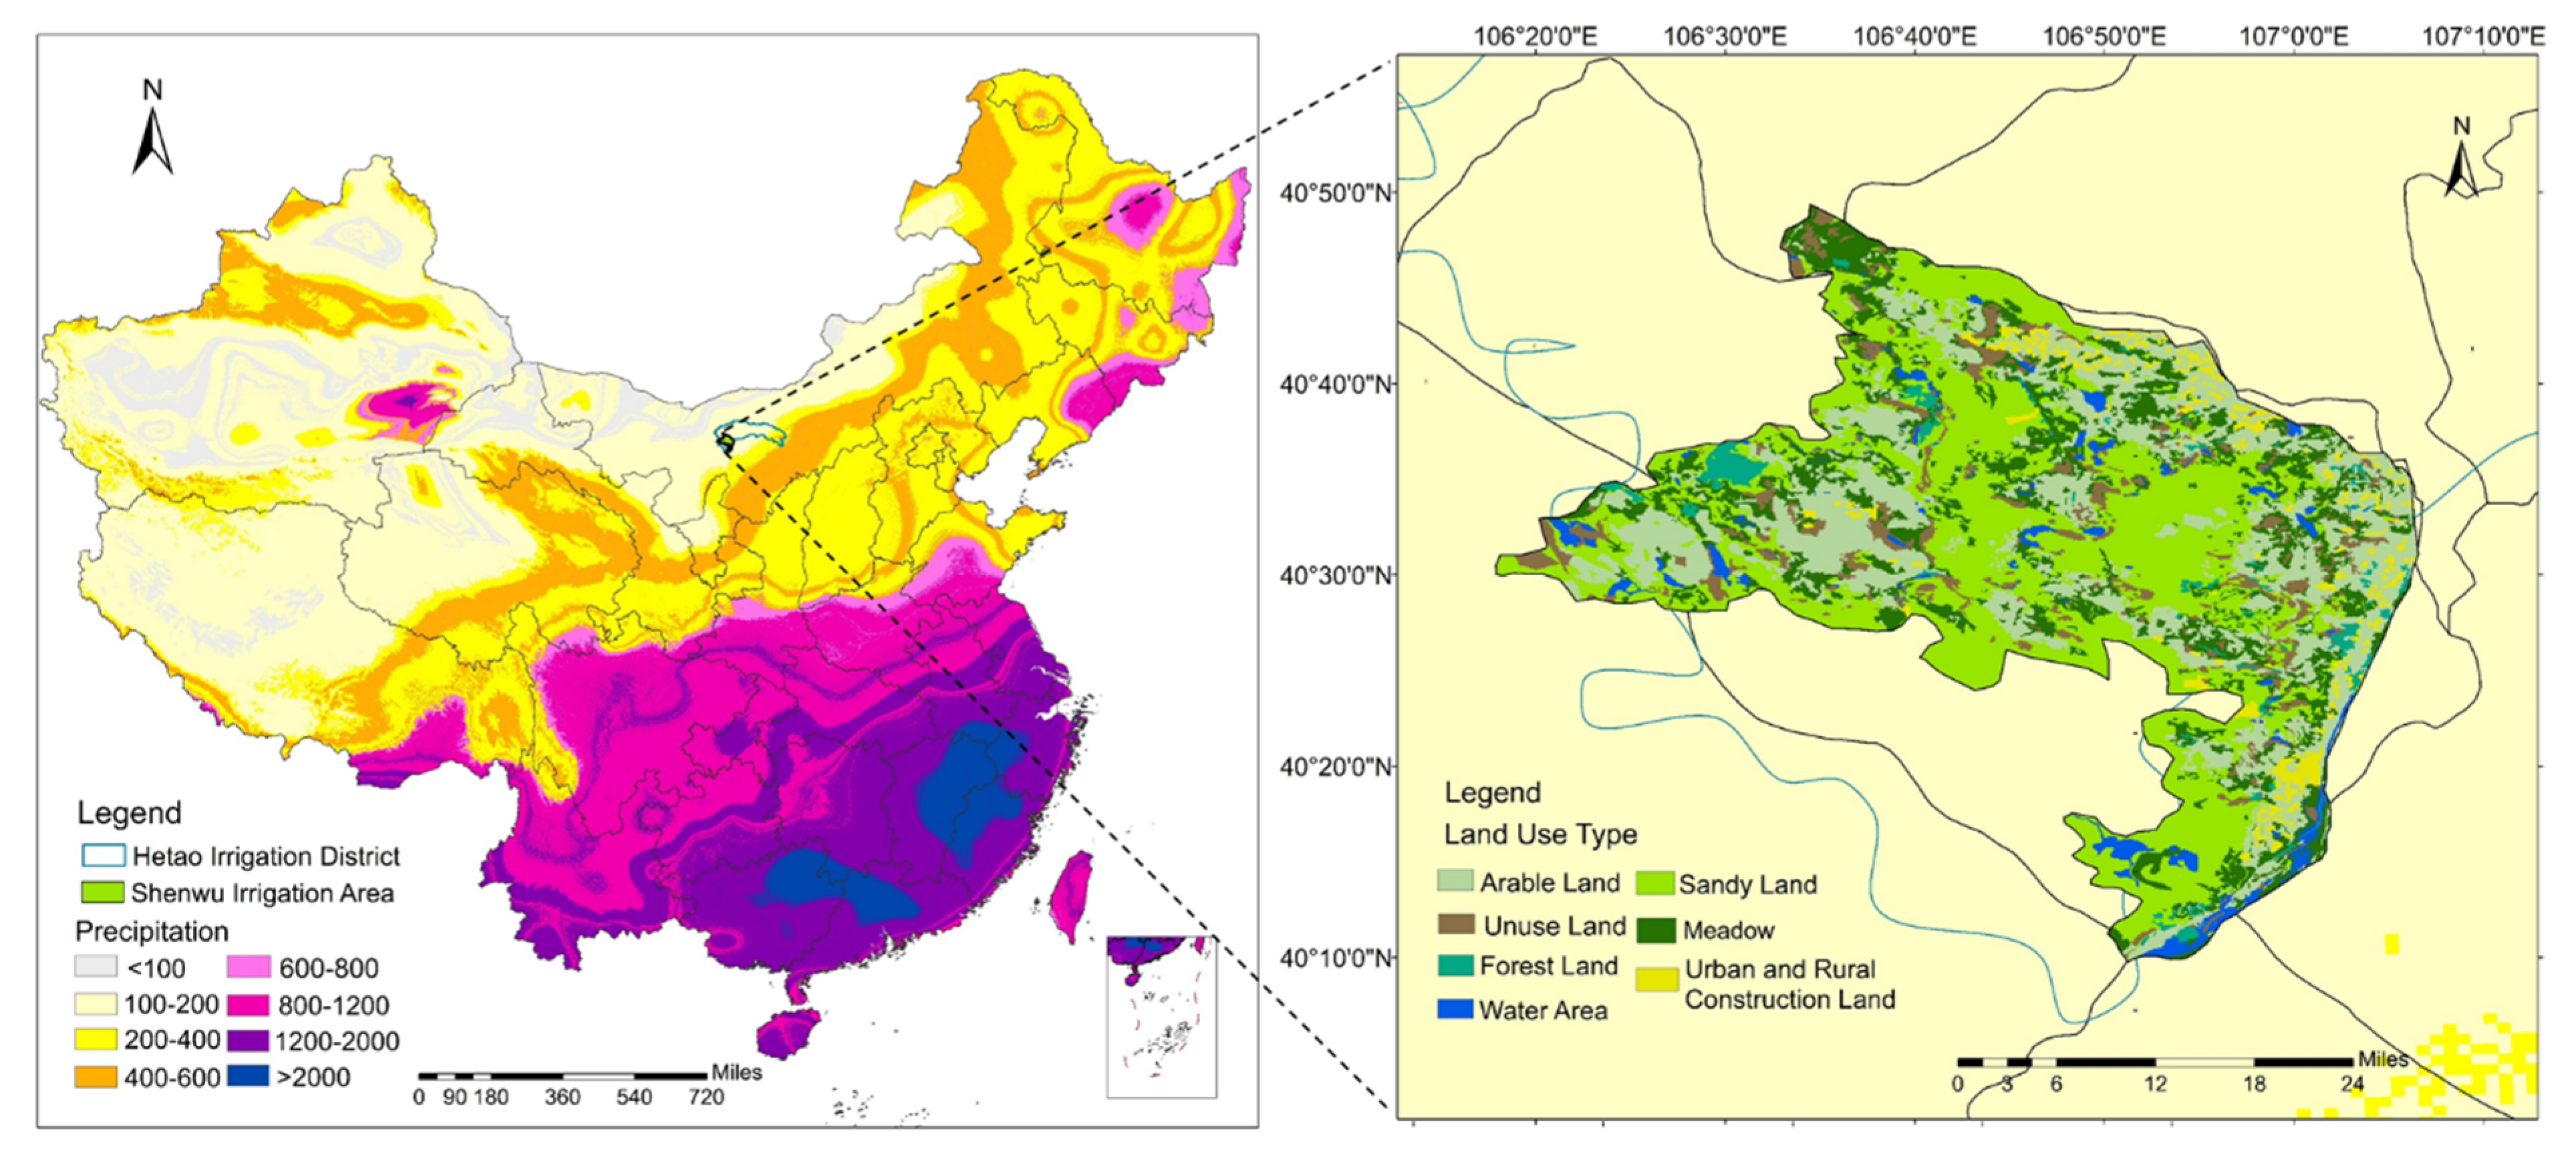
In summary, the paradox of irrigation efficiency is a problematic issue that restricts efficient water use in arid areas and would endanger regional ecological security. Quantitatively characterizing the interactions among heterogeneous stakeholders in this phenomenon is the key to revealing the formation and driving mechanism of the irrigation efficiency paradox. Therefore, a rebound intensity model is constructed in this paper to quantitatively evaluate the degree of irrigation efficiency paradox in the Shenwu Irrigation Area in the Hetao Irrigation District of the Inner Mongolia Autonomous Region, northwest China. The focus is information asymmetry among heterogeneous stakeholders in irrigation water-saving management, and the theory of quasi-public goods is introduced to interpret the complex attributes of irrigation water-saving resources in arid areas. On this basis, a dual principal–agent model is established to deal with the interactions among heterogeneous stakeholders in the paradox. The formation mechanism and driving mechanism of the paradox with asymmetric information are analyzed. An incentive mechanism of irrigation water-saving is designed to meet incentive compatibility constraints. Furthermore, adaptive management countermeasures are put forward to coordinate the conflicts among heterogeneous stakeholders, reduce the degree of irrigation efficiency paradox, and ensure water security and sustainable development in arid areas.

2. An Empirical Analysis of Irrigation Efficiency Paradox in the Shenwu Irrigation Area Based on a Rebound Intensity Model

2.1. Background Information

The Hetao Irrigation District, located in the arid area of northwest China, was originated in the Han Dynasty more than 2200 years ago. It is the largest artesian water diversion irrigation district in Asia and the only large-scale irrigation district located in arid and semi-arid areas in China [26]. In 2019, it was listed as one of the World Heritage Irrigation Structures [27]. As the largest irrigation district which diverts water from the Yellow River in China, the Hetao Irrigation District possesses seven levels of gravity irrigation and drainage supporting systems. The annual diverted water from the Yellow River is about 4.8 billion m3 (consisting of 4.35 billion m3 for agriculture and 450 million m3 for ecology), 400 million m3 of which would return to the Yellow River. The Hetao Irrigation District’s total area is 1.19 million hectares, among which more than 0.667 million hectares are irrigated with water from the Yellow River and annually produce 3 million tons of grain.
For many years, the shortage of funds has always restricted the up-gradation of water-saving projects in the Hetao Irrigation District. It was not until the establishment of water rights trading operations in recent years that substantial funds were raised for the water-saving renovation project in the Hetao Irrigation District. From 1998 to 2015, the Hetao Irrigation District’s water-saving renovation project received a total government investment of CNY 2.71 billion (equivalent to USD 405 million), among which CNY 2.05 billion (USD 306 million) are from the state. From 2000 to 2016, over CNY 6 billion (USD 897 million) were raised for water-saving renovation projects through water rights transactions. A total amount of CNY 1.865 billion (USD 279 million) was invested in the water-saving renovation project of water rights trading pilot in the Shenwu Irrigation Area of the Hetao Irrigation District in 2014–2017. It effectively fills in the funding gap for water-saving projects in the Hetao Irrigation District and helps improve the irrigation efficiency in the district.
The Shenwu Irrigation Area is located at the western border of the Hetao Irrigation District in the arid area of northwest China and adjacent to the Ulan Buhe Desert, as shown in Figure 1. The total irrigated area of the Shenwu Irrigation Area is 58,113 hectares [28], among which about 80% of the arable land is sandy. The average annual precipitation in this area is less than 250 mm, while the average annual evaporation remains above 2000 mm. Through field investigation, it was found that there is no land purchase cost for the Rural Water Cooperation Organization to expand farmland towards the Ulan Buhe Desert. Simultaneously, water scarcity is the biggest bottleneck for agricultural production and ecological protection in this region. The average annual irrigation water volume of the Shenwu Irrigation Area is 560 million m3, of which 96% is diverted from the Yellow River. For many years, agriculture has always been the dominant industry in the Shenwu Irrigation Area, with a relatively slow regional economic and social development level. Table 1 presents a comparison of the leading economic and social indicators of the Shenwu Irrigation Area in 2017 with China’s per capita level and the world per capita level in the same period.
It can be seen from Table 1 that in 2017, the per capita arable land of the Shenwu Irrigated Area was 5.4 times the average per capita in China and three times the average per capita of the world. However, the per capita water resources in the Shenwu Irrigation Area were only 11.3% of China’s per capita level and 3.95% of the world’s per capita level. Overall, there is more land and less water, and the dominant agriculture leads to a result that the per capita grain yield of the Shenwu Irrigation Area is far higher than the world average. However, more grain outputs do not result in a higher per capita income level. In 2017, the per capita GDP of the Shenwu Irrigation Area was only 64.43% of China’s per capita level and 53.08% of the world’s per capita level.
The left side of Figure 1 shows the spatial distribution of annual precipitation in China. The lighter the color, the less the precipitation. The specific location map of the Shenwu Irrigation Area and the land use type in 2015 are depicted on the right of the figure. It can be seen from Figure 1 that, on the one hand, the annual precipitation in the Shenwu Irrigation Area is less than 200 mm, which makes it a typical arid area. On the other hand, the periphery of the Shenwu Irrigation Area is the Ulan Buhe desert, which means there is no land cost to transform the desert into agricultural land. It also provides opportunities for expanding the irrigation area by the Rural Water Cooperation Organization in the Shenwu Irrigation Area.
Through a field investigation of the Water Rights Transaction Pilot Project in the Shenwu Irrigation Area, it was found that with the improvement of irrigation efficiency in the Hetao Irrigation District, the expected decrease in total water consumption has not been observed. The irrigation efficiency paradox has appeared [5,11], which implies that the water-saving effect is partially or entirely offset by new water use. An expansion of irrigation area by the Rural Water Cooperation Organization is the main reason for the paradox. This phenomenon coincides with the paradox of irrigation efficiency in other regions of the world, revealed by Grafton et al. [5]. However, the formation mechanism and driving mechanism of the paradox in the Hetao Irrigation District are different from the findings of Grafton et al. Our investigation reveals that the fundamental cause of the paradox is the conflict of interests among heterogeneous stakeholders with asymmetric information. The paradox of irrigation efficiency caused by subsidies is just a typical policy impact under this conflict. At the same time, since the Hetao Irrigation District is located in the arid area of northwest China, where its ecology is exceptionally fragile, the paradox of irrigation efficiency will not only endanger the water security of the Yellow River Basin but also directly affect the ecological security in northwest China.

2.2. A Rebound Intensity Model of the Irrigation Efficiency Paradox

Through field investigations, it was found that new irrigation water demand in the Shenwu Irrigation Area was mainly due to sand control and an expansion of arable land. There was no significant change in crop patterns with and without water saving. It is somewhat different from the mechanism of the paradox proposed by Grafton et al. This regional feature is mainly due to the expansion of the Shenwu Irrigation Area into the Ulan Buhe Desert. The land-use costs are minimal, while the region’s annual evaporation of up to 2000 mm also limits its crop selection.
Therefore, according to the fundamental factors that lead to the paradox of irrigation efficiency in the Shenwu Irrigation Area, a rebound intensity index RE is constructed in this paper to measure the paradox of irrigation efficiency. The index is the difference between the planned water-saving amount and the actual water-saving amount (additional irrigation water generated from expanding irrigation area) as a percentage of the planned water-saving amount of a water-saving project. RE represents the offsetting effect of expanding irrigation areas on the planned water-saving of projects. Therefore, a rebound intensity model of the irrigation efficiency paradox is formulated as follows.
R E = W e Q W e = i Δ F i × W i W e ,
where R E is the rebound intensity index of the irrigation efficiency paradox; W e is the planned water-saving amount of a water-saving project; Q is the actual water-saving amount; ( W e Q ) is the newly added irrigation water caused by the expansion of irrigation area; Δ F i is the newly added irrigation area; W i is the water demand per unit irrigation area. Since it is impossible to obtain the actual water-use data of the expansion area, W i is calculated by dividing the irrigation water demand of the Shenwu Irrigation Area by the planting area of crops. The crop water requirement is calculated using the CROPWAT model [34,35] recommended by the FAO. The irrigation water requirement is mainly calculated based on the crop coefficient during the growth period. The specific calculation formula is shown as follows:
W i = i = 1 n [ ( E T c P e η ) A i ] A t = i = 1 n [ ( K c i E T 0 i P e η ) A i ] A t ,
where E T c is the crop water requirement (mm) [36], K c i is the crop coefficient, and E T 0 i is the crop evapotranspiration, which is calculated by using the standard Penman–Monteith formula [37] recommended by the FAO; P e is the effective precipitation during the growth period of the crop; η is the utilization coefficient of irrigation water; A i is the planting area of the type-i crop; A t is the total planting area of crops in the irrigation area.

2.3. Data Sources

The data in this article mainly come from two reports from the China Meteorological Data Network (http://data.cma.cn), namely “Inner Mongolia self-evaluation report of water right pilot project” [38], and “Monitoring and evaluation report of water right pilot project in the Shenwu Irrigation Area” [28]. Among them, parameter K c i comes from the FAO-56 crop coefficient table; parameters E T 0 i and P e are derived from the China Meteorological Data Network; parameters η , A i , and A t come from “Monitoring and evaluation report of water right pilot project in the Shenwu Irrigation Area”; parameter W e comes from “Inner Mongolia self-evaluation report of water right pilot project”. The estimated W e is 234.89 million m3, mainly from the water-saving project of water rights trading, consisting of three parts [39,40]: channel lining, border field reconstruction, and upgrade from border irrigation to sprinkler irrigation and drip irrigation.

2.4. Model Measurement and Remote Sensing Measurement of the Irrigation Efficiency Paradox

2.4.1. Measurement Results of the Rebound Intensity Model

The paradox of irrigation efficiency in the Shenwu Irrigation Area mainly comes from sand control and the expansion of arable land. The rebound intensity depends on water demand per unit irrigation area W i , newly added irrigation area Δ F i , and expected water-saving W e . According to calculations, from 2010 to 2015, the water demand per unit irrigation area of the Shenwu Irrigation Area falls into a range of [16,240,21,322] m3/ha, with an annual average of 19,366 m3/ha in five years. For detailed information, please refer to Appendix A, Appendix B and Appendix C. According to Equation (1), the rebound intensity of irrigation water in the Shenwu Irrigation Area between 2010 and 2015 was 32%. It implies that the irrigation water-saving project in the Shenwu Irrigation Area only achieved 68% of the expected agricultural water-saving amount, which results in a paradox of irrigation efficiency.

2.4.2. Remote Sensing Measurement of Newly Added Irrigation Area

Existing information indicates that local water users in the Shenwu Irrigation Area have developed a mature and feasible desert control plan [41]. Specifically, a grass grid is firstly constructed at the front of the desert, and then a wind-proof sand forest and grass belt is configured through a strip net. In this way, sandy land can be gradually transformed into a mixed forest and meadow, and then drought-resistant crops can be selectively farmed on the land. It should be noted that water is needed in the formation of a meadow, forest, and arable land, which means that water use has to be increased in desert control. Therefore, the newly added irrigation area defined in this article consists of two aspects: one is the newly added arable land area and the other is forest and meadowland transformed from sandy land. The water supply of these newly added irrigation areas is mainly the conserved water of irrigation water-saving projects.
In this paper, a comparison of land-use-type geographic data of the Shenwu Irrigation Area between 2010 and 2015 is conducted based at a scale of 100 m × 100 m to reveal the responsibility of the newly added irrigation area in the paradox of irrigation efficiency in the Shenwu Irrigation Area.
As shown in Figure 2, there were significant changes in terms of new irrigation areas in the Shenwu Irrigation Area between 2010 and 2015 (Resource and Environment Data Cloud Platform, http://www.resdc.cn/). According to ArcGIS geostatic calculations, the amount of newly added irrigation area in the Shenwu Irrigation Area between 2010 and 2015 is 3852 ha. Among this, 260 ha is newly added arable land and 3592 ha is forest and meadowland transformed from sandy land. The newly added irrigation area accounted for 7.3% of the total irrigation area. Assuming that the water demand per unit area of the newly added irrigation area is at the same level as existing land, water demand increase due to new irrigation areas accounts for 24% of the total irrigation water demand. The remote sensing data show that the newly added irrigation area is the direct cause of the irrigation efficiency paradox in the Shenwu Irrigation Area.

3. Countermeasures of the Paradox of Irrigation Efficiency in the Shenwu Irrigation Area Based on a Dual Principal–Agent Model

There is a principal–agent relationship in agricultural water-saving irrigation [42]. The classical principal–agent theory is essentially a single principal–agent theory. In the 1930s, Berle and Means [43] firstly proposed the principal–agent problem based on the separation of corporate ownership and management rights. Since the 1970s, Spence and Zeckhauser [44] and Ross [45] proposed a bilateral principal–agent theory with a single principal, single agent, and single task. However, the principal–agent relationship does not exist in a single form in practice. Holmstrom [46] and Sappington [47] have studied a multi-agent theory with a single principal, multiple agents, and a single task. On this basis, Bernheim and Whinston [48] proposed a joint principal–agent theory of multiple principals, a single agent, and a single task. Holmstrom and Milgrom [49] proposed a single principal, single agent, and multi-task principal–agent analysis method based on the bilateral principal–agent theory. Lafont and Meleu [50] built a single-principal and two-agent model. Two agents perform supervisory functions on each other; Mohapatra [51] also studied Chinese enterprises’ incentive designs through the multiple principal–agent theory and analyzed the incentive effect of various incentive methods.
Based on studies of the multiple principal–agent model, this paper combines the characteristics of multi-agent participation in irrigation water-saving and analyzes the dual principal–agent relationship in the process of irrigation water-saving. Furthermore, a dual principal–agent model is constructed to analyze the paradox of irrigation efficiency in the Shenwu Irrigation Area.

3.1. Assumptions and Parameters

3.1.1. Assumptions

Irrigation water-saving refers to the amount of surplus water resources resulting from irrigation water-saving projects, which mainly consists of the evaporation and seepage of water resources in the irrigation system. The saved irrigation water can generally serve three purposes: water rights transactions, groundwater recharge, and irrigation area expansion. The irrigation water-saving used in water rights transactions is considered as a private product [52]. An accurate water metering will be carried out by local departments or their entrusted institutions of water rights trading managers. However, the amount of irrigation water-saving for groundwater recharge is viewed as quasi-public goods [53], and it is not easy to measure the amount accurately. Generally, local departments will execute an annual survey within their administrative region, but the irrigation water-saving used for groundwater recharge cannot be directly measured. On the one hand, it is currently only possible to measure the total amount of irrigation water used by the Rural Water Cooperation Organization but not the specific amount by each household. As a result, the irrigation water-saving used to expand the irrigation area is a typical common-pool resource [54]. Once the water needed for expanding farming can be obtained through irrigation water-saving, the Rural Water Cooperation Organization will choose to be a “free rider” [55] based on individual rationality, and this would further become a collective rational choice. It would gradually induce a “crowding effect”, which would further squeeze the irrigation water-saving for groundwater recharge and result in “the Tragedy of the Commons”. On the other hand, the Irrigation District Management Unit is a self-supporting institution. Its income mainly consists of project construction management fees paid by the local government and the water resources fees paid by the Rural Water Cooperation Organization. More irrigation water-saving occupied by the Rural Water Cooperation Organization also benefits the Irrigation District Management Unit. Therefore, the Irrigation District Management Unit has the motivation to squeeze irrigation water-saving in collusion with the Rural Water Cooperation Organization. Consequently, with information asymmetry, there are heterogeneous interest preferences among stakeholders involved in the irrigation water-saving project. It leads to conflicts between individual rationality and collective rationality and eventually forms the paradox of irrigation efficiency.
There exist asymmetric information and heterogeneous interest expression among different stakeholders in the process of irrigation water-saving. Due to the lack of irrigation water-saving metering, the Rural Water Cooperation Organization and the Irrigation District Management Unit have the same interest preference. However, it contradicts with the interest of the local government, which leads to conflicts among heterogeneous stakeholders and causes “moral hazard” and “adverse selection”. 
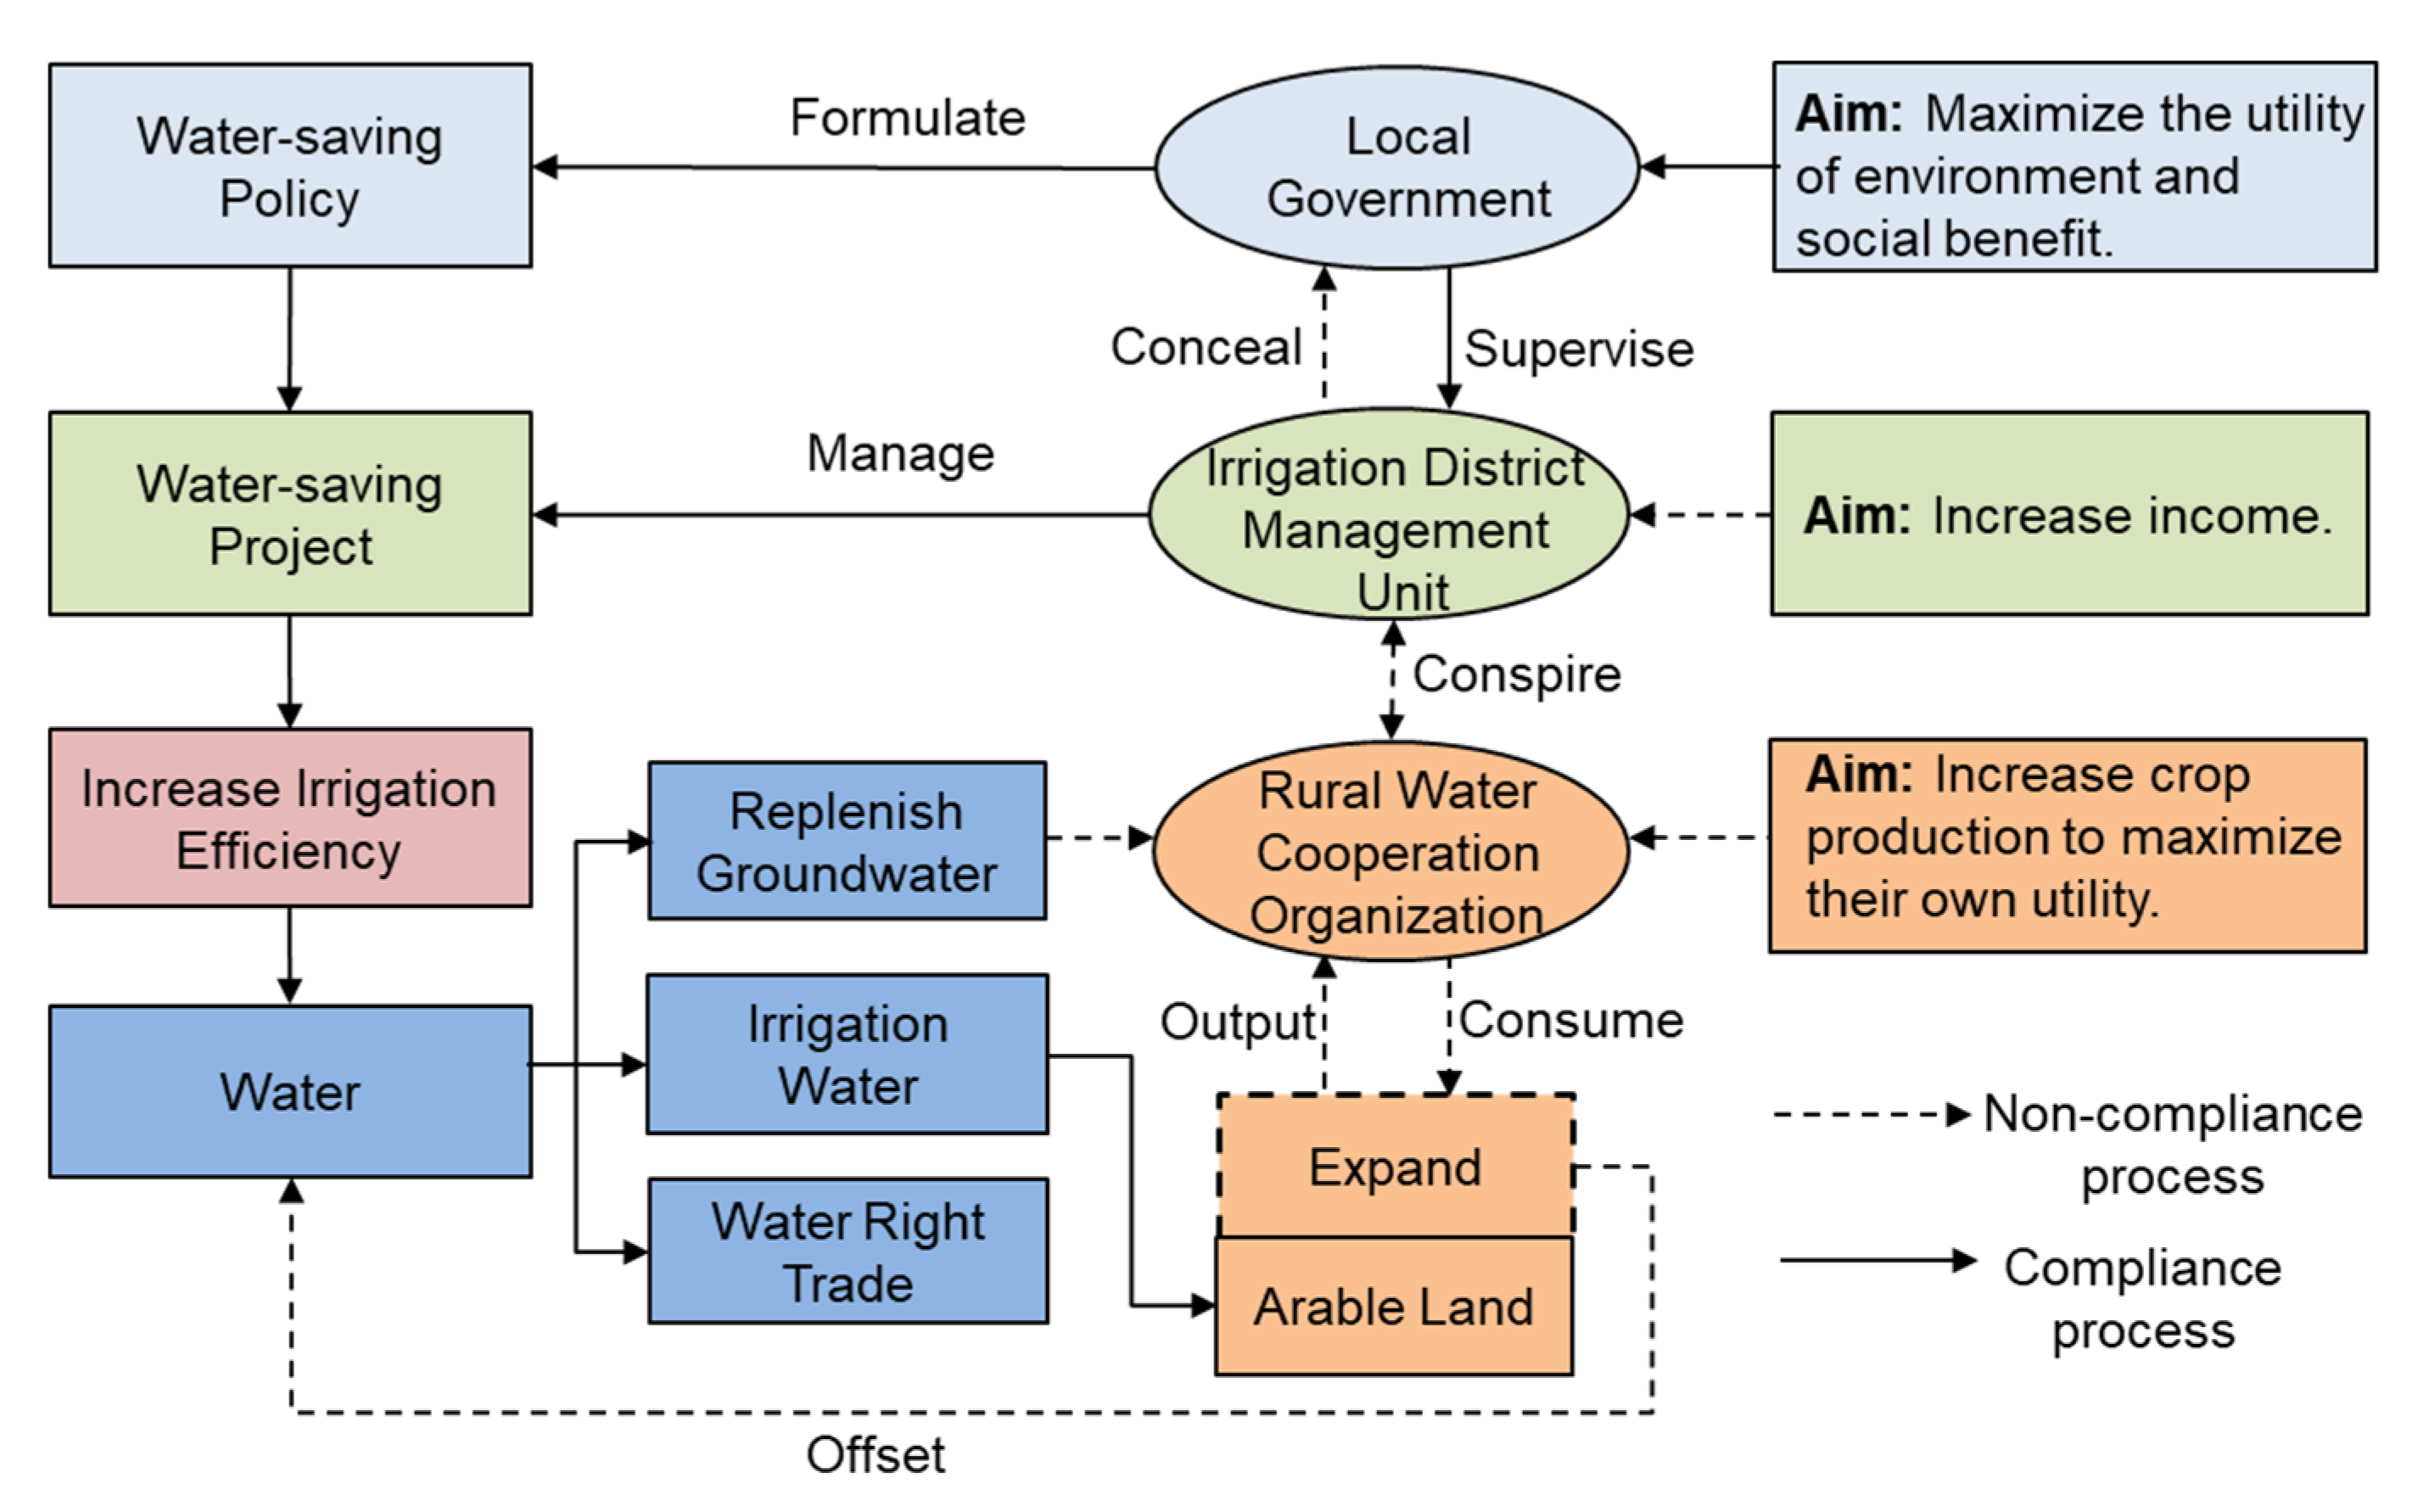
Figure 3 presents a dual principal–agent relationship among the three types of stakeholders.
As shown in Figure 3, the essence of the paradox of irrigation efficiency is the conflict of interests among stakeholders with asymmetric information due to the lack of regulatory capacity to manage efficient water utilization. When heterogeneous stakeholders are involved in the principal–agent process, there is a deviation between participation benefit and expected utility, which would induce moral hazard under the condition of asymmetric information. Therefore, in order to describe the dual principal–agent structure of the irrigation water-saving process in the Shenwu Irrigation Area, the following assumptions are designed.
Assumption 1.
The amount of water-saving from implementing a water-saving project in an irrigation area is the sum of intermediary and pure agent  Q = Q f + Q m . That is to say, the water-saving goal of pure principal can be achieved by the decomposition of principal–agent relationships.
Assumption 2.
The amount of water-saving of an agent is not only related to its own effort but is also affected by exogenous random variables, which are uncertain. In this paper, the amount of water-saving is used to indicate the efforts of an agent. It is assumed that the total marginal revenue of water-saving projects increases  μ ( μ > 0 )  for every unit of water-saving  Q  achieved by an agent. The output function of a pure agent through upgrading planting patterns and improving water resource utilization is formulated as  π f = Q f μ + θ , in which Q f  is the amount of water saved by the pure agent. The output function of the intermediary is  π m = Q m μ + π f + θ , in which Q m  is the amount of water-saving achieved through engineering and non-engineering measures by the intermediary. θ  is a random variable, representing the exogenous uncertainty factor, and follows a normal distribution of mean value 0 and variance  δ 2  ( θ N ( 0 , δ 2 ) ).
Assumption 3.
Principals adopt an incentive mechanism [56]. The incentive function of a pure principal to an intermediary is  S m = α + β m π m . The incentive function of an intermediary to a pure agent is  S f = α + β f π f . Among them, α is a fixed incentive portion that would not be affected by an agent’s output.  β i π i  refers to a marginal incentive obtained by an agent’s efforts to save water, and  β i  is an incentive coefficient, which reflects the incentive strength of a principal to an agent according to actual output, 0 β i 1 . Specifically,  β m  is the incentive coefficient of a pure principal to an intermediary, and  β f is the incentive coefficient of an intermediary to a pure agent.
Assumption 4.
Principals are risk-neutral, while agents are risk-averse. An agent’s utility function can be expressed as A = e ρ w i , in which  ρ ( 0 < ρ < 1 )  is the coefficient of absolute risk-aversion [57] and w i  is monetary gains. For agent output function in different principal–agent relationships, Taylor Expansion is executed at the water-saving quantity  Q . Then, the risk premium of a pure agent is  R f = A E ( θ ) 2 = 1 2 ρ V a r ( π ) = 1 2 ρ δ 2 β f 2 . The risk premium of an intermediary is  R m = A E ( θ ) 2 = 1 2 ρ V a r ( π ) = 1 2 ρ δ 2 ( 2 β m β f ) 2 . Among them, the variance  δ 2  of the exogenous random variable can represent information asymmetry. Larger  δ 2  indicates more significant information asymmetry, which results in a greater cost of risk but higher expected returns for an agent. In contrast, a principal’s income will decrease along with the increase in  δ 2 .
Assumption 5.
An agent’s water-saving cost is a quadratic function of the amount of water-saving [58]. The water-saving cost of an intermediary is  C m = 1 2 b Q m 2 . The water-saving cost of a pure agent is  C f = 1 2 b Q f 2 b is the water-saving cost coefficient of a water-saving project, which indicates an agent’s ability to control water-saving cost. The greater  b  is, the greater the cost of an agent’s effort to achieve Q  is. For the convenience of calculation, in this paper, it is assumed that the water-saving cost coefficient is the same for all agents in the dual principal–agent relationship, and  b > 0 .

3.1.2. Parameters

Key parameters in the dual principal–agent model of the irrigation water-saving process in the Shenwu Irrigation Area are listed in Table 2.

3.2. Construction of a Dual Principal-Agent Model

A water-saving project in an irrigation district involves three stakeholders: the local government, the Irrigation District Management Unit, and the Rural Water Cooperation Organization. Their interactions are systematic, hierarchical, and dynamic. It is difficult to describe this process with the traditional single-layer principal–agent model. Therefore, a chain-like multiple principal–agent model proposed by Zhao [25] is adopted. In this paper, a dual principal–agent model (DPAM) for irrigation water-saving management is constructed, considering the principal–agent structure in a water-saving project and the marginal income of the agent’s effort in output function. It also distinguishes the different retention benefits of intermediaries and pure agents within the constraint of individual rationality (IR). The model describes a chain-like principal–agent relationship among a pure principal (the local government), an intermediary (the Irrigation District Management Unit), and a pure agent (the Rural Water Cooperation Organization) in the process of irrigation water-saving. It is worth pointing out that the Irrigation District Management Unit, as an intermediary, has dual identities, which is the agent in the first principal–agent relationship and the principal in the second principal–agent relationship. According to the assumptions and parameters described in Section 4.1, the participation benefit function and expected utility function of stakeholders in the principal–agent process are constructed. DPAM is proposed to satisfy incentive compatibility constraints and individual rationality constraints.

3.2.1. Participation Benefit Function

According to the assumptions, stakeholders’ participation benefit is defined as income minus water-saving cost and incentive cost. In the process of irrigation water-saving, the participating benefit function is formulated as follows:
{ I g = π m S m = π m ( α + β m π m ) I m = S m C m S f = α + β m π m 1 2 b Q m 2 ( α + β f π f ) I f = S f C f = α + β f π f 1 2 b Q f 2
where I g is the participation benefit of a pure principal and π m is the output function of an intermediary, while the incentive cost of a pure principal to an intermediary is S m = α + β m π m . An intermediary’s participation benefit is denoted by I m , the water-saving cost of an intermediary is C m = 1 2 b Q m 2 , and the incentive cost of an intermediary to a pure agent is S f = α + β f π f . A pure agent’s participation benefit is expressed as If and the water-saving cost of a pure agent is C f = 1 2 b Q f 2 .

3.2.2. Expected Utility Function

According to the assumptions, if a pure principal is risk-neutral, a pure principal’s expected utility can be expressed as the participation benefit without considering risk cost. According to the certainty equivalence income hypothesis [59], the expected utility of an intermediary and a pure agent can be expressed as the participation benefit considering the risk premium cost. It is assumed that the expected utility function of stakeholders is first-order continuous and differentiable. Therefore, the expected utility in this paper is defined as the difference between participation benefit and risk premium cost. The expected utility function is formulated as follows:
{ U g = E I g = α + ( 1 β m ) ( Q f + Q m ) μ U m = E I m R m = β m ( Q f + Q m ) μ β f Q f μ 1 2 b Q m 2 ρ ( 2 β m β f ) 2 δ 2 2 U f = E I f R f = α + β f Q f μ 1 2 b Q f 2 ρ β f 2 δ 2 2 ,
where the expected utility of a pure principal is U g . The expected utility of an intermediary is U m and ( ρ ( 2 β m β f ) 2 δ 2 2 ) is the risk premium cost of the intermediary. The expected utility of a pure agent is U f and ( ρ β f 2 δ 2 2 ) is the risk premium cost of the pure agent.

3.2.3. A Dual Principal–Agent Model

Based on Formulas (3) and (4) and the characteristics of interactions among stakeholders in the irrigation water-saving process, a DPAM is constructed as follows:
M a x U g = α + ( 1 β m ) ( Q f + Q m ) μ S . T . { I C : M a x U m = β m ( Q f + Q m ) μ β f Q f μ 1 2 b Q m 2 ρ ( 2 β m β f ) 2 δ 2 2 M a x U f = α + β f Q f μ 1 2 b Q f 2 ρ β f 2 δ 2 2 I R : U m h m U f h f
where IC represents the incentive-compatible constraint of a principal–agent process and IR stands for the individual rationality constraint of the intermediary and pure agent in the principal–agent process. h m and h f are the retention benefits of an intermediary and a pure agent, respectively. In this model, the retention benefit is represented by a stakeholder’s income who does not participate in an irrigation water-saving project.

3.3. Model Analysis

Considering IC and IR, by solving Formula (5), the Pareto optimal solutions of a pure agent’s water-saving Q f and an intermediary’s water-saving Q m are shown as follows:
{ Q m = μ b β m = μ 3 b 4 ρ δ 2 b + μ 2 ( 2 ρ δ 2 b ) 2 + 6 ρ δ 2 b μ 2 + μ 4 Q f = μ b β f = μ 3 b 6 ρ δ 2 b + μ 2 ( 2 ρ δ 2 b ) 2 + 6 ρ δ 2 b μ 2 + μ 4 ,
Then, the Pareto optimal water-saving quantity Q under the dual principal–agent condition is:
Q = Q m + Q f = 2 μ 3 b 5 ρ δ 2 b + μ 2 ( 2 ρ δ 2 b ) 2 + 6 ρ δ 2 b μ 2 + μ 4 ,
From Formula (6), it can be seen that the optimal water-savings for a pure agent and an intermediary are directly proportional to the added value of total marginal income, μ , and incentive coefficient, β i , but inversely proportional to the water-saving cost coefficient, b . By designing a suitable incentive mechanism for heterogeneous stakeholders, improving the total marginal income of water-saving projects, and reducing the water-saving cost coefficient, the amount of water-saving from irrigation water-saving projects can be improved.
Furthermore, according to the optimal water saving Q , the optimal expected utilities of a pure principal, an intermediary, and a pure agent can be respectively calculated as follows:
{ U g = α + ( 1 β m ) ( Q f + Q m ) μ   = 56 b 3 μ 4 ( ρ δ 2 ) 3 + 68 b 2 μ 6 ( ρ δ 2 ) 2 + 16 b μ 8 ρ δ 2 + μ 10 32 b 5 ( ρ δ 2 ) 4 + 96 b 4 μ 2 ( ρ δ 2 ) 3 + 88 b 3 μ 4 ( ρ δ 2 ) 2 + 24 b 2 μ 6 ρ δ 2 + 2 b μ 8 i = m , f h i U m = β m ( Q f + Q m ) μ β f Q f μ 1 2 b Q m 2 ρ ( 2 β m β f ) 2 δ 2 2   = 4 b 3 μ 4 ( ρ δ 2 ) 3 + 12 b 2 μ 6 ( ρ δ 2 ) 2 - 3 b μ 8 ρ δ 2 - μ 10 32 b 5 ( ρ δ 2 ) 4 + 96 b 4 μ 2 ( ρ δ 2 ) 3 + 88 b 3 μ 4 ( ρ δ 2 ) 2 + 24 b 2 μ 6 ρ δ 2 + 2 b μ 8 U f = α + β f Q f μ 1 2 b Q f 2 ρ β f 2 δ 2 2   = 4 b 3 μ 4 ( ρ δ 2 ) 3 + 36 b 2 μ 6 ( ρ δ 2 ) 2 + 8 b μ 8 ρ δ 2 - μ 10 32 b 5 ( ρ δ 2 ) 4 + 96 b 4 μ 2 ( ρ δ 2 ) 3 + 88 b 3 μ 4 ( ρ δ 2 ) 2 + 24 b 2 μ 6 ρ δ 2 + 2 b μ 8 + i = m , f h i ,
According to IR in Formula (5), a pure principal’s optimal expected utility is inversely proportional to the retention benefit of intermediary and pure agent. The higher the retention benefit is, the higher the expected utility is for the intermediary and the pure agent. In contrast, the expected utility of a pure principal would be less.
On the one hand, the added value of total marginal income and the total water-saving cost coefficient of water-saving projects are output variables, rather than decision-making variables, of multi-stakeholder interactions. On the other hand, the retention benefits of the intermediary and pure agent are historical monetary income, which are decision variables that cannot be optimized. Therefore, the focus in this paper is to analyze the risk decision-making of heterogeneous stakeholders in the process of irrigation water-saving through the dual principal–agent model. It is revealed that information asymmetry provides an objective basis for forming an irrigation efficiency paradox, and the profit motive of a pure agent is an endogenous driving force of the irrigation efficiency paradox. At the same time, the heterogeneity of risk premium among multiple stakeholders is an exogenous driving force.
Theorem 1.
In a DPAM, both the pure agent and the intermediary have a positive risk premium. With asymmetric information, these two kinds of stakeholders can benefit from the paradox of irrigation efficiency. Simultaneously, a pure agent has a higher risk premium than an intermediary, and its profit motive is an endogenous driving force of the irrigation efficiency paradox. It is assumed that stakeholders involved in irrigation water-saving projects satisfy the bounded rationality hypothesis [60]. Due to limited water metering, a pure agent’s actual water consumption cannot be accurately known by pure principal and intermediary. Therefore, there exist asymmetric information and unbalanced interests among stakeholders in the DPAM. Moreover, a pure agent bears a greater risk and a higher risk premium than an intermediary.
Proof. 
0 β i 1 ;   0 < ρ < 1 { R f = 1 2 ρ δ 2 β f 2 0 R m = 1 2 ρ δ 2 ( 2 β m β f ) 2 0 R f R m = β f 2 ( 2 β m β f ) 2 = [ ( 2 b ρ δ 2 + μ 2 ) + 4 b ρ δ 2 ] 2 ( 2 b ρ δ 2 + μ 2 ) 2 1
 □
Theorem 2.
The risk aversion degree of an agent is inversely related to the incentive coefficient of a principal. Under the situation of asymmetric information, a DPAM may induce a vicious circle and further induce agents to squeeze the saved water. The heterogeneity of risk premium among stakeholders is an exogenous driving force of the irrigation efficiency paradox. In a DPAM, on the one hand, by increasing the incentive coefficient, a principal can reduce the risk aversion degree of an agent and encourage the agent to improve its effort. On the other hand, with a higher risk aversion degree for an agent, the incentive effect of improving the agent’s incentive coefficient would be less. Therefore, a principal may choose to reduce the incentive coefficient, which leads to a vicious circle.
Proof. 
{ β m ρ = 2 b δ 2 μ 2 ( 8 b 2 ρ 2 δ 4 + 4 b ρ δ 2 μ 2 + μ 4 ) ( 4 b 2 ρ 2 δ 4 + 6 b ρ δ 2 μ 2 + μ 4 ) 2 < 0 β f ρ = 8 b 2 δ 4 μ 2 ρ ( 3 b ρ δ 2 + μ 2 ) ( 4 b 2 ρ 2 δ 4 + 6 b ρ δ 2 μ 2 + μ 4 ) 2 < 0
 □

4. Allocation Result

4.1. Effect of Actual Water-Saving on the Expected Utility of Heterogeneous Stakeholders

Does the actual water-saving amount have the same direction influence on the expected utility of the three kinds of stakeholders in the DPAM? By substituting the water-saving amount Q [ 0 , Q ] into Formula (8) and fixing other parameters, the expected utilities of the pure principal, intermediary, and pure agent can be derived, which are shown in Figure 4.
As shown in Figure 4, the expected utility U g of the pure principal increases along with the growth of water-saving Q . However, the expected utilities of the intermediary U m and pure agent U f decrease with the increase in water-saving Q .

4.2. Analysis of Benefit Transmission Structure from Water-Saving to Irrigation Area Expansion

Under asymmetric information and the participation of heterogeneous stakeholders, does the pure agent’s action of using irrigation water-saving for expanding farming produce a beneficial transmission to the intermediary in the DPAM? In this paper, the relationship between DPAM stakeholders’ participation benefits and new irrigation area is constructed according to the aforementioned assumptions.
{ I f = Δ F ( O i P a W i P w )   I m = Δ F W i P w ,
where Δ F is the newly added irrigation area; O i stands for crop yield per unit area; P a is crop price per unit area; W i is water demand per unit area; P w is water price.
Then, provided that the newly added irrigation area is in a range of Δ F [ 0 , 3852 ] , by substituting it into Formula (11) and fixing other parameters, the change in participation benefits of the pure agent and intermediary in the DPAM is shown in Figure 5.
It can be seen from Figure 5 that with the increase in new irrigation area, Δ F , the participation benefits of the intermediary I m and the pure agent I f experience a growth. The result shows that a pure agent’s action of expanding farming is beneficial to itself and is favorable by an intermediary. However, the pure principal’s income will decline.

4.3. The Impact of Risk Preference of Heterogeneous Stakeholders on Expected Utility

The influence of an agent’s risk aversion preference on its expected utility is investigated. Let the variance of exogenous random variables belong to δ 2 [ 1 , 9 , 15 , 25 , 50 , 81 ] , and substitute into Formula (8). When other parameters are fixed, the effect of risk aversion degree ρ ( 0 < ρ < 1 ) on stakeholders’ expected utility is shown in Figure 6.
Under different settings of the variance δ 2 of exogenous random variables, Figure 6a,b show the change in expected utility of the intermediary U m and the pure agent U f , respectively, along with risk aversion degree ρ . The above figures indicate that with the increase in risk aversion degree ρ , the variance of exogenous random variables δ 2 becomes large, while the expected utility of the intermediary and pure agent will decrease.

5. Analysis and Discussion

This section will further discuss the information asymmetry and risk heterogeneity of stakeholders in the irrigation efficiency paradox and clarify the conflict of objectives among stakeholders behind the irrigation efficiency paradox.
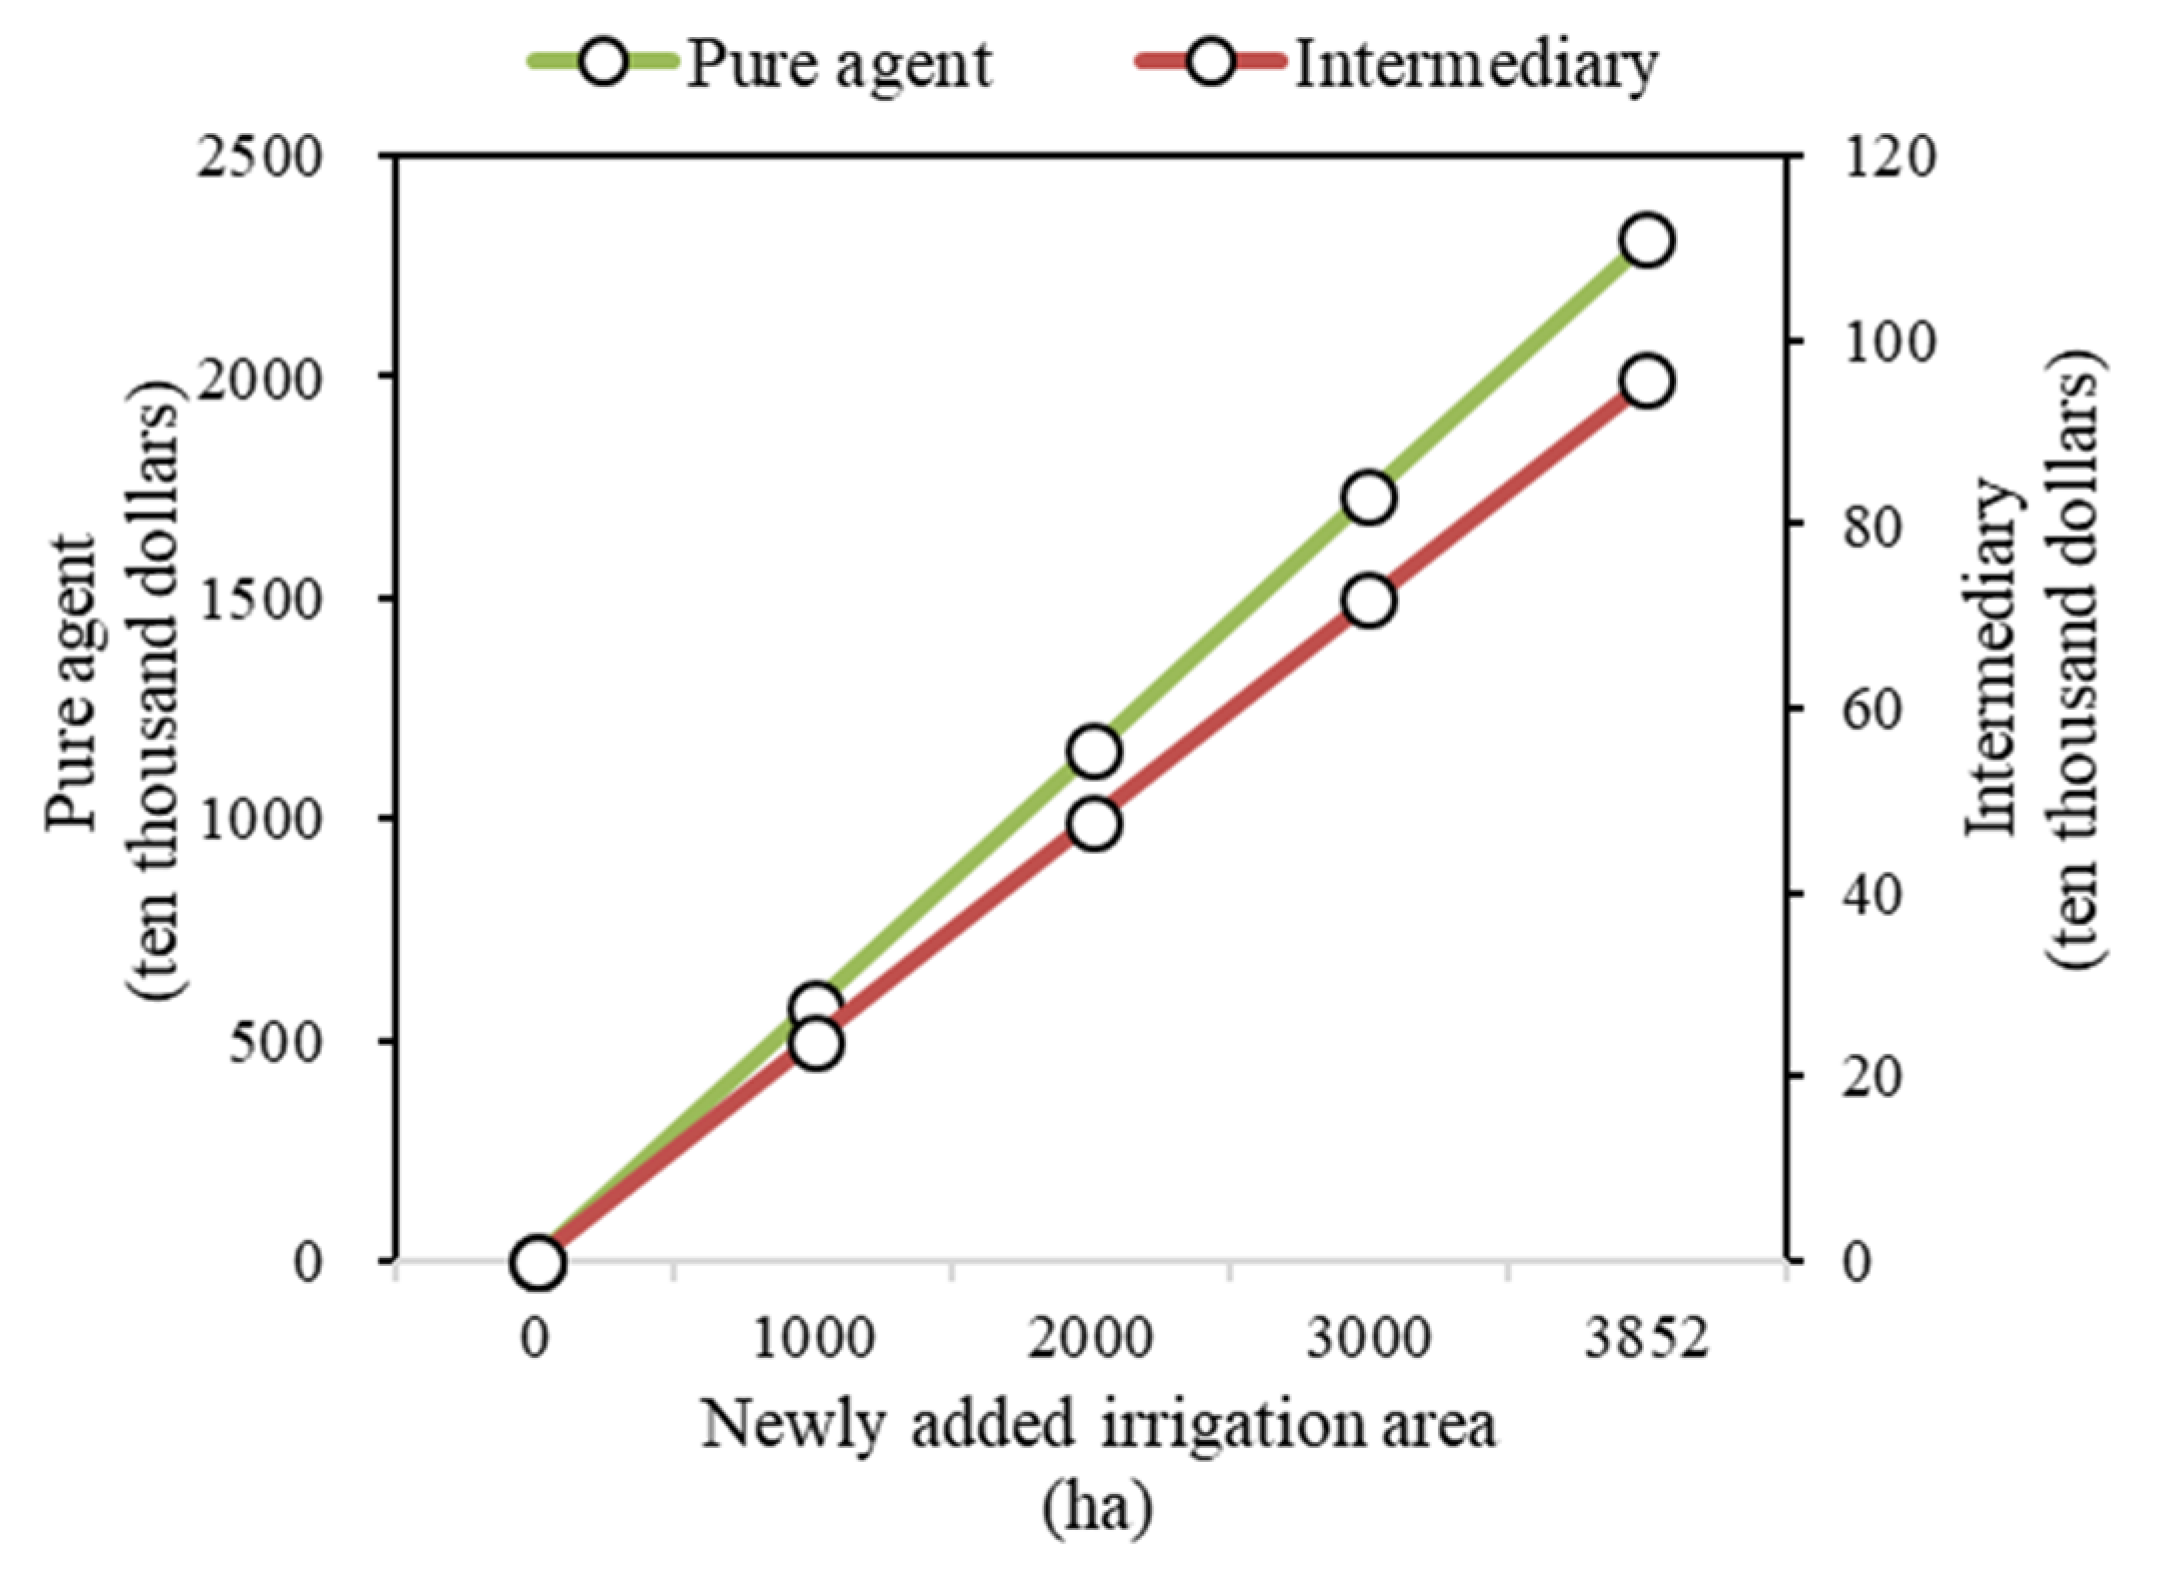
Firstly, the implementation of an irrigation water-saving project has heterogeneous impacts on the expected utility of stakeholders. A pure principal’s expected utility increases steadily along with the water-saving amount, but the expected utility of an intermediary and a pure agent shows a downward trend, which shows a significant heterogeneity with the pure principal. Combined with information asymmetry caused by inadequate water metering, the pure agent and the intermediary will undoubtedly pursue maximum individual income by increasing water-saving occupation. Thus, total water saving is reduced, which leads to the paradox of irrigation efficiency. Theorem 1 proved that the intermediary and the pure agent have information superiority and their profit motive is an endogenous driving force of the irrigation efficiency paradox. Therefore, in the process of agricultural water-saving, the interests of the Rural Water Cooperation Organization and the Irrigation District Management Unit should be taken into account. By reasonably designing a water-saving benefit-sharing mechanism, incentive benefits can be provided to the Rural Water Cooperation Organization and the Irrigation District Management Unit, therefore the intensity of irrigation efficiency paradox can be reduced.
Secondly, a pure agent’s action of irrigation area expansion is mainly because irrigation water-saving projects provide extra water that is considered quasi-public goods and the land cost of expansion is minimal. Therefore, when water metering is not in place, a pure agent can take advantage of the information and utilize water-saving for agricultural production to obtain extra utility. An irrigation water-saving project significantly reduces the total amount of irrigation water consumption by reducing water seepage, leading to a decrease in water fee income for an intermediary. Although the construction and management of a water-saving project provide benefit compensation to the intermediary, when the benefits compensation is lower than the water fee loss, the intermediary’s total income will be damaged. Simultaneously, inadequate agricultural water metering also makes it difficult to monitor the actual water consumption. Because the income of an intermediary increases along with the increase in total agricultural irrigation water consumption, the intermediary also has the motivation to allow a pure agent to increase its irrigation water under information asymmetry. Therefore, in addition to provide a water-saving incentive income, it is also essential to increase investment in irrigation water metering equipment. It is suggested to take advantage of market entities’ capital and information to promote water-saving management contracts and cooperative management of water-metering equipment. By improving the level of irrigation water metering and reducing information asymmetry, one can mitigate the paradox of irrigation efficiency.
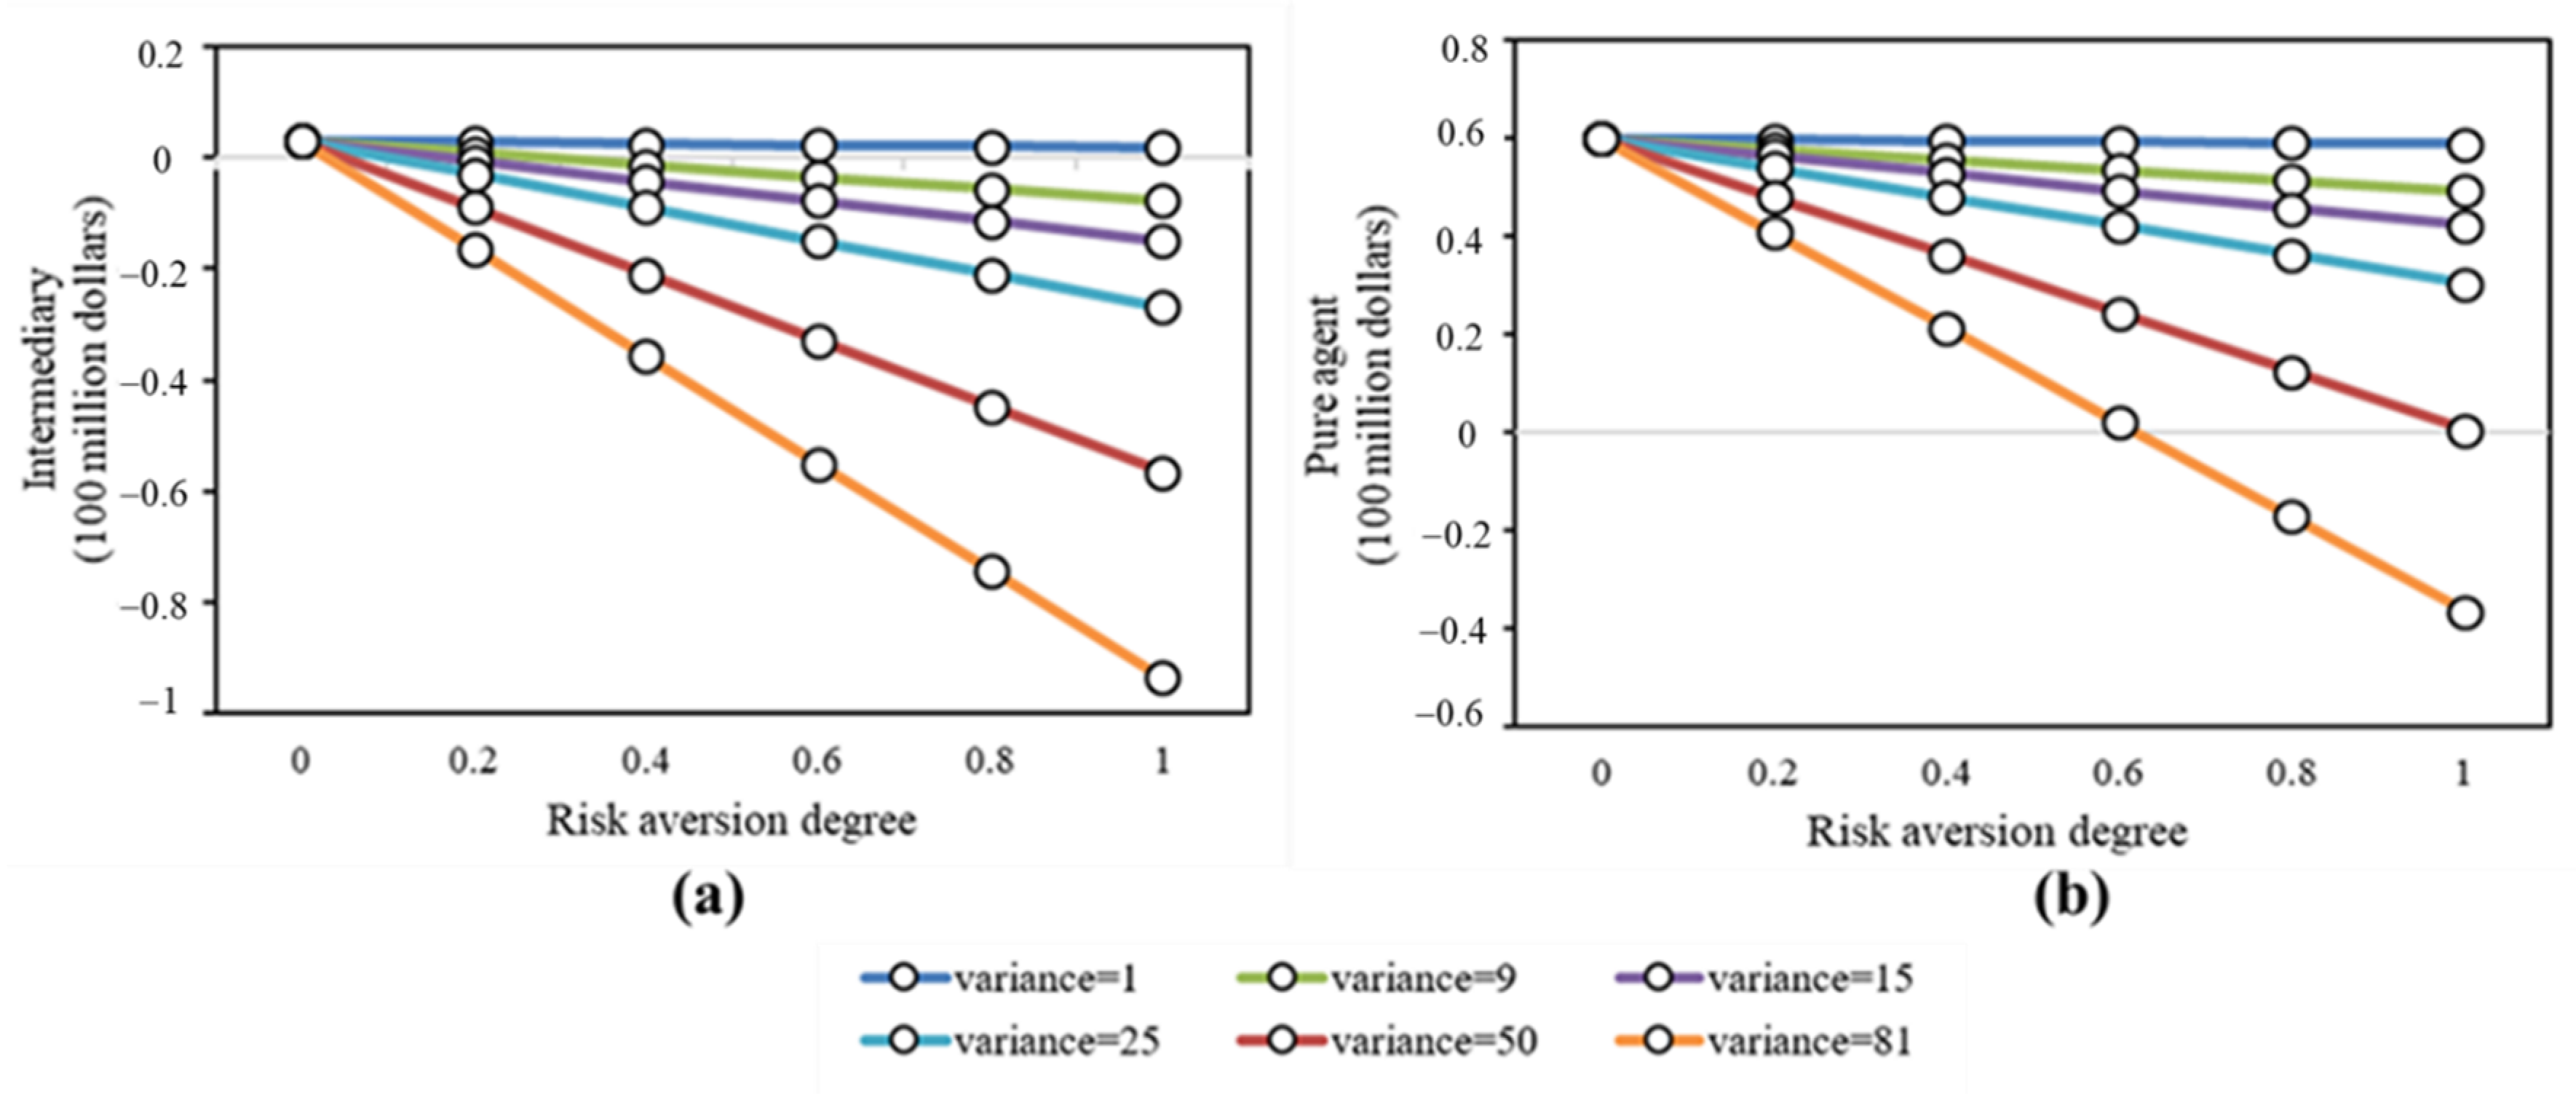
Finally, the degree of risk aversion ρ and the variance of exogenous random variables δ 2 reflect stakeholders’ risk preference. The expected utilities of an intermediary and a pure agent would decrease along with the increase in risk aversion and the variance of exogenous random variables. Therefore, in the process of irrigation water saving, the action of increasing irrigation water possesses the characteristics of high income and high risk. Under the condition of asymmetric information, when some of the pure agents use regulatory loopholes to expand the irrigation area and produce expected utility, more pure agents will join the group if there is no reasonable and adequate supervision. It will lead to a large-scale expansion and occupation of expected water-saving, thus further aggravating the paradox of irrigation efficiency. Therefore, it is vital to specify rules on using irrigation water-saving, enhance the total amount and water monitoring for sand control and irrigation area expansion, and design a binding mechanism for water-saving usage.

6. Conclusions

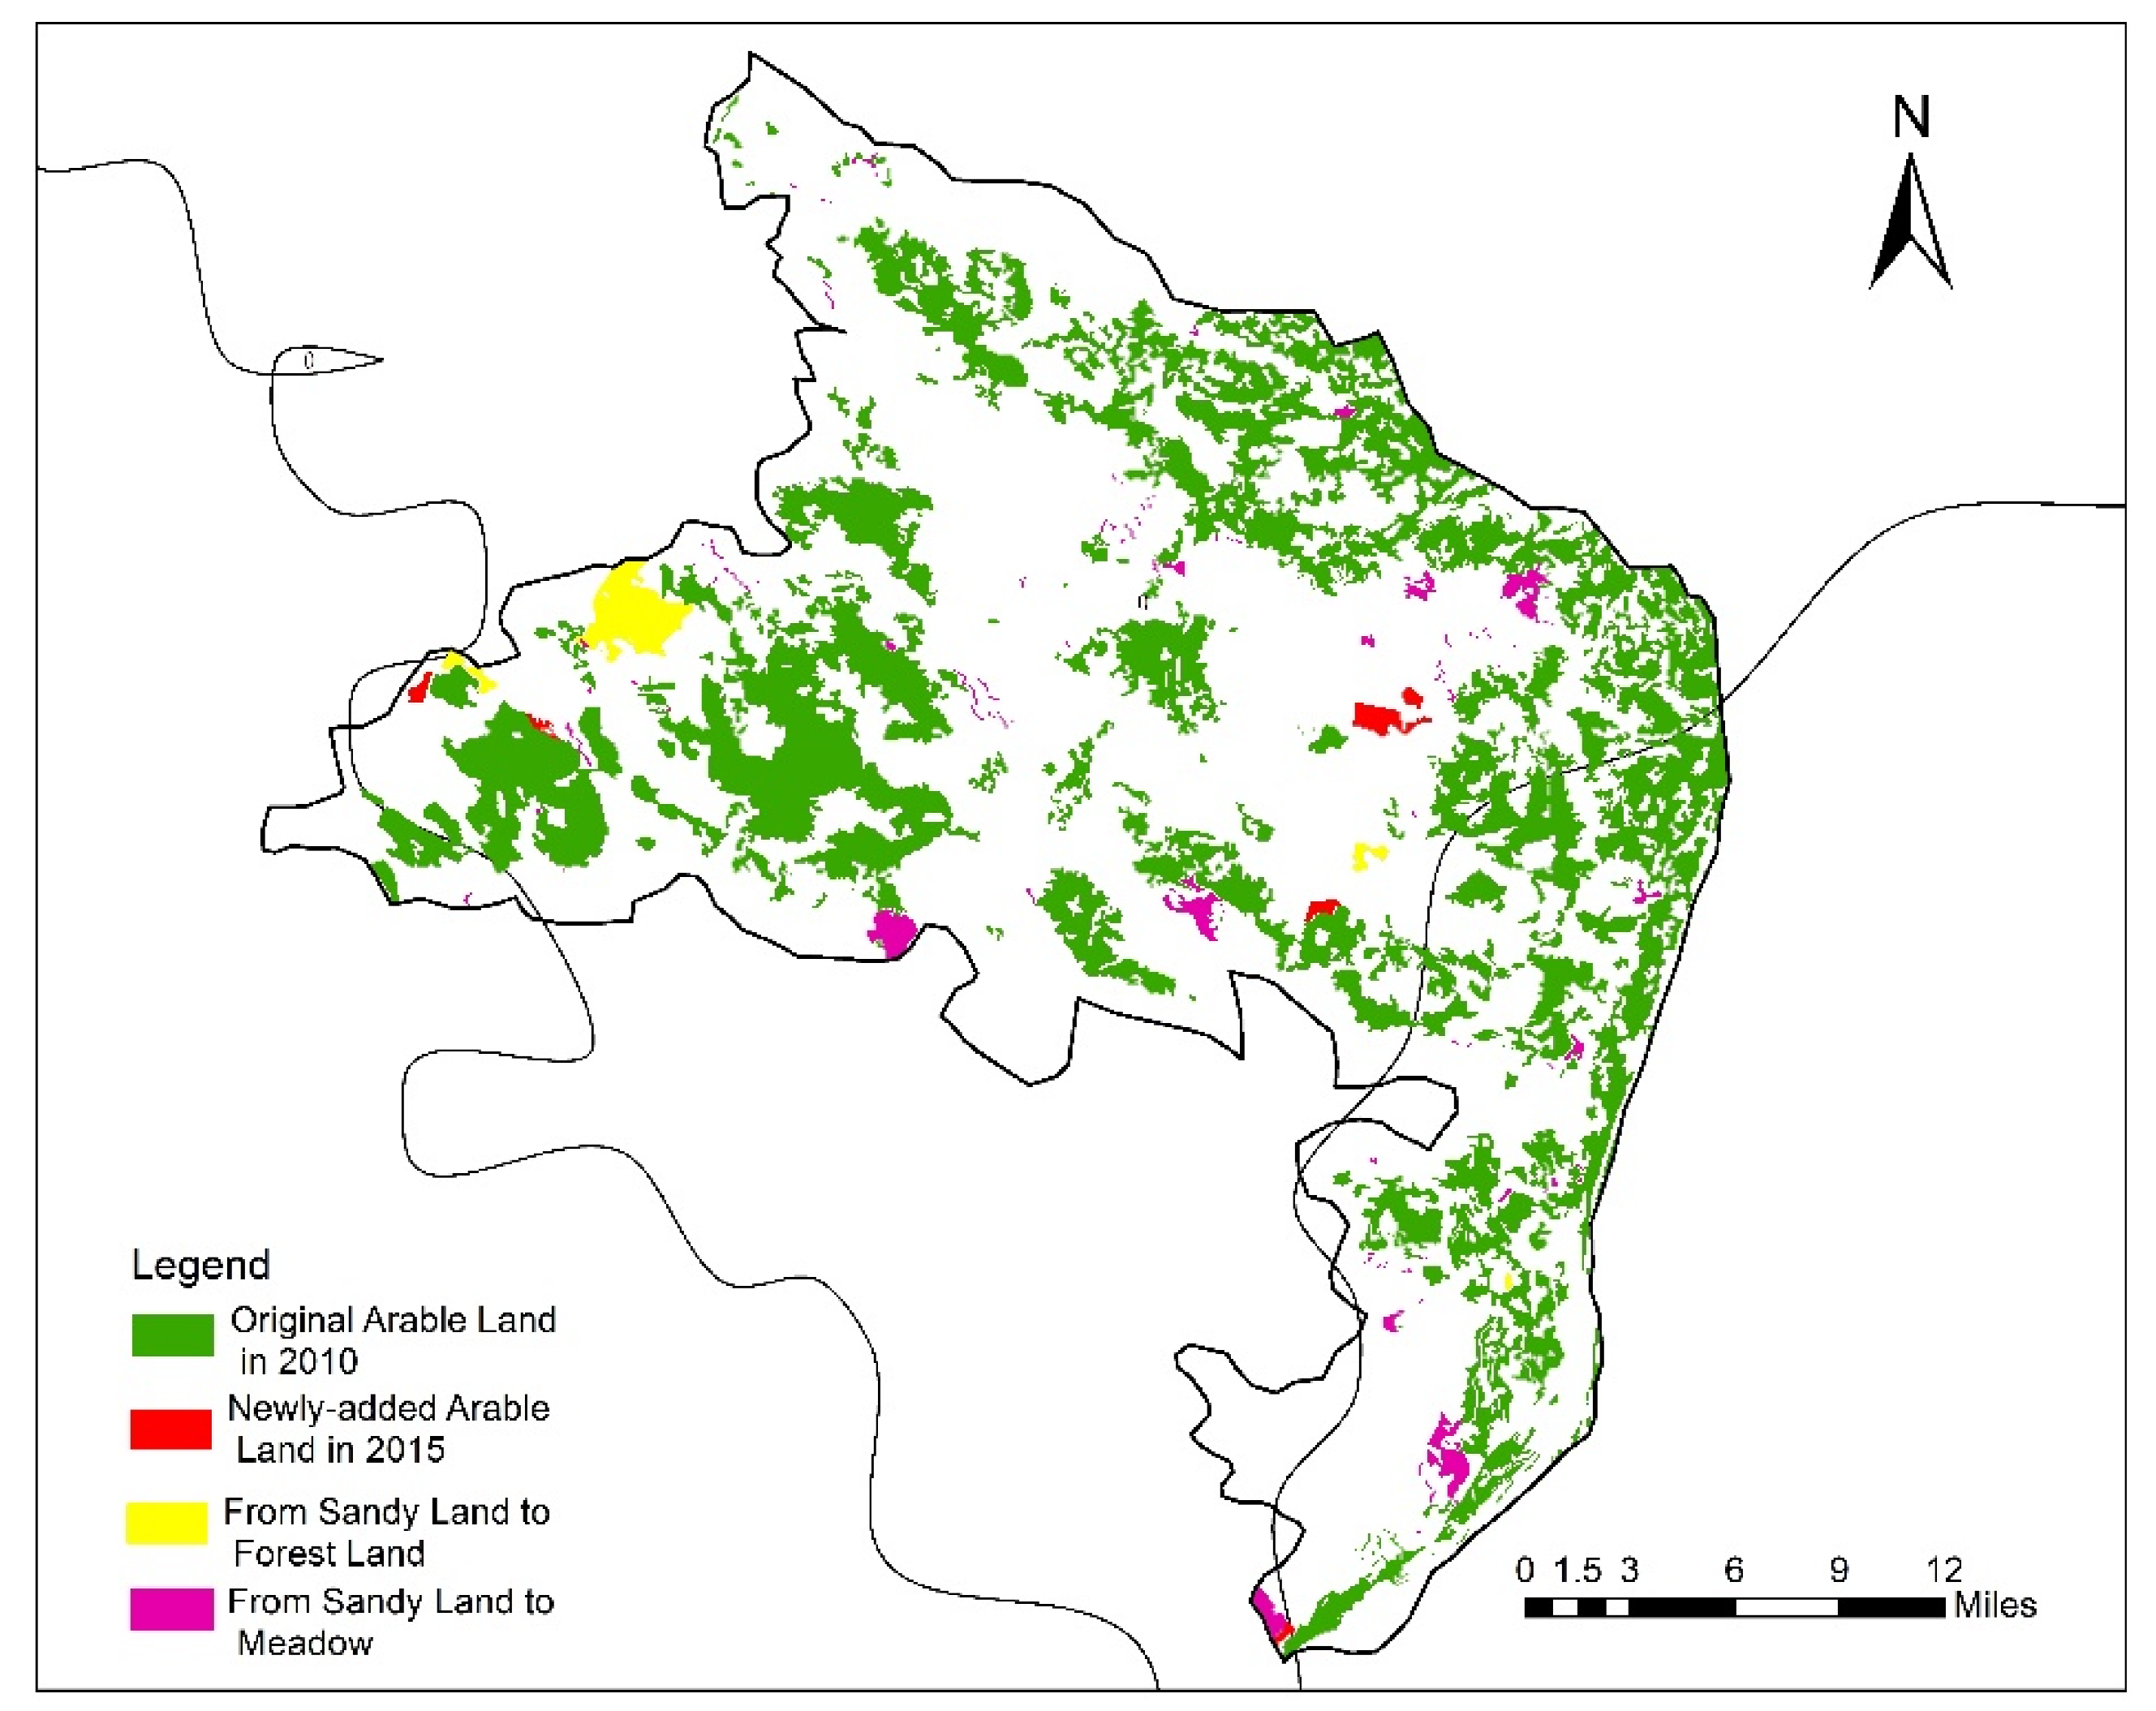
To deal with the irrigation efficiency paradox, a rebound intensity model and a dual principal–agent model were constructed based on the rebound effect of irrigation water and principal-agent theory. The models were applied to the Shenwu Irrigation Area as a case study. The results show that there is a paradox of irrigation efficiency caused by a disorderly expansion of irrigation area in the Shenwu Irrigation Area. As a water rights trade pilot in arid areas, many water-saving projects have been implemented in the Shenwu Irrigation Area. However, due to unauthorized expansion of irrigation area by the Rural Water Cooperation Organization, a huge amount of water-saving is not returned to the ecology as planned. As a result, the expected effect of water-saving projects has faded.
Along with an aggravated over-extraction of groundwater, great harm has been caused to the local ecological environment. The essence of the paradox of irrigation efficiency lies in the conflict of objectives among heterogeneous stakeholders under asymmetric information and inadequate supervision. The Rural Water Cooperation Organization prefers to expand the irrigation area, which is cost-effective and gains profit fast. The Irrigation District Management Unit tends to sell more water to increase its income. According to their interest preference, their behavior contradicts the local government’s water-saving plan, which results in the paradox of irrigation efficiency. The analysis and discussion of the dual principal–agent model propose several countermeasures to reduce the intensity of the paradox of irrigation efficiency: take into account the interests of various stakeholders and formulate a reasonable benefit-sharing mechanism; improve the level of irrigation water metering and reduce information asymmetry; specify the regulation of water-saving and enhance the management and restriction of water use.

Author Contributions

Conceptualization, G.L. and Z.C.; methodology, L.Z. and G.L.; data curation, L.Z. and G.L.; formal analysis, L.Z. and G.L.; writing—original draft preparation, L.Z.; writing—review and editing, G.L., Z.F. and D.S.; supervision, H.W. All authors have read and agreed to the published version of the manuscript.

Funding

This research was funded by the National Science Foundation of China (51861125101; 71603125; 71704068), the National Key Research and Development Project (2017YFC0404600), and the Jiangsu Province Philosophy and Social Science Fund Project (17GLC006).

Conflicts of Interest

The authors declare no conflict of interest.

Appendix A

Appendix A.1. The Water Demand per Unit Irrigation Area W i

Crop Water Requirement E T c

The calculation formula of main crops’ water requirement in the Shenwu Irrigation Area from 2010 to 2015 is as follows.
E T c = i = 0 n ( K c i E T 0 i ) ,
where E T c is crop water requirement (mm), K c i is crop coefficient, and E T 0 i is crop evapotranspiration. The calculation results are shown in Table A1.
Table A1. The water requirement of main crops from 2010 to 2015 (mm).
E T c 201020112012201320142015
Sunflower621.97639.04612.49621.97646.62652.31
Corn757.68778.47746.13757.68787.71794.64
Forest land1653.121698.481627.921653.121718.641733.76
Melon905.28930.12891.48905.28941.16949.44
Meadow649.44667.26639.54649.44675.18681.12
Wheat698.64717.81687.99698.64726.33732.72
Tomato1254.601289.031235.481254.601304.331315.80
Coarse cereals849.52872.83836.57849.52883.19890.96
Inter-planting crops1161.121192.981143.421161.121207.141217.76

Appendix A.2. Effective Precipitation during the Crop Growth Period P e

The calculation results of effective precipitation during the crop growth period in the Shenwu Irrigation Area from 2010 to 2015 are shown in Table A2.
Table A2. The effective precipitation during the crop growth period from 2010 to 2015 (mm).
P e 201020112012201320142015
Sunflower93.936206.576.7110.156.9
Corn78.433.8206.770.994.920.9
Forest land128.340.6241.187.2152.6103.2
Melon47.26.8124.846.651.751.8
Meadow46.46.8124.846.651.751.8
Wheat73.513.418952.975.162.5
Tomato78.634.1206.770.9108.764.2
Coarse cereals125.837237.287.1121.457.9
Inter-planting crops78.634.1206.770.9108.764.2

Appendix A.3. Irrigation Water Requirement of Main Crops I r

The calculation formula of the irrigation water requirement of the main crops in the Shenwu Irrigation Area from 2010 to 2015 is as follows:
I r = i = 1 n [ ( E T c P e η ) A i ] ,
where η is the irrigation water utilization coefficient; A i is the planting area of the type-i crop. The calculation results are shown in Table A3.
Table A3. Irrigation water requirements of main crops from 2010 to 2015 (100 million m3).
I r 201020112012201320142015
Sunflower1.71.71.41.81.92.5
Corn1.81.81.51.92.02.6
Forest land2.32.22.22.52.63.2
Melon0.80.80.80.90.91.1
Meadow0.50.40.40.50.50.6
Wheat0.30.30.20.30.30.4
Tomato0.50.50.50.50.60.7
Coarse cereals0.30.30.30.30.30.4
Inter-planting crops0.10.10.10.10.10.2
Total8.48.17.48.99.411.7

Appendix A.4. Irrigation Water Requirement per Unit Area W i

The calculation formula of irrigation water requirement per unit area of the Shenwu Irrigation Area from 2010 to 2015 is as follows:
W i = I r A t ,
where A t is the total planting area of main crops in the Shenwu Irrigation Area. The detailed data are shown in Table A4.
Table A4. The total planting area of crops from 2010 to 2015 (ha).
Year A t
201044,913
201137,985
201245,348
201345,422
201447,206
201556,400
By substituting the irrigation water requirement of the main crops I r and the total planting area of main crops A t into Formula (A3), we can obtain the irrigation water requirement per unit area W i of the Shenwu Irrigation Area from 2010 to 2015, and the calculation results are shown in Table A5.
Table A5. Irrigation water requirement per unit area from 2010 to 2015 (m3/ha).
Year W i
201018,613.9
201121,322.0
201216,240.5
201319,532.3
201419,809.6
201520,676.8
Average19,365.9

Appendix B. The Planned Water-Saving Amount W e

The planned water-saving mainly comes from three parts: channel lining, border field reconstruction, and changing border irrigation to sprinkler irrigation and drip irrigation. The total amount is 234.89 million m3. The details are shown in Table A6.
Table A6. The planned water-saving amount (million m3).
NO.Water-Saving MeasuresThe Water-Saving Amount
1Channel lining147.04
2Border field reconstruction65.51
3Change border irrigation to sprinkler irrigation and drip irrigation22.34
Total234.89

Appendix C. Rebound Intensity of Irrigation Efficiency Paradox

According to the remote sensing data, the newly added irrigation area Δ F of the Shenwu Irrigation Area from 2010 to 2015 was 3852 ha. When W i , W e , and Δ F are substituted into Formula (1), the rebound intensity is obtained as follows:
R E = i Δ F i × W i W e = 32 % ,

References

  1. Zhou, F.; Bo, Y.; Ciais, P.; Dumas, P.; Tang, Q.; Wang, X.; Liu, J.; Zheng, C.; Polcher, J.; Yin, Z.; et al. Deceleration of China′s human water use and its key drivers. Proc. Natl. Acad. Sci. USA 2020, 117, 7702–7711. [Google Scholar] [CrossRef] [PubMed]
  2. United Nations Educational, Scientific and Cultural Organization (UNESCO). UN World Water Development Report 2017: Wastewater: An Untapped Resource; United Nations Educational, Scientific and Cultural Organization: Paris, France, 2017; p. 10. [Google Scholar]
  3. United Nations Educational, Scientific and Cultural Organization (UNESCO). UN World Water Development Report 2020: Water and Climate Change; United Nations Educational, Scientific and Cultural Organization: Paris, France, 2020. [Google Scholar]
  4. Food and Agriculture Organization (FAO). The Water-Energy-Food Nexus—A New Approach in Support of Food Security and Sustainable Agriculture; Food and Agriculture Organization of the United Nations: Rome, Italy, 2014. [Google Scholar]
  5. Grafton, R.; Williams, J.; Perry, C.J.; Molle, F.; Ringler, C.; Steduto, P.; Udall, B.; Wheeler, S.; Wang, Y.; Garrick, D.; et al. The paradox of irrigation efficiency. Science 2018, 361, 748–750. [Google Scholar] [CrossRef] [Green Version]
  6. Zuo, M.; Zhou, T.; Man, W. Wetter global arid regions driven by volcanic eruptions. J. Geophys. Res. Atmos. 2019, 124, 13648–13662. [Google Scholar] [CrossRef]
  7. United Nations. Transforming our World: The 2030 Agenda for Sustainable Development; United Nations, Department of Economic and Social Affairs: New York, NY, USA, 2015. [Google Scholar]
  8. Huang, J.; Yu, H.; Guan, X.; Wang, G.; Guo, R. Accelerated dryland expansion under climate change. Nat. Clim. Chang. 2016, 6, 1–7. [Google Scholar] [CrossRef]
  9. Ward, F.; Pulido-Velazquez, M. Water conservation in irrigation can increase water use. Proc. Natl. Acad. Sci. USA 2008, 105, 18215–18220. [Google Scholar] [CrossRef] [PubMed] [Green Version]
  10. Pfeiffer, L.; Lin Lawell, C.Y.C. Does Efficient irrigation technology lead to reduced groundwater extraction? Empirical evidence. J. Environ. Econ. Manag. 2013, 67, 189–208. [Google Scholar] [CrossRef] [Green Version]
  11. Scott, C.; Vicuna, S.; Blanco-Gutiérrez, I.; Meza, F.; Varela-Ortega, C. Irrigation efficiency and water-policy implications for river-basin resilience. Hydrol. Earth Syst. Sci. 2014, 18, 1339–1348. [Google Scholar] [CrossRef] [Green Version]
  12. García, F.; Rodríguez Díaz, J.A.; Camacho, E.; Montesinos, P.; Berbel, J. Effects of modernization and medium term perspectives on water and energy use in irrigation districts. Agric. Syst. 2015, 131, 56–63. [Google Scholar] [CrossRef]
  13. Perry, C.J.; Steduto, P. Does Improved Irrigation Technology Save Water? A Review of the Evidence. Available online: http://www.fao.org/3/I7090EN/i7090en.pdf (accessed on 20 May 2020).
  14. Koech, R.; Langat, P. Improving irrigation water use efficiency: A review of advances, challenges and opportunities in the Australian context. Water 2018, 10, 1771. [Google Scholar] [CrossRef] [Green Version]
  15. Sears, L.; Caparelli, J.; Lee, C.; Pan, D.; Strandberg, G.; Vuu, L.; Lin Lawell, C.Y.C. Jevons’ paradox and efficient irrigation technology. Sustainability 2018, 10, 1590. [Google Scholar] [CrossRef] [Green Version]
  16. Food and Agriculture Organization (FAO); Mateo-Sagasta, J. The state of the world’s land and water resources for food and agriculture: Managing systems at risk. In State World’s Land Water Resources for Food and Agriculture: Managing Systems at Risk; Earthscan: London, UK, 2013; pp. 1–285. [Google Scholar] [CrossRef]
  17. McGlade, J.; Farell, C.; Edens, B. Measuring Water Use in a Green Economy. A Report of the Working Group on Water Efficiency to the InternationalResource Panel; United Nations Environment Programme: Nairobi, Kenya, 2012. [Google Scholar]
  18. Berbel, J.; Gutiérrez-Martín, C.; Rodríguez Díaz, J.; Camacho, E.; Montesinos, P. Literature review on rebound effect of water saving measures and analysis of a Spanish case study. Water Resour. Manag. 2015, 29, 663–678. [Google Scholar] [CrossRef] [Green Version]
  19. Loch, A.; Adamson, D. Drought and the rebound effect: A Murray–Darling basin example. Nat. Hazards 2015, 79, 1–21. [Google Scholar] [CrossRef]
  20. Li, H.; Zhao, J. Rebound effects of new irrigation technologies: The role of water rights. Am. J. Agric. Econ. 2018, 100, 1–23. [Google Scholar] [CrossRef]
  21. Song, J.; Guo, Y.; Wu, P.; Sun, S. The agricultural water rebound effect in China. Ecol. Econ. 2018, 146, 497–506. [Google Scholar] [CrossRef]
  22. Zhu, Z.; Ma, H. Multiple principal-agent relationships, corporate-control mechanisms and expropriation through related party transactions: Evidence from China. Int. Res. J. Financ. Econ. 2009, 31, 33–54. [Google Scholar]
  23. Li, Y.; Huang, B. Multiple principal-agent model of SMEs pollution regulation under centralized treatment. J. Netw. 2013, 8, 2063–2070. [Google Scholar] [CrossRef] [Green Version]
  24. Green, E.P. Payment systems in the healthcare industry: An experimental study of physician incentives. J. Econ. Behav. Organ. 2014, 106, 367–378. [Google Scholar] [CrossRef] [Green Version]
  25. Zhao, C.; Pu, Y.; Pan, L. The incentive mechanism of chain-like multiple principal-agent model. Chin. J. Manag. Sci. 2017, 25, 121–131. [Google Scholar]
  26. Administration of Hetao Irrigation District. Irrigation District Introduction. Available online: http://www.zghtgq.com/plus/list.php?tid=43 (accessed on 17 April 2020).
  27. ICID. Register of ICID Heritage Irrigation Structures (HIS). Available online: https://www.icid.org/icid_his1.html (accessed on 17 April 2020).
  28. Yellow River Institute of Research; Hohai University; Inner Mongolia Hydraulic Research Institute; Inner Mongolia Agricultural University. Monitoring and evaluation report of water right pilot project in Shenwu Irrigation Area. Unpublished work. 2018. [Google Scholar]
  29. Inner Mongolia Water Resources Department. Inner Mongolia Water Resources Bulletin 2017; Inner Mongolia Water Resources Department: Hohhot, Mongolia, 2017. [Google Scholar]
  30. Bayannaoer Bureau of Statistics. Bayannaoer Statistical Bulletin on National Economic and Social Development 2017; Bayannaoer Bureau of Statistics: Bayannaoer, Mongolia, 2017.
  31. National Bureau of Statistics. China Statistical Yearbook 2018; National Bureau of Statistics: Beijing, China, 2018.
  32. The World Bank. Cereal Production. 2017. Available online: https://data.worldbank.org/indicator/AG.PRD.CREL.MT (accessed on 17 April 2020).
  33. Food and Agriculture Organization (FAO). The World′s Total Arable Land. 2017. Available online: http://www.fao.org/faostat/en/#data/RL (accessed on 17 April 2020).
  34. Smith, M. CROPWAT: A Computer Program for Irrigation Planning and Management; FAO: Rome, Italy, 1992. [Google Scholar]
  35. Food and Agriculture Organization (FAO). Crop Evapotranspiration for Computing Crop Water Requirement; Food and Agriculture Organization: Rome, Italy, 1998; Volume 56. [Google Scholar]
  36. Shammout, M.a.; Qtaishat, T.H.R.; Rawabdeh, H.; Shatanawi, M. Improving water use efficiency under deficit irrigation in the Jordan Valley. Sustainability 2018, 10, 4317. [Google Scholar] [CrossRef] [Green Version]
  37. Allen, R.G.; Pereira, L.S.; Raes, D.; Smith, M. Crop Evapotranspiration—Guidelines for Computing Crop Water Requirements; FAO: Rome, Italy, 1998; pp. 1–281. [Google Scholar]
  38. Inner Mongolia Water Resources Department. Inner Mongolia self-evaluation report of water right pilot project. Unpublished work. 2018. [Google Scholar]
  39. Li, T.; Sun, M.; Fu, Q.; Cui, S.; Liu, D. Analysis of irrigation canal system characteristics in Heilongjiang province and the influence on irrigation water use efficiency. Water 2018, 10, 1101. [Google Scholar] [CrossRef] [Green Version]
  40. Pokhrel, B.; Paudel, K.; Segarra, E. Factors affecting the choice, intensity, and allocation of irrigation technologies by U.S. cotton farmers. Water 2018, 10, 706. [Google Scholar] [CrossRef] [Green Version]
  41. Liu, F. Study on Benefit Evaluation of Vagetation Protective System in UlanBuh Desert Oasis. Master’s Thesis, Northwest A&F University, Xianyang, China, 2008. [Google Scholar]
  42. Sun, W.; Shi, Q. Game Analysis on the promotion of agricultural water saving technology by combined incentive. Product. Res. 2013, 11, 23–25. [Google Scholar]
  43. Berle, A.A.; Means, G.C. Corporations and the public investor. Am. Econ. Rev. 1930, 20, 54–71. [Google Scholar]
  44. Spence, M.; Zeckhauser, R. Insurance, information, and individual action. Uncertain. Econ. 1971, 61, 380–387. [Google Scholar]
  45. Ross, S.A. The economic theory of agency: The principal′s problem. Am. Econ. Rev. 1973, 63, 134–139. [Google Scholar]
  46. Holmström, B. Moral hazard of observability. Bell J. Econ. 1979, 10, 74–91. [Google Scholar] [CrossRef] [Green Version]
  47. Sappington, D. Limited liability contracts between principal and agent. J. Econ. Theory 1983, 29, 1–21. [Google Scholar] [CrossRef] [Green Version]
  48. Bernheim, B.; Whinston, M. Common marketing agency as a device for facilitating collusion. RAND J. Econ. 1985, 16, 269–281. [Google Scholar] [CrossRef]
  49. Holmstrom, B.; Milgrom, P. Multitask principal-agent analyses: Incentive contracts, asset ownership, and job design. J. Law Econ. Organ. 1991, 7, 24–52. [Google Scholar] [CrossRef] [Green Version]
  50. Laffont, J.-J.; Meleu, M. Reciprocal supervision, collusion and organizational design. Scand. J. Econ. 1997, 99, 519–540. [Google Scholar] [CrossRef]
  51. Mohapatra, S. Complementarities, Constraints and Contracts: Incentive Design and Occupational Choice in China. Ph.D. Thesis, University of California, Davis, CA, USA, 2004. [Google Scholar]
  52. Samuelson, P. A pure theory public expenditure. Rev. Econ. Stat. 1954, 36, 387–389. [Google Scholar]
  53. Savas, E.S. Privatization and Public-Private Partnership; Chatham House: New York, NY, USA, 2000. [Google Scholar]
  54. Ostrom, E. Governing The Commons: The Evolution Of Institutions For Collective Action; Cambridge University Press: Cambridge, UK, 1990; Volume 68. [Google Scholar]
  55. Marwell, G.; Ames, R. Experiments on the provision of public goods; Resources, interest, group size and the free-rider problem. Am. J. Sociol. 1979, 84, 1335–1360. [Google Scholar]
  56. Milgrom, P.; Holmstrom, B. Aggregation and linearity in provision of intertemporal incentives. Econometrica 1987, 55, 303–328. [Google Scholar]
  57. Pratt, J. Risk Aversion in the small and in the large. Econometrica 1964, 32, 122–136. [Google Scholar]
  58. Chen, F. Salesforce incentives, market information and production/inventory planning. Manag. Sci. 2005, 51, 60–75. [Google Scholar]
  59. Laffont, J.J.; Martimort, D. The Theory of Incentives: The Principal-Agent Model; Princeton University Press: Princeton, NJ, USA, 2009; pp. 1–421. [Google Scholar]
  60. Adams, E. Models of Man Social and Rational. Mathematical Essays on Rational Human Behavior in a Social Setting. J. Philos. 1962, 59, 177–182. [Google Scholar]
Figure 1. The geographical location of the Shenwu Irrigation Area.
Water 12 03142 g001
Figure 2. Spatial distribution of new irrigation areas in the Shenwu Irrigation Area between 2010 and 2015.
Water 12 03142 g002
Figure 3. Principal–agent structure of heterogeneous stakeholders in the irrigation efficiency paradox.
Water 12 03142 g003
Figure 4. Relationship between the actual water-saving amount and expected utility of each stakeholder.
Water 12 03142 g004
Figure 5. The relationship between newly added irrigation area and participation benefits of the pure agent and intermediary.
Water 12 03142 g005
Figure 6. (a) The relationship between risk aversion degree and the intermediary’s expected utility. (b) The relationship between risk aversion degree and the pure agent’s expected utility.
Water 12 03142 g006
Table 1. Comparison of economic and social indicators in the Shenwu Irrigation Area.
IndicatorsShenwu Irrigation Area [29,30]China [31]World [32,33]
Arable land per capita (ha)0.540.100.18
Water resources per capita (m3)234.422074.505932.19
GDP per capita (USD)5687882710,714
Grain yield per capita (tons)3.210.480.39
Table 2. Main parameters of the dual principal–agent model.
ParameterParameter Setting
α Fixed incentive coefficient of a principal to an agent
β m Incentive coefficient of the local government for the water-saving amount of the Irrigation District Management Unit
β f Incentive coefficient of the Irrigation District Management Unit for the water-saving amount of the Rural Water Cooperation Organization
π m The output of the Irrigation District Management Unit
π f The output of the Rural Water Cooperation Organization
μ The marginal benefit of an agent’s water-saving
b Cost coefficient of an agent
ρ Coefficient of absolute risk-aversion
θ Exogenous random variables of an output function
δ 2 The variance of exogenous random variables of an output function
Q f Water-saving amount of the Rural Water Cooperation Organization
Q m Water-saving amount of the Irrigation District Management Unit
h m Benefits of the Irrigation District Management Unit not participating in the irrigation water-saving process
h f Benefits of the Rural Water Cooperation Organization not participating in the irrigation water-saving process
S m Output sharing incentive of the local government to the Irrigation District Management Unit
S f Output sharing incentive of the Irrigation District Management Unit to the Rural Water Cooperation Organization
O i Crop yield per unit area
P a Crop price per unit area
P w Irrigation water price
Publisher’s Note: MDPI stays neutral with regard to jurisdictional claims in published maps and institutional affiliations.

