Article

High-Frequency Stable-Isotope Measurements of Evapotranspiration Partitioning in a Maize Field

1
Centre for Water Resource Systems, TU Wien, Karlsplatz 13, 1040 Vienna, Austria
2
Institute of Hydraulic Engineering and Water Resources Management, TU Wien, Karlsplatz 13/222, 1040 Vienna, Austria
3
Soil and Water Management and Crop Nutrition Subprogramme, Joint FAO/IAEA Division of Nuclear Techniques in Food and Agriculture, International Atomic Energy Agency (IAEA), 1400 Vienna, Austria
4
Institute for Land and Water Management Research, Federal Agency for Water Management, Pollnbergstrasse 1, 3252 Petzenkirchen, Austria
*
Author to whom correspondence should be addressed.
Water 2020, 12(11), 3048; https://doi.org/10.3390/w12113048
Submission received: 13 September 2020 / Revised: 20 October 2020 / Accepted: 28 October 2020 / Published: 30 October 2020
(This article belongs to the Section Water, Agriculture and Aquaculture)

Abstract

:
Knowledge of the evaporation (E) and transpiration (T) components of evapotranspiration (ET) is important for ecohydrological modeling and agricultural productivity. The stable-isotope method offers the possibility to partition E and T due to the distinct differences in the isotopic signals of the sources. In this study, the concentration and isotopic ratios for oxygen-18 (18O) of water vapor in the ecosystem boundary layer of a growing maize field at the Hydrological Open Air Laboratory (HOAL) catchment in Austria were measured using a high-frequency field-sampling device. In conjunction with isotope samples from the soil and maize plants, these data were used to partition ET using the Keeling plot technique. Eddy covariance and sap flow measurements were used to provide a comparison to test the stable-isotope method. The fraction of transpiration (Ft) calculated with the stable-isotope method showed good agreement with the sap flow method. Overall daily average values of Ft were in a range from 43.0 to 88.5% with T accounting for an average value of 67.5% of the evapotranspiration over the nine days of the experimental period. Following a precipitation event of 9.7 mm, Ft increased from 63.4 to 88.5% over the next four days as the upper layer of the soil dried out while the plants accessed deeper soil water.

1. Introduction

Evapotranspiration (ET) is one of the most important processes in describing land surface–atmosphere interactions as it connects the energy and water balances [1]. Furthermore, knowledge of the individual components of evapotranspiration is important for ecohydrological modeling and agriculture, particularly for irrigation efficiency and crop productivity. In arid and semiarid regions agricultural productivity is directly linked to water availability, resulting in a competition for water resources in regions where there is also a high human population density [2]. To reduce the stress placed on the water supply, it is of great importance to achieve a high level of irrigation efficiency, to ensure that water supplied to the crops has less loss via evaporation from the soil.
Common methods for making measurements of transpiration (T) and soil evaporation (E), such as sap flow sensors [3,4,5] and lysimeters [6,7], are limited to individual plants or small footprints, which can lead to difficulties in upscaling in heterogeneous environments [8]. Methods that make an integrated measurement with a much larger footprint at the field scale such as eddy covariance, Bowen ratio, or scintillometry are only able to measure the total ET and provide implicit information on E and T. These methods are also generally unsuitable for use inside plant canopies as they need to be a minimum height above the surface [9] and require minimum levels of turbulence intensity, which is strongly reduced within a closed canopy. Hence, a supplementary method must be used in conjunction with the field-scale measurement to partition the ET. Different types of methods have been developed such as Lagrangian dispersion analysis [10], flux variance similarity partitioning [11], and stable isotope partitioning [12,13,14,15].
Stable isotopes of oxygen from soil water and plant stomata allow for the possibility to partition the evapotranspiration measured at the field scale. Water vapor evaporated from a macropore in the soil will have a lower ratio of heavy to light isotopes than the water it evaporated from, as lighter isotopes evaporate faster. For a plant at isotopic steady state (ISS), it is assumed the water transpired from the stomata is equal to that of the source water taken up by the plant’s roots, with no fractionation occurring during evaporation due to the small pore size of the stomata [16,17,18,19]. As a result, the water vapor transpired by the plant has a distinctly different isotopic signal to the water evaporated from the soil, meaning the transpiration–evaporation ratio can be determined using the Keeling plot mass balance equation for the ecosystem [12,13,20]. In recent years, nonsteady state conditions have been reported in several studies, especially under short time scales [14,21]. However, most of these studies showed that the steady state conditions can still be met in the afternoon [21,22,23]. This current study was based on data collected in the late morning and afternoon; the steady state was being assumed.
Technological advances in recent years with the development of continuous, high-frequency, in situ measurement devices have allowed for further testing and application of stable-isotope methods in a wider variety of conditions, including grassland [11,14,24], wheat [2], fescue [25], rice [26], soybean [27], and woodland [28]. These studies showed the applicability of the stable-isotope method, while highlighting the effects of ecosystem conditions on the measurement principle. Maize is a major crop in many regions of the world and correct determination of its T/ET ratio, i.e., fraction of transpiration (Ft), is of great importance in regions with low precipitation and/or high evapotranspiration rates in order to achieve a high crop water uptake. During its growing period, the characteristics of the maize ecosystem change from an open to a closed canopy as leaf area index (LAI) increases. However, its physiology and row structure result in a different canopy architecture than other crops, with a high variability in surface soil moisture and evaporation [29].
The goals of this paper were (1) to test the stable-isotope method for maize during its vegetative stage using sap flow measurements, (2) to investigate the changes in Ft during the course of the experiment due to the environmental controls, and (3) to test if the isotope approach for estimating Ft performs better than the sap flow method during the vegetative growing stage. In this experiment, we made high-frequency measurements of the isotopic composition of the atmospheric water vapor inside a maize canopy to study the variation of E and T during the vegetative growing stage of the maize crop in response to precipitation events.

2. Materials and Methods

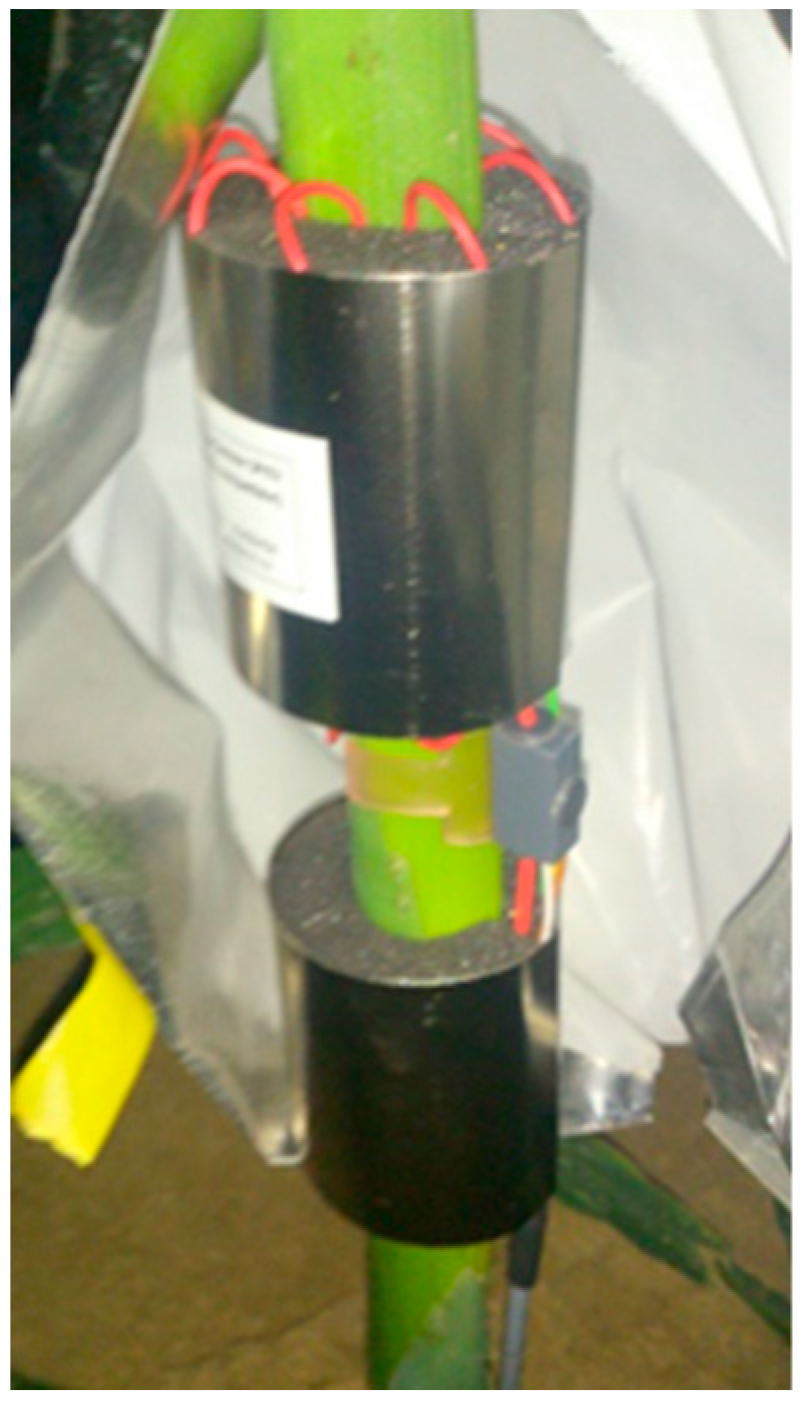
2.1. Stable-Isotope Method

All isotope measurements in this work are expressed as the ratio of heavy to light isotopes relative to the international standard and written in (δ) notation in per mil (‰)
δ = R s a m p l e R s t a n d a r d R s t a n d a r d
where Rsample is the molar ratio of the sample and Rstandard is the Vienna Standard Mean Ocean Water (V-SMOW). The division of the bulk evapotranspiration as measured by the eddy covariance method is calculated by [19]
F T ( % ) = δ E T δ E δ T δ E
where FT (%) is the fraction of the evapotranspiration due to transpiration (T/ET × 100), δET is the isotopic composition of the evapotranspiration water vapor, δE is the isotopic composition of the evaporated soil water, and δT is the isotopic composition of the transpired water vapor. δE and δT can be estimated by sampling the soil and vegetation while δET is determined using a Keeling mixing model approach, which is based on a mass balance equation for the ecosystem
δ e b l = C a ( ( δ a δ E T ) ( 1 C e b l ) + δ E T )
where δebl is the isotopic composition of the ecosystem boundary layer water vapor, Ca the concentration of water vapor in the atmosphere, δa the isotopic composition of the atmospheric water vapor, and Cebl is the concentration of the water vapor in the ecosystem boundary layer. As this is a linear relationship, if we measure the isotope ratio and concentration of the air at different heights within the canopy and then plot the isotope ratio versus the inverse of the concentration, the resulting y-intercept is an estimate of δET [12,19]. Tiso (transpiration calculated using the stable-isotope method) and Eiso (soil evaporation calculated using the stable-isotope method) can then be calculated using Ft from Equation (2) if the ET is also measured.
The Craig–Gordon model [30] can be used instead to estimate the effects of kinetic and equilibrium fractionations on liquid water in the soil as it evaporates
R E = ( 1 α K ( R s / α * ) R a h 1 h )
where RE is the molar ratio of heavy to light isotopes of the evaporated water, αK is the kinetic fraction rate, taken to be 1.0189 ‰ [16], Rs is the ratio of liquid water in the soil at the evaporating front, Ra is the ratio of atmospheric air from near the surface, h is the relative humidity normalized by the saturation pressure at the surface, and α* is the equilibrium fractionation factor calculated as a function of temperature Tk (K) [31].
α * = ( 1.137 × 10 6 T k 2 0.4156 3 T k 2.0667 )

2.2. Experimental Site

The experiment was performed at the 66-ha Hydrological Open Air Laboratory (HOAL) research catchment located at Petzenkirchen, Austria [32]. The site has a mean annual air temperature of 9.5 °C and receives on average 823 mm of precipitation per year. The evapotranspiration measured using an eddy covariance device over grassland at the center of the catchment from 2013–2016 for the month of June ranged from 64.9–72.5 mm, with an average of 69.1 mm. Average total net radiation at the weather station for the month of June was 192 kWm−2. An eddy covariance (EC) system and a stable-isotope analyzer along with supporting meteorological sensors were installed within a 4.8-ha maize field from 24 June–2 July 2014. Because of the size of the maize field and the limited fetch, the devices were installed to take advantage of the westerly prevailing wind, giving a minimum fetch of 100 m except in the southeast quadrant. At the beginning of the experiment the maize was approximately at stage V7 in its development, progressing to V11/V12. This is a period of rapid growth for maize; the maize had an average height of 0.95 m at the beginning of the experiment and during the course of the experiment it increased to 1.40 m. The average LAI was approximately 1.8 based on canopy cover taken above the maize canopy, growing from 1.2 to 2.4 over the period of the experiment.

2.3. Isotope Measurements

This section describes how to determine values for δET, δT, and δE in order to calculate Ft using Equation (2). In order to obtain a value for δET using Equation (3), a profile of the concentration and stable-isotope ratio of 18O of the water vapor within and above the plant canopy was measured. The δebl and Cebl were sampled at four heights within the canopy (0.1, 0.2, 0.5, and 1.0 m), and two additional sample intakes were located above the canopy (1.7 and 2.4 m). The ports at heights 0.5 and 1.0 m were later increased to 0.8 and 1.2 m on 1 July due to the increase in canopy height. Air was sampled through the intakes consecutively using a pump connected to a 6-port valve and analyzed at 1 Hz using a L2130-i analyzer (Picarro, Santa Clara, CA, USA) installed nearby. The sensor requires an averaging time of at least 100 s to achieve a precision of 0.02‰, which resulted in an average cycling period of 20 min between the six ports for this experiment, and a 20-min resolution in estimates of δET.
The δT can be measured directly using a leaf chamber. However, as one was not available for this experiment, δT was estimated from xylem water taken from four maize plants, sampled between 11–14 h on each day of the experiment. The application of the stable-isotope method was, thus, limited to times when the ISS assumption was valid, i.e., midday or afternoon. As a large number of soil gas chambers are required to obtain a direct measure and obtain a spatially averaged value of δE, it was instead estimated using Equation (4). Soil samples were taken daily at four locations near the air intake, at depths of 0–2, 2–5, and 5–10 cm in order to correctly identify the evaporation front according to Rothfuss et al. [25]. All soil and plant samples were sealed in glass vials, frozen, and then transported to a laboratory for extraction. The samples were first chilled using a commercial immersion cooler and Dewar container to prevent water losses and then heated to 100 °C and distilled in batches of 15 samples using a heating block for two hours before being transferred to a collection vial using an evacuation pump and analyzed with the L2130-i analyzer. Standard deviations of the 20-min values for δE and δET were calculated from the range of measurements for each day, to check for the effects of changes in the water vapor composition.

2.4. Micro-Meteorological Instrumentation

Evapotranspiration from the field was measured using an integrated open path eddy covariance sensor (IRGASON, Campbell Scientific, Logan, UT, USA). The device was installed in the middle of the maize field to the north of the weather station tower on a tripod at a height of 2.20 m before the experiment and it was later moved to a height of 2.80 m during the early morning of 1 July to stay above the minimum height limit described by [33] while keeping the sensor footprint as small as possible.
The sensor was oriented facing down a slight slope at an angle of 260° from true north to point into the prevailing wind direction. Raw data measurements of the three-dimensional wind speed and water vapor density were acquired at 20 Hz and stored on a CR3000 datalogger (Campbell Scientific, Logan, UT, USA). The latent and sensible heat fluxes were calculated offline using the Eddy-Covariance Software TK3 from Bayreuth University [34]. A coordinate rotation and a number of corrections were applied to the raw covariances as part of the processing procedure to account for limitations of the instrumentation: (1) A double rotation of the coordinate system. This was preferred to the planar fit method because of the rapid growth of the maize crop. (2) The sensible heat flux was corrected for the sonic air temperature. (3) The WPL correction for density fluctuations [35]. (4) The Moore correction for frequency response [9]. The results were quality controlled using a routine implemented in the TK3, and low-quality data for the sensible and latent heat flux were removed. No gap filling of missing data was performed due to the relatively short nature of the experiment and as the majority of missing data values for the latent heat flux occurred at nighttime or during precipitation events.
The incoming shortwave solar radiation and the net radiation were measured using a CNR4-net radiometer (Kipp and Zonen, Delft, Netherlands). Measurements were made every 5 s and averaged over a period of 30 min for comparison with the eddy covariance data. A soil moisture station was located in the maize field to measure the soil temperature and water content at depths of 0.05, 0.10, 0.20, and 0.30 m (Figure 1).

2.5. Sap Flow Measurements

In order to have a control for Ft, T and E calculated using the stable-isotope method, and eddy covariance device, the sap flow of 10 maize plants was measured and then upscaled. The sap flow was measured using EMS 62 (EMS Brno, Brno, CZ) sensors based on the stem heat balance method with external heating and internal temperature sensing [36,37] (Figure 2). Two thermocouples were inserted into the stem in the radial direction 15 cm apart, and a system of linear heating elements was installed just below the upper thermocouple to supply heat to the water traveling up the stem. The temperature difference between the heated and nonheated thermocouples was then maintained at 4 K using the feedback loop of the EMS 62 module. The input power supplied was then directly proportional to the amount of water passing the sensor. The sap flow rate was then calculated using
P = Q d T c w + d T z
where P is the supplied power (W), Q is the sap flow rate (kg s−1), dT is the temperature difference, cw is the specific heat of water (J kg−1 K−1), and z is a coefficient representing heat losses from the sensor (W K−1). The heat losses were calculated and removed by analyzing the baseline measurement of the device during periods where there was no sap flow, e.g., a precipitation event or at night, and subtracting this from the measurement. Measurements were made every minute and 10-min averages were saved by the datalogger. The sap flow rates were then upscaled to transpiration values. The upscaling method was based on discussion with Jiri Kucera (private communication). By sampling the plants in the field, we can estimate the representative plant stem diameter for the field, and then calculate the representative plant transpiration rate. The upscaled field T was then calculated by multiplying the representative plant transpiration by the plant density. Owing to the rapid growth of the plants during this period, some of the thermocouples became dislodged, affecting the quality of the measurements. Therefore, these sensors were not included, leaving four sensors for the final analysis.

3. Results

3.1. Environmental Conditions

The experiment was performed over a 10-day period at the beginning of the summer season. Figure 3 and Figure 4 show the environmental conditions over the course of the experiment. Wind speeds were generally low, ranging from close to zero at night to a maximum of 3.6 m s−1. Precipitation was recorded on four days of the experiment. A significant event occurred on the afternoon of the 25 June, 9.7 mm, followed by a drying period until 30 June. During this dry period the vapor pressure deficit (VPD) increased to a maximum of 2400 Pa on 28 June. The precipitation event on 30 June (14.3 mm) was preceded by a change in air mass, resulting in a significant decrease in temperature and VPD. After the event, the temperature and VPD increased again, resulting in similar conditions to the previous days. The event on 30 June led to an increase in soil moisture from 17.2% to 22.6%, while the event on 25 June resulted in an increase from 17.9% to 19.0%. Mean daily air temperatures during the experiment varied between 14.2–20.0 °C. Average mean daily air temperature for this growing period for maize (14 June–14 July) at the catchment is 18.9 °C. Daily totals of evapotranspiration ranged from 1.6 to 3.4 mm with a total amount of 23.2 mm measured during the experimental period. Daily values of ET were closely related to solar radiation (Rs) and VPD, with the largest values of ET corresponding to the days with the greatest amounts of Rs and highest VPD.

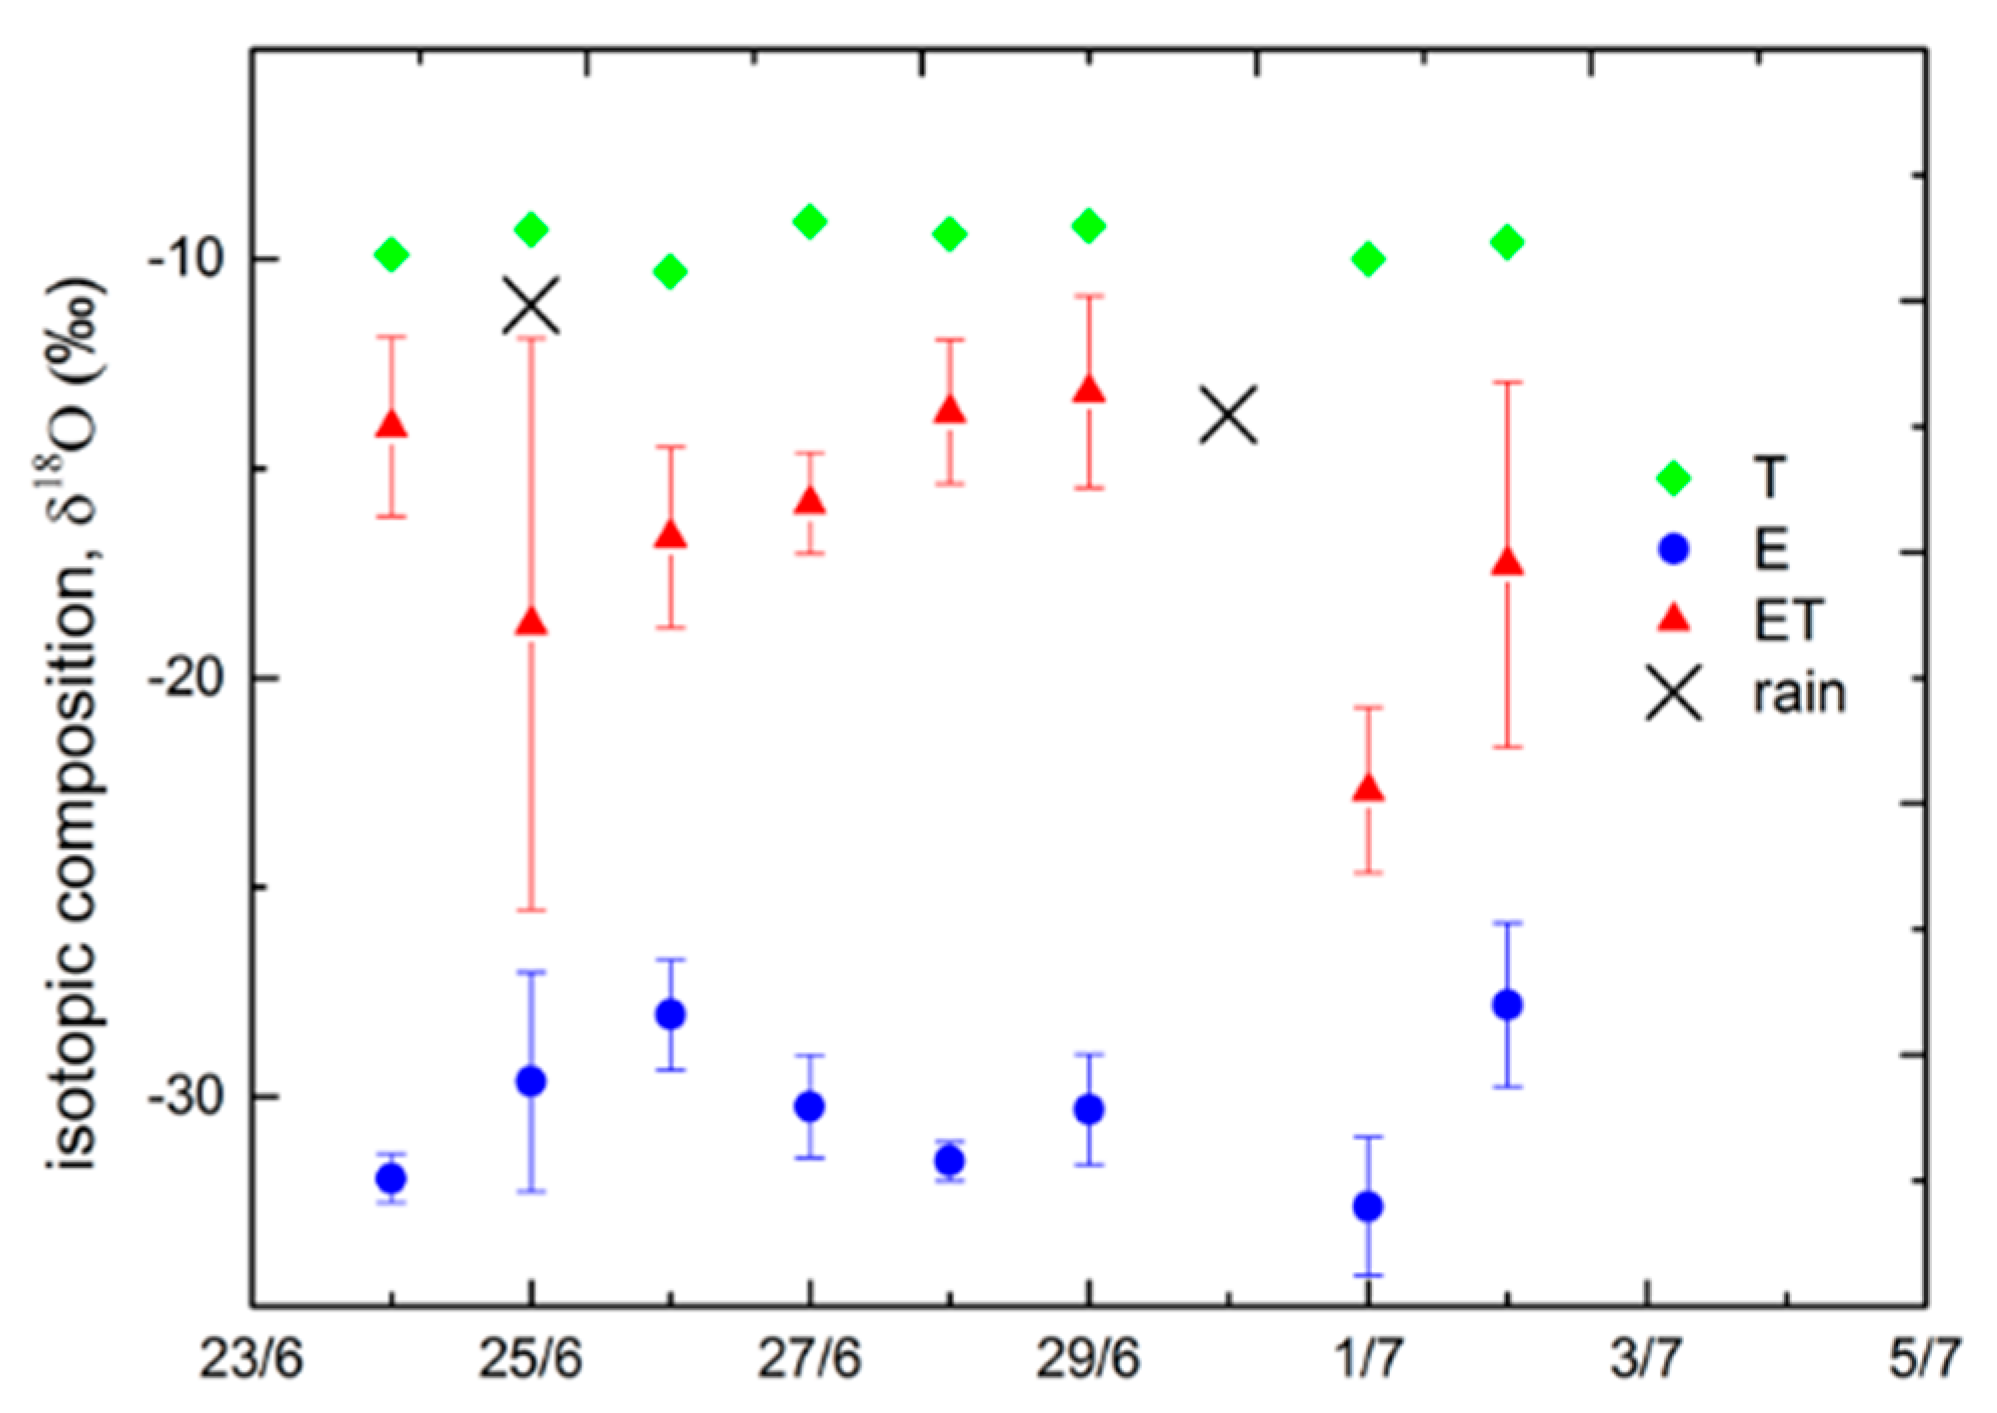
3.2. Isotope Results

The δ18O composition (black line), as well as the concentration of the water vapor (blue line), over the whole experimental period is shown in Figure 5. Distinct differences in average daily isotopic composition can be seen between δE and δT with δE being substantially more depleted in heavy isotopes compared to δT (Figure 6). The δT showed little change during the experimental period, varying between −9.1 and −10.3‰. The precipitation events on 25 June and 30 June had δ18O values of −11.1 and −13.7‰, respectively, and may be responsible for a slight decrease of approximately 1‰ in δT for the following day. The average daily value of δET decreased to −18.7‰ following the precipitation event on 25 June due to the addition of the rainwater and then steadily increased over the next days to −13.2‰ on 29 June. Large values of the standard deviation were observed on 25 June and 2 July when a rain shower occurred during the afternoon measuring period. Measurements from and directly after precipitation events were excluded from the analysis to exclude the effects of interception evaporation. One the afternoon of 29 June there was a large decrease in the value of δ18O resulting from the movement of an atmospheric air mass. As the Keeling plot requires any changes in isotopic ratio to be caused by sources within the system, data from this time period may not be used. The large gradients in the profiles of atmospheric water vapor concentration and isotope ratio allowed the application of the Keeling plot method on each day of the experimental period, with the exception of 30 June because of the sustained precipitation event.
Twenty-minute values of Ft were calculated for late morning (to allow the plant to reach ISS)—afternoon times periods (Figure 7). Ft values followed a trend of decreasing to a minimum value following a precipitation event, followed by an increase in Ft over the following days. The daily average value of Ft was 67.5% for this period. It was possible to split the experiment into two periods showing a similar pattern of increasing Ft, demarcated by the two large precipitation events on 25 and 30 June. During these periods, Ft followed an inverse relationship with the soil moisture measured at 5 cm in depth; as the soil moisture increased, Ft decreased, and vice versa, as the amount of water available to be evaporated in the soil decreased.

3.3. Technique Comparison and Environmental Controls

Owing to the need for at least 30 cm of stem to install the sap flow sensors, the devices were installed close to the ground, leading to an overestimation in the measured sap flow because of the presence of a strong temperature gradient near the surface on certain days. By comparing near-surface temperature measurements of the soil (2-cm depth) made as part of the soil moisture measurement and an air temperature reading inside the canopy as part of the sap flow system (~30 cm), differences of up to 10 °C (versus 6 °C on the ‘acceptable’ days) were found on the days when the sap flow T also appeared to be overestimated. As this led to an overestimation in calculated T, two days, 26 June and 2 July, when this effect was not noticed were chosen for a comparison with the stable-isotope data. The uncertainty on the Tiso estimates was calculated using the single-isotope, two-source mixing model of [38], an estimate for the uncertainty of the eddy covariance measurement based on the net radiation [39] and Equation (2), while the uncertainty of the transpiration calculated using the sap flow sensors (Tsap) was the standard error of the devices. The results showed that the two methods compared favorably, with both Tiso and Tsap showing a similar pattern on both days (Figure 8) and R2 values of 0.80 for 26 June and 0.72 for 2 July.
On 26 June, the value of Tiso increased steadily during the late-morning period with Ft increasing from 29% to an almost constant value of 70% in the later afternoon. Both Tiso and Eiso were driven by Rs (Figure 9a) with Tiso showing little influence from VPD (Figure 9b). On 2 July, temperatures were in the range of 12.0–22.9 °C. The incoming solar radiation was heavily affected by the presence of clouds in the late afternoon, with a peak value of 973 Wm−2 measured around 10:30 before reducing to 50–100 Wm−2 after 15:00. Tiso followed a similar pattern on the late morning and early afternoon of 2 July (Figure 9b). However, in the late afternoon it started to decrease because of the effect of a small rain shower increasing the amount of water available for E and a decrease in solar energy due to clouding, with Ftiso decreasing from 92.9–17.1% during this period.
Figure 10 shows the comparison between E and T calculated from the isotope method versus Rs and VPD for the entire experimental period. T shows a moderate correlation with Rs and VPD while E shows a moderate correlation only with Rs and no correlation with VPD.

4. Discussion

Using high-frequency isotope measurements and sap flow devices, we were able to test the ability of the stable-isotope method to partition the field-scale evapotranspiration measured from a maize crop by the eddy covariance method. In general, the results shown here indicate that the method can be applied to maize crops, with similar estimates of Ft being made by the stable-isotope method in comparison with the sap flow method. Due to the higher time resolution afforded by the use of high-frequency measurements, we are able to see the change in Ft throughout the day and the response of Ft to the environmental conditions, enabling a more detailed comparison between the two methods as compared to the previous sap flow comparison made by Williams [13] for an olive orchard where it was only possible to get two values for Ft per day. While the results showed good agreement between the methods, the sap flow method suffered from a number of limitations because of the growth of the maize. Many sensors were disturbed as the rapid growth of the maize plants proved an issue with these particular sensors, as the lower part of the stem stretched, disrupting the installation of the thermocouple needles. The amount of good quality data was thus reduced and led to a larger uncertainty in Tsap. In addition, the amount of stem required for installation means that the sensors cannot be installed for the full growing period of the crop.
The main assumptions of the stable-isotope technique, that the plant’s water was being transpired at isotopic steady state, that there was no loss of water due to condensation, and that there were only two sources for the water vapor in the ecosystem, mean that it was not possible to analyze Ft over the entire diurnal cycle as condensation was present every morning during the experimental period [19]. However, it can be seen from the eddy covariance and sap flow data that T was minimal during the night and early morning. In Figure 8 we see quite good agreement on 26 June between the two methods throughout the day, while on 2 July there were greater differences in T, particularly during the later parts of the morning. This might suggest that there was some fractionation occurring and the ISS assumption did not hold during this period. In future experiments direct measurements of δT and δE should be made using chamber methods to reduce the uncertainty and extend the available data period to the morning and evening. Interception was also neglected as it was difficult to estimate which may affect the values of Ft on 25 June and 2 July directly following the precipitation. The method cannot be applied successfully during periods of precipitation as the presence of the rain drops results in large measured values of δebl, leading to values of Ft exceeding 1, also seen by Wei [26] for a rice paddy field during periods of irrigation. By expanding the experimental setup to include an additional intake port for sampling of precipitation, it would be possible to directly determine the time periods when interception water is present and evaporating and exclude them from the full analysis to reduce the uncertainty in Ft. This process would also be necessary for detecting the presence of dew or fog if the measuring period is extended beyond the late morning and afternoon using chamber devices. As the Keeling plot requires distinct differences in the isotopic signals of T and E, the applicability of the technique can be affected by the depth of root water uptake. If the plants have short root systems such as shrubs or herbs and/or the soil becomes very dry, the difference in the signals may decrease, leading to regression plot slopes that are not significant [19]. As maize does not uptake water among all rooting depths equally but extracts a larger percentage of water from shallower roots, the use of the method may be limited during the early stages of growth. The sampled values of δT were, however, at least 2‰ more depleted than samples of the soil water, indicating the majority of the roots were accessing water below the soil evaporation front. As the air was sampled at different heights within the canopy, the Keeling plot method spatially integrated the flux over different footprints. Hence, in canopies such as trees [12] or grassland [21] a comparison of the point samples of plant and soil isotopic composition to that of the canopy evapotranspiration value can be made. Within a canopy with a regimented architecture such as maize, however, it may not be sufficient to, as [29] showed that the amount of rainfall that reaches the surface in maize is highly variable. For the stable-isotope method it is also important that the canopy is not fully closed, as this will inhibit mixing. During the experiment, the average height of the crop increased from 0.95 m to 1.40 m, while the average LAI increased from 1.2 to 2.4. In a paper on the canopy architecture of maize [40], Huang measured canopy openness in a field with a similar plant density as ~50% at the upper layer of the canopy at the silking stage, which is a later stage of development than when our experiment took place (15–20 days later), when the plants will have a height over 2 m and a LAI greater than 4. The good level of agreement between the sap flow and isotope results, though, here indicates that the isotope method was successfully applied to maize.
The transpiration rate of maize has up until now been investigated using point measurement instruments that require upscaling to the field scale. Using lysimeters, [6] and [7] reported values of 71 and 75% for Ft for the entirety of the growing stage. The average value of Ft for this experimental period was 67.5%. As the experiment took place during a short time period within the vegetative stage (length of approximately 25–40 days), these differences will be partially due to the changing LAI and soil cover during this period, as well as differences in irrigation/precipitation. Our study provides information for when the soil in a maize crop field has been wetted and begins to dry out; while we only had 10 days, there was a soil moisture cycle of dry–wet–dry–wet. Ft followed a pattern of decreasing following a rain event and then increasing over the following days as the top layer of the soil dried out, reducing the amount of water available for further E, consistent with the findings of [12] and [41] for mesquite and maize. Daily average values of Ft varied between 43.0 and 88.5%, indicating that there was a considerable effect due to the precipitation events. One of the main points of this experiment was to focus on the rapid-growth phase of maize, when the maize is rapidly changing. While the meteorological conditions remained representative, the transpiration dynamics at this distinct growth phase of the maize were captured for the case of wetted soil. During periods where meteorological conditions lead to high rates of ET without a wetting of the soil, T can be expected to approach 90% and greater and care must be taken when using average values for Ft calculated over longer periods during the growing season.
T was correlated with solar radiation and VPD over the growing period, with correlation coefficients of 0.68 and 0.59, respectively. However, Klimešová et al. [4] reported a much higher correlation, of 0.88, with Rs for a potted maize experiment during a slightly later growing stage. This may be due to the relatively frequent precipitation events and lower amount of E expected from a potted experiment, leading to more energy being available for T and a higher correlation. During a three-day, intensive sampling period during that experiment, with soil moisture close to field capacity, the correlation with Rs was significantly lower and closer to the values measured here at 0.65. Other long-term studies on the sap flow rate of maize found for the entire growing season also ranked Rs as the most important meteorological variable affecting the rate of transpiration of maize [42,43]. The lack of correlation of E with VPD was unexpected, as a high correlation has been previously reported for both trees [13] and grassland [24] using stable-isotope methods. However, for maize, a lack of correlation has been observed before on certain days using lysimeters [44]. An explanation may be attributable to the spaced-row structure of maize crops, which results in the fraction of radiation intercepted by the canopy having a ‘U’-shaped diurnal pattern with the minimum occurring around midday [45]. This will lead to the soil receiving more energy at this time, resulting in higher values of E than later in the afternoon, when VPD is highest.

5. Conclusions

In this experiment, we tested the application of the stable-isotope method to a maize crop during the vegetative stage, using sap flow sensors as a comparison technique. Field-scale ET was measured using an eddy covariance device and then partitioned using high-frequency, in situ measurements of the isotopic signal of the canopy water vapor. Keeling plots were used to generate values of δET and combined with estimates of δT obtained from plant samples assuming ISS and estimates of δE using soil samples and the Craig–Gordon equation. High correlation coefficient values were found between the two techniques, indicating the stable-isotope method can successfully be applied in maize. While the method has previously been shown to work well for crops with simpler canopy structures such as rice and wheat, it appears that the more complex canopy structure of maize does not limit the accuracy of the method. During the experiment, the amount of E and T was dependent on the availability of soil water in the upper layer of the soil, with a general pattern of a large decrease following a precipitation event followed by a period of increasing, due to the drying out of the upper layer of the soil. The diurnal patterns of both E and T were much better correlated with solar radiation than with VPD.
With the extension of the measurement period, the stable-isotope method can be used to test irrigation and soil management practices at the field scale over the entire growing season in maize and similar crops, leading to more efficient agricultural water use and water availability.

Author Contributions

Conceptualization, P.H., G.B., and L.H.; methodology, P.H. and L.H.; validation, P.H. and L.H.; formal analysis, P.H.; resources, M.O.; data curation, P.H. and L.H.; writing—original draft preparation, P.H.; writing—review and editing, P.H., L.H., and J.P.; supervision, G.B. and P.S.; project administration, M.O. All authors have read and agreed to the published version of the manuscript.

Funding

This research was funded by the Austrian Science Foundation as part of the Vienna Doctoral Programme on Water Resource Systems (DK Plus W1219-N22).

Acknowledgments

The authors would like to thank the staff of the IAEA soil sciences unit for their assistance during this experiment. Open Access Funding by the Austrian Science Fund (FWF).

Conflicts of Interest

The authors declare no conflict of interest.

References

  1. Bastiaanssen, W.G.M.; Pelgrum, H.; Wang, J.; Ma, Y.; Moreno, J.F.; Roerink, G.J.; van der, W.T. A Surface Energy Balance Algorithm for Land (SEBAL): Part 2 validation. J. Hydrol. 1998, 212, 213–229. [Google Scholar] [CrossRef]
  2. Zhang, Y.; Shen, Y.; Sun, H.; Gates, J. Evapotranspiration and its partitioning in an irrigated winter wheat field: A combined isotopic and micrometeorologic approach. J. Hydrol. 2011, 408, 203–211. [Google Scholar] [CrossRef]
  3. Kelliher, F.M.; Köstner, B.M.M.; Hollinger, D.Y.; Byers, J.N.; Hunt, J.E.; McSeveny, T.M.; Meserth, R.; Weir, P.L.; Schulze, E.D. Evaporation, xylem sap flow, and tree transpiration in a New Zealand broad-leaved forest. Agric. For. Meteorol. 1992, 62, 53–73. [Google Scholar] [CrossRef]
  4. Klimešová, J.; Stŕedová, H.; Stŕeda, T. Maize transpiration in response to meteorological conditions. Contrib. Geophys. Geod. 2014, 43, 225–236. [Google Scholar] [CrossRef] [Green Version]
  5. Zhou, S.; Liu, W.; Lin, W. The ratio of transpiration to evapotranspiration in a rainfed maize field on the Loess Plateau of China. Water Sci. Technol. Water Supply 2017, 17, 221–228. [Google Scholar] [CrossRef] [Green Version]
  6. Liu, C.; Zhang, X.; Zhang, Y. Determination of daily evaporation and evapotranspiration of winter wheat and maize by large-scale weighing lysimeter and micro-lysimeter. Agric. For. Meteorol. 2002, 111, 109–120. [Google Scholar] [CrossRef]
  7. Kang, S.; Gu, B.; Du, T.; Zhang, J. Crop coefficient and ratio of transpiration to evapotranspiration of winter wheat and maize in a semi-humid region. Agric. Water Manag. 2003, 59, 239–254. [Google Scholar] [CrossRef]
  8. Ehleringer, J.; Field, C. Scaling Physiological Processes: Leaf to Globe; Physiological Ecology Academic Press: San Diego, CA, USA, 1993; p. 388. [Google Scholar]
  9. Moore, C.J. Frequency response corrections for eddy correlation systems. Bound. Layer Meteorol. 1986, 37, 17–35. [Google Scholar] [CrossRef]
  10. Raupach, M.R. Applying lagrangian fluid mechanics to infer scalar source distributions from concentration profiles in plant canopies. Agric. For. Meteorol. 1989, 47, 85–108. [Google Scholar] [CrossRef]
  11. Good, S.P.; Soderberg, K.; Guan, K.G.; King, E.; Scanlon, T.M.; Caylor, K.K. δ2H isotopic flux partitioning of evapotranspiration over a grass field following a water pulse and subsequent dry down. Water Resour. Res. 2014, 50, 1410–1432. [Google Scholar] [CrossRef]
  12. Yepez, E.A.; Williams, D.G.; Scott, R.L.; Lin, G. Partitioning overstory and understory evapotranspiration in a semiarid savanna woodland from the isotopic composition of water vapor. Agric. For. Meteorol. 2003, 119, 53–68. [Google Scholar] [CrossRef]
  13. Williams, D.; Cable, W.; Hultine, K.; Hoedjes, J.; Yepez, E.; Simonneaux, V.; Er-Raki, S.; Boulet, G.; de Bruin, H.; Chehbouni, A.; et al. Evapotranspiration components determined by stable isotope, sap flow and eddy covariance techniques. Agric. For. Meteorol. 2004, 125, 241–258. [Google Scholar] [CrossRef]
  14. Wang, L.; Niu, S.; Good, S.P.; Soderberg, K.; McCabe, M.F.; Sherry, R.A.; Luo, Y.; Zhou, X.; Xia, J.; Caylor, K.K.; et al. The effect of warming on grassland evapotranspiration partitioning using laser-based isotope monitoring techniques. Geochim. Cosmochim. Acta 2013, 111, 28–38. [Google Scholar] [CrossRef] [Green Version]
  15. Sutanto, S.J.; Wenninger, J.; Coenders-Gerrits, A.M.J.; Uhlenbrook, S. Partitioning of evaporation into transpiration, soil evaporation and interception: A comparison between isotope measurements and a HYDRUS-1D model. Hydrol. Earth Syst. Sci. 2012, 16, 2605–2616. [Google Scholar] [CrossRef] [Green Version]
  16. Flanagan, L.B.; Comstock, J.P.; Ehleringer, J.R. Comparison of modeled and observed environmental influences on the stable oxygen and hydrogen isotope composition of leaf water in Phaseolus vulgaris L. Plant Physiol. 1991, 96, 588–596. [Google Scholar] [CrossRef] [Green Version]
  17. Ehleringer, J.R.; Dawson, T.E. Water uptake by plants: Perspectives from stable isotope composition. Plant Cell Environ. 1992, 15, 1073–1082. [Google Scholar] [CrossRef]
  18. Roden, J.; Ehleringer, J. Observations of hydrogen and oxygen isotopes in leaf water confirm the craig-gordon model under wide-ranging environmental conditions. Plant Physiol. 1999, 120, 1165–1174. [Google Scholar] [CrossRef] [Green Version]
  19. Yakir, D.; Sternberg, L. The use of stable isotopes to study ecosystem gas exchange. Oecologia 2000, 123, 297–311. [Google Scholar] [CrossRef]
  20. Moreira, M.; Martinelli, L.; Victoria, R.; Barbosa, E.; Bonates, L.; Nepstads, D. Contribution of transpiration to forest ambient vapour based on isotopic measurements. Glob. Chang. Biol. 1997, 3, 439–450. [Google Scholar] [CrossRef]
  21. Yepez, E.A.; Huxman, T.E.; Ignace, D.D.; English, N.B.; Weltzin, J.F.; Castellanos, A.E.; Williams, D.G. Dynamics of transpiration and evaporation following a moisture pulse in semiarid grassland: A chamber-based isotope method for partitioning flux components. Agric. For. Meteorol. 2005, 132, 359–376. [Google Scholar] [CrossRef]
  22. Lai, C.T.; Ehleringer, J.R.; Bond, B.J.; Paw, U.K.T. Contributions of evaporation, isotopic non-steady state transpiration and atmospheric mixing on the δ18O of water vapour in Pacific Northwest coniferous forests. Plant Cell Environ. 2006, 29, 77–94. [Google Scholar] [CrossRef]
  23. Zhang, S.; Wen, X.; Wang, J.; Yu, G.; Sun, X. The use of stable isotopes to partition evapotranspiration fluxes into evaporation and transpiration. Acta Ecol. Sin. 2010, 30, 201–209. [Google Scholar] [CrossRef]
  24. Hu, Z.; Wen, X.; Sun, X.; Li, L.; Yu, G.; Lee, X.; Li, S. Partitioning of evapotranspiration through oxygen isotopic measurements of water pools and fluxes in a temperate grassland. J. Geophys. Res. Biogeosci. 2014, 119, 358–372. [Google Scholar] [CrossRef]
  25. Rothfuss, Y.; Biron, P.; Braud, I.; Canale, L.; Durand, J.L.; Gaudet, J.P.; Richard, P.; Vauclin, M.; Bariac, T. Partitioning evapotranspiration fluxes into soil evaporation and plant transpiration using water stable isotopes under controlled conditions. Hydrol. Process. 2010, 24, 3177–3194. [Google Scholar] [CrossRef]
  26. Wei, Z.; Yoshimura, K.; Okazaki, A.; Kim, W.; Liu, Z.; Yokoi, M. Partitioning of evapotranspiration using high-frequency water vapour isotopic measurement over a rice paddy field: Partitioning of evapotranspiration. Water Resour. Res. 2015, 51, 3716–3729. [Google Scholar] [CrossRef]
  27. Welp, L.R.; Lee, X.; Kim, K.; Gris, T.J.; Billmark, K.A.; Baker, J.M. δ18O of water vapor, evapotranspiration and the sites of leaf water evaporation in a soybean canopy. Plant Cell Environ. 2008, 31, 1214–1228. [Google Scholar] [CrossRef]
  28. Dubbert, M.; Cuntz, M.; Piayda, A.; Maguas, C.; Werner, C. Partitioning evapotranspiration: Testing the Craig and Gordon model with field measurements of oxygen isotope ratios of evaporative fluxes. J. Hydrol. 2013, 496, 142–153. [Google Scholar] [CrossRef]
  29. Hupet, F.; Vanclooster, M. Micro-variability of hydrological processes at the maize row scale: Implications for soil water content measurements and evapotranspiration estimates. J. Hydrol. 2005, 303, 247–270. [Google Scholar] [CrossRef]
  30. Craig, H.; Gordon, L. Deuterium and Oxygen-18 variations in the Ocean and Marine Atmosphere, Proceedings of the Conference on Stable Isotopes in Oceanographic Studies and Paleotemperatures; Tongiorgi, E., Ed.; Laboratory of Geology and Nuclear Science: Pisa, Italy, 1965; pp. 9–130. [Google Scholar]
  31. Majoube, M. Fractionnement en oxygene-18 et en deuterium entre leau et sa vapaeur. J. Chim. Phys. 1971, 68, 1423–1436. [Google Scholar] [CrossRef]
  32. Blöschl, G.; Blaschke, A.P.; Broer, M.; Bucher, C.; Carr, G.; Chen, X.; Eder, A.; Exner-Kittridge, M.; Farnleitner, A.; Flores-Orozco, A.; et al. The hydrological open air laboratory (HOAL) in Petzenkirchen: A hypothesis-driven observatory. Hydrol. Earth Syst. Sci. 2016, 20, 227–255. [Google Scholar] [CrossRef] [Green Version]
  33. Aubinet, M.; Vesala, T.; Papale, D. Eddy Covariance. A Practical Guide to Measurements and Data Analysis; Springer: Dorndrecht, Germany, 2012; p. 325. [Google Scholar]
  34. Mauder, M.; Foken, T. Eddy-Covariance Software TK3. Documentation and Instruction Manual of the Eddy-covariance Software Package TK3 (Update); University of Bayreuth: Bayreuth, Germany, 2015. [Google Scholar] [CrossRef]
  35. Webb, E.; Pearman, G.; Leuning, R. Correction of flux measurements for density effects due to heat and watervapourtransfer. Q. J. R. Meteorol. Soc. 1980, 106, 85–100. [Google Scholar] [CrossRef]
  36. Lindroth, A.; Cermák, J.; Kučera, J.; Cienciala, E.; Eckersten, H. Sap flow by heat balance method applied to small size Salix trees in a short-rotation forest. In Biomass and Bioenergy; Elsevier: Amsterdam, The Netherlands, 1995; Volume 8, pp. 7–15. [Google Scholar]
  37. Čermák, J.; Kučera, J.; Nadezhdina, N. Sap flow measurements with some thermodynamic methods, flow integration within trees and scaling up from sample trees to entire forest stands. Trees 2004, 18, 529–546. [Google Scholar]
  38. Phililips, D.L.; Gregg, J.W. Uncertainty in source partitioning using stable isotopes. Oecologia 2001, 127, 171–179. [Google Scholar] [CrossRef]
  39. Hollinger, D.; Richardson, A. Uncertainty in eddy covariance measurements and its application to physiological models. Tree Physiol. 2005, 25, 873–885. [Google Scholar] [CrossRef] [Green Version]
  40. Huang, S.; Gao, Y.; Li, Y.; Xu, L.; Tao, H.; Wang, P. Influence of plant architecture on maize physiology and yield in the Heilonggang River valley. Crop J. 2017, 5, 52–62. [Google Scholar] [CrossRef] [Green Version]
  41. Jara, J.; Stockle, C.O.; Kjelgaard, J. Measurement of evapotranspiration and its components in a corn (Zea Mays, L.) field. Agric. For. Meteorol. 1998, 92, 131–145. [Google Scholar] [CrossRef]
  42. Zhao, L.; He, Z.; Zhao, W.; Yang, Q. Extensive investigation of the sap flow of maize plants in an oasis farmland in the middle reach of the Heihe River, Northwest China. J. Plant Res. 2016, 129, 841–851. [Google Scholar] [CrossRef]
  43. Gao, Y.; Duan, A.W.; Qiu, X.; Zhang, J.; Sun, J.; Wang, H. Plant transpiration in a maize/soybean intercropping system measured with heat balance method. Chin. J. Appl. Ecol. 2010, 21, 1283. [Google Scholar]
  44. Herbst, M.; Kappen, L.; Thamm, F.; Vanselow, R. Simultaneous measurements of transpiration, soil evaporation and total evaporation in a maize field in northern Germany. J. Exp. Bot. 1996, 47, 1957–1962. [Google Scholar] [CrossRef]
  45. Hossain, M.; Rumi, M.; Nahar, B.M.A. Radiation use efficiency in different row orientation of maize (Zea mays L.). J. Environ. Sci. Nat. Res. 2014, 7, 41–46. [Google Scholar] [CrossRef] [Green Version]
Figure 1. Experimental setup for the field campaign, showing the location of the measurement profile pole (blue arrow), the Picarro isotope analyzer (orange arrow, under blue tarp), and the eddy covariance station (green arrow).
Water 12 03048 g001
Figure 2. Example of sap flow system EMS 62, consisting of a heating element installed in the upper section (red wires) and two insulated thermocouples inserted 15 cm apart.
Water 12 03048 g002
Figure 3. Half-hourly plots of (a) solar radiation, (b) wind speed, and (c) vapor pressure deficit (VPD) for 24 June–2 July 2014.
Water 12 03048 g003aWater 12 03048 g003b
Figure 4. (a) Cumulative precipitation and (b) half-hourly soil moisture at 5-cm depth for the period 24 June–2 July 2014.
Water 12 03048 g004
Figure 5. Time series (~4-min interval) of the δ18O composition (black line) and the concentration (blue line) of the water vapor of the air at 2.4 m in height.
Water 12 03048 g005
Figure 6. Daily averages of the isotopic composition of the precipitation (black cross) evapotranspiration flux, δET (red triangles), soil evaporation flux, δE (blue circles), and transpiration flux δT (green diamonds). Error bars depict one standard deviation of measurement.
Water 12 03048 g006
Figure 7. Twenty-minute values of the fraction of transpiration (Ft) using the isotope method for the entire experimental period and cumulative precipitation.
Water 12 03048 g007
Figure 8. Comparison of isotope and sap flow estimates of transpiration (T) for (a) 26 June and (b) 2 July. Error bars depict standard error.
Water 12 03048 g008
Figure 9. Half-hourly plots of soil evaporation (E), transpiration (T), and (a) incoming solar radiation and (b) vapor pressure deficit (VPD) on 26 June.
Water 12 03048 g009
Figure 10. Scatterplots of half-hourly values for the entire experimental period. Top two figures show the comparison between soil E and (a) solar radiation and (b) vapor pressure deficit (VPD), while the bottom figures compare T with (c) solar radiation and (d) VPD.
Water 12 03048 g010
Publisher’s Note: MDPI stays neutral with regard to jurisdictional claims in published maps and institutional affiliations.

