Abstract
Soils are the dominant source of atmospheric nitrous oxide (N2O), especially agricultural soils that experience both waterlogging and intensive nitrogen fertilization. However, soil heterogeneity and the irregular occurrence of hydrological events hamper the prediction of the temporal and spatial dynamics of N2O production and transport in soils. Because soil moisture influences soil redox potential, and as soil N cycling processes are redox-sensitive, redox potential measurements could help us to better understand and predict soil N cycling and N2O emissions. Despite its importance, only a few studies have investigated the control of redox potential on N2Oemission from soils in detail. This study aimed to partition the different microbial processes involved in N2O production (nitrification and denitrification) by using redox measurements combined with isotope analysis at natural abundance and 15N-enriched. To this end, we performed long-term laboratory lysimeter experiments to mimic common agricultural irrigation and fertilization procedures. In addition, we used isotope analysis to characterize the distribution and partitioning of N2O sources and explored the 15N-N2O site preference to further constrain N2O microbial processes. We found that irrigation, saturation, and drainage induced changes in soil redox potential, which were closely related to changes in N2O emission from the soil as well as to changes in the vertical concentration profiles of dissolved N2O, nitrate (NO3−) and ammonium (NH4+). The results showed that the redox potential could be used as an indicator for NH4+, NO3−, and N2O production and consumption processes along the soil profile. For example, after a longer saturation period of unfertilized soil, the NO3− concentration was linearly correlated with the average redox values at the different depths (R2 = 0.81). During the transition from saturation to drainage, but before fertilization, the soil showed an increase in N2O emissions, which originated mainly from nitrification as indicated by the isotopic signatures of N2O (δ15N bulk, δ18O and 15N-N2O site preference). After fertilization, N2O still mainly originated from nitrification at the beginning, also indicated by high redox potential and the increase of dissolved NO3−. Denitrification mainly occurred during the last saturation period, deduced from the simultaneous 15N isotope analysis of NO3− and N2O. Our findings suggest that redox potential measurements provide suitable information for improving the prediction of soil N2O emissions and the distribution of mineral N species along the soil profile under different hydrological and fertilization regimes.
1. Introduction
The greenhouse gases (GHG) carbon dioxide (CO2), nitrous oxide (N2O), and methane (CH4) are recognized as the most significant contributors to global warming [1]. Soils comprise the largest terrestrial carbon and nitrogen pools for the emission of CO2, N2O and CH4 [2,3,4,5]. According to Smith et al. [6] and the IPCC [1], agricultural activities (such as fertilizer application) contribute around 12% (10–14%) to the global anthropogenic GHG emissions, accounting for about 60% of total anthropogenic N2O emissions [7,8]. Due to its high global warming potential, even small fluxes of N2O contribute considerably to the total GHG budget [9]. However, due to the relatively low N2O concentrations and fluxes, as well as the complexity of processes governing N2O emission from the soil, our ability to model N2O emissions lags behind that of CO2 emissions [10].
N2O emission from soils is influenced by a multitude of factors, such as variations in soil water content and associated redox potentials, as well as soil temperature, land management, and nutrient concentrations [11,12,13,14,15]. As these controlling factors are interrelated in a complicated way, more information on the interplay of oxygen availability, redox potential, and N2O emission is of paramount importance to improve the accuracy of N2O emission models [16].
The N2O production is strongly linked to the soil microbial community, which is highly sensitive to soil aeration conditions [17]. For instance, aerobic microorganism populations thrive under oxic conditions, whereas the activity of anaerobic microorganisms is suppressed [18,19]. Therefore, the redox potential (Eh) is often used as an indicator for the activity of specific microbial populations that control N2O emission [20,21,22,23]. For instance, Yu and Patrick [24] found that the highest N2O emission occurred during intermediate redox conditions in which Eh ranged between +200 and +400 mV. Other studies found that at high Eh (+400 mV and higher) N2O is typically produced by nitrification (e.g., [25]), while denitrification takes place in oxygen-deficient environments (+200 mV and lower) [15,24,26,27].
Because of the influence on oxygen availability, soil water content is an essential control factor for N2O emissions as it influences the ratio of nitrification and denitrification in soils [13,28,29,30,31]. However, the interpretation of Eh towards a better understanding of the control factors of N2O emission is still limited due to the low number of experiments with continuous Eh measurements [16,20,24,32]. Therefore, the suitability of continuous Eh measurements for a better understanding of the N-cycle and N2O emissions still needs to be better exploited, which may provide valuable information for optimizing land management towards lower N2O emission rates [33].
Recent sensor developments open the possibility for combined long-term monitoring of field-scale soil water content and soil Eh changes to increase the understanding of the N2O emission originated. In a recent study, Wang et al. [23] conducted laboratory lysimeter experiments to investigate how changes in Eh induced by the changes in the water level affect N2O emissions from agricultural soil. They found that soil Eh proved to be an important indicator for N2O flux rates, as well as the availability of NO3− and NH4+ in the soil. However, one drawback of this study was that the fertilizer had to be applied from the bottom of the soil column, which does not correspond to the common practice of the surface application of fertilizers.
In order better mimic the actual field conditions, we conducted new lysimeter experiments with agricultural soils, in which water and fertilizer were applied to the soil column with a rainfall simulator. The source processes of N2O and their modification by fertilization, irrigation, or drainage events were characterized by combined Eh measurements and stable isotope analysis. The objectives of this study were: (i) to induce variations in soil water content and Eh by a series of irrigation and drainage experiments (hydrological events) with a laboratory lysimeter; (ii) to investigate the effects of Eh and fertilizer application on N2O emission rates; and (iii) to determine the dominant processes of N2O production during the different hydrological events based on stable isotope analysis.
2. Materials and Methods
2.1. Soil Material
For the lysimeter experiments, we used soil material from the agricultural test site Selhausen (50.865° N, 6.447° E, 203 m a.s.l.), which is a part of the TERENO observatory Eifel/Lower Rhine Valley and which represents the heterogeneous agricultural area of that region [34]. This site belongs to the temperate maritime climate zone with a mean annual temperature and precipitation of 10.2 °C and 714 mm, respectively (1961–2014). The main crops at our sampling site are winter wheat (Triticum aestivum), winter barley (Hordeum vulgare), sugar beet (Betula vulgaris), and potato (Solanum tuberosum). The main soil type is Haplic Luvisol with a silt loam texture (13.8% sand, 68.4% silt, and 17.8% clay), with good drainage and gas permeability [35]. On February 23, 2018, 60 kg original soil samples from the AP horizon (0–30 cm depth) were collected from a wheat field. The air-dried soil was passed through a 2-mm sieve and mixed. The total soil nitrogen content was 0.14%, the organic carbon content was 0.98%, and the pH value was 6.98. Before the soil was filled into the column, the soil was air-dried until the gravimetric water content of the soil was about 7%. An overview of the main characteristics of the soil can be found in [23].
2.2. Soil Lysimeter Experimental Setup
The laboratory soil lysimeter experiments were performed at a constant room temperature of approx. 20 °C using a laboratory lysimeter (EcoTech, Bonn, Germany) with internal diameter of 30 cm and a depth of 50 cm. A schematic diagram of the lysimeter and irrigation setup is shown in Figure 1. The opaque lysimeter wall was made of polypropylene and PVC with 0.6 cm wall thickness. The lower boundary of the lysimeter was made of a porous nylon membrane plate with a pore size of 0.45 μm and an air-entry pressure of about 0.2 MPa for flow through. The lysimeter was carefully packed with the soil material to a homogenous bulk density of 1.26 g·cm−3.
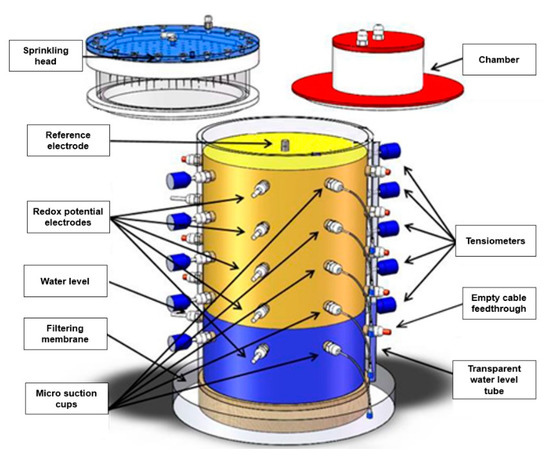
Figure 1.
Schematic diagram of the lysimeter system (internal diameter: 30 cm, height: 50 cm). A sprinkling system was used to simulate precipitation or fertilization process in the lysimeter, and the closed chamber method was used to measure the fluxes of greenhouse gases (PT100 sensors are not shown).
Precipitation was simulated using a dedicated sprinkling head (EcoTech), which ensured uniform irrigation of the soil surface through 163 geometrically equally distributed capillaries. The static chamber method was used for N2O emission flux measurements (see detailed description in Section 2.4). The redox potential was measured using a set of Pt electrodes and one Ag/AgCl reference electrode (EcoTech). The ten Pt electrodes were installed at five depths (3, 11, 19, 27 and 35 cm below soil surface), and two replicate Pt electrodes were inserted opposite to each other in each layer. The reference electrode was installed vertically from the soil surface and inserted into a 15 cm borehole in the center of the soil column and was then sluiced to optimize soil contact.
Soil water potential was measured with ten laboratory tensiometers (T5, Meter Group AG, Munich, Germany), which were installed at the same depths as the Pt electrodes. A data logger (DT 85, Thermo Fisher Scientific Inc., Melbourne, Australia) was used to collect the sensor data at 15 min resolution. In addition, we installed nylon suction cups (Rhizon samplers, MOM 19.21.21, Rhizosphere Research Products, Wageningen, The Netherlands) at depths of 3, 11, 19, 27, and 35 cm, respectively, to collect soil pore water for regular analysis of ammonium, nitrate, and dissolved greenhouse gases. The suction cups had a diameter of 2.5 mm and a mean pore size of 0.15 µm. Soil temperature was measured at depths of 11 and 35 cm using PT100 sensors.
The initial soil NO3− and NH4+ concentrations were determined from soil samples taken at the same five depths at which the soil redox electrodes, the tensiometers, and the microsuction cups had been installed. The determinations took place by extracting 2 g of soil with 50 mL 0.1 M CaCl2 solution and analysis of the extract with ion chromatography (Dionex ICS-3000, Dionex Corporation, Sunnyvale, CA, USA).
2.3. Experimental Procedures
The lysimeter experiment was run continuously for more than 165 days in 2018, in which the lower boundary was controlled either with a constant positive pressure head using a Mariotte’s bottle to induce a water table, or by applying a negative pressure using a hose pump to induce drainage flow (see Wang et al. [23], for more details of the setup). During periods of water saturation, soil pore water was sampled using the suction cups installed at the five different depths and analyzed for NO3−, NH4+ and N2O concentration on June 5, June 15, July 7, and August 8.
The entire study consisted of four different experimental phases (see also Table 1): First a period without fertilization (called Experiment 1, from March 21 to June 1). Experiment 1 aimed to investigate the relationship between N2O emissions and Eh in soil during long periods of saturation and the resulting consumption of dissolved N. Then two periods followed, each of which started with a fertilization event (Experiment 2, from June 2 to 29; and Experiment 3, from June 30 to August 3) to investigate the effects of irrigation after fertilization on N2O emissions. Finally, a post-fertilization period with saturated conditions (Experiment 4, from August 4 to 26) was carried out. The experimental procedures during these four phases are described in detail below. Saturation means the whole soil column was saturated as indicated by the soil water potential (Figure 2a, Figure 3a, Figure 4a and Figure 5a).

Table 1.
Mean, maximum, and minimum daily soil redox potential values and N2O fluxes. In addition, the range, standard deviation (SD) and the coefficient of variation (CV) are provided.
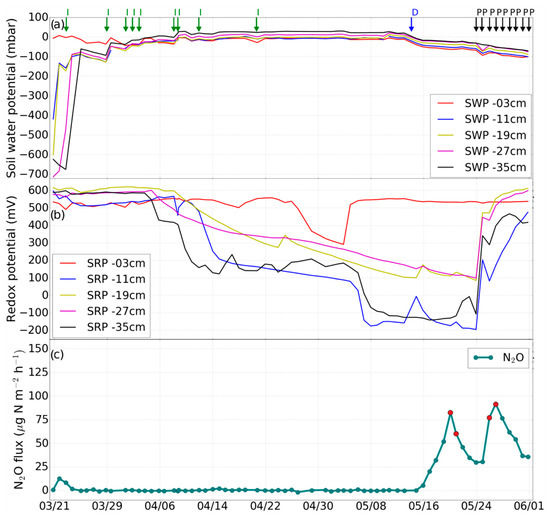
Figure 2.
Experiment 1 (before fertilization). Changes in (a) soil water potential (SWP), (b) soil redox potential (SRP), and (c) N2O emission rate induced by irrigation (I), drainage (D), irrigation with fertilizer (F), desaturation of the soil with pump (P). The red dots in panel c indicate the N2O isotope sampling days.
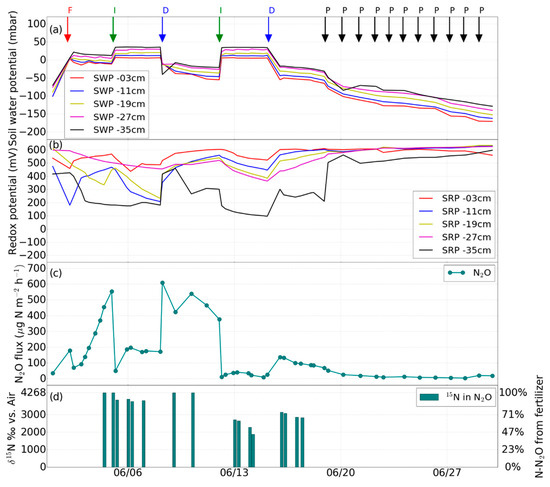
Figure 3.
Experiment 2 (1st fertilization). Changes in (a) soil water potential (SWP), (b) soil redox potential (SRP), (c) N2O flux induced by irrigation (I), drainage (D), irrigation with fertilizer (F), desaturation of the soil with pump (P), (d) percentage of N2O from the added fertilizer.
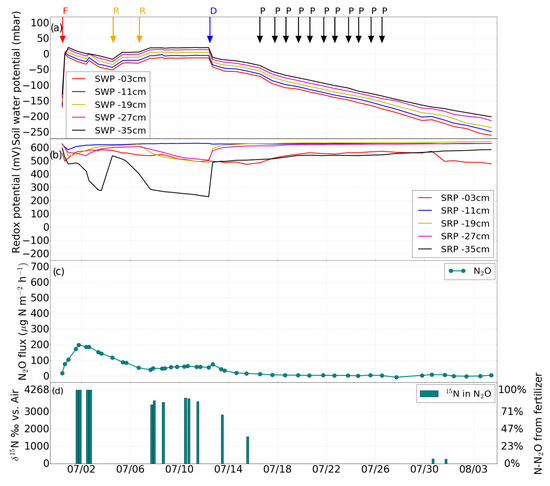
Figure 4.
Experiment 3 (second fertilization). Changes in (a) soil water potential (SWP), (b) soil redox potential (SRP), (c) N2O flux induced by drainage (D), irrigation with fertilizer (F), desaturation of the soil with pump (P), water table rise (R), (d) percentage of N2O derived from the added fertilizer.
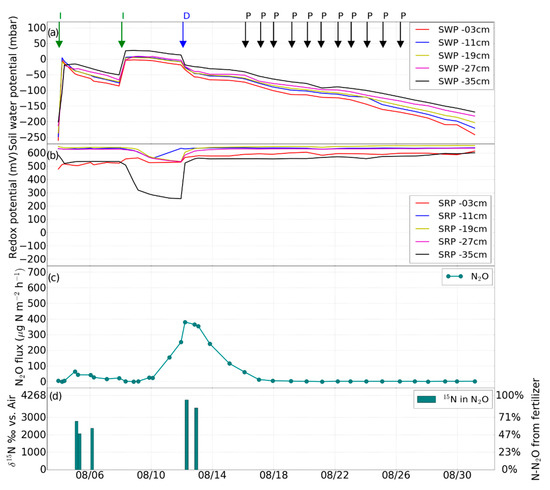
Figure 5.
Experiment 4 (post-fertilization saturation phase). Changes in (a) soil water potential (SWP), (b) soil redox potential (SRP), (c) N2O flux induced by irrigation (I), drainage (D), desaturation of the soil with pump (P), (d) percentage of N2O from the added fertilizer.
On March 21 and 23, the soil was irrigated with 4.2 L of tap water (corresponding to a rainfall event of 60 mm). In the following, the irrigation intensity was reduced to match the decreasing infiltration capacity. From March 29 to April 3, the soil column was irrigated with 2.1 L (30 mm) of water every day, and on April 8, 9, 12, and 21 with 1.05 L (15 mm) of water. Throughout the irrigation activities, we tried to avoid infiltration excess; nevertheless, there was 4–6 h of water ponding on the soil surface following each irrigation event. During three periods (from April 23 to May 11, June 2 to 8, and June 12 to 15) a low amount of water was continuously applied (~2 mm/day) to compensate for the evaporation loss of the soil and thus maintaining an anoxic state in the soil column. Subsequently, drainage was initiated on May 24 and maintained until June 1 by inducing a negative pressure of −1 atm at the lower boundary with the vacuum pump for 2 h per day (Figure 2a). On May 30, 2 g of soil material was collected from each of the five depths (3, 11, 19, 27, and 35 cm) to determine the soil NH4+ and NO3− concentrations.
In a second experiment (Figure 3), the soil in the lysimeter was fertilized on June 2 with 1.98 g 15N-labeled ammonium sulfate (1.9 atom% 15N, corresponding to 60 kg·N·ha−1) dissolved in 2.1 L of tap water, to apply fertilization and irrigation simultaneously (also known as fertigation). Subsequently, two further irrigation events without fertilizer application (2.1 L and 4.2 L) were carried out on June 5 and 12 (Figure 3a). The drainage events were performed on June 8 and 15.
A second application of the 15N-labeled fertilizer (again 1.98 g of 15N-labeled ammonium sulfate with 1.9 atom% 15N) took place on June 30, after which the soil was subjected to free drainage for four days. With the help of the Mariotte bottle, the water level in the soil column was then adjusted first to 23 cm and on July 6 to 15 cm for another eight days. On July 16, drainage was initiated using the pump.
The final irrigations with 2.1 L of tap water each took place on August 4 and 8, and soil drainage was again activated on August 12, until the soil was desaturated to a water potential lower than −150 mbar at 35 cm.
At the end of the experiment, soil samples were taken using stainless-steel cylinders (8 cm diameter) in the center of the lysimeter at six depth sections (0–7, 7–15, 15–23, 23–31, 31–39, and 39–47 cm, respectively). The soil of each depth section was mixed, and NH4+ and NO3− concentrations were determined as described above. The results of mineral N concentrations in the different depth sections were considered as representative for the five depths of the soil redox sensors.
2.4. N2O Flux Measurements
Nitrous oxide fluxes were determined daily throughout most of the experimental periods with the static chamber method by placing a PVC chamber (volume 5.65 L) gastight on the soil column and collecting gas samples manually with a syringe 0, 10, 20, 30, and 40 min after chamber closure. A 1.5 m long polyethylene tube with 2 mm inner diameter was connected to the chamber to keep the air pressure in the chamber headspace equal to the ambient air. The first sample was collected directly after the chamber was closed, and the samples were transferred to pre-evacuated (−1 atm) 22-mL GC glass vials. The gas samples were then analyzed with a gas chromatograph (8610C, SRI Instruments, Torrance, CA, USA). The gas flux rates were determined using a simple linear regression for the five concentration points as described by Parkin and Venterea [36]. Flux values were accepted if the coefficient of determination (R2) was larger than 0.8, or assumed to be zero when the deviation of the concentration values of the five different time points from the mean of the five samples was below two standard deviations [23]. In all other cases, calculated flux rates were discarded. The N2O fluxes were calculated using Equations (1) and (2) in Wang et al. [23].
For the analysis of gas concentrations in soil solution, soil pore water was collected with the Rhizon samplers at the different depths in 22-mL GC vials. For the GC analysis, a headspace of 7 mL was created in the 22-mL GC vials using ambient air, and after 24 h equilibration the N2O concentrations in the vial headspace were measured with the GC as described above. The dissolved gas concentrations were calculated with Henry’s law, based on the air pressure and the concentration of the gases in the vial headspace according to Xu et al. [37].
2.5. Isotope-Ratio Measurements
For tracing the source process (nitrification or denitrification) of the N2O, additional gas samples were collected after the routine gas flux measurement. Eighty minutes after the chamber was closed, 120 mL of gas in the static chamber headspace was transferred to a 120-mL pre-evacuated serum bottle for further analysis of the isotopic signature. Before fertilization (i.e., 15N application), the analysis of the natural N2O isotopocule abundances, i.e., the δ15N, δ18O, and 15N site preference (15N SP), was used to identify the source process of N2O [38]. The δ15Nbulk, δ18O, and 15N SP of N2O in the gas samples and laboratory background air samples were analyzed using an isotope ratio mass spectrometer (IRMS, IsoPrime 100, Elementar Analysensysteme, Hanau, Germany). For more details of the IRMS analysis we refer to Heil et al. [39] and Wei et al. [40]. Decock and Six [41] summarized the average SP values for N2O produced via the different pathways, with 32.8 ‰ (±4.0 ‰ SD) for all known processes involving NH2OH oxidation (i.e., nitrification and fungal denitrification), and −1.6 ± 3.8 ‰ for all known processes involving nitrate or nitrite reduction (i.e., bacterial denitrification). An intermediate SP value would indicate mixed source processes of N2O [42].
After 15N fertilizer application, only δ15Nbulk of N2O was used as isotopic information to calculate the contribution of fertilizer N to the total N2O emission by application of a two-end member mixing model approach [43], as the natural abundance signal was no longer usable. The δ15N of the applied N fertilizer (4268‰) was used as one end member and the δ15Nbulk of N2O in background air (6.6‰) as the second end member in the mixing model. Due to the relatively low 15N content of the fertilizer (1.9 atom% 15N), the contribution of doubly 15N-labeled N2O to the total N2O emission was negligible.
The 15N signature of soil NH4+ was determined with the micro-diffusion method [44], followed by elemental analyzer (EA)-IRMS analysis (Flash EA 2000 with Delta V Plus; Thermo Fisher Scientific, Bremen, Germany). The 15N isotope analysis of soil NO3− was performed in a first step with a liquid-liquid extraction method [45], followed by EA-IRMS analysis. Soil total organic N was analyzed also using EA-IRMS. For a detailed description of soil 15N measurement procedures see Wei et al. [46].
2.6. Eh Measurements
The reduction-oxidation (redox, Eh) potential is a quantitative measure of the electrochemical potential in a solution containing oxidizing and reducing chemical species [47]. The standard Eh is defined as the potential of a red/ox pair measured against the standard hydrogen reference electrode (E0). The in-situ redox potential measured in the soil against the Ag/AgCl reference electrode can be converted to the standard Eh by adding the temperature-dependent offset between the normal hydrogen electrode and the Ag/AgCl electrode (Eref) [26]. As the soil temperature was close to 20 °C throughout the experiment, the measured redox potential values were converted to Eh by adding an Eref of 210.5 mV.
2.7. Statistical Analysis
The statistical analyses were conducted using the Python statistics package, version 3.6 (Python Software Foundation, Wilmington, DE, USA), using Pandas and NumPy libraries.
3. Results
3.1. Impact of Hydrological Events on Soil Water Potential and Eh
The soil Eh and soil water potential at the different depths changed in response to irrigation events during the experiments. After several irrigation events at the beginning of the experiment, the soil was water-saturated and the soil Eh rapidly decreased (Figure 2b). During the first two weeks of the experiment, the soil Eh was above 500 mV in the entire soil profile. From April 4 to May 13, the soil Eh at 11 cm and 35 cm dropped from 550 mV to the lowest value (around −150 mV) and became stable afterwards, suggesting that also the microbial activity had stabilized. Reducing conditions can be separated into weakly reducing (400 > Eh > 200 mV), moderately reducing (200 > Eh > −100 mV), and strongly reducing (Eh < −100 mV) conditions.
The following fertilization experiment showed a similar pattern, but the influence on Eh was more pronounced. After onset of irrigation on June 2, the Eh values showed a stronger decrease near the surface (3 and 11 cm) than at greater depth. The Eh values down to 27 cm depth remained above 500 mV, regardless of whether fertilization, drainage or waterlogging occurred. In contrast, Eh at 35 cm decreased to values below 200 mV, indicating reducing conditions in the lower part of soil column. A short-term decrease of Eh at shallow depth (from 500 to 200 mV at 11 cm) was observed on June 3 after fertilizer irrigation (Figure 3b), and similarly on June 30 (Figure 4b). During the final period from August 9 to 12, only Eh at 35 cm indicated intermediate redox conditions (+300 mV) (Figure 5b).
The Eh variations during different phases are shown in Table 1. From pre- to post-fertilization phase, a strong decline of the coefficient variation of mean Eh values (from 49% to 5%) was observed, whereas the mean Eh values increased after N addition to the soil at all depths (from +334 mV to +599 mV). Before fertilization, negative redox values were also observed after a long saturation period (Figure 2b and Figure 6a), which was not the case after fertilization (Figure 3b, Figure 4b, Figure 5b and Figure 6b). Furthermore, after fertilization redox potential values were rarely below 400 mV at shallower soil depth (Figure 6b), whereas before fertilization also at shallower depths redox potential was frequently below 400 mv (Figure 6a).
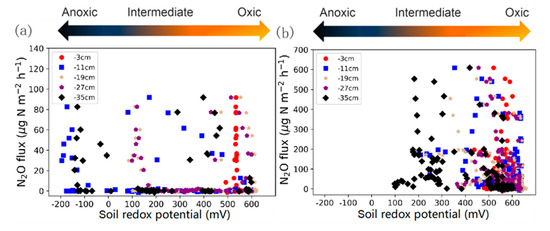
Figure 6.
Nitrous oxide emissions versus soil redox potential measured at 3, 11, 19, 27, and 35 cm below the soil surface (a) before and (b) after fertilization.
3.2. Impact of Hydrological Events on N2O Emissions
The average soil temperature during the experiments was 19.4 °C (SD 0.7 °C) at 11 cm and 18.9 °C (SD 0.7 °C) at 35 cm. Given these low variations in temperature, we assumed that changes in soil temperature were not a critical control factor of N2O formation and emission in our experiments.
The first experiment without fertilization (from March 24 to May 14) was characterized by relatively low N2O emission (on average 2.3 µg·N·m−2·h−1), indicating that N consumption was dominant (Figure 2c). However, after initiating free drainage on May 14, the N2O flux gradually increased in the following days, peaking at 82.6 µg·N·m−2·h−1 after six days. On May 24, drainage was initiated by pumping, which led to a strong increase in Eh at all measurement depths, except for 3 cm, where Eh had been high before. Three days later, a further N2O emission peak with 91.7 µg·N·m−2·h−1 occurred (Figure 2c).
During the second experiment that featured the first fertilization via irrigation on June 5, N2O emission become generally more dynamic, with larger N2O fluxes especially after forced drainage by pumping (Figure 3c). Directly after the fertilizer application, an increase in N2O emissions was observed, and N2O flux further increased gradually until the next irrigation event (from 0 to above 550 μg·N2O-N·m−2·h−1). After the irrigation, a sharp decrease in N2O emission occurred, indicating transport limitation due to water-filled pores, from above 500 to around 200 μg·N2O-N·m−2·h−1 after saturation on June 5. This effect was even more pronounced after the irrigation event on June 12, when N2O emissions decreased from about 400 μg·N2O-N·m−2·h−1 down to almost 0 μg·N2O-N·m−2·h−1.
The N2O emissions increased rapidly during the first five days after drainage on June 8 to values between 400 and 550 μg·N2O-N·m−2·h−1. The peak of N2O emission was more than five times higher than during the first experiment without fertilization.
After the second fertilization event on June 30, N2O emission started to increase (Figure 4c), and peaked at about 200 μg·N2O-N·m−2·h−1 on July 2 and deceased to around 50 μg·N2O-N·m−2·h−1 in the following five days. The emission rate stayed between 40 and 65 μg·N2O-N·m−2·h−1 despite the rising water table. After drainage on July 12, the N2O emission rate progressively decreased to 0 (Figure 4c).
The final irrigation experiment started on August 8, during which the N2O emission constantly increased from 0 to 400 μg·N2O-N·m−2·h−1 within four days, and then gradually decreased to zero emission within five days after drainage. After August 18, the soil N2O flux returned to pre-irrigation level (Figure 5c).
Table 1 shows the mean, minimum and maximum N2O fluxes during the four different experiments. With 137.8 μg·N2O-N·m−2·h−1 the highest mean N2O emission rate occurred during Experiment 2, i.e., after the first fertilization. This value was about 3.6 times higher than the mean N2O emission rate of Experiment 3 (38.4 μg·N2O-N·m−2·h−1). Figure 6 shows the mean Eh of the five different depths of the soil column and the N2O fluxes before (Figure 6a, Experiment 1) and after (Figure 6b) fertilization (Experiments 2, 3 and 4). Before fertilization, Eh showed considerable variability at the different depths, with Eh values at some depths even indicating reducing conditions (Figure 6a), while after fertilization, most of the Eh values were in the oxic range (above +400 mV) (Figure 6b).
3.3. Variations of δ15Nbulk, 15N SP and δ18O of N2O Emissions
The contribution of the different microbial source processes to the emission of N2O before fertilization (Figure 2c) was analyzed at the level of natural isotope abundance. The isotopic signature (δ15Nbulk, δ18O, 15N SP) of N2O emission after drainage on June 19, 20, 26, and 27 indicated that the N2O originated exclusively from bacterial or archaeal nitrification, and not from bacterial denitrification or nitrifier denitrification (Figure 7).

Figure 7.
Dual isotope end-member map for N2O source partitioning before fertilization. Relation between δ15Nbulk and SP (a) and the relation between δ18O and SP (b). The squares indicate typical ranges for the microbial processes of N2O production. The red squares represent the isotope signatures of N2O emission on May 20, 21, 27, and 28 (shown in Figure 2c as red dots) before fertilization in this study. The rectangles are taken from Toyoda et al. [48].
Two to three days after the onset of fertilization, the δ15N value of N2O indicated that almost 100% of δ15N-N2O originated from the applied fertilizer (Figure 3d and Figure 4d). Another peak of δ15N-N2O occurred after drainage on June 9 and 10, indicating that again all of the δ15N-N2O originated from the applied fertilizer. As can be seen in Figure 3d, the high δ15N-N2O during the first fertilization phase occurred when the soil was at low water potential. About 90% of the N2O originated from the added fertilizer on June 6 and 7, while 44–55% of N2O was fertilizer-derived on June 13 and 14. After the onset of the second fertilization, δ15N-N2O increased again with values between 3056 and 4268‰ before drainage. After drainage on July 13, the δ15N-N2O decreased from 2467 to 1204‰ on July 15 (Figure 4d).
After irrigation on August 5, the mean δ15N-N2O was 2451‰ during a period with low water potential (Figure 5c). However, as soon as saturation was initiated on August 8, δ15N-N2O gradually increased again to values around 3418 to 4014 ‰, accompanied by high N2O emissions, meaning that around 80–95% N-N2O originated from the added fertilizer (Figure 5d).
3.4. Impact of Different Hydrological Events on Mineral N and Dissolved N2O Concentrations along the Soil Profile
The concentration distribution of gaseous N2O in the soil solution extracted with the suction cups showed that the highest N2O concentrations in soil solution occurred after irrigation and nitrogen fertilization events (Figure 8). On June 5, the gaseous N2O concentration profile was V-shaped with the lowest concentration at intermediate depth, and with a similar depth distribution as the NO3− concentration in the soil solution (Figure 9c).
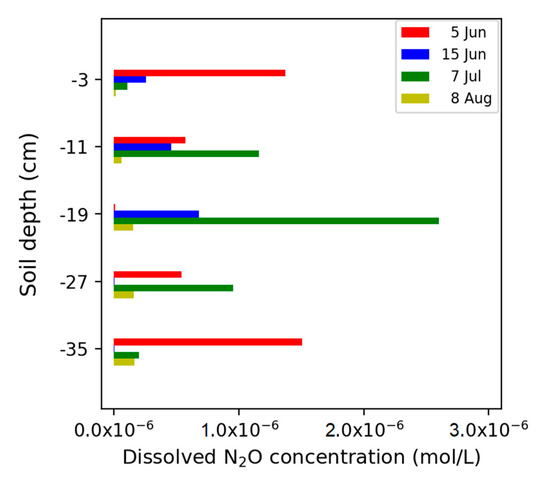
Figure 8.
Concentration of dissolved N2O.
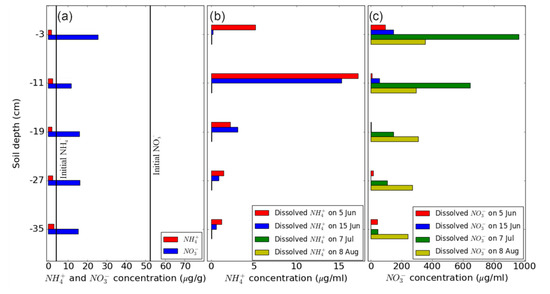
Figure 9.
Concentration of mineral N at different depths of the soil column, (a) of ammonium (NH4+) and nitrate (NO3−) extracted from soil samples taken after drainage on May 30, (b) and (c) of NH4+ and NO3−, respectively, in soil solution sampled at the four different time points indicated.
The fertilization and hydrological events (i.e., irrigation and drainage) significantly altered soil mineral nitrogen and gas concentrations both in space and time. Figure 9 illustrates the dissolved NH4+ and NO3− concentration in soil solution on May 30, June 5 and 15, July 7, and August 8. While NH4+ was close to the detection limit before fertilization, NO3− ranged between 10–25 µg g−1 soil dry weight (Figure 9a). After fertilization, NH4+ concentration was highest at 11 cm on June 5 and 15, but was basically at the detection limit on July 7 and August 8 (Figure 9b). In contrast, NO3− showed a different pattern, with low values across the soil profile on June 5 and 15, highest values on July 7 at 3 cm and 11 cm, and intermediate concentrations without clear depth dependence on August 8 (Figure 9c).
At the end of Experiment 4, concentrations of total N and NH4+ were uniformly distributed along the soil profile (Figure 10a,b), but the soil NO3− concentration was highest at −3 cm, and much lower from 11 cm to greater depth (Figure 10c). There was a pronounced decrease in 15N enrichment of all three parameters with increasing soil depth (Figure 10d–f). However, compared to δ15N of NO3−, the δ15N of NH4+ value was very low, indicating that only 3.4% of the N in NH4+ was from the added fertilizer at 0–7 cm soil depth, and in the rest of the soil the contribution of fertilizer N to the residual NH4+ was below 1%. In contrast, the fraction of fertilizer-derived N was high in NO3−, amounting to 80%, 49%, 37%, 27%, 17%, and 11% in the different depth sections from the topsoil to the bottom of the lysimeter, respectively.
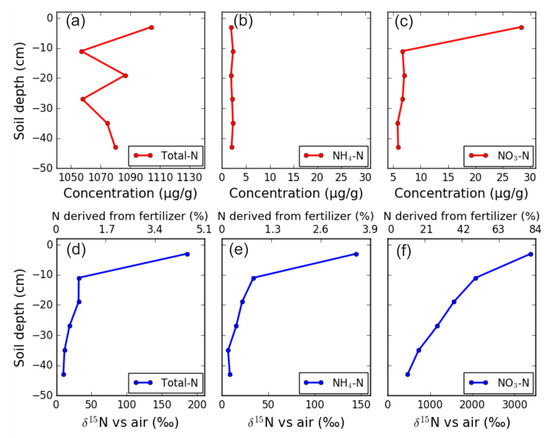
Figure 10.
Concentration of (a) total N, (b) ammonium (NH4+), and (c) nitrate (NO3−) in soil, and δ15N of (d) total N, (e) NH4+ and (f) NO3− at the end of the series of experiments.
4. Discussion
In farmland systems, management activities like fertilization and irrigation exert a strong control on the occurrence and intensity of nitrification and denitrification processes in soils and related N fluxes (e.g., transport of dissolved N and emission of N2O) [10,49,50,51]. Variations in N2O flux rates from soils are induced by complex interactions between fertilizer application, microbial processes, and soil physical conditions [14]. For example, the infiltration of rainwater or irrigation water will induce changes in Eh that affect microbial processes as well as the transport of electron acceptors and nutrients. The application of stable isotopes can help to elucidate these processes. In this study, the natural abundance of 15N and its intramolecular distribution in N2O as well as 15N-labelled mineral fertilizer were used to better understand the effects of variations in soil water content and soil Eh on N2O production and emission.
4.1. Effects of Soil Hydrological Conditions on Eh and Dissolved N
The distribution of dissolved NH4+ and NO3− along the soil profile varied in response to irrigation and fertilization (Figure 9b,c), similar to the study of Rubol et al. [16]. Before fertilization, the soil Eh was low in the lower parts of the soil column (Figure 2b), since during the prolonged soil saturation the active soil microorganisms use alternative electron acceptors instead of oxygen [52,53,54]. Therefore, consistent with the high consumption rate of nitrate at −11 cm (Figure 9a), the Eh decreased even further and faster at −11 cm (Figure 2b). The low NO3− concentration at that same depth might have led to the use of other substrates like Mn4+ as electron acceptor [22].
Kralova et al. [55] found that an increase of Eh from +550 to +600 mV led to the transition from mineralization to nitrification, associated with an increase in nitrate content. Accordingly, in our experiments soil Eh above −27 cm was around +600 mV after the second fertilization event, and allowed a large part of the added NH4+ to be converted to NO3− from June 30 to July 7 (Figure 9b,c). The higher redox potential values after fertilization compared to those before fertilization may be explained by the lack of prolonged periods of saturation. The higher Eh values after fertilization compared to those before fertilization may be explained by the lack of prolonged periods of saturation. The microorganisms did not have enough time to consume the different alternative electron acceptors pools sequentially, and it may be the reason for the soil Eh remaining at a higher level compared to the per-fertilization period [56]. Another reason for the higher Eh observed after fertilization may be the larger availability of nitrate after the addition of ammonium due to its conversion to nitrate via nitrification, which prevents a further decrease in Eh as long as sufficient nitrate is available in the soil column. The addition of NO3− can significantly increase Eh when the soil is in reduced conditions, as a strong electron acceptor is added to the soil [57]. This result is similar to that of Buresh and Patrick [58], who found that after addition of NO3− the soil Eh increased significantly from −300 to +160 mV. The increase of Eh was maintained until the NO3− was consumed, i.e., reduced. In accord with the results of Hansen et al. [32], the Eh can help to interpret the possible N transformation processes in the soil.
4.2. Changes in N2O Emissions in Response to Changes in Soil Water Potential, Eh, and Available N
Ye et al. [59] found that in paddy soil, N2O emission occurred after the water level dropped after long-term flooding, similar to our results in the experiment before fertilization. The simultaneous irrigation with 15N-labeled NH4+ fertilizer triggered nitrification, associated with the consumption of added NH4+ and the accumulation of NO3− in the upper part of the soil column (Figure 9b,c and Figure 10b,c,e,f). This is consistent with the relatively high mean Eh near the soil surface that was not favorable for denitrification. In contrast, at the bottom of the column, we found low N2O concentrations in the soil water, suggesting reduction of N2O to N2 [16,60,61].
In our study, N2O emission rates were affected by hydrologic conditions and events, but with different dynamics. As Figure 2c and Figure 3c illustrate, N2O emission gradually increased after the initiation of drainage and after the first fertilization, respectively, possibly because of the activation of nitrification induced by the drainage (Experiment 1, Figure 2c) and fertilization (Experiment 2, Figure 3c). A similar delay in N2O emission after fertilization or irrigation was also observed in other studies [11,23,62,63]. In all cases, the apparent delay in N2O emission corresponded to water content changes after the soil was saturated or fertigated. Once nitrification was activated, any fast changes in the hydrologic conditions led also to immediate changes in N2O emissions, which was decreased by further irrigation and increased immediately again after subsequent drainage (Figure 3c). A possible explanation is that it takes several days to activate the microbial nitrifier community, which then oxidizes ammonium to nitrite (ammonia-oxidizing bacteria and archaea) and then further to nitrate (nitrite-oxidizing bacteria). Any short-term changes in aeration status which are imposed then on the soil by changes in the water content and water table height will immediately affect the activity of this microbial community by the decrease or increase in oxygen availability, because ammonia and nitrite oxidizers are obligate aerobic. As oxygen is expelled from the soil pores during irrigation, and as oxygen quickly re-enters the soil profile after drainage, the activity of obligate aerobes can be basically switched on and off very quickly, if the anoxic periods do not last too long. This assumption is supported by the changes in redox potential in our experiments, which quickly recovered after drainage to values in excess of +400 mV, indicating optimal conditions for the nitrification process [22]. Another possible explanation of the lag of N2O emission in the soil after the saturation may be the decrease in N2O diffusivity in the soil due to the increased water content, leading to initially low N2O emission from the soil surface.
Before fertilization, most of the N2O fluxes from the surface of the soil column originated from nitrification, as indicated by the end-member map in the dual isotope plot (Figure 7). Our results indicated that there was no or very weak ammonification of organic (i.e., unlabeled) N involved. Although the organic N can be nitrified and denitrified after the ammonification, the N mainly involved in the soil N-cycle was from the added 15N-labeled N. Thus, the most important N-conversion processes in our experiments were nitrification and denitrification, which convert NH4+ to NO3−, and NO3− via N2O to N2, respectively. The change in the fraction of N2O derived from nitrification or denitrification could be deduced from the simultaneously determined 15N-signatures of N2O and mineral N.
Moreover, after fertilization, nitrification dominated N2O production in soil with high Eh in the upper part of the soil column, when NH4+ was still available in sufficient quantities (Figure 9b), indicated by the high δ15N of N2O. However, after August 8 (i.e., after the two fertilization experiments), when the concentration of NO3− dissolved in soil water reached values above 200 µg·mL−1 at all five depths, the decrease in Eh below +300 mV at −35 cm suggested that denitrification could have become the primary source of N2O after the last irrigation event at −35 cm or below [32]. This assumption is supported by the observation that the subsequent drainage event led to an increase in Eh, but a decrease in N2O emission. This is consistent with previous studies, in which the maximal denitrification rate occurred in an Eh range of +150 to +300 mV [64,65].
5. Conclusions
We established a lysimeter system for the determination of soil water and Eh as well as N2O gas emissions in the laboratory to study the effects of irrigation and drainage events on soil N dynamics and N2O emissions from agricultural soils. Our lysimeter experiments mimicked agricultural irrigation and fertilization management. Overall, our results revealed a close relationship between soil hydrologic conditions, soil Eh, and soil N dynamics in a controlled environment. At an intermediate soil moisture level, nitrification was the dominant source of N2O, and fertilization with NH4+ stimulated nitrification and further increased its N2O source strength. Near soil saturation, the dominating N2O source process shifted from nitrification towards denitrification. Our results suggest that the soil Eh is a suitable indicator for the two dominant N2O source processes, i.e., hydroxylamine oxidation and nitrite reduction. Furthermore, the results of this study identify soil Eh variations as an additional control variable of soil N turnover, beside soil water and mineral N content. However, we also found that the change in Eh is not only related to soil water potential, but also to the type and abundance of ions and to the activity of microorganisms in the soil.
There is still a need for a transfer of our experimental approach to field conditions across different soil textures to extend the implications of our findings. In particular, stable isotope measurements should be conducted simultaneously to the Eh and N2O emission measurements in the field experiments to trace the N2O pathways along the soil profile. This will allow the identification of the hotspots of N2O reduction, as the formation and consumption of N2O can occur in close vicinity to each other in the soil and cannot be disentangled by Eh measurements alone. Finally, more research is required to unravel the link between Eh variations and soil microbial activities and to disentangle the relative effects of the variations of soil Eh, water content, and water table height on soil N dynamics and N2O emissions.
Author Contributions
The project was conceptualized by H.R.B. and N.B.; methods were performed by J.W.; writing of the original manuscript draft was done by J.W.; editing and review of the draft was done by all authors—J.W., H.R.B., H.V., N.B.; supervision and direction of the project was done by H.R.B. and N.B.; funding for J.W. was provided by H.R.B. and N.B., respectively. All authors have read and agreed to the published version of the manuscript.
Funding
This work was supported by the TERENO project funded by the Helmholtz Association of German Research Centers and the Chinese Scholarship Council (Scholarship No. 201506300053).
Acknowledgments
We thank Ansgar Weuthen, Bernd Schilling, Franz Leistner and Holger Wissel, for their support during the experiments. We thank the four anonymous reviewers for their valuable comments on our manuscript.
Conflicts of Interest
The authors declare no conflict of interest.
References
- IPCC. The Physical Science Basis: Contribution of Working Group I to the Fourth Assessment Report of the Intergovernmental Panel on Climate Change; Cambridge University Press: Cambridge, UK; New York, NY, USA, 2007; pp. 468–479. [Google Scholar]
- Kutsch, W.L.; Bahn, M.; Heinemeyer, A. Soil Carbon Dynamics: An Integrated Methodology; Cambridge University Press: Cambridge, UK, 2009; pp. 49–69. [Google Scholar]
- Nieder, R.; Benbi, D.K. Carbon and Nitrogen in the Terrestrial Environment; Springer Science and Business Media: Dordrecht, The Netherlands, 2008; p. 430. [Google Scholar]
- Schaufler, G.; Kitzler, B.; Schindlbacher, A.; Skiba, U.; Sutton, M.A. Zechmeister-Boltenstern, S. Greenhouse gas emissions from European soils under different land use: Effects of soil moisture and temperature. Eur. J. Soil Sci. 2010, 61, 683–696. [Google Scholar] [CrossRef]
- Schlesinger, W.H.; Andrews, J.A. Soil respiration and the global carbon cycle. Biogeochemistry 2000, 48, 7–20. [Google Scholar] [CrossRef]
- Smith, P.; Bustamante, M.; Ahammad, H.; Clark, H.; Dong, H.; Elsiddig, E.A.; Haberl, H.; Harper, R.; House, J.; Jafari, M. Agriculture, Forestry and Other Land Use (AFOLU); Cambridge University Press: Cambridge, UK; New York, NY, USA, 2015; pp. 816–886. [Google Scholar] [CrossRef]
- Reay, D.S.; Davidson, E.A.; Smith, K.A.; Smith, P.; Melillo, J.M.; Dentener, F.; Crutzen, P.J. Global agriculture and nitrous oxide emissions. Nat. Clim. Chang. 2012, 2, 410–416. [Google Scholar] [CrossRef]
- Smith, P.; Martino, D.; Cai, Z.; Gwary, D.; Janzen, H.; Kumar, P.; McCarl, B.; Ogle, S.; O’Mara, F.; Rice, C.; et al. Agriculture. In Climate Change 2007: Mitigation. Contribution of Working Group III to the Fourth Assessment Report of the Intergovernmental Panel on Climate Change; Metz, B., Davidson, O.R., Bosch, P.R., Dav, R., Meyer, L.A., Eds.; Cambridge University Press: Cambridge, UK; New York, NY, USA, 2007; pp. 498–532. [Google Scholar]
- IPCC. Mitigation of Climate Change: Contribution of Working Group III to the Fifth Assessment Report of the Intergovernmental Panel on Climate Change; Cambridge University Press: Cambridge, UK; New York, NY, USA, 2014; pp. 154–196. [Google Scholar]
- Butterbach-Bahl, K.; Baggs, E.M.; Dannenmann, M.; Kiese, R.; Zechmeister-Boltenstern, S. Nitrous oxide emissions from soils: How well do we understand the processes and their controls? Philos. Trans. R. Soc. Lond. 2013, 368, 20130122. [Google Scholar] [CrossRef] [PubMed]
- Baggs, E.M.; Rees, R.; Smith, K.; Vinten, A. Nitrous oxide emission from soils after incorporating crop residues. Soil Use Manag. 2000, 16, 82–87. [Google Scholar] [CrossRef]
- Fang, C.; Moncrieff, J.B. The dependence of soil CO2 efflux on temperature. Soil Biol. Biochem. 2001, 33, 155–165. [Google Scholar] [CrossRef]
- Minick, K.J.; Pandey, C.B.; Fox, T.R.; Subedi, S. Dissimilatory nitrate reduction to ammonium and N2O flux: Effect of soil redox potential and N fertilization in loblolly pine forests. Biol. Fertil. Soils 2016, 52, 601–614. [Google Scholar] [CrossRef]
- Oertel, C.; Matschullat, J.; Zurba, K.; Zimmermann, F.; Erasmi, S. Greenhouse gas emissions from soils—A review. Chem. Erde 2016, 76, 327–352. [Google Scholar] [CrossRef]
- Ruser, R.; Flessa, H.; Russow, R.; Schmidt, G.; Buegger, F.; Munch, J.C. Emission of N2O, N2 and CO2 from soil fertilized with nitrate: Effect of compaction, soil moisture and rewetting. Soil Biol. Biochem. 2006, 38, 263–274. [Google Scholar] [CrossRef]
- Rubol, S.; Silver, W.L.; Bellin, A. Hydrologic control on redox and nitrogen dynamics in a peatland soil. Sci. Total Environ. 2012, 432, 37–46. [Google Scholar] [CrossRef]
- Porter, G.S.; Bajita-Locke, J.B.; Hue, N.V.; Strand, D. Manganese solubility and phytotoxicity affected by soil moisture, oxygen levels, and green manure additions. Commun. Soil Sci. Plant Anal. 2004, 35, 99–116. [Google Scholar] [CrossRef]
- Fierer, N.; Schimel, J.P.; Holden, P.A. Variations in microbial community composition through two soil depth profiles. Soil Biol. Biochem. 2003, 35, 167–176. [Google Scholar] [CrossRef]
- Li, N.; Yao, S.; You, M.; Zhang, Y.; Qiao, Y.; Zou, W.; Han, X.; Zhang, B. Contrasting development of soil microbial community structure under no-tilled perennial and tilled cropping during early pedogenesis of a Mollisol. Soil Biol. Biochem. 2014, 77, 221–232. [Google Scholar] [CrossRef]
- Flessa, H.; Beese, F. Effects of sugarbeet residues on soil redox potential and nitrous oxide emission. Soil Sci. Soc. Am. J. 1995, 59, 1044–1051. [Google Scholar] [CrossRef]
- Hunting, E.R.; Kampfraath, A.A. Contribution of bacteria to redox potential (Eh) measurements in sediments. Int. J. Environ. Sci. Technol. 2013, 10, 55–62. [Google Scholar] [CrossRef]
- Tokarz, E.; Urban, D. Soil redox potential and its impact on microorganisms and plants of wetlands. J. Ecol. Eng. 2015, 16, 20–30. [Google Scholar] [CrossRef]
- Wang, J.; Bogena, H.R.; Vereecken, H.; Brüggemann, N. Characterizing redox potential effects on greenhouse gas emissions induced by water-level changes. Vadose Zone J. 2018, 17, 1–13. [Google Scholar] [CrossRef]
- Yu, K.; Patrick, W.H. Redox range with minimum nitrous oxide and methane production in a rice soil under different pH. Soil Sci. Soc. Am. J. 2003, 67, 1952–1958. [Google Scholar] [CrossRef]
- Masscheleyn, P.H.; DeLaune, R.D.; Patrick, W.H., Jr. Methane and nitrous oxide emissions from laboratory measurements of rice soil suspension: Effect of soil oxidation-reduction status. Chemosphere 1993, 26, 251–260. [Google Scholar] [CrossRef]
- Fiedler, S.; Vepraskas, M.J.; Richardson, J.L. Soil redox potential: Importance, field measurements, and observations. Adv. Agron. 2007, 94, 1–54. [Google Scholar] [CrossRef]
- Marin, J.C.A.; Caravelli, A.H.; Zaritzky, N.E. Nitrification and aerobic denitrification in anoxic–aerobic sequencing batch reactor. Bioresour. Technol. 2016, 200, 380–387. [Google Scholar] [CrossRef] [PubMed]
- Cheng, Y.; Zhang, J.B.; Wang, J.; Cai, Z.C.; Wang, S.Q. Soil pH is a good predictor of the dominating N2O production processes under aerobic conditions. J. Plant Nutr. Soil Sci. 2015, 178, 370–373. [Google Scholar] [CrossRef]
- Li, P.; Lang, M. Gross nitrogen transformations and related N2O emissions in uncultivated and cultivated black soil. Biol. Fertil. Soils 2014, 50, 197–206. [Google Scholar] [CrossRef]
- Linn, D.M.; Doran, J.W. Effect of water-filled pore space on carbon dioxide and nitrous oxide production in tilled and nontilled soils. Soil Sci. Soc. Am. J. 1984, 48, 1267–1272. [Google Scholar] [CrossRef]
- Smith, M.S.; Tiedje, J.M. Phases of denitrification following oxygen depletion in soil. Soil Biol. Biochem. 1979, 11, 261–267. [Google Scholar] [CrossRef]
- Hansen, M.; Clough, T.J.; Elberling, B. Flooding-induced N2O emission bursts controlled by pH and nitrate in agricultural soils. Soil Biol. Biochem. 2014, 69, 17–24. [Google Scholar] [CrossRef]
- Hunting, E.R.; Van der Geest, H.G. Predictability of bacterial activity and denitrification in aquatic sediments with continuous measurements of redox potential. Int. J. Environ. Sci. Technol. 2011, 8, 553–560. [Google Scholar] [CrossRef]
- Bogena, H.R.; Montzka, C.; Huisman, J.A.; Graf, A.; Schmidt, M.; Stockinger, M.; Von Hebel, C.; Hendricks-Franssen, H.J.; Van der Kruk, J.; Tappe, W.; et al. The TERENO-Rur Hydrological Observatory: A Multiscale Multi-Compartment Research Platform for the Advancement of Hydrological. Science. Vadose Zone J. 2018, 17, 1–22. [Google Scholar] [CrossRef]
- Korres, W.; Reichenau, T.G.; Fiener, P.; Koyama, C.N.; Bogena, H.R.; Cornelissen, T.; Baatz, R.; Herbst, M.; Diekkrüger, B.; Vereecken, H.; et al. Spatio-temporal soil moisture patterns—A meta-analysis using plot to catchment scale data. J. Hydrol. 2015, 520, 326–341. [Google Scholar] [CrossRef]
- Parkin, T.B.; Venterea, R.T. USDA-ARS GRACEnet Project Protocols: Chamber-Based Trace Gas Flux Measurements. Sampling Protocols; USDA-ARS: Washington, WA, USA, 2010; Chapter 3; pp. 1–39. [Google Scholar]
- Xu, X.; Han, L.; Luo, X.; Liu, Z.; Han, S. Effects of nitrogen addition on dissolved N2O and CO2, dissolved organic matter, and inorganic nitrogen in soil solution under a temperate old-growth forest. Geoderma 2009, 151, 370–377. [Google Scholar] [CrossRef]
- Ibraim, E.; Wolf, B.; Harris, E.; Gasche, R.; Wei, J.; Yu, L.; Kiese, R.; Eggleston, S.; Butterbach-Bahl, K.; Zeeman, M.; et al. Attribution of N2O sources in a grassland soil with laser spectroscopy based isotopocule analysis. Biogeosciences 2019, 16, 3247–3266. [Google Scholar] [CrossRef]
- Heil, J.; Liu, S.; Vereecken, H.; Brueggemann, N. Abiotic nitrous oxide production from hydroxylamine in soils and their dependence on soil properties. Soil Biol. Biochem. 2015, 84, 107–115. [Google Scholar] [CrossRef]
- Wei, J.; Amelung, W.; Lehndorff, E.; Schloter, M.; Vereecken, H.; Brüggemann, N. N2O and NOx emissions by reactions of nitrite with soil organic matter of a Norway spruce forest. Biogeochemistry 2017, 132, 325–342. [Google Scholar] [CrossRef]
- Decock, C.; Six, J. How reliable is the intramolecular distribution of 15N in N2O to source partition N2O emitted from soil? Soil Biol. Biochem. 2013, 65, 114–127. [Google Scholar] [CrossRef]
- Toyoda, S.; Yoshida, N.; Koba, K. Isotopocule analysis of biologically produced nitrous oxide in various environments. Mass Spectrom. Rev. 2017, 36, 135–160. [Google Scholar] [CrossRef]
- Nason, G.E.; Myrold, D.D. 15N in soil research: Appropriate application of rate estimation procedures. Agric. Ecosyst. Environ. 1991, 34, 427–441. [Google Scholar] [CrossRef]
- Mulvaney, R.L.; Khan, S.A.; Stevens, W.B.; Mulvaney, C.S. Improved diffusion methods for determination of inorganic nitrogen in soil extracts and water. Biol. Fertil. Soils 1997, 24, 413–420. [Google Scholar] [CrossRef]
- Huber, B.; Bernasconi, S.M.; Pannatier, E.G.; Luster, J. A simple method for the removal of dissolved organic matter and δ15N analysis of NO3- from freshwater. Rapid Commun. Mass Spectrom. 2012, 26, 1475–1480. [Google Scholar] [CrossRef] [PubMed]
- Wei, J.; Reichel, R.; Islam, M.S.; Wissel, H.; Amelung, W.; Brüggemann, N. Chemical composition of high organic carbon soil amendments affects fertilizer-derived N2O emission and nitrogen immobilization in an oxic sandy loam. Front Environ Sci. 2020, 8, 1–15. [Google Scholar] [CrossRef]
- Mitsch, W.J.; Gosselink, J.G. Wetlands, 4th ed.; Wiley: Hoboken, NJ, USA, 2015; p. 736. [Google Scholar]
- Toyoda, S.; Yoshida, O.; Yamagishi, H.; Fujii, A.; Yoshida, N.; Watanabe, S. Identifying the origin of nitrous oxide dissolved in deep ocean by concentration and isotopocule analyses. Sci. Rep. 2019, 9, 1–9. [Google Scholar] [CrossRef]
- de Klein, C.A.; Monaghan, R.M. The effect of farm and catchment management on nitrogen transformations and N2O losses from pastoral systems—Can we offset the effects of future intensification? Curr. Opin. Environ. Sustain. 2011, 3, 396–406. [Google Scholar] [CrossRef]
- Luo, J.; Saggar, S.; Bhandral, R.; Bolan, N.; Ledgard, S.; Lindsey, S.; Sun, W. Effects of irrigating dairy-grazed grassland with farm dairy effluent on nitrous oxide emissions. Plant Soil 2008, 309, 119–130. [Google Scholar] [CrossRef]
- Skiba, U.; Sheppard, L.; Pitcairn, C.E.R.; Leith, I.; Crossley, A.; Van Dijk, S.; Fowler, D. Soil nitrous oxide and nitric oxide emissions as indicators of elevated atmospheric N deposition rates in seminatural ecosystems. Environ. Pollut. 1998, 102, 457–461. [Google Scholar] [CrossRef]
- Dorau, K.; Luster, J.; Mansfeldt, T. Soil aeration: The relation between air-filled pore volume and redox potential. Eur. J. Soil Sci. 2018, 69, 1035–1043. [Google Scholar] [CrossRef]
- Morales-Olmedo, M.; Ortiz, M.; Sellés, G. Effects of transient soil waterlogging and its importance for rootstock selection. Chil. J. Agric. Res. 2015, 75, 45–56. [Google Scholar] [CrossRef]
- Pezeshki, S.R. Wetland plant responses to soil flooding. Environ. Exp. Bot. 2001, 46, 299–312. [Google Scholar] [CrossRef]
- Kralova, M.; Masscheleyn, P.H.; Patrick, W.H., Jr. Redox potential as an indicator of electron availability for microbial activity and nitrogen transformations in aerobic soil. Zentralbl. Mikrobiol. 1992, 147, 388–399. [Google Scholar] [CrossRef]
- Burgin, A.J.; Yang, W.H.; Hamilton, S.K.; Silver, W.L. Beyond carbon and nitrogen: How the microbial energy economy couples elemental cycles in diverse ecosystems. Front Ecol. Environ. 2011, 9, 44–52. [Google Scholar] [CrossRef]
- Buresh, R.J.; Patrick, W.H., Jr. Nitrate reduction to ammonium and organic nitrogen in an estuarine sediment. Soil Biol. Biochem. 1981, 13, 279–283. [Google Scholar] [CrossRef]
- Buresh, R.J.; Patrick, W.H., Jr. Nitrate reduction to ammonium in anaerobic soil. Soil Sci. Soc. Am. J. 1978, 42, 913–918. [Google Scholar] [CrossRef]
- Ye, R.; Horwath, W.R. Nitrous oxide uptake in rewetted wetlands with contrasting soil organic carbon contents. Soil Biol. Biochem. 2016, 100, 110–117. [Google Scholar] [CrossRef]
- Martikainen, P.J.; Nykänen, H.; Crill, P.; Silvola, J. Effect of a lowered water table on nitrous oxide fluxes from northern peatlands. Nature 1993, 366, 51–53. [Google Scholar] [CrossRef]
- Regina, K.; Nykänen, H.; Silvola, J.; Martikainen, P.J. Fluxes of nitrous oxide from boreal peatlands as affected by peatland type, water table level and nitrification capacity. Biogeochemistry 1996, 35, 401–418. [Google Scholar] [CrossRef]
- Akiyama, H.; Tsuruta, H.; Watanabe, T. N2O and NO emissions from soils after the application of different chemical fertilizers. Chemosphere 2000, 2, 313–320. [Google Scholar] [CrossRef]
- Comfort, S.D.; Kelling, K.A.; Keeney, D.R.; Converse, J.C. Nitrous oxide production from injected liquid dairy manure. Soil Sci. Soc. Am. J. 1990, 54, 421–427. [Google Scholar] [CrossRef]
- Husson, O. Redox potential (Eh) and pH as drivers of soil/plant/microorganism systems: A transdisciplinary overview pointing to integrative opportunities for agronomy. Plant Soil 2013, 362, 389–417. [Google Scholar] [CrossRef]
- Włodarczyk, T.; Stępniewski, W.; Brzezińska, M. Dehydrogenase activity, redox potential, and emissions of carbon dioxide and nitrous oxide from Cambisols under flooding conditions. Biol. Fertil. Soils 2002, 36, 200–206. [Google Scholar] [CrossRef]
Publisher’s Note: MDPI stays neutral with regard to jurisdictional claims in published maps and institutional affiliations. |
© 2020 by the authors. Licensee MDPI, Basel, Switzerland. This article is an open access article distributed under the terms and conditions of the Creative Commons Attribution (CC BY) license (http://creativecommons.org/licenses/by/4.0/).