Article

Detection of Cover Collapse Doline and Other Epikarst Features by Multiple Geophysical Techniques, Case Study of Tarimba Cave, Brazil

1
Environmental Engineering and Earth Science Department, 445 Bracket Hall, Clemson University, Clemson, SC 29634, USA
2
Department of Geography, University of Brasilia, Brasilia 70910-900, Brazil
3
Institute of Geosciences, University of Brasilia, Brasilia 70910-900, Brazil
4
Institute of Astronomy, Geophysics and Atmospheric Sciences, São Paulo University (USP), São Paulo 05508-090, Brazil
5
School of Natural and Built Environment, College of Science and Engineering, University of Derby, Derby DE22 AW, UK
6
Facultad de Ingeniería, Universidad Nacional Autónoma de México UNAM, Mexico City 04510, Mexico
7
Geology Department, Liège University, 4032 Liège, Belgium
8
Department of Civil and Environmental Engineering, Nagaoka University of Technology, 1603-1, Kami-Tomioka, Nagaoka 940-2188, Japan
*
Author to whom correspondence should be addressed.
Water 2020, 12(10), 2835; https://doi.org/10.3390/w12102835
Submission received: 18 August 2020 / Revised: 26 September 2020 / Accepted: 28 September 2020 / Published: 12 October 2020
(This article belongs to the Section Hydrology)

Abstract

:
Reliable characterization of the karst system is essential for risk assessment where many associated hazards (e.g., cover-collapse dolines and groundwater pollution) can affect natural and built environments, threatening public safety. The use of multiple geophysical approaches may offer an improved way to investigate such cover-collapse sinkholes and aid in geohazard risk assessments. In this paper, covered karst, which has two types of shallow caves (vadose and fluvial) located in Tarimba (Goias, Brazil), was investigated using various geophysical methods to evaluate their efficiency in the delineation of the geometry of sediments filled sinkhole. The methods used for the investigation were Electrical Resistivity Tomography (ERT), Seismic Refraction Survey (SRS), Seismic Refraction Tomography (SRT) and the Very Low Frequency Electromagnetic (VLF-EM) method. The study developed several (2D) sections of the measured physical properties, including P-wave velocity and electrical resistivity, as well as the induced current (because of local bodies). For the analysis and processing of the data obtained from these methods, the following approaches were adopted: ERT inversion using a least-square scheme, Karous-Hjelt filter for VLF-EM data and time-distance curves and Vp cross-sections for the SRS. The refraction data analysis showed three-layered stratigraphy topsoil, claystone and carbonate bedrock, respectively. The findings obtained from ERT (three-layered stratigraphy and sediment-filled doline), as well as VLF-EM (fractured or filled caves as a positive anomaly), were found to be consistent with the actual field conditions. However, the SRS and SRT methods did not show the collapsed material and reached the limited the depth because of shorter profile lengths. The study provides a reasonable basis for the development of an integrated geophysical approach for site characterization of karst systems, particularly the perched tank and collapse doline.

1. Introduction

Karst landform is a geological feature that usually develops from the dissolution effect of groundwater on soluble carbonate rocks [1,2]. Such a process is very complicated to predict [3,4], but it may create underground cavities, which distresses the overburden, leading (sometimes) to an opening in the ground surface in the form of sinkholes [5]. Surface collapses may occur abruptly, causing catastrophic damage to built environments including properties and infrastructures (e.g., highway subsidence, building-foundation collapse and dam leakage) as well as the loss of lives [6]. Moreover, underground karst waters are significantly vulnerable to pollution because of the direct connection between surface morphology and the underlying aquifer [7,8]. Therefore, geohazard assessments of karst areas must consider two crucial risks; firstly, the risk of subsidence caused by the collapse of the cavities (geological hazard); and secondly, the risk of pollution of the aquifers occupying the karst cavities (environmental hazard), which can have an important role in the hydrodynamics therein, especially in arid and semiarid regions [9]. These underground cavities need to be well detected before commencing any construction activities or groundwater management projects, which is why the study of karst cavities is of great interest to civil engineers and hydrogeologists.
Some karst features are visible on the surface, which can be mapped based on their relatively more substantial size. However, cavities (which are usually covered with sediments and vegetation) are difficult to assess by surficial means. Under these circumstances, their indirect characterization by geophysical methods becomes an attractive alternative [10]. To this end, geophysical methods can potentially play a significant role in the detection of such subsurface cavities, as well as mapping their area extension and even estimating their volume [11]. Over the past years, near-surface geophysical techniques have proved effective in the site characterization of karst systems [12,13]. Each geophysical technique measures a specific physical property of the subsurface material over the karst areas. The geophysical responses recorded over caves can work well if we consider their relatively large size and the sharp contrasts with the surrounding rocks [12,14]. Important site parameters that need to be considered are the type of sediments and their conditions (e.g., clay and moisture contents, density and thickness) that can significantly affect the recorded geophysical signature of the investigated site [12,14].
Besides that, karst provides a complicated environment because of subsurface heterogeneities, which present a significant challenge to engineering and environmental studies [15]. Under these conditions, integrated geophysical techniques may offer an improved approach to investigate karst systems. Geophysical techniques such as Seismic Refraction Survey (SRS), Seismic Refraction Tomography (SRT) Electrical Resistivity Tomography (ERT) and Very Low Frequency Electromagnetic (VLF-EM) have potential for site characterizations, which can be otherwise very costly if an intrusive geotechnical investigation is solely used for detailed studies [16].
A comprehensive summary of the currently used geophysical methods in the investigations of karst has been provided by [17]. The effective application of (1) Ground-Penetrating Radar (GPR) has been applied for the investigation of uncovered karst (no clay covering) [18] by Xiaojun et al. 2010; [4]; (2) microgravimetry is also proved as a successful technique for the detection of superficial empty and filled voids and to characterize karst heterogeneity [19]; (3) with Seismic Refraction Tomography (SRT), detailed and more in-depth information of karst features can be obtained [3,20,21]; (4) electrical resistivity tomography (ERT) is used to characterize karstic features. To date, most of the karstic structures identified are sinkholes [22,23] voids [24], soil and bedrock interfaces [25] and karstic aquifer geometries [17].
In Brazil, the following research works have been applied for the analysis of several caves across the country: [26,27,28,29,30]. However, no previous study has applied geophysical investigation to characterize the caves in the preserved area of the Mambaí, Goiás (River Vermelho) where borehole drilling is prohibited. The latest study, conducted in this area by the authors [2], indicated that Electrical Resistivity Tomography (ERT) and Very Low Frequency Electromagnetic (VLF-EM) are more effective than Ground Penetrating Radar (GPR), as the latter approach could not reach the required depth because of the highly attenuated nature of the cover material.
Expanding on this research, the present study reports a further geophysical investigation on the same cave (but at different sites and acquisition geometries) to characterize the existing karst system. The study adopted different geophysical techniques, including ERT, SRS, SRT and VLF-EM method. Because of its efficiency, ERT was used as a control, and the other three approaches (SRS, SRT and VLF-EM) were applied as a complementary, as they can also provide the preliminary information required for the inversion of resistivity values. The adopted approach was conducted in a selected portion of the Tarimba cave area. The suitability of the applied techniques is discussed based on the obtained results with the aim of contributing to the development of a framework for comprehensive studies of caves in the Southern hemisphere.

2. Site Description and Geology of the Area
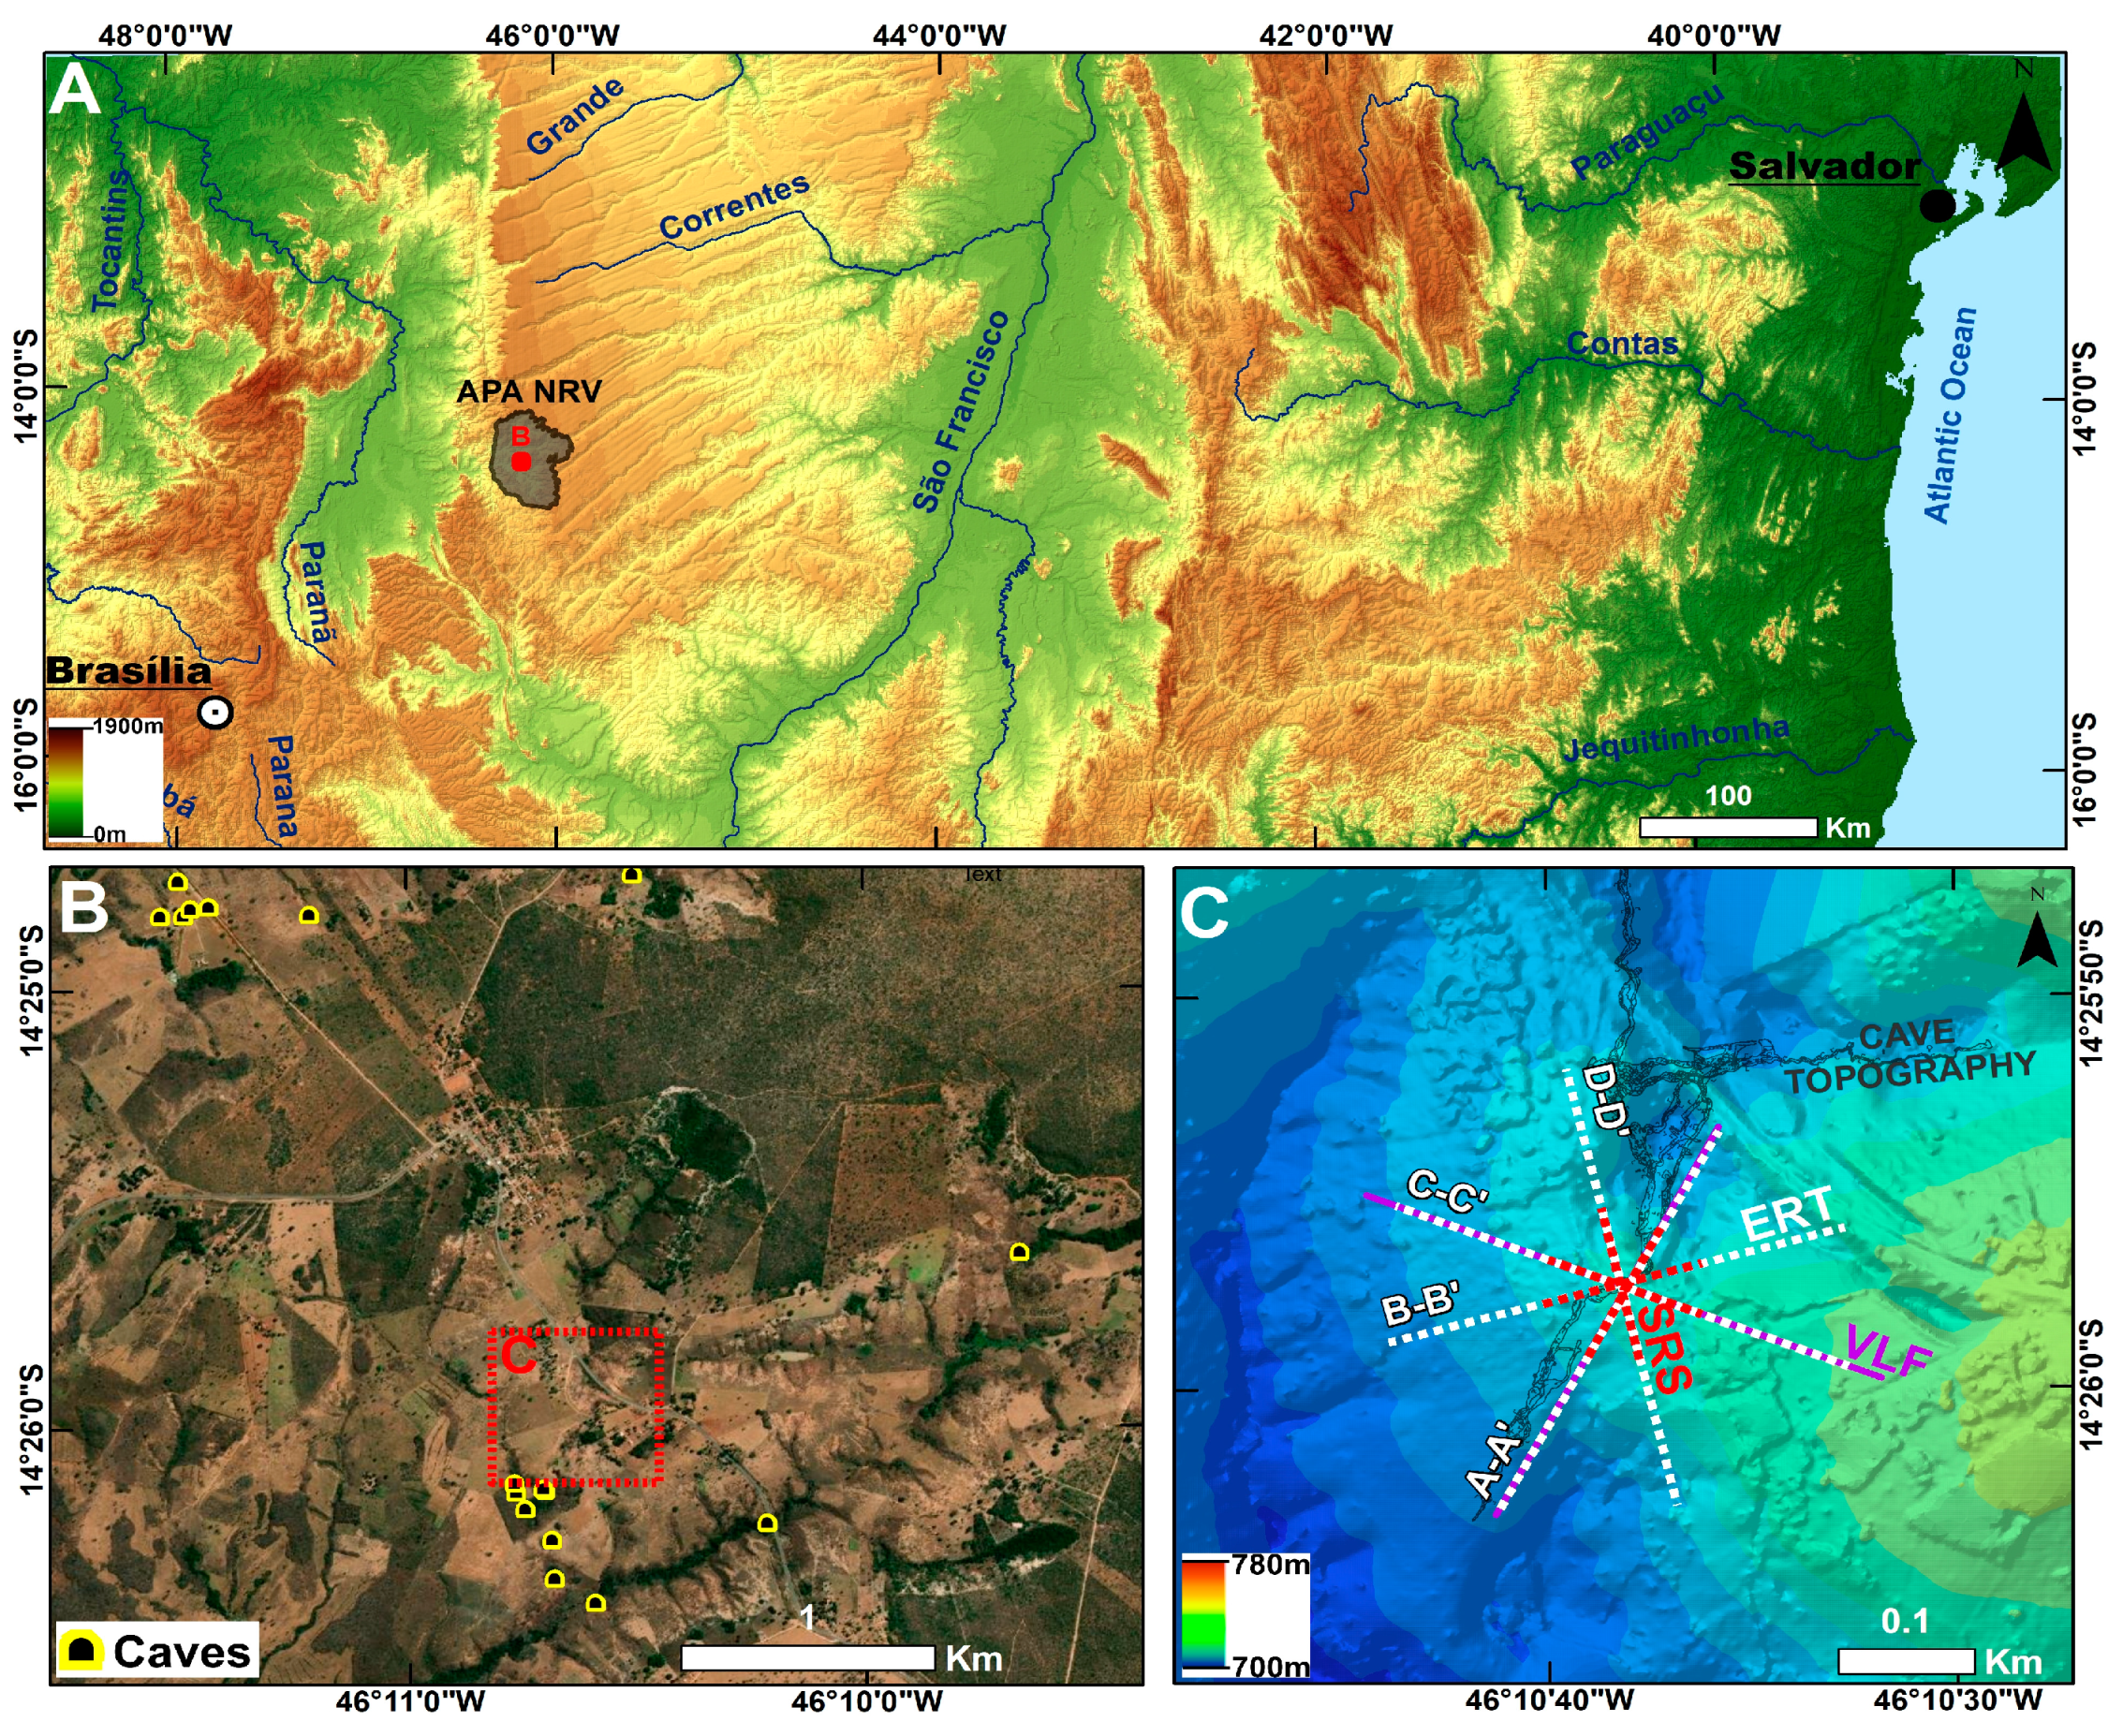
2.1. Study Area

In the Brazilian states of Minas Gerais, São Paulo, Mato Grosso do Sul, Bahia, Ceará, Goiás and Tocantins host karst environments [31]. The study area (Figure 1) is located at the junction of the municipality of Mambai. The climate of the region is tropical, with dry and rainy seasons [32]. The Tarimba Cave, which is more than 11 km in length, has two known openings. It is one of the most important caves in the region (i.e., with a high level of biodiversity) and is one of the largest in the country in horizontal projection. These carbonate terrains belong to the Precambrian Bambuí group, and the western portion of the area is drained by the Tocantins River, flowing to the Amazon Delta region. The preservation area of the Vermelho River (2000 km2) lies in the Corrente Basin (4000 km2), where there are 164 mapped caves. There is strong geological control over the emergence of geomorphological units in the region with highlands and escarpment adjusted (i.e., eroded to the base level) to the cretaceous sandstone and karst terrain and lowlands within the carbonate. The study area presents a covered karst system, where the karst features are often located under claystone (Neoproterozoic) [2].

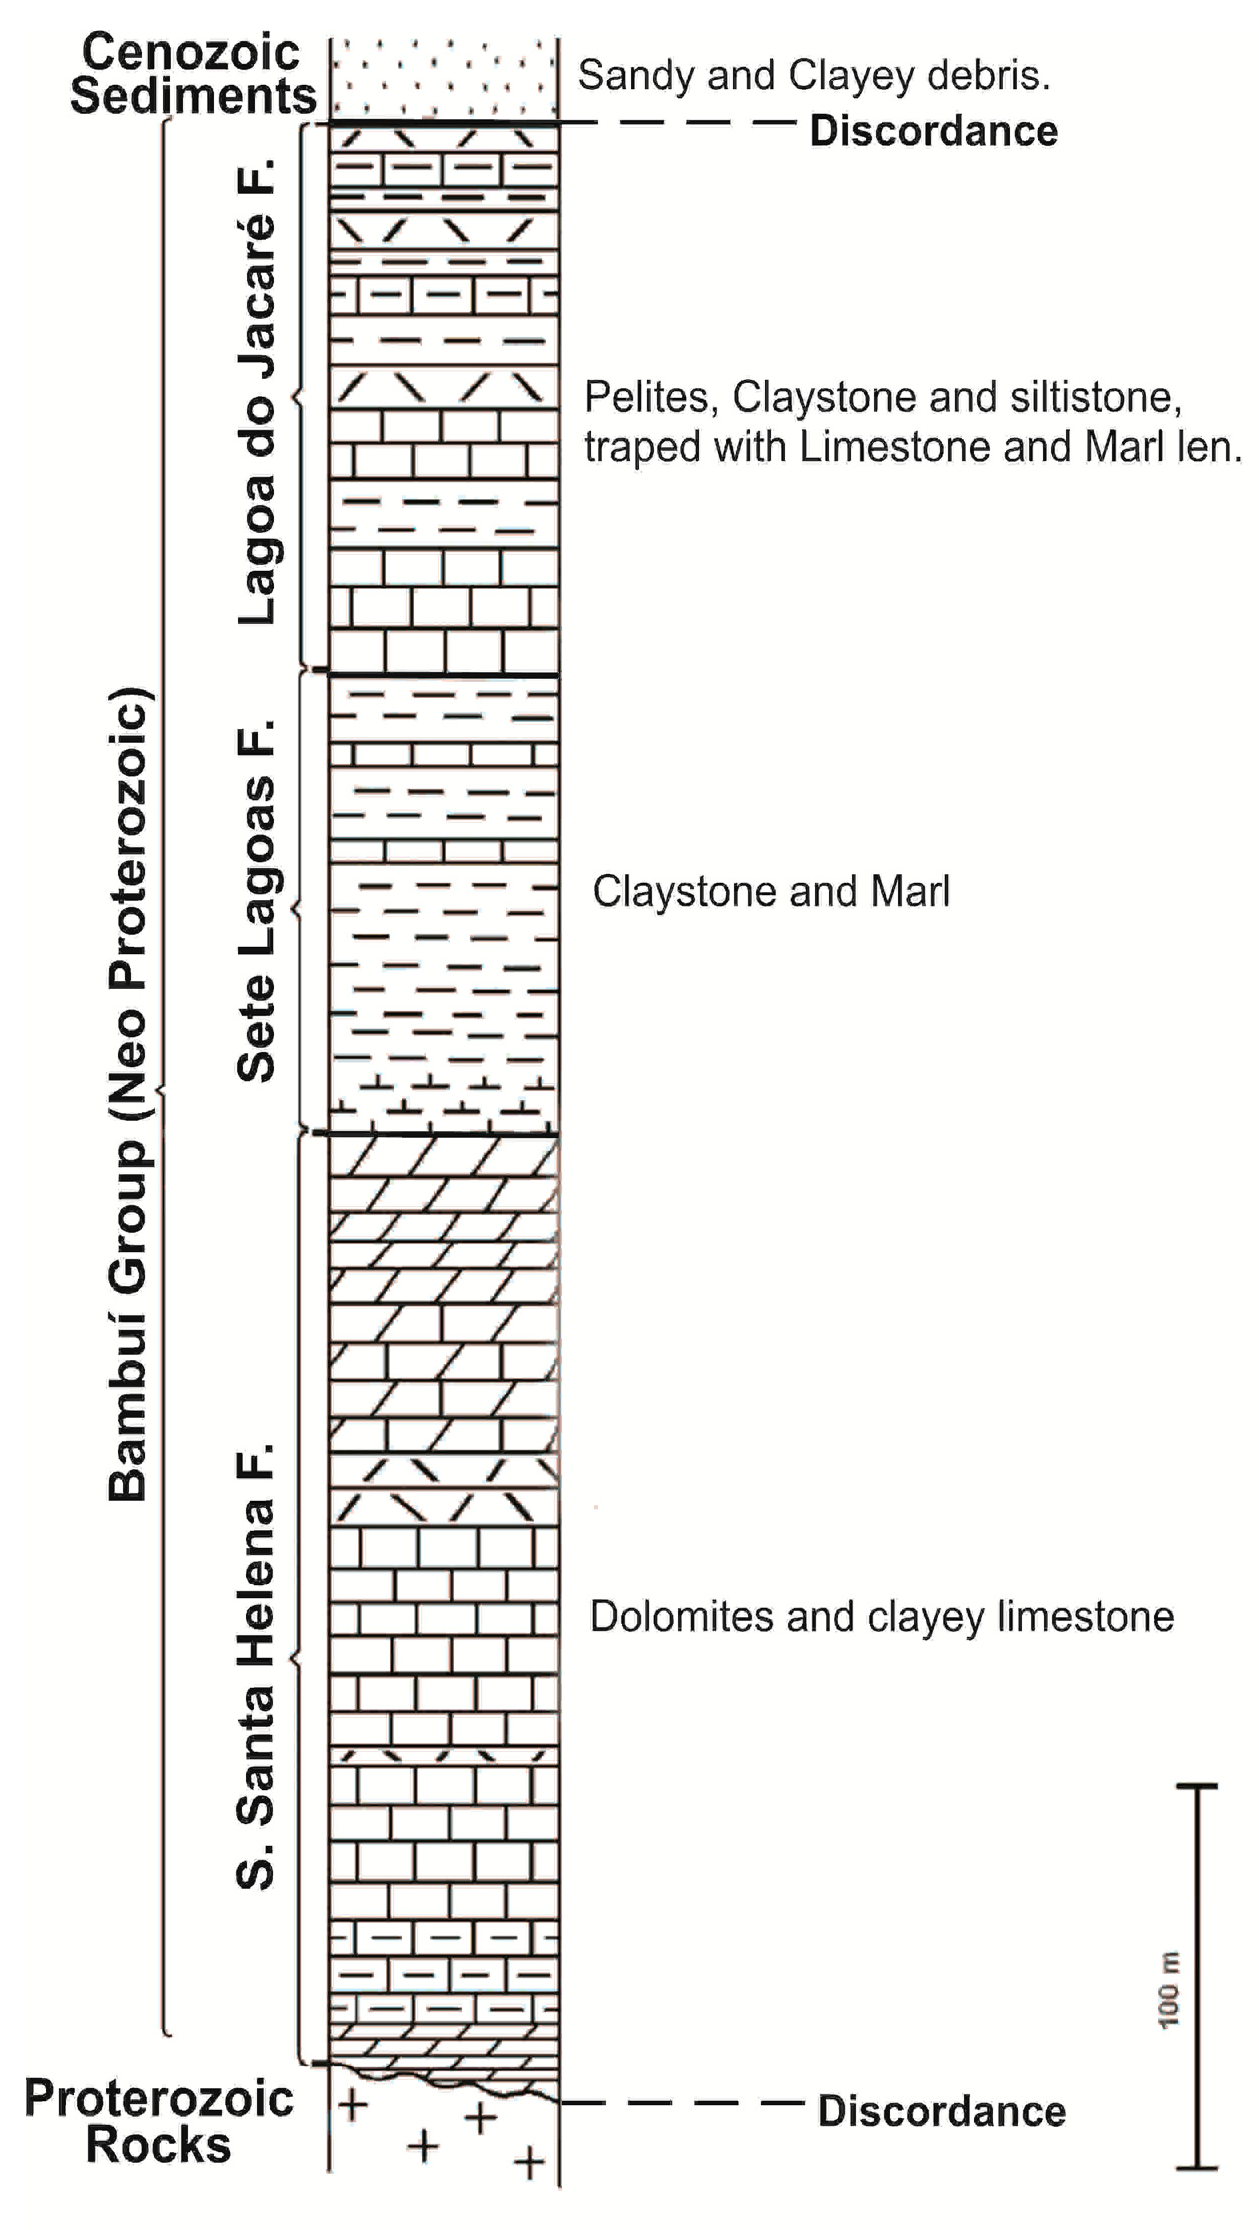
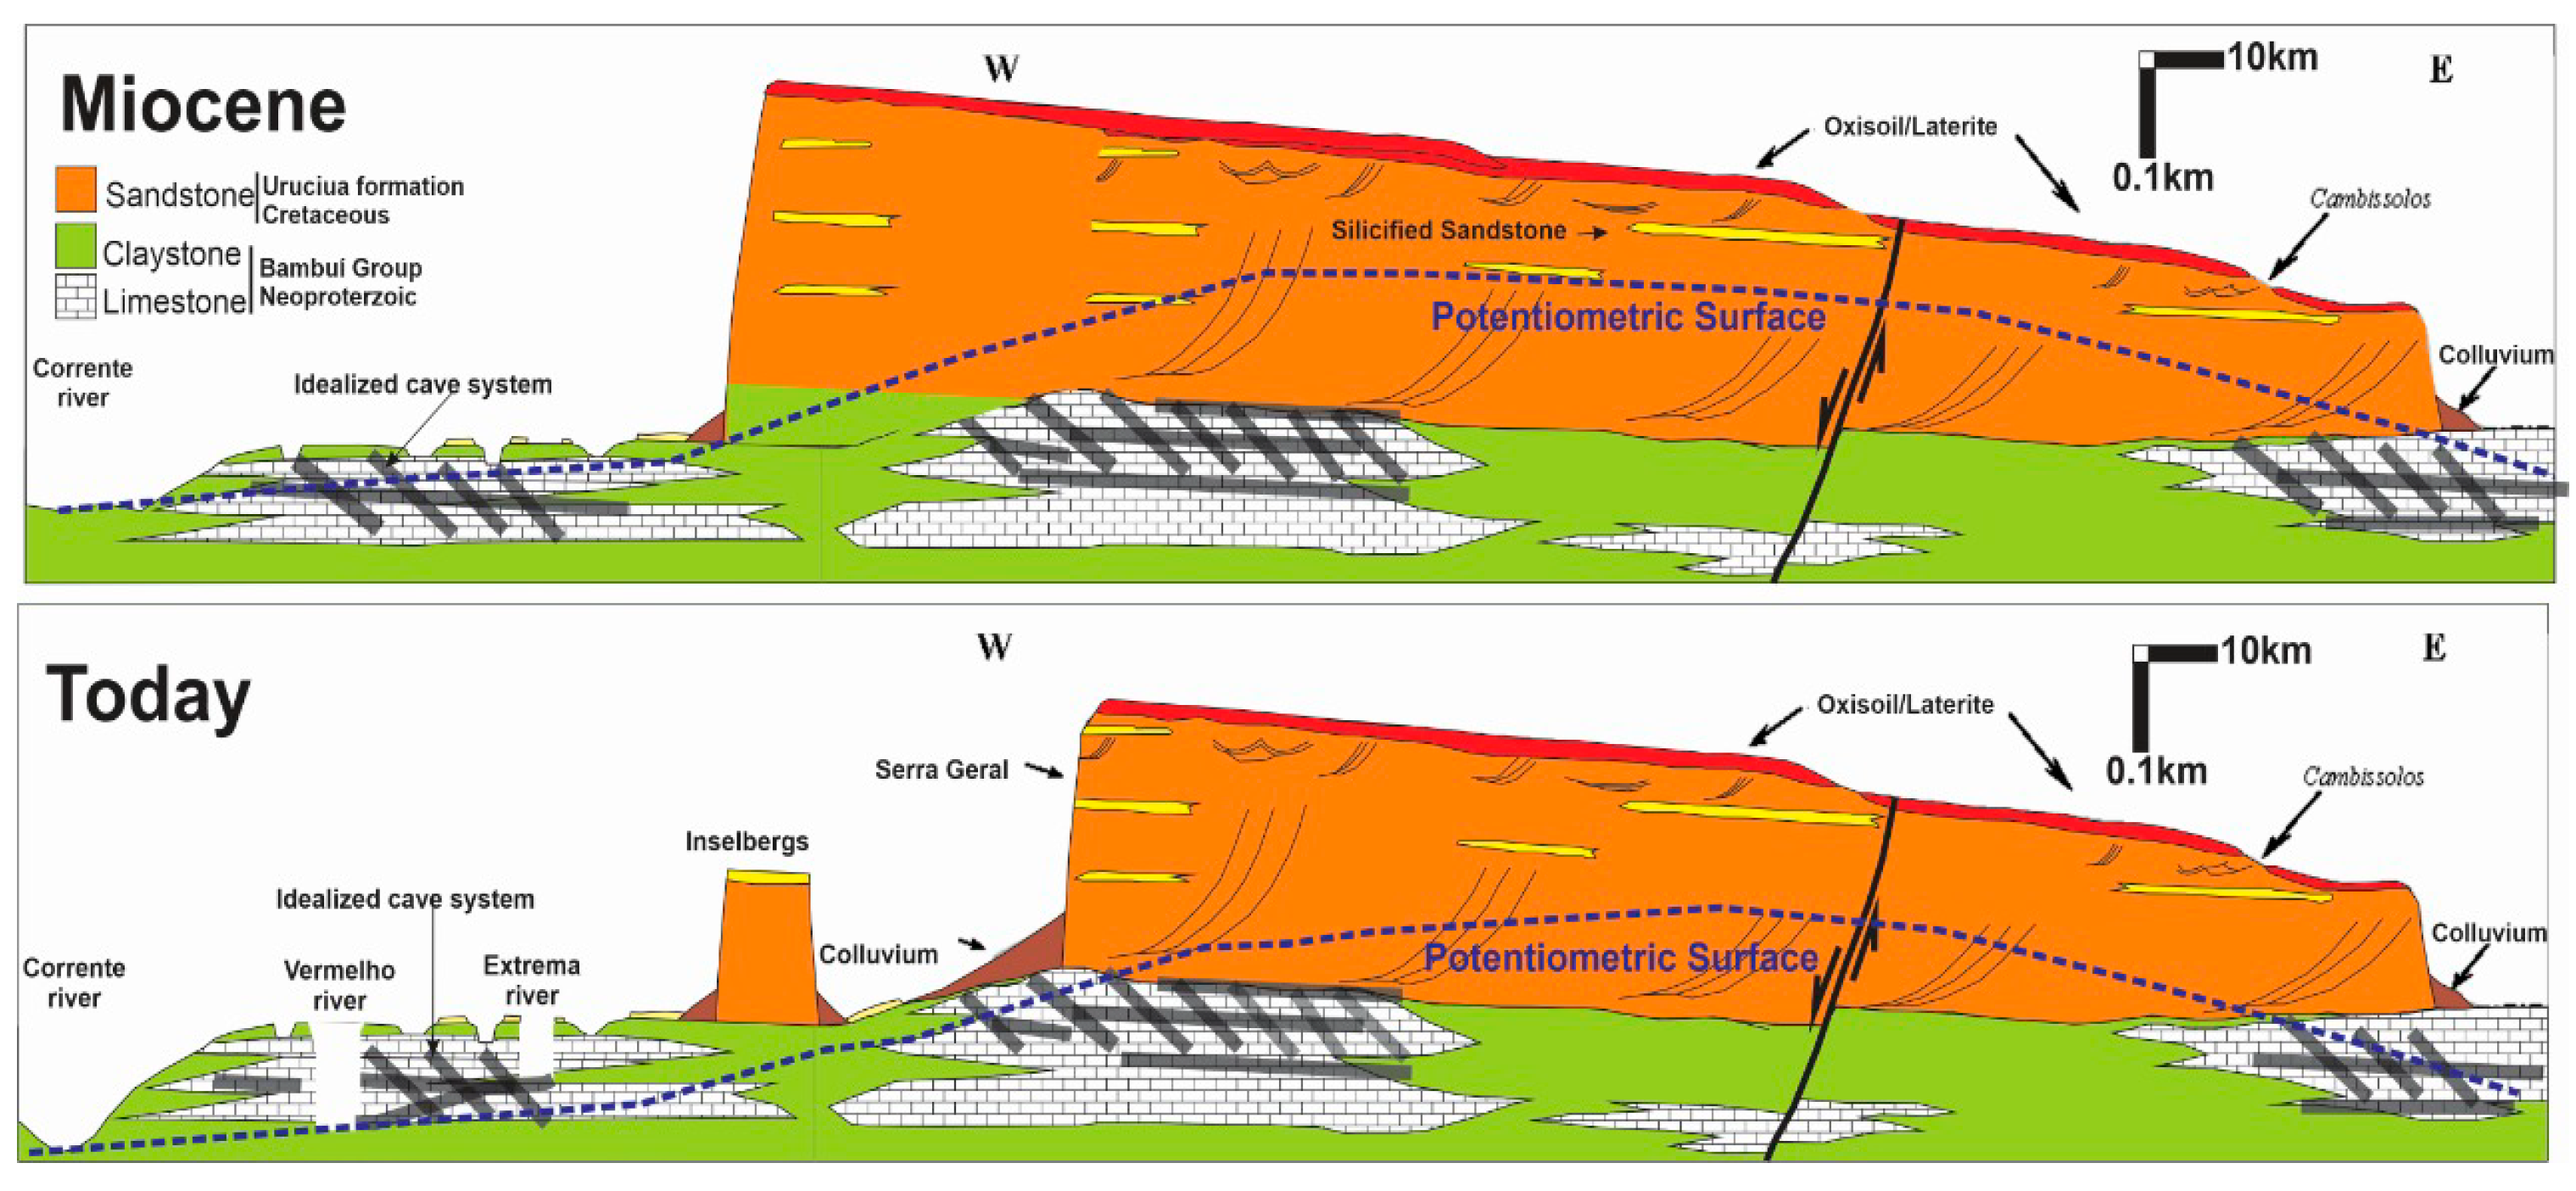
2.2. Geology and Geomorphology

In the area, there are numerous rivers such as the Corrente, Vermelho and Buritis. The main streams are the Bezerra, Piracanjuba, Rizada, Chumbada, Ventura and Extrema, and depressions commonly called ‘grota’, which have water only in the rainy season, forming a drainage network. Some of the watercourses penetrate the sinks or the soil, becoming subterranean, and later again emerge as resurgences or springs on the surface, promoting the formation of caves in the region [32]. According to previous studies, the northeastern region of Goias presents lands with stratigraphic records of the Archean, Proterozoic, Mesozoic and Cenozoic ages, most of which are Proterozoic, including the following units: Ticunzal formation, sequence of volcanic-sedimentary rocks of Palmeirópolis and São Domingos, the Arai group, Serra Branca, Tonalito São Domingos, the Paranoá group and the Bambuí group [33,34].
Locally, geology is marked by Cretaceous sandstone with continental and fluvial deposition from Urucuia formation and Proterozoic Carbonate and Claystone from the Lagoa do Jacaré Formation of Bambuí Group, linked by Cenozoic sediments from alluvial and colluvial deposits and detritus-lateritic cover [33]. The stratigraphic column of the nearby well is presented in Figure 2. In the study area, we can expect a stratigraphy with Cenozoic debris from colluvial and alluvial from the urucuia escarpment retreat on the top, and a sequence of Neoproterozoic formations (Lagoa do Jacaré, Sete Lagoas and Serra de Santa Helena) with Dolomites, Limestones and Marls trapped by clayey and silty levels (Figure 3).
The northeastern region of the State of Goiás integrates several geomorphological domains which represent remnants of the oldest topography. It is drained by the Paranoá and Maranhão Rivers, which form the Tocantins River [32]. Locally, Urucuia formations control the escarpment, Lagoa do Jacaré formations controls the karst terrains and the alluvial and colluvial sediments form an almost flat talus. These geomorphological features are shown in Figure 3 as (3a) the escarpment; (3b) the very flat upper part of the sandstone; (3c) the formation of oxisoil; (3d) dolines opened in convex-concave hill-slopes covered by claystone; (3e) canyons compartment formed as a result of cave collapse; and (3f) the lower basing part, connected with the base level.
In the northeastern region of the State of Goiás, the following soil classes and sediments were found: oxisoils, podzolic, cambisols, plinthsol, gleysol, sands, hydromorphic quartz, organic soils, quartz sands, alluvial soils and petroplinthic soils. It is important to note that the BambuÍ Group is seldom found exposed, but is mostly covered by claystone, forming covered karst [2].
The cave systems in the area include vadose conduits (shallow) and phreatic conduits (deep). The conceptual model (Figure 4) shows the evolution of caves in the region based on the following three hypotheses: (i) epigenic caves, which were formed before the retraction of the overlaying sandstone controlled by groundwater of the sandstone aquifer; (ii) at the time of retraction of Urucia formation, the caves were exposed on the Bambuí group rocks and started receiving clastic sediments from the sandstone debris; and (iii) the incision of the Corrente River provoked changes in the local base level, that made a connection between the older vadose caves and the new phreatic/fluvial systems that end inside the canyons [33,34,35].

2.3. Cover-Collapse Doline & Perched Aquifer

Cover-collapse doline originating from cohesive soil is a rapidly developing and dangerous form of sinkholes [3]. They usually occur in covered karst systems where fluvial agents are found to be very active. The surficial channels erode and bring the sediments to the already existent sinkholes. These sediments start depositing in the sinkhole and get compacted over time. At this stage, rivers (underneath the fluvial karst) may start eroding their base, leading to the collapse of these cohesive sediments. This may lead to a recollapse of the sinkhole on the surface. This sinkhole starts receiving sediments again, restarting the erosion/deposition cycle. Detailed presentation of this sinkhole mechanism and its collapse was provided by [37]. Many sinkholes identified in the study area are shown in Figure 5. A cover-collapse occurs where the increased cohesion of a relatively higher clay content in the overburden delays failure until a collapse happens [38] (Sinclair et al. 1985). This structure can also act as a seepage conduit, which leads to the formation of dissolution cavities at depth.
The clayey material cannot form an aquifer, as it is not permeable; instead, it constitutes the base of a perched aquifer (e.g., an epikarst). In the nearest part of the surface, water infiltration can be temporarily retained by forming a small temporary perched aquifer, i.e., “the epikarst”. This part is characterized by a high porosity created by the weathering of limestone to claystone. A detailed description of this perched aquifer can be found in [39]. These structures have significant impacts on the hydrology of the area. The presence of these structures can make it difficult to identify the groundwater development points in these areas, especially when detected by geophysical means. The tubewell reaching these points only pumps a small amount of water and then becomes dry. They can also lead to the subsidence of the site.

3. Methodology

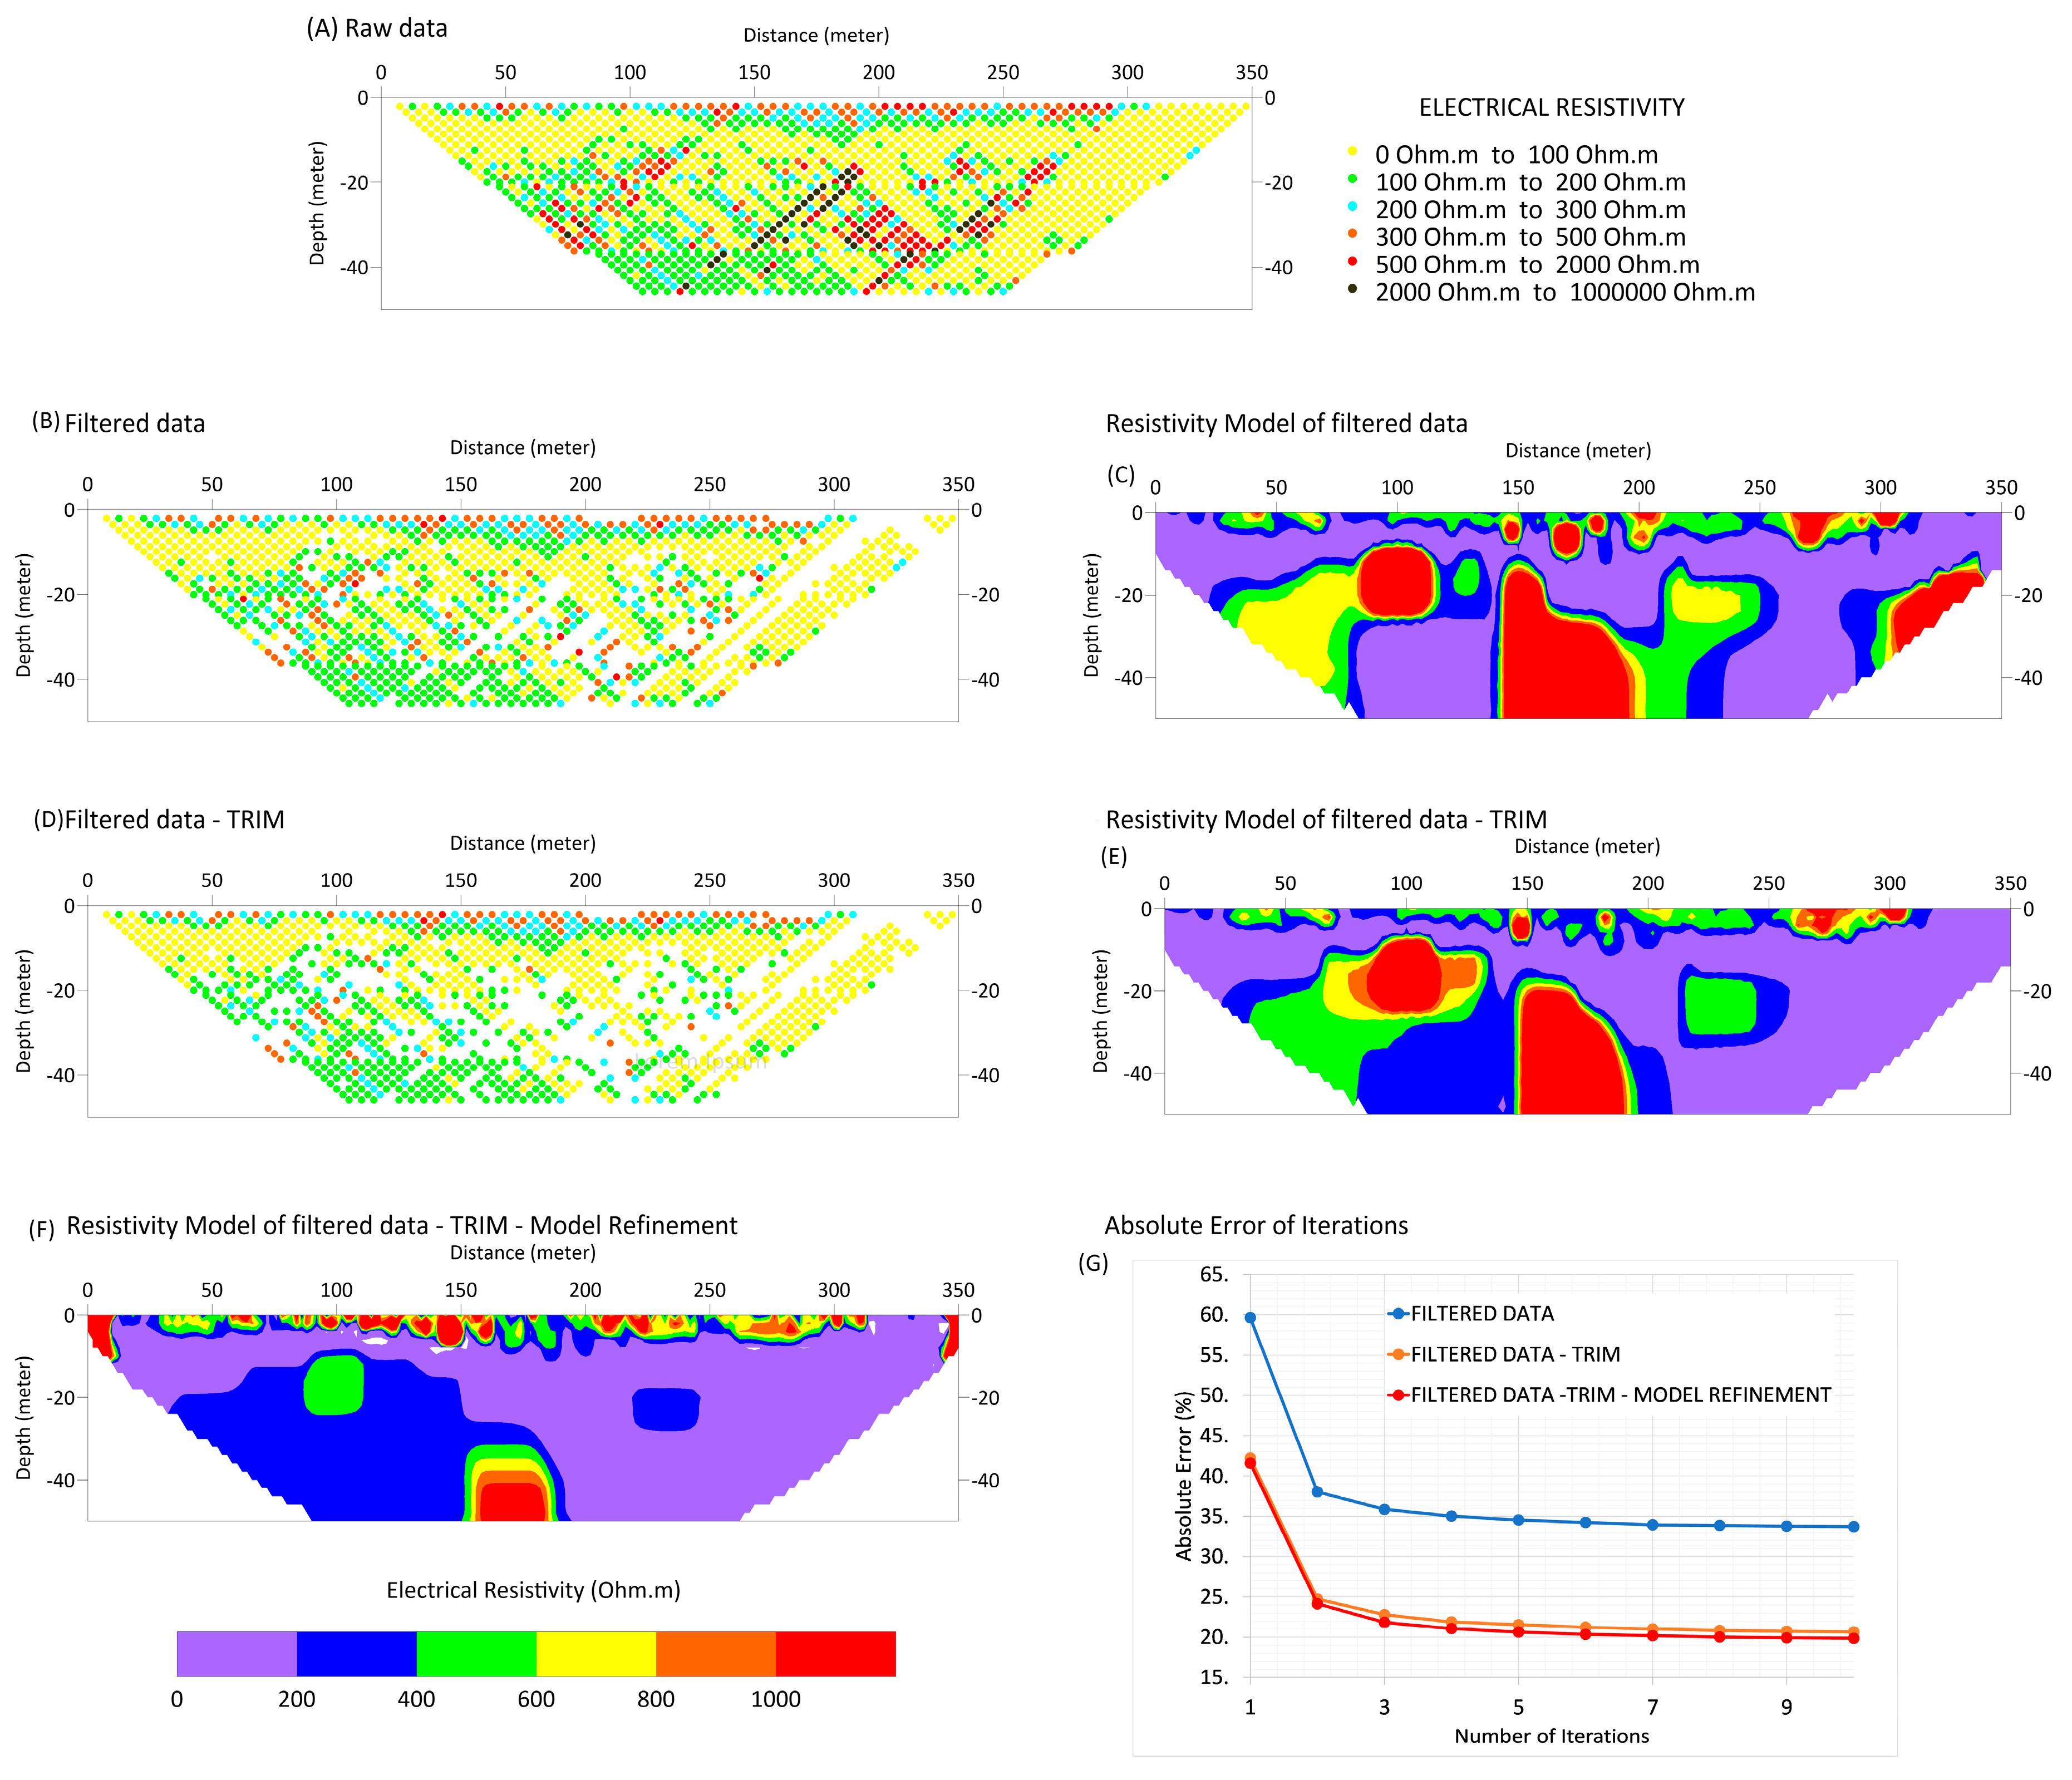
3.1. Electrical Resistivity Tomography (ERT)

The ERT method is based on injecting a known current value into the ground via two metal (rods) current electrodes. This current encounters resistance from the subsurface soil conditions (i.e., depending on the degree of fractures, material types and degree of saturation), and the developed potential is measured by two other metal electrodes known as potential electrodes. Resistivity tomographic techniques that provide a 2D image of the area are adopted as standard geophysical imaging techniques for the study of karst [2].
In the case of caves, the method works on the principle that the host rocks (i.e., the surrounding material) have lower electrical resistivity than caverns [2,5]. A distinct scenario arises from caves which are dry (i.e., are above the water table) and filled with sediments having a high degree of compatibility. The detectability of these highly resistive caves is only made if the depth of the cave roof is lesser than four times the radius of the cave, which is rare in nature [40] (Mitrofan et al. 2008). There are many examples in the literature where ERT has been used to map caves at more than 20 m depth [10,41,42]. The resistivity signature of caves that develop below water is low, and their detection depends on their size and depth, and contact with the moisture content or air [10]. Caves are usually detected on 2D section as a high resistivity anomaly [41,43]. However, this is not the case where caves are developed below the water table. Here, caves are found as low resistivity anomalies in the 2D resistivity section [10]. The geophysical properties of the cave vary depending on different influencing factors, e.g., the depth and diameter of the cavity and the local geology, as well as if the cavity is filled with sediments or is empty. An empty cave (>35 m depth) most likely shows a high resistivity in the ERT cross-section, while a different pattern is observed if the cave is filled with sediments and water. If the filling material is fine-grained and loose with a high amount of water, this results in lower resistivity, because both fine sediments (clay) and water are good conductors of electrical current, resulting in low resistivity anomalies [44].
In this study, the planning phase consisted of a one-day field visit (during dry season) to assess the ground conditions for the survey lines (ERT, SRS, and VLF-EM) over the Tarimba Cave. ERT array configurations comprising 72 electrodes with 5 m spacing were used in the field for the acquisition of resistivity data. In the dipole-dipole (DD) array, the number of electrodes and spacing between them was specified, and the ELECTRE II software (IRIS Instruments, Orléans, France) generated an automatic configuration file which provided the maximum depth of the investigation. The other acquisition parameters, such as time, voltage and the number of data points, were also defined using the same software. Then, the acquisition parameters were transferred to the resistivity meter to be used in the field.
Preliminary data processing of the obtained resistivity data was carried out in the Prosyscal II software (IRIS Instruments, Orléans, France). Then, anomalies and errors in the data were observed and the resistivity values, which were quite high, were removed manually. After editing, the data were saved in a new file format compatible with RESIS2DINV software (Geotomo Software, Houston, TX, USA) [45], where the inversion of resistivity data was performed. In this software, the best-fit earth model was generated from the apparent resistivity values. For that cell-based resistivity, the calculation was made through the application of the smoothness-constrained least-squares inversion method [46], searching for an idealized model for the resistivity distribution and its best fit with the calculated measured resistivity values [47]. In this method, the subsurface is divided into rectangular blocks, each representing a single measuring point [48]. The root means square (RMS) error value reveals discrepancies between the measured and calculated resistivity.

3.2. Seismic Refraction Survey (SRS)

The shallow seismic refraction method is ideal for estimating, with reasonable accuracy, the depth of different geological interfaces for different purposes such as geotechnical [49] and engineering geological investigations [50], site characterization of landslide areas [51] hydrogeological analysis [52] (Prekopová et al., 2016) archaeological exploration [53,54] and site characterizations of karst areas for large penetration and at high spatial resolution [3,20,55]. Further details about the application of the method can be found in [56].
The conventional seismic refraction method is based on the analysis of the first arrivals of the direct and critically refracted waves at geophones planted in the ground. We used Seismic Refraction Survey (SRS) in this work to highlight the basic principle of the method, that is, the recording and analyses of critically refracted waves. However, in terms of interpretational method, the results of which are presented later, we employed the reciprocal and tomographic methods for the same acquired data, noting that the acquisition procedures applied in the field were performed with the intention of processing and interpreting the data using the reciprocal method.
The picking of the first onsets of the recorded refracted waves (travel times) is plotted against their respective offsets (source-receiver distances). These plots (time-distance graphs) allow the derivation of the P-waves velocities of the seismic layers and the depths to the seismic interfaces by the reciprocal methods, like the plus-minus method [57]. The other interpretational approach for irregular refractors is the Seismic Refraction Tomography (SRT), but it usually demands a higher density of source positions and receivers than in conventional refraction surveys. In this procedure, travel times and ray paths are calculated in a regular grid model (synthetic data), employing an inversion technique to map the seismic velocities in the subsurface. The synthetic data are compared with the field data, and at each iteration, the initial model is modified until the best fit between the model and field data is achieved. For SRT, we processed the same travel-times picked using a tomographic code (DW-Tomo, Geogiga Seismic Pro).
For the acquisition of seismic refraction data for this study, 24 geophones of 14 Hz were planted in line, with intervals of 5 m. Four seismic lines of 115 m length were acquired (Figure 1), with all having a common center point. The positions of the shots for each line were at x-coordinates −10, 0, 57.5, 115 and 125 m from the first geophone (coordinate 0 m). The seismic refraction lines were positioned over terrains where caves can develop. The data were acquired with a Geode Geometrics Inc, Sao Jose, CA, USA) seismograph employing a hammer as the seismic source.

3.3. Very Low-Frequency Electromagnetic (VLF-EM)

The VLF-EM method is a popular EM test for the quick mapping of near-surface structures for groundwater exploration [6,58,59]. However, it is also used for a variety of other applications, including soil engineering, archeology, and mineral exploration to map narrow mineralized fault zones [58], weathered layers in granitic terrain [60], lava tubes, faults and dikes [61] and zones of potential subsidence [62]. The VLF-EM is a semipassive electromagnetic induction method which utilizes the signals (primary field) released from distant high power vertical transmitters (15–30 kHz), installed on coastal regions. There is a worldwide network of VLF stations that generate the signals. The signals are propagated between the surface of the earth and the ionosphere and can traverse a long distance. This method is ideal for the detection of vertical and dipping conductive subsurface structures because the primary field is horizontal, as in conductive elongated structures.
In the case of the subsurface conductor (fractures/cave with water), a secondary field is induced in the conducting body. The induced field which is superimposed on the primary field differs in phase. These primary and secondary fields are measured on the earth’s surface with a VLF-EM receiver. In this way, conductive bodies are detected on the surface of the earth. The depth of penetration is considered as more than 30 m [63] (Fraser, 1969), and is a function of the geometry and dimensions of the host medium, as well as the anomalous bodies and the frequency used [2]. A detailed description of the method is provided by [64].
For the acquisition of VLF-EM data of this study, the same acquisition profiles were used as for ERT and SRS; however, based on the rerecorded signal strength and noise level in the area, a few of the profiles were not processed. For data acquisition along the profiles A-A’ and C-C’ with a station spacing of 5 m and 20 m respectively, a Juno 3D Trimble GPS and a T-VLF unit of IRIS- Instruments, 1993 receiver was used (IRIS Instruments, Orléans, France). In the survey, the tilt angle mode was adopted in the field. [65] Ogilvy and Lee (1991) stated that the 2-D current density distribution could be used for the identification of subsurface targets. The powerful VLF data filtering (Fraser and Karous-Hjelt) can be applied in different software packages (e.g., VLFMOD, EMIXVLF, RAMAG, KHFFILT, INV2DVLF, VLFPROS) [61]. With the aid of these software packages, the contour maps of the current density were produced to support the interpretation process. In the present study, KHFFILT software developed by [66] was used. It is an inversion software that can filter VLF raw measurements, but can also display the Fraser output and generate a 2-D subsurface image thereof. For the visualization of the results, it has a graphical user interface (GUI). In the software, it is necessary to save the VLF data in a recognized format within a database, where the Golden Software Surfer Spreadsheet is the preferred database. The steps for saving VLF data in Surfer Spreadsheet (as well as the software use) are explained in detail by [66].

4. Results, Analysis and Discussion

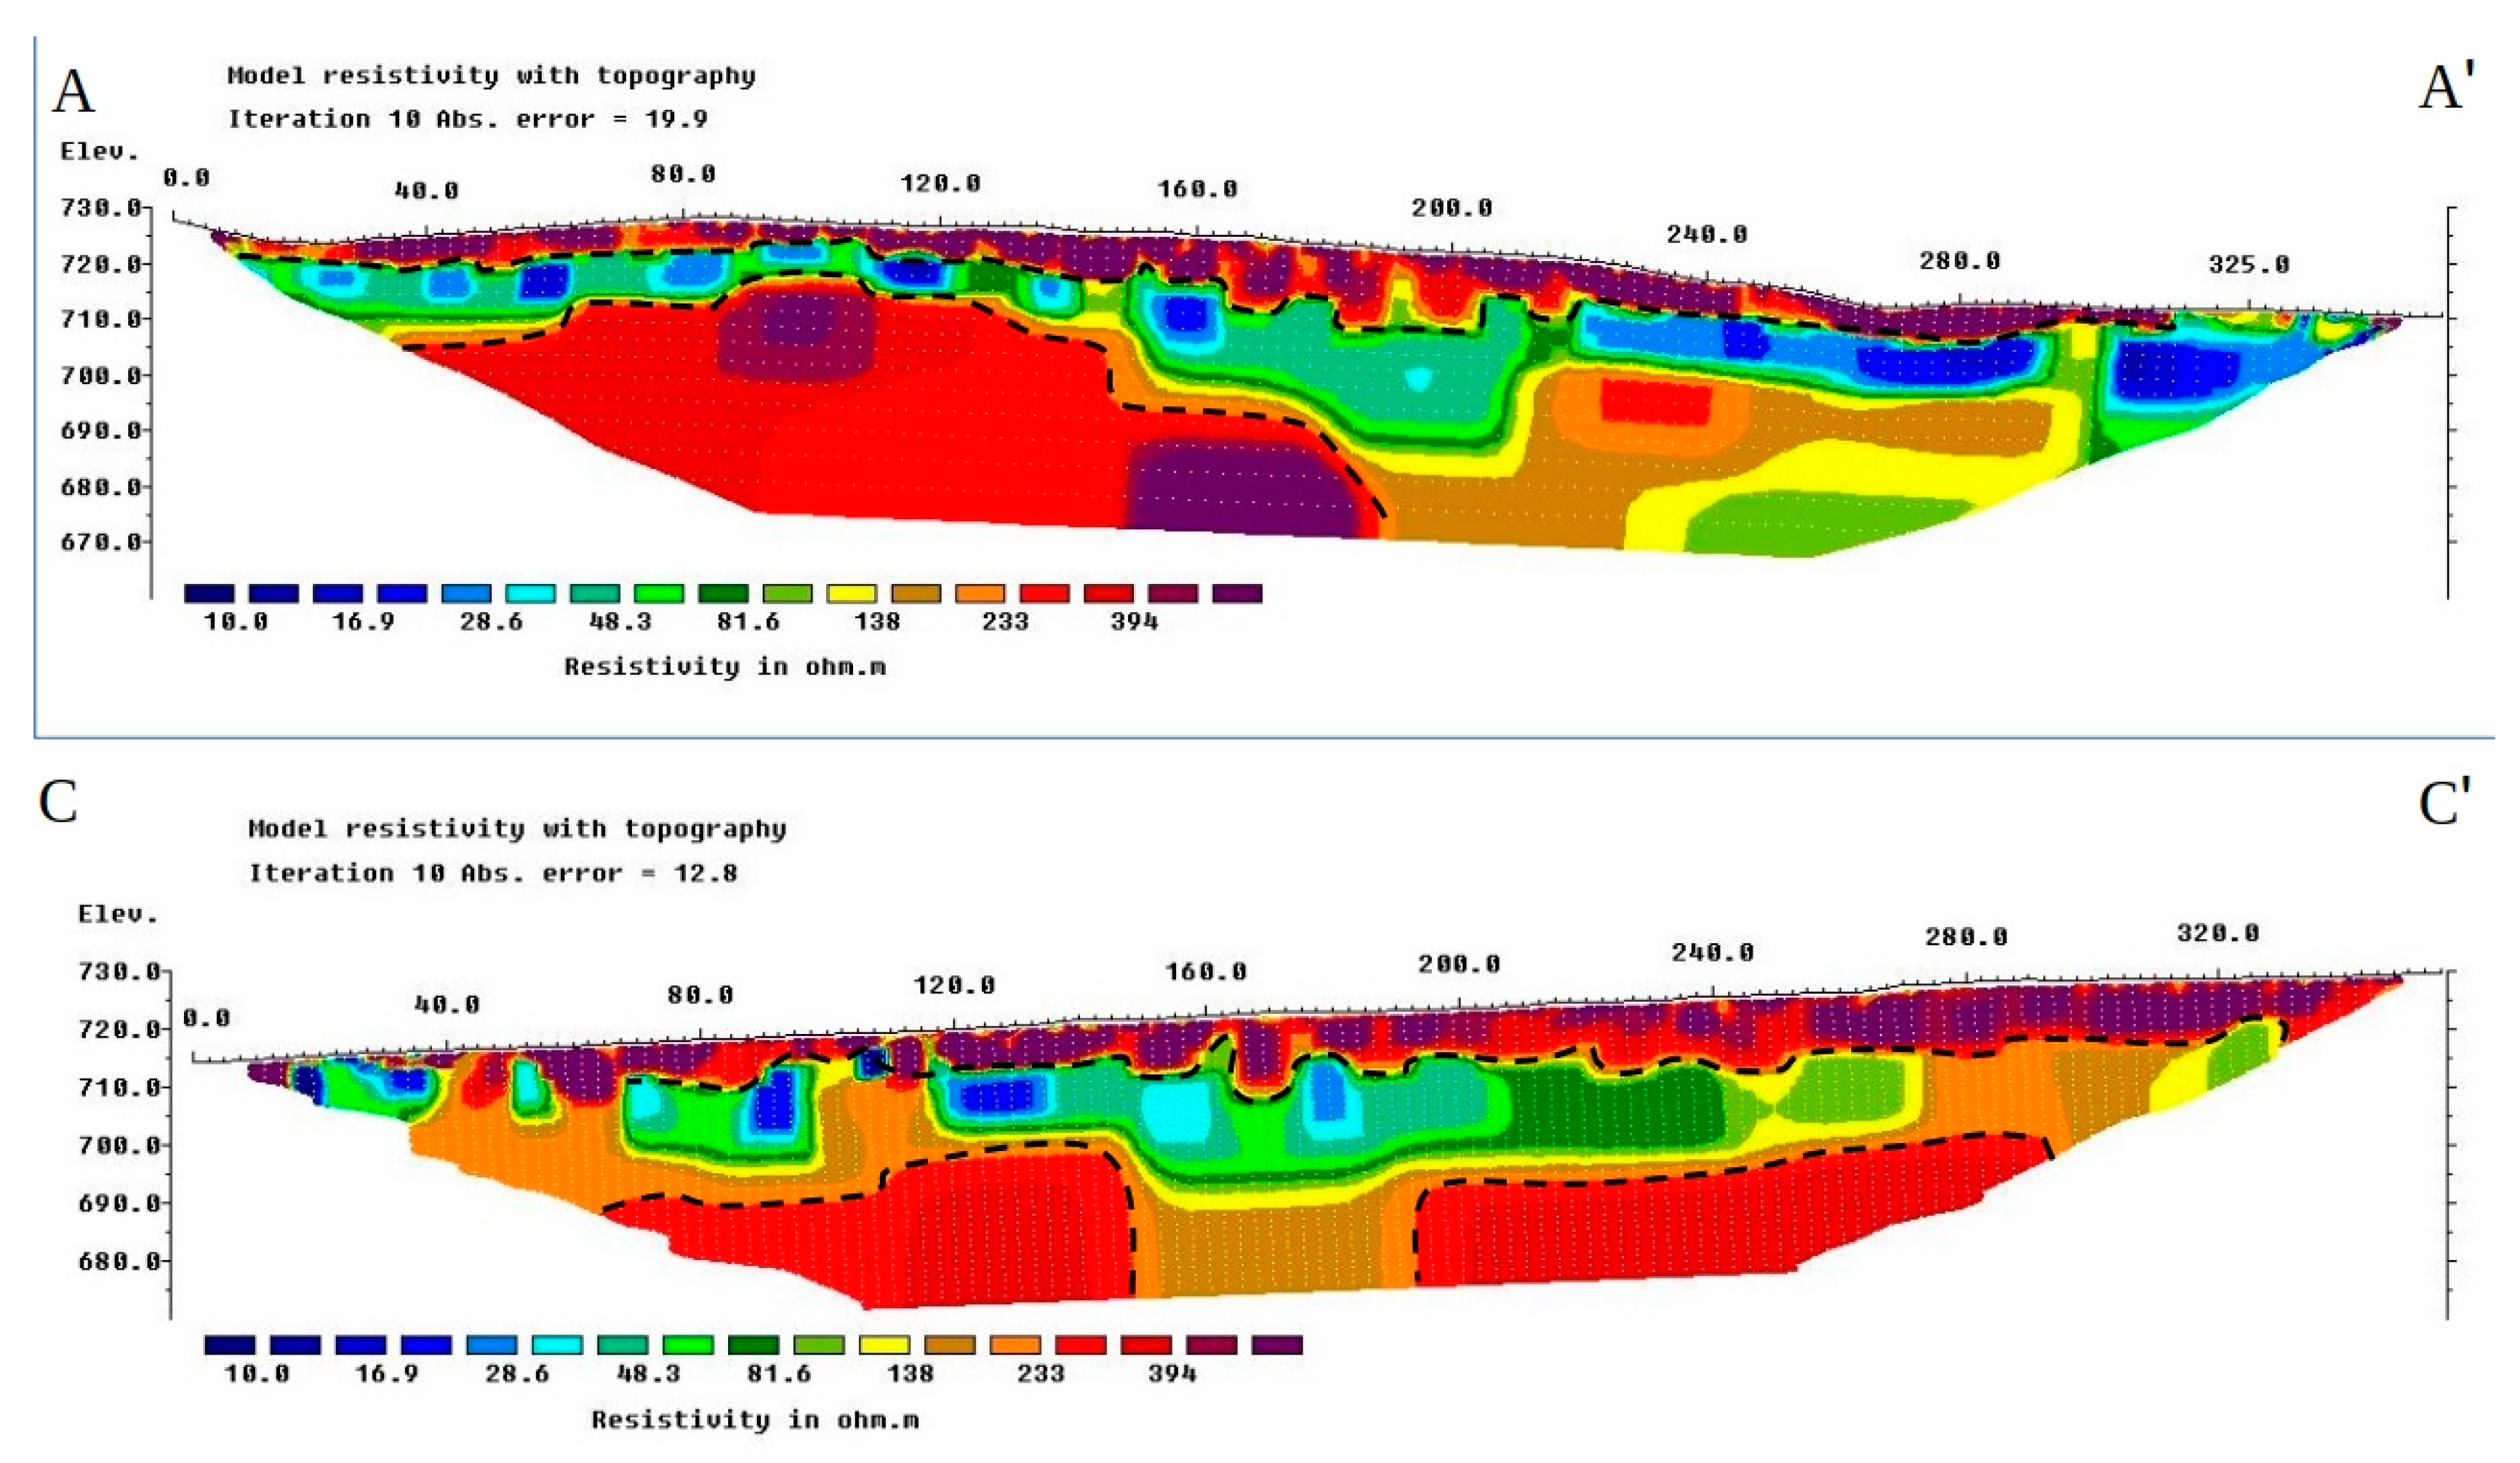
4.1. Electrical Resistivity Tomography (ERT)

In the first stage of data preprocessing for the RMS error reduction, data filtering was applied to a raw ERT data record along ERT profile A-A’. Figure 6A represents the complete dataset (row data), while Figure 6B represents the dataset obtained after removing anomalous resistivity values (elimination of about 5%) during the initial processing step, which filtered out resistivity values greater than 1000 ohm. Inverse modeling at regular of 5 × 5 m2 cell spacing was applied, which resulted in the inverted resistivity model of filtered data (Figure 6C). The inversion of these data resulted in a model with an error of 21%. Finally, a reduction was made in the model grid size, in which cells of 2.5 × 2.5 m2 were used. In this way, the error was reduced to 19.9% (Figure 6E). For the other ERT sections, a similar approach was adopted, but only the final model with the topography was shown. Figure 6F shows the number of iterations and absolute error values for the different data types as (i) filtered, (ii) filtered and trimmed and (iii) filtered and trimmed with grid refinement applied for modeling. The error abruptly decreased in the first three iterations; after that, it remained unaffected with the increase of the number of iterations. The value of the error of filtered data was higher than the filtered-trimmed data (with or without the refined model) (Figure 6F).
The inverted resistivity cross-sections indicate a three-layered stratigraphy in the selected part of the Tarimba Cave, with a very resistive upper dry soil, low-resistivity in the claystone in the middle and moderate resistivity in the collapsed material or weathered limestone below. These delineated stratigraphic layers have variable thicknesses, related to the degree of compaction, weathering, moisture contents and the undulation of the carbonate rocks as well as the degree of karstification (Figure 7a). In the A-A’ profile, the topsoil layer has a variable thickness with resistivity values > 200 Ωm. The next layer (below the first layer) has resistivity < 100 Ωm, which generally consists of the claystone with a considerable amount of moisture contents. At about ~6 m depth from the surface, water infiltration can be retained by the high porosity and low permeable strata forming a small temporary perched aquifer, ‘‘the epikarst’’. This feature was also reported by [39]. The central cover collapsed doline is evident on the A-A’ profile at about 190 m from the start (Figure 7a). A similar three-layered stratigraphy is evident on C-C’ profile; however, the carbonate rocks were found to be less weathered (high resistivity value) than the A-A’ profile. The central collapse doline is very prominent along with the middle perched tank (Figure 7b). The ERT profile B-B’ also shows an upper soil layer. Here, the collapse doline of the carbonate is found at the center and seems to be linked with central cover collapse doline. It is likely that this structure is not uniformly developed. The perched tank thickness is larger here than the other profiles (Figure 8a). The resistivity of soil on D-D’ profile is relatively high and is also thinner (Figure 8b). The cover collapse doline is very well defined here; however, its width is less than in the C-C’ profile. It can also be seen from the ERT results that the resistivity of carbonate rock is very high, and the delineated structures are not uniformly developed in all directions.
Below the soil layer, which is present on all profiles, the claystone/pellitic rock that provides covers for the karst can be found. This layer may be associated with the presence of clay which might have developed as a result of in situ weathering of claystone. The thickness of this cover changes in various directions. This low resistive and low permeability layer acts as a barrier and protects the groundwater from surficial contaminants [2,67]. This layer (claystone) can retain a considerable amount of water originating from the surrounding rivers or infiltration from rainfall water. This may lead to the formation of a perched aquifer system, which may not be suitable for the application of some geophysical techniques, such as ground-penetrating radar (GPR) over such areas.
In the inverted resistivity cross-section, a buried sinkhole with intermediate resistivity value is evident in two of ERT profiles (as depicted in Figure 8 and Figure 9). The different resistivity values (which were found over the region of the cover-collapse sinkhole) might be related to the variable degree of compaction and moisture contents in the soil. These filled sediments can be eroded at the base by the bottom flow river, which can reactivate the sinkhole. These empty sinkholes start receiving sediments from the surrounding regions because of the surface water runoff current during rainy seasons. The presence of such sinkholes may also provide a hydrological link between surface contaminants and water in the caves. This can increase the vulnerability of the groundwater in the deeper caves and disturb the cave hydrological system. There is an assumption (Figure 4) of the existence of two cave systems (shallow and deep), which are developed as a result of active fluvio-karstic agents. Therefore, this link may represent a source of contamination along the sediments, from the shallow to the deeper cave [2]. These two cave systems were not identified on the inverted resistivity cross-sections, mainly because of the limitations of the profile lengths and survey configuration.

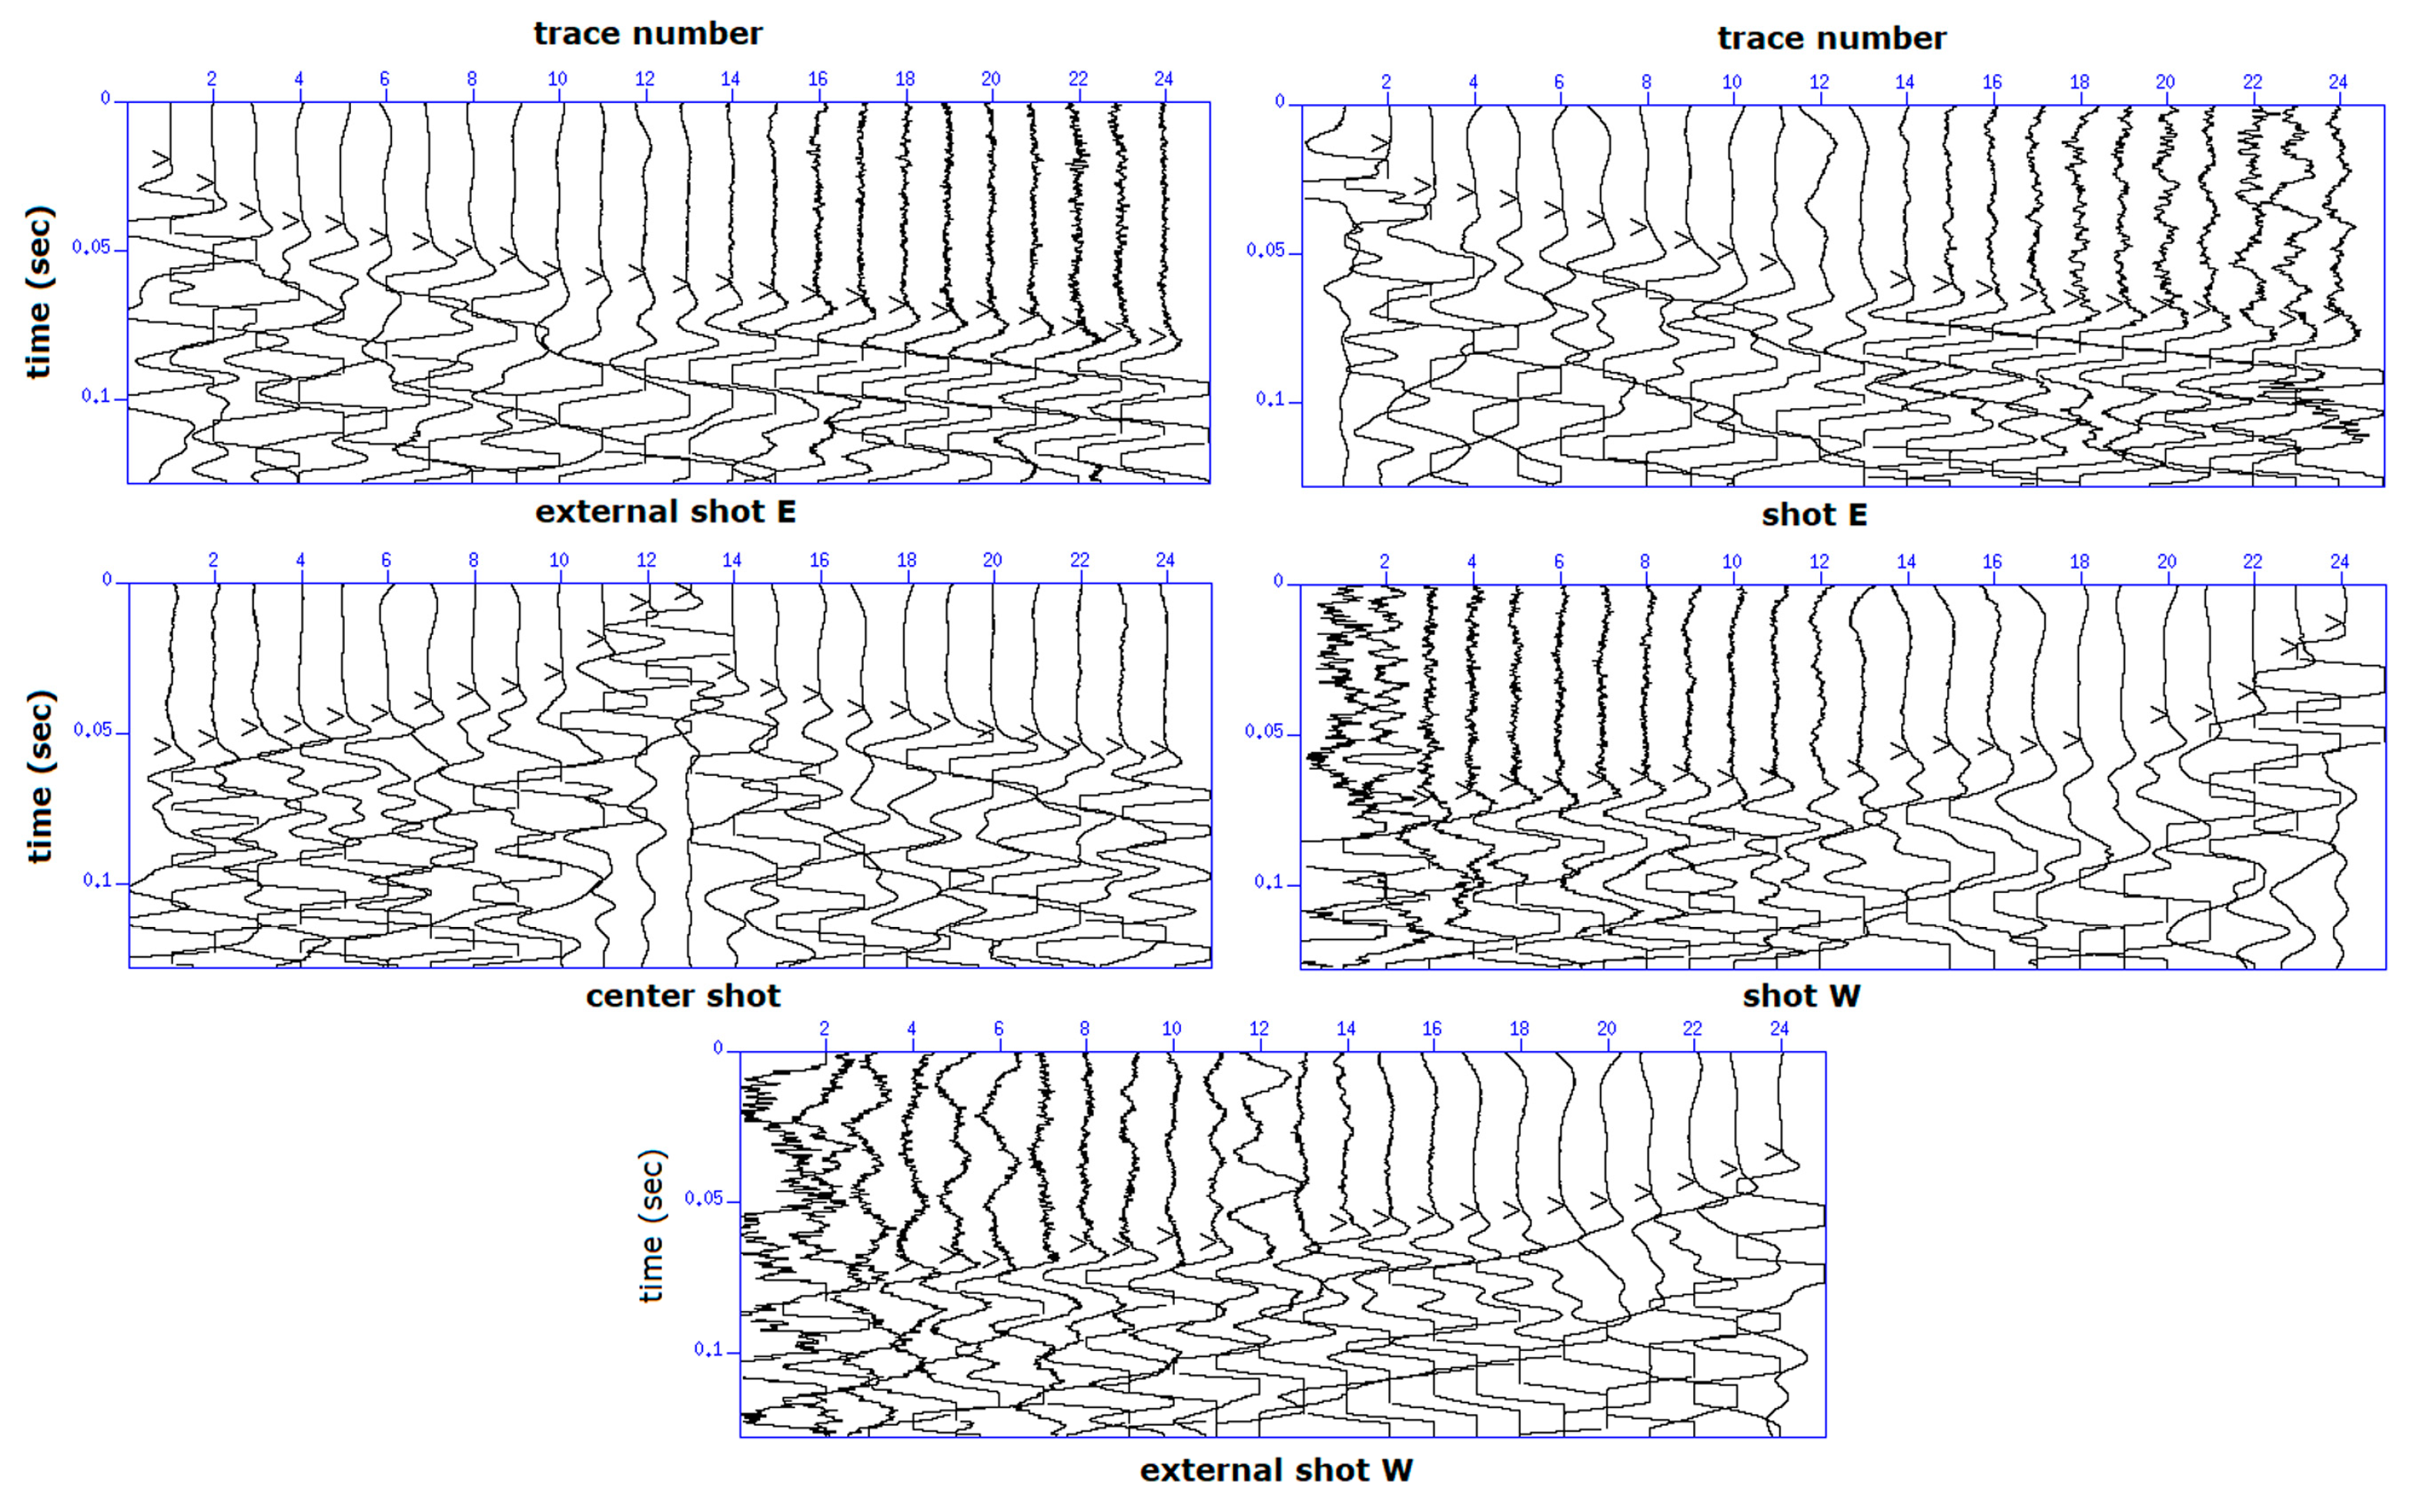
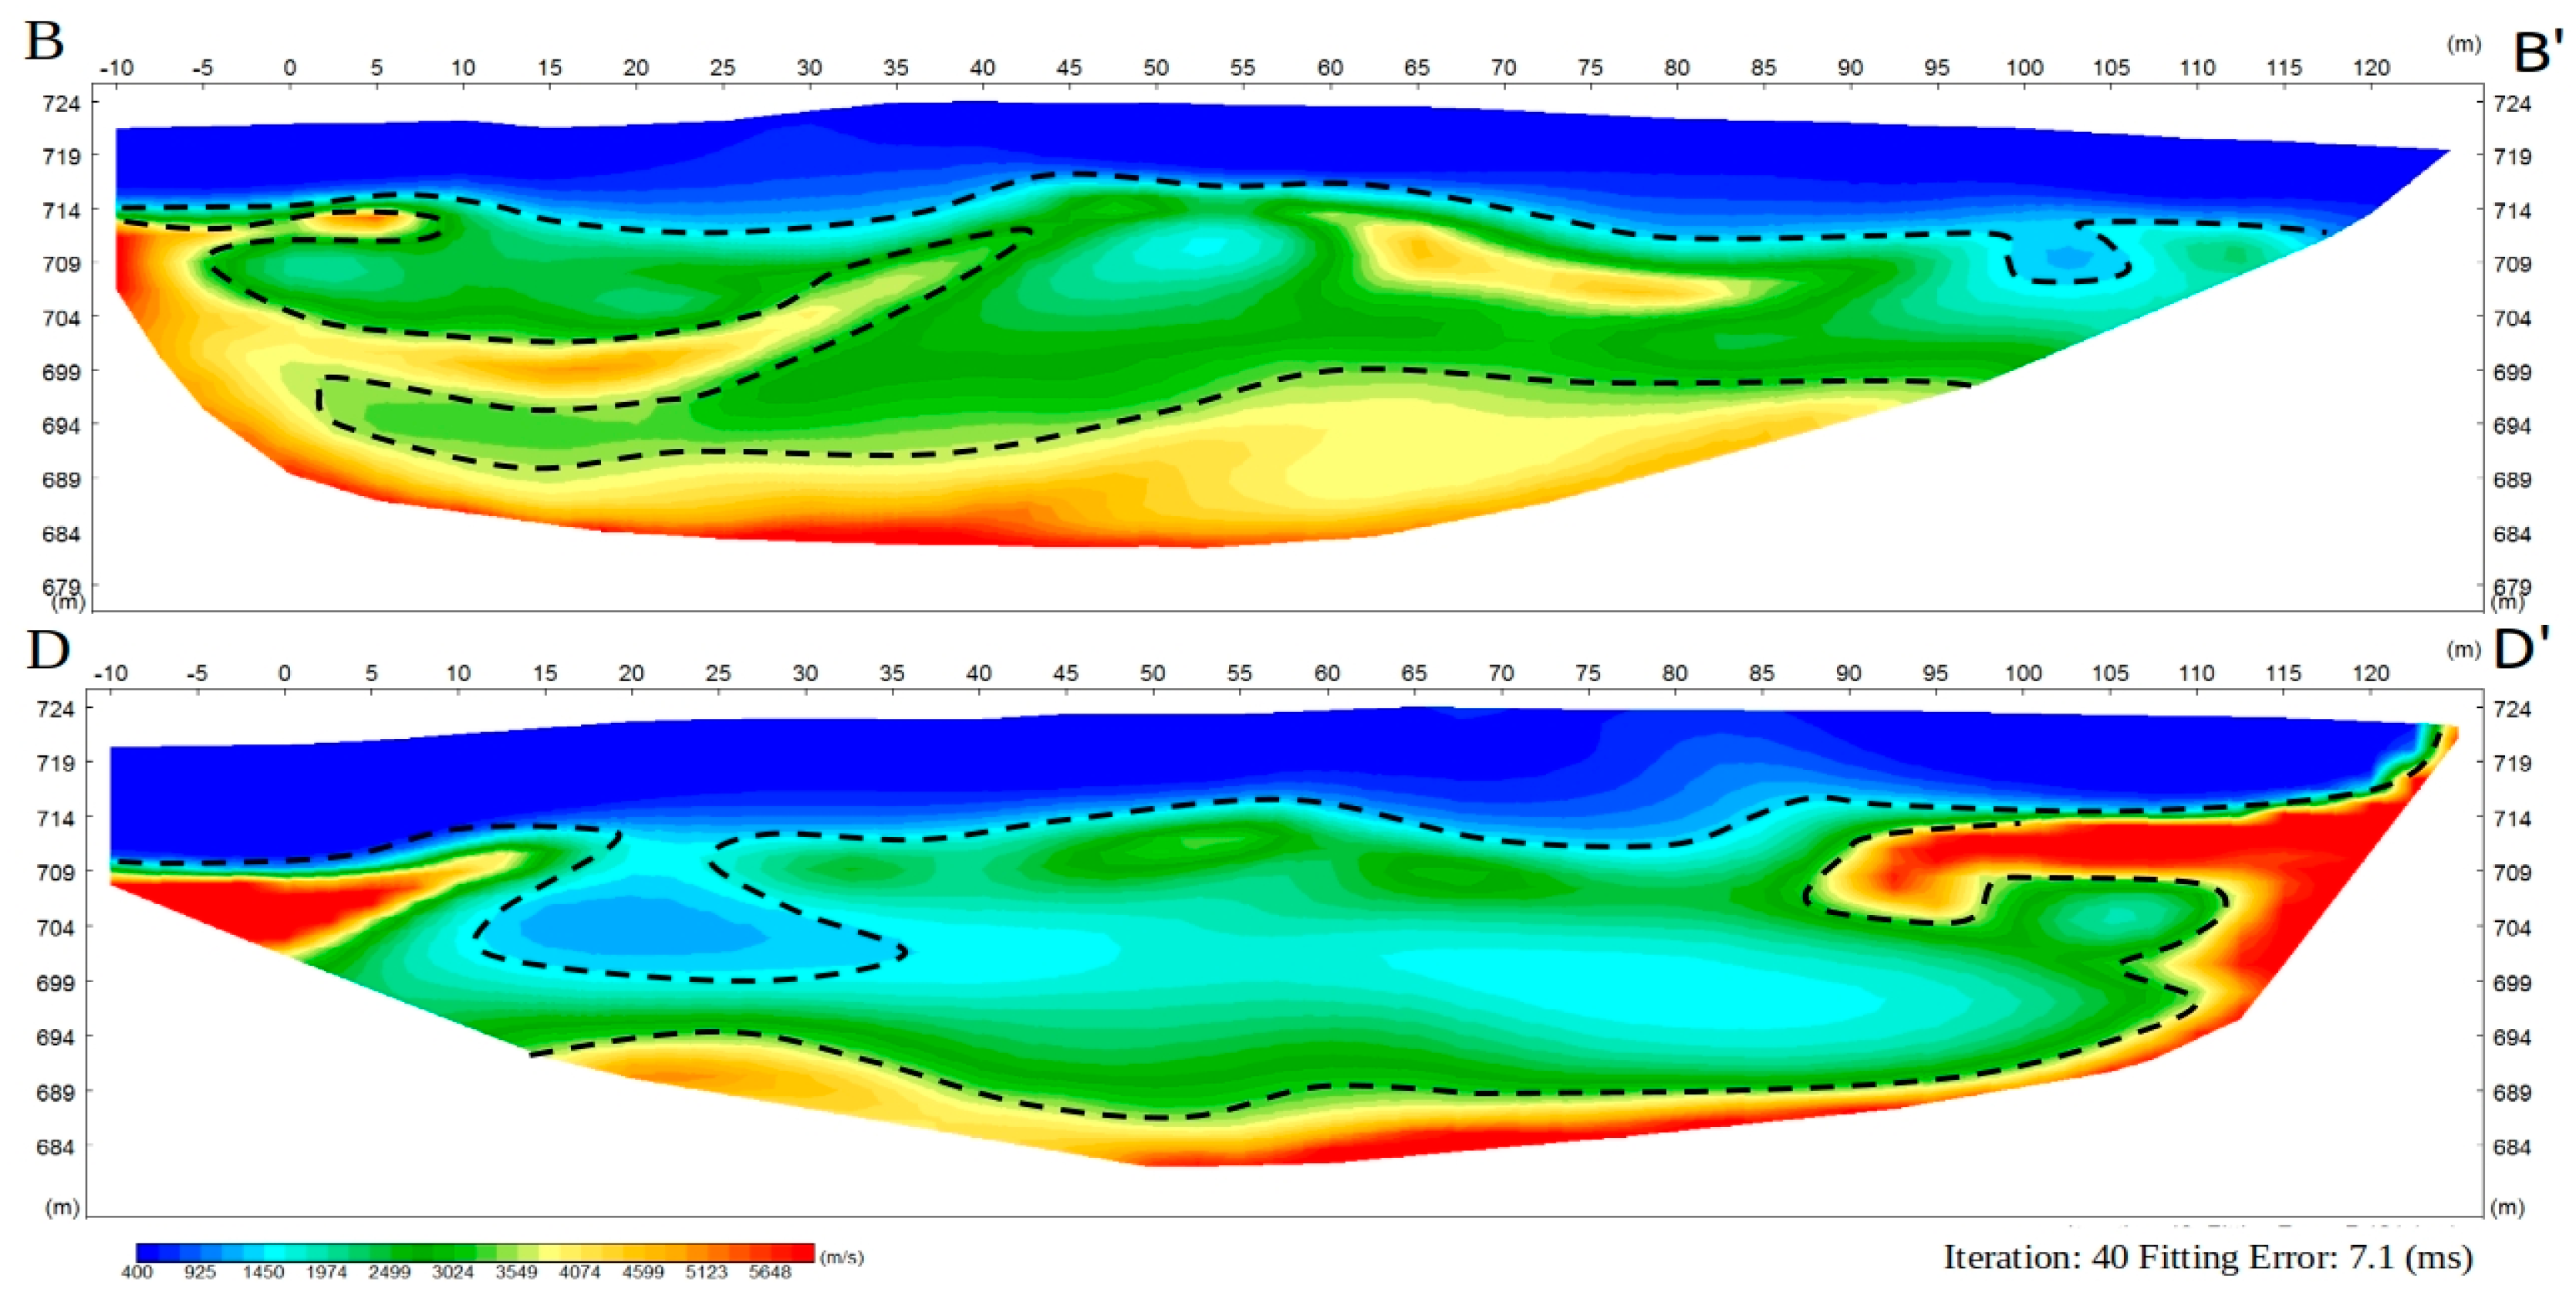
4.2. Seismic Refraction Survey (SRS)

The seismic refraction data are generally shown to be of good quality, allowing accurate and reliable identification of the first arrival times. Figure 9 shows the seismograms of the seismic line C-C’ and respective picked travel-times.
The P-wave velocity models were obtained by applying the plus-minus method. Only for the deeper seismic layers, the depths to the interfaces and the seismic velocities were obtained by the intercept times and slopes of the straight lines that fitted the refracted-travel times. The interpretation of the reciprocal method resulted in a three-layer model (Figure 10 and Figure 11). The upper layers have seismic wave velocities varying from 360 to 510 m/s and thicknesses from 5 to 9 m. In comparison, the intermediate layers have wave velocities varying from 1750 to 2020 m/s and thicknesses from 7 to 20 m. The deeper layer shows high velocities, varying from approximately 3500 to 5700 m/s (Figure 10 and Figure 11). Although the interpretation by the reciprocal method did not reveal any conclusive results on the occurrence of caves and other epikarst features such as cover collapse doline, it allowed us to map three main layers associated with the soil (derived from the limestone and/or the pelitic sedimentation), the high to medium weathered limestone (eventually with intercalations of claystone) and the unweathered limestone.
The plus-minus method could not resolve a low-velocity zone (laterally limited) in the underground. Therefore, we decided to use seismic refraction tomography (SRT); even with the limited number of shots, we would expect that SRT would highlight some hidden layers or cavities. As noted, conventional refraction analysis (applied to these data) is primarily aimed at characterizing the local stratigraphy when the reciprocal method applies a constant velocity layered model. Inversion by a tomography code aims to indicate possible velocity anomalies, which can then be compared with the other geophysical results (VLF-EM and ERT).
The velocities and depths of the three seismic layers identified by the reciprocal refraction method agree with those shown by the tomographic images. Furthermore, we can observe some low-velocity anomalies in all the sections where these are all restricted to the second seismic layer, which may be associated with the weathered limestone. It is worth mentioning that for a confident interpretation, it would be necessary to obtain a denser ray coverage. However, these anomalies should be checked to confirm that the tomography method is reliable in this terrain; in this sense, it would be worthwhile spending more time on seismic refraction acquisition for tomographic treatment (Figure 12 and Figure 13).

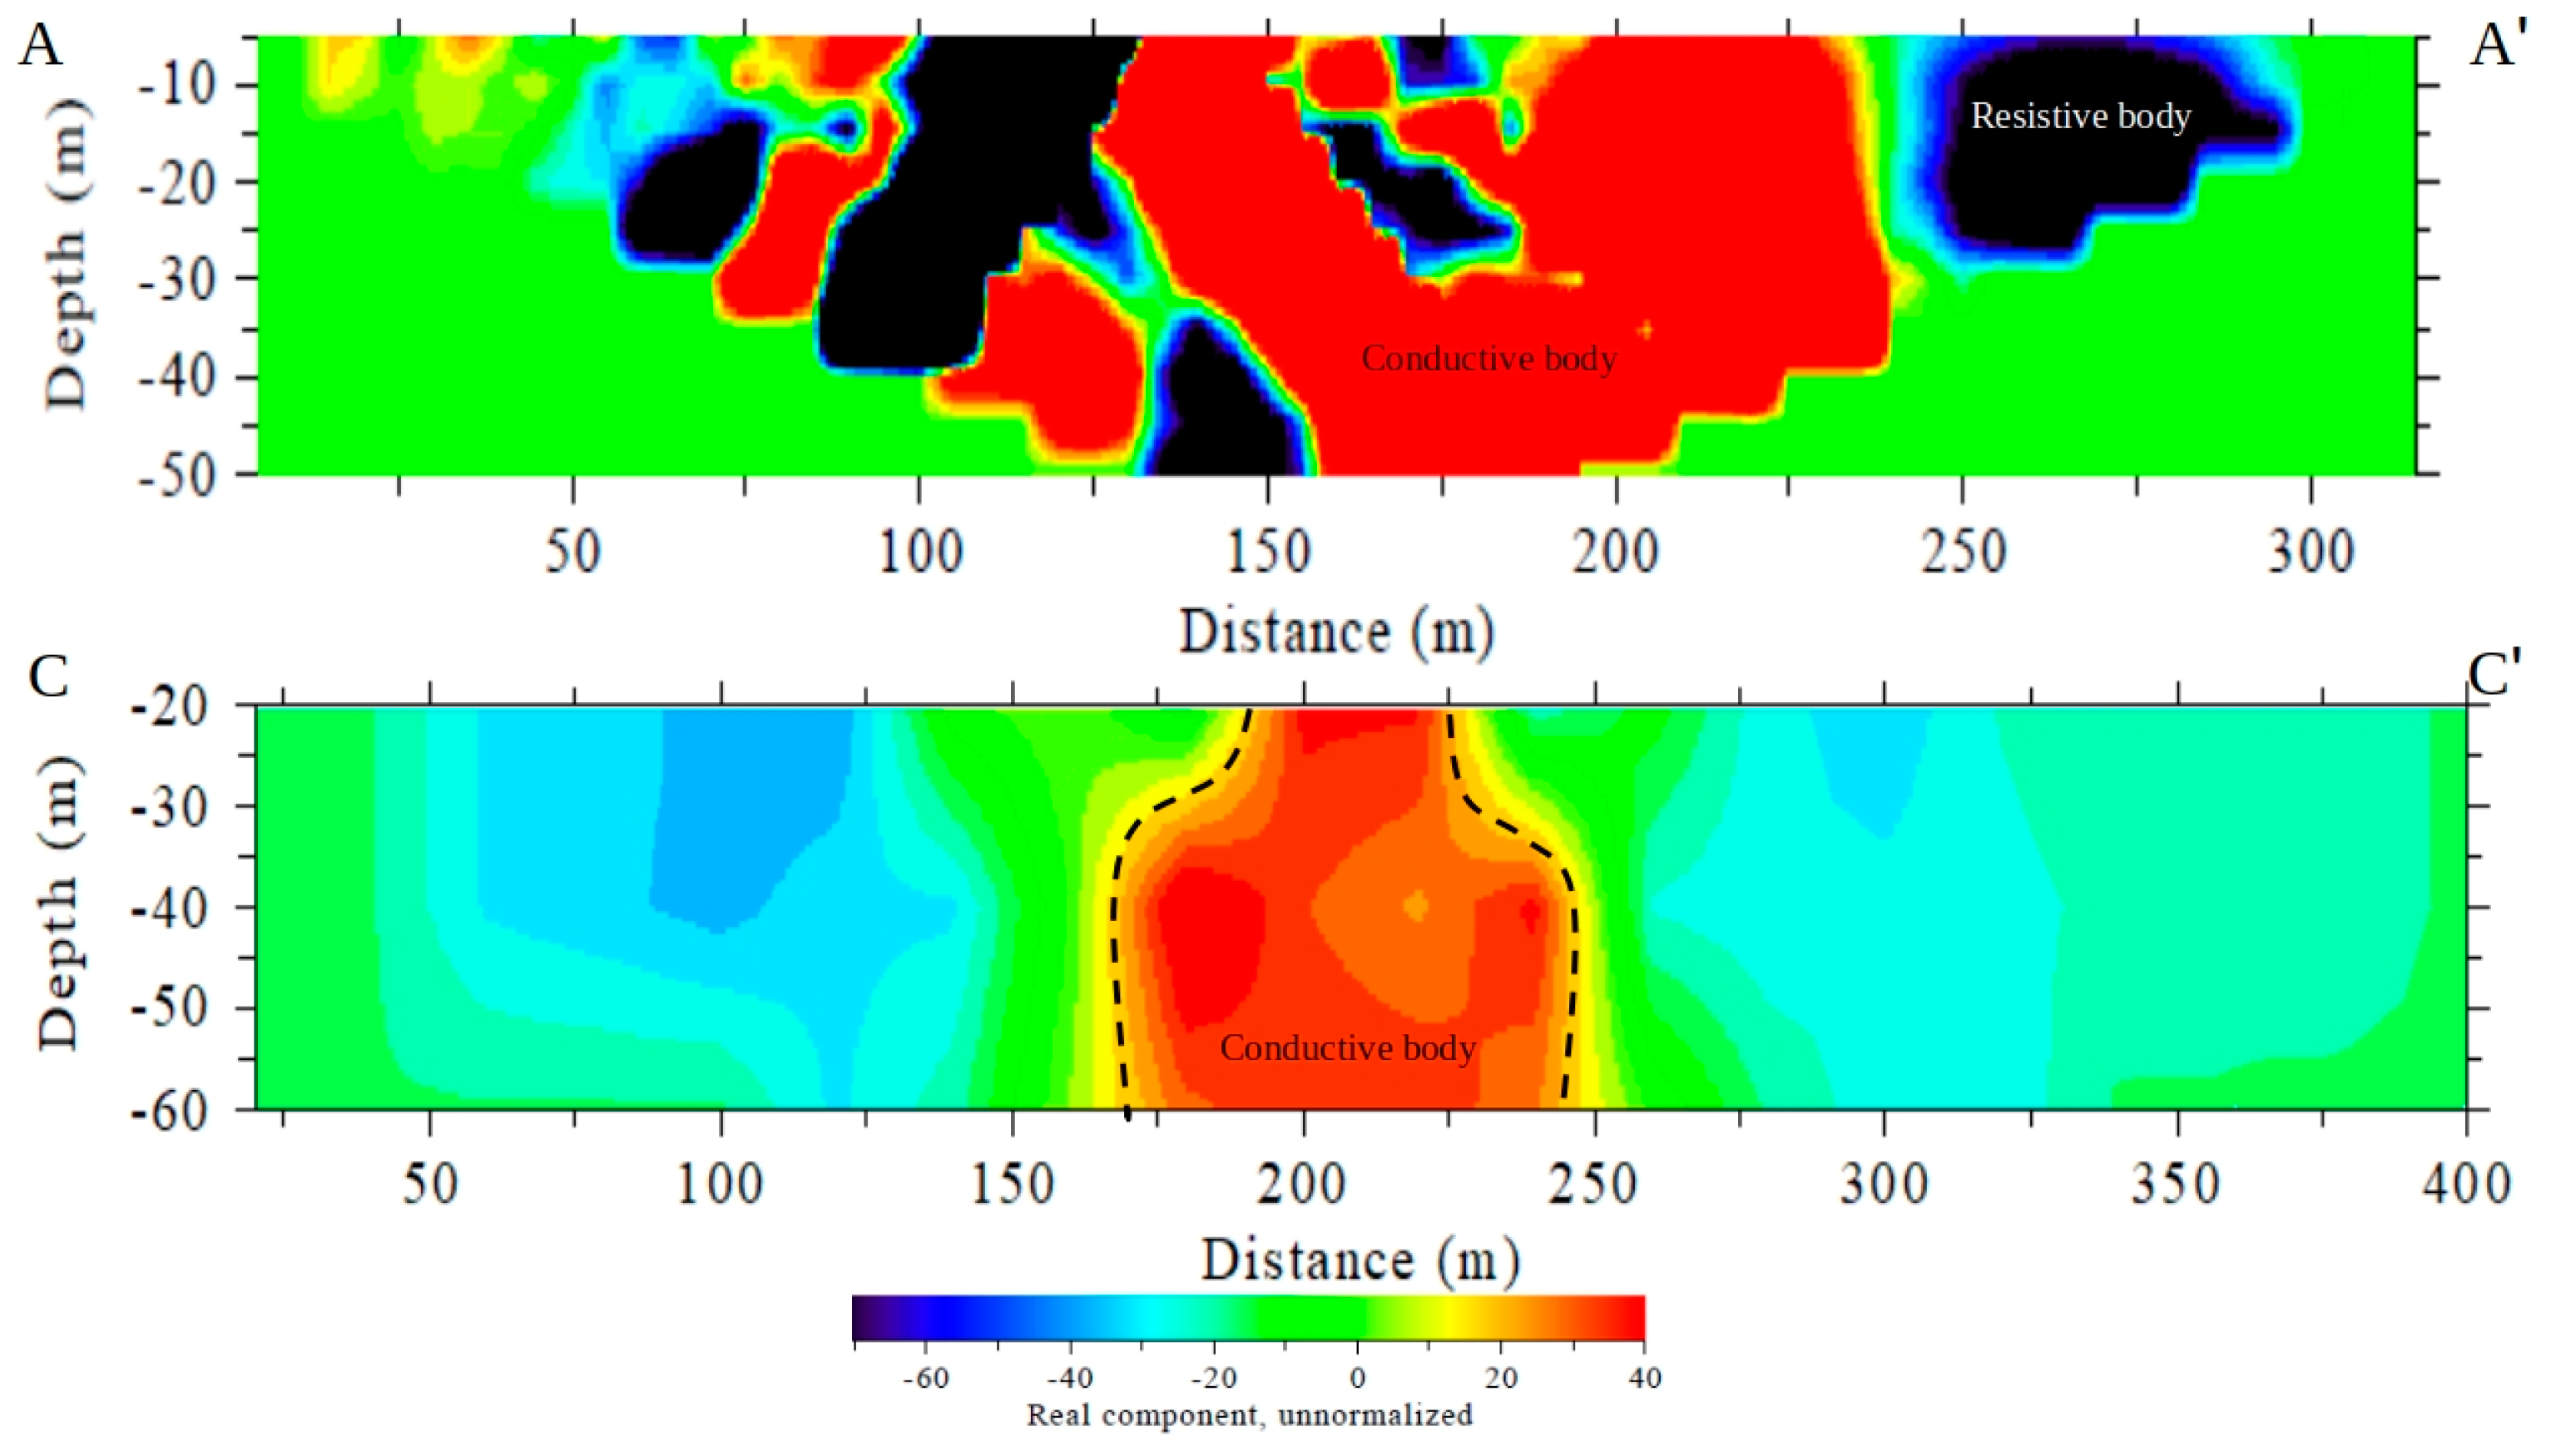
4.3. Very Low-Frequency Electromagnetic (VLF-EM)

The VLF-EM data were qualitatively interpreted to determine the location of subsurface caves and filled sinkholes. The profiles (A-A’ and C-C’ performed in the study area) showed several anomalies that varies in both size and amplitude. The observed current density anomalies were divided into two main types, i.e., positive and negative, suggesting that the body is either a conductor or resistive, respectively [61]. The measured tilt angle (real component) for each frequency was presented in the form of contoured sections (Figure 14). On VLF-EM profiles A-A’ and C-C’, positive anomalies were detected at ~125 and 175 m, respectively, at horizontal locations (Figure 14). These anomalies were interpreted as conductive caves with water and filled dolines (Figure 14). These conductive anomalies were also observed on the ERT cross-sections of A-A’ sections and C-C’ sections. On A-A’, detailed surface structures (conductive and resistive) are visible, which are related to the 5 m station spacing during acquisition. On C-C’, a very prominent central conductive body can be seen (Figure 15). This is also visible in the ERT profile of this direction, which is linked with the filled sinkhole. Here in the VLF-EM profile, the body can be seen at greater depth.
Figure 15 represents an integrated interpretation of the ERT and outcomes of the two applied seismic refraction methods along the line C-C’. A well-defined, three-layered stratigraphy was obtained by all three applied methods. However, there were variations in the depth of each layer as reported by each method. In the case of the first dry layer, all methods gave similar results. There were small variations in the interpreted depth of the claystone layer. The central filled sinkhole was only observed on the ERT profile because of the limitation in the depth of penetration of these methods, as described above (Section 4).

5. Conclusions

The main goal of the current study was to examine the efficiency of four different geophysical techniques (i.e., SRS, SRT, ERT, and VLF-EM) for subsurface characterization of covered karst (Tarimba, Goias, Brazil). The study showed varying strengths and weaknesses during the investigation of a cover collapse doline, perched tank and the site’s stratigraphy.
The data obtained from the Seismic Refraction Survey (SRS) and Seismic Refraction Tomography (SRT) showed clearly a three-layer subsurface stratigraphy, where a continuous increasing trend in velocity was observed, indicating an increase in material compaction/density with depths. However, the SRS method remained unable to delineate the deeper cave because of the short depth of penetration and limited acquisition profile lengths. The filled doline at the center of the survey lines was also not identified in Vp cross-sections of the subsurface.
The ERT method (inverted resistivity sections) was able to detect the three-layered stratigraphy and sediment-filled doline at greater depth, in comparison with SRS. These findings suggest that ERT is generally the most suitable technique for mapping the karst systems in Mambaí, and possibly other areas with similar hydrogeological conditions.
The results of VLF-EM (i.e., the current density cross-sections of the real component) showed a high resistivity anomaly at the beginning of the profile, which may be associated with a subsurface dry cavity (consistent with the ERT results). The lengths of the VLF profiles were greater compared to ERT, so high resistivity anomalies were also found in the surrounding area. As many resistive and conductive bodies were delineated at greater depth, the VLF-EM method can be used as a reconnaissance technique in sensitive areas like the Tarimba cave, where the drilling of boreholes is not permitted.
In terms of directions for future research, the application of other geophysical surveys such as Multi-Channel Analysis of Surface Waves (MASW) is suggested for the area, which would benefit from the integration of these geophysical methods.

Author Contributions

Conceptualization, Y.H.; methodology, Y.H.; software, Y.H.; W.B.; M.C.-S., R.P., validation, Y.H.; formal analysis, Y.H.; investigation, Y.H.; data curation, Y.H.; writing—Original draft preparation, Y.H.; writing—Review and editing, Y.H., O.H., M.C.-S., R.P., H.-B.H., J.D.; visualization, Y.H.; supervision, R.U.; project administration, R.U.; funding acquisition, R.U. All authors have read and agreed to the published version of the manuscript.

Funding

This research was funded by TCCE 01/2018—Vale/ICMbio, PROCESS Nº: 02667.000110/2017-10 “Susceptibilidade, Hidrologia e Geomorfologia Cárstica Aplicadas à Conservação do Patrimônio Espeleológico da Área de Proteção Ambiental das Nascentes do Rio Vermelho.” DOU N.99 SEÇÃO 3 de 24/05/2018.

Acknowledgments

We are thankful for the support received from the ICMBio Mambaí and PhyGeo-UnB in data acquisition. The authors are most grateful to São Paulo Speleology Union (UPE) for providing topography of the Tarimba Cave. The authors would also like to thank Dr. Marcelo Rocha of UnB for providing Geophones used in the SRS data acquisition.

Conflicts of Interest

The authors declare no conflict of interest. The funders had no role in the design of the study; in the collection, analyses, or interpretation of data; in the writing of the manuscript, or in the decision to publish the results.

References

  1. Abidi, A.; Demehati, A.; Banouni, H.; El Qandil, M. The Importance of Underground Cavities Detection in the Choice of Constructible Areas: Case of the Agglomeration of Fez (Morocco); Springer: Berlin, Germany, 2018. [Google Scholar]
  2. Hussain, Y.; Uagoda, R.; Borges, W.; Nunes, J.; Hamza, O.; Condori, C.; Aslam, K.; Dou, J.; Cárdenas-Soto, M. The potential use of geophysical methods to identify cavities, sinkholes and pathways for water infiltration. Water 2020, 12, 2289. [Google Scholar] [CrossRef]
  3. Valois, R.; Camerlynck, C.; Dhemaied, A.; Guerin, R.; Hovhannissian, G.; Plagnes, V.; Robain, H. Assessment of doline geometry using geophysics on the Quercy plateau karst (South France). Earth Surf. Process. Landfor. 2011, 36, 1183–1192. [Google Scholar] [CrossRef]
  4. Kaufmann, G.; Romanov, D.; Nielbock, R. Cave detection using multiple geophysical methods: Unicorn cave, Harz Mountains, Germany. Geophysics 2011, 76, B71. [Google Scholar] [CrossRef]
  5. Mohamed, A.M.E.; El-Hussain, I.; Deif, A.; Araffa, S.A.S.; Mansour, K.; Al-Rawas, G. Integrated GPR, ERT and MASW for detecting near-surface caverns at Duqm area, Sultanate of Oman. Near Surf. Geophys. 2019, 17, 379–401. [Google Scholar] [CrossRef]
  6. Sundararajan, N.; Al-Wardi, M.; Raef, A. Integration of micro-gravity and very low frequency (VLF) electromagnetic (em) data analyses to outline hazardous cavities and low rock-strength: Coastal carbonates, Wadi Shab, Oman. In Proceedings of the Symposium on the Application of Geophysics to Engineering and Environmental Problems, Austin, TX, USA, 22–26 March 2015; pp. 147–152. [Google Scholar]
  7. Parise, M. Karst Geo-hazard: Causal factors and management issues. Acta Carsologica 2015, 44, 401–414. [Google Scholar] [CrossRef]
  8. Denizman, C.; Thieme, D.M. Karst within the confining unit of the Floridan Aquifer: A geophysical investigation. J. Geogr. Geol. 2015, 10. [Google Scholar] [CrossRef]
  9. Gutiérrez, F.; Parise, M.; de Waele, J.; Jourde, H. A review on natural and human-induced geohazards and impacts in karst. Earth Sci. Rev. 2014, 138, 61–88. [Google Scholar] [CrossRef]
  10. Martínez-Moreno, F.J.; Pedrera, A.; Ruano, P.; Galindo-Zaldívar, J.; Martos-Rosillo, S.; González-Castillo, L.; Marín-Lechado, C. Combined microgravity, electrical resistivity tomography and induced polarization to detect deeply buried caves: Algaidilla cave (Southern Spain). Eng. Geol. 2013, 162, 67–78. [Google Scholar] [CrossRef]
  11. Sundararajan, N.; Narasimhachary, M.; Nandakumar, G.; Srinivas, Y. VES and VLF an application to ground water exploration, Khammam, India. Lead. Edge 2007, 26, 708–716. [Google Scholar] [CrossRef]
  12. Chalikakis, K.; Plagnes, V.; Guerin, R.; Valois, R.; Bosch, F.P. Contribution of geophysical methods to karst-system exploration: An overview. Hydrogeol. J. 2011, 19, 1169. [Google Scholar] [CrossRef]
  13. Pazzi, V.; Ceccatelli, M.; Gracchi, T.; Masi, E.B.; Fanti, R. Assessing subsoil void hazards along a road system using H/V measurements, ERTs and IPTs to support local decision makers. Near Surf. Geophys. 2018, 16, 282–297. [Google Scholar] [CrossRef]
  14. Chalikakis, K. Geophysical Methods Applied to Water Exploration and Protection in Karst Environment. Ph.D. Thesis, Université Pierre et Marie Curie-Paris 6, Paris, France, 2006; p. 217. [Google Scholar]
  15. Ford, D.C.; Williams, P.W. Karst Geomorphology and Hydrology; Chapman and Hall: New York, NY, USA, 2007; p. 601. [Google Scholar]
  16. Oladotun, A.O.; Oluwagbemi, J.E.; Lola, A.M.; Maxwell, O.; Sayo, A. Predicting dynamic geotechnical parameters in near surface coastal environment. Cog. Eng. 2019, 6, 1588081. [Google Scholar] [CrossRef]
  17. Verdet, C.; Colette, S.; Antoine, M.; Joëlle, R.; Portais, J.C. Detection of undercover karst features by geophysics (ERT) Lascaux cave hill. Geomorphology 2020, 360, 107177. [Google Scholar] [CrossRef]
  18. Xiaojun, Z.; Huang, J.; Song, L.; Chen, Y. Application of Ground penetrating Radar (GPR) exploration in Karst mountain areas. In Proceedings of the XIII Internarional Conference on Ground Penetrating Radar, IEEE, Lecce, Italy, 21–25 June 2010; pp. 1–4. [Google Scholar]
  19. Solbakk, T.; Fichler, C.; Wheeler, W.H.; Lauritzen, S.E.; Ringrose, P. Detecting Multiscale Karst Features Including Hidden Caves Using Microgravimetry in a Caledonian Nappe Setting; Mefjell Massif: Norsk Geologisk Forening, Norway, 2018. [Google Scholar]
  20. Guérin, R.; Baltassat, J.M.; Boucher, M.; Chalikakis, K.; Galibert, P.Y.; Girard, J.F.; Plagnes, V.; Valois, R. Geophysical characterisation of karstic networks-application to the Ouysse system (Poumeyssen, France). C.R. Geosci. 2009, 341, 810–817. [Google Scholar] [CrossRef]
  21. Valois, R.; Bermejo, L.; Guérin, R.; Hinguant, S.; Pigeaud, R.; Rodet, J. Karstic morphologies identified with geophysics around Saulges caves (Mayenne, France). Archaeol. Prospect. 2010, 17, 151–160. [Google Scholar] [CrossRef]
  22. Billi, A.; de Filippis, L.; Poncia, P.P.; Sella, P.; Faccenna, C. Hidden sinkholes and karst cavities in the travertine plateau of a highly-populated geothermal seismic territory (Tivoli, central Italy). Geomorphology 2016, 255, 63–80. [Google Scholar] [CrossRef]
  23. Cueto, M.; Olona, J.; Fernández-Viejo, G.; Pando, L.; López-Fernández, C. Karst-induced sinkhole detection using an integrated geophysical survey: A case study along the Riyadh Metro Line 3 (Saudi Arabia). Near Surf. Geophys. 2018, 16, 270–281. [Google Scholar] [CrossRef]
  24. Chávez, R.E.; Tejero-Andrade, A.; Cifuentes, G.; Argote-Espino, D.L.; Hernández-Quintero, E. Karst detection beneath the pyramid of El Castillo, Chichen Itza, Mexico, by non-invasive ERT-3D methods. Sci. Rep. 2018, 8, 1–9. [Google Scholar] [CrossRef] [PubMed]
  25. Bermejo, L.; Ortega, A.I.; Guérin, R.; Benito-Calvo, A.; Pérez-González, A.; Parés, J.M.; Carbonell, E. 2D and 3D ERT imaging for identifying karst morphologies in the archaeological sites of Gran Dolina and Galería Complex (Sierra de Atapuerca, Burgos, Spain). Quat. Int. 2017, 433, 393–401. [Google Scholar] [CrossRef]
  26. Dos Santos, E.S.; Silva, R.W.; Sampaio, E.E. Analysis of the risk of karst collapse in Lapão, Bahia, Brazil. Explor. Geophys. 2012, 43, 198–212. [Google Scholar] [CrossRef]
  27. De Queiroz, S.L.; Galvão, P.; Leal, L.R.B.; de Araujo Pereira, R.G.F.; da Purificação, C.G.C.; Laureano, F.V. Evaluation of susceptibility for terrain collapse and subsidence in karst areas, municipality of Iraquara, Chapada Diamantina (BA), Brazil. Environ. Earth Sci. 2018, 77, 593. [Google Scholar] [CrossRef]
  28. Pereira, D.L.; Galvão, P.; Lucon, T.; Fujaco, M.A. Adapting the EPIK method to Brazilian Hydro (geo) logical context of the São Miguel watershed to assess karstic aquifer vulnerability to contamination. J. S. Am. Earth Sci. 2019, 90, 191–203. [Google Scholar] [CrossRef]
  29. Brandi, I.; Sebastião, C.S.; Ferreira, M.L.; Lima, H.M.D.; Gama, M.F.P. Physical stability of iron ore caves: Geomechanical studies of a shallow underground cave in SE Brazil. REM Int. Eng. J. 2019, 72, 217–225. [Google Scholar] [CrossRef]
  30. Garcia, G.P.; Grohmann, C.H. DEM-based geomorphological mapping and landforms characterization of a tropical karst environment in southeastern Brazil. J. S. Am. Earth Sci. 2019, 93, 14–22. [Google Scholar] [CrossRef] [Green Version]
  31. Maranhão, D.D.; Pereira, M.G.; Collier, L.S.; dos Anjos, L.H.; Azevedo, A.C.; de Souza Cavassani, R. Pedogenesis in a karst environment in the Cerrado biome, northern Brazil. Geoderma 2020, 365, 114169. [Google Scholar] [CrossRef]
  32. Lobo, H.A.S.; Bichuette, M.; Hardt, R.; de Souza Martinelli, R.; Bruno Filho, F.G.; Gallão, J.; Calvo, E.M. Preliminary Environmental Characterization and Conservation Proposal to Gruta da Tarimba Karst System—Goiás State, Brazil; Brazilian Society of Speleology: São Paulo, Brazil, 2015. [Google Scholar]
  33. Gaspar, M.T.P.; Campos, J.E.G.O. Sistema aquífero urucuia. Rev. Bras. Geociênc. 2007, 37, 216–226. [Google Scholar] [CrossRef] [Green Version]
  34. Bengala, C.V. Detalhamento da Geologia das Unidades Carbonáticas do Grupo Bambuí na Região de Alvorada do Norte, Goiás. Ph.D. Thesis, Universidade de Brasília, Brasília, Brasil, March 2012. [Google Scholar]
  35. Dardenne, M.A. Síntese sobre a estratigrafia do Grupo Bambuí no Brasil Central. SBG Congr. Bras. Geol. 1978, 2, 507–510. [Google Scholar]
  36. Iglesias, M.; Uhlein, A. Estratigrafia do grupo bambuí e coberturas fanerozoicas no vale do rio São Francisco, norte de Minas Gerais. Rev. Bras. Geociênc. 2009, 39, 256–266. [Google Scholar] [CrossRef]
  37. Waltham, T.; Waltham, A.C.; Bell, F.G.; Culshaw, M.G. Sinkholes and Subsidence: Karst and Cavernous Rocks in Engineering and Construction; Springer Science & Business Media: Berlin, Germany, 2005. [Google Scholar]
  38. Sinclair, W.C.; Stewart, J.W.; Knutilla, R.L.; Gilboy, A.E.; Miller, R.L. Types, Features, and Occurrence of Sinkholes in the Karst of West-Central Florida; US Geological Survey: Reston, VA, USA, 1985.
  39. Redhaounia, B.; Ilondo, B.O.; Gabtni, H.; Sami, K.; Bédir, M. Electrical resistivity tomography (ERT) applied to Karst carbonate aquifers: Case study from Amdoun, northwestern Tunisia. Pure Appl. Geophys. 2016, 173, 1289–1303. [Google Scholar] [CrossRef]
  40. Mitrofan, H.; Povară, I.; Mafteiu, M. Geoelectrical investigations by means of resistivity methods in karst areas in Romania. Environ. Geol. 2008, 55, 405–413. [Google Scholar] [CrossRef]
  41. El-Qady, G.; Hafez, M.; Abdalla, M.A.; Ushijima, K. Imaging subsurface cavities using geoelectric tomography and ground-penetrating radar. J. Cave Karst Stud. 2005, 67, 174–181. [Google Scholar]
  42. Kaufmann, O.; Deceuster, J. Detection and mapping of ghost-rock features in the Tournaisis area through geophysical methods—An overview. Geol. Belg. 2014, 17, 17–26. [Google Scholar]
  43. Gambetta, M.; Armadillo, E.; Carmisciano, C.; Stefanelli, P.; Cocchi, L.; Tontini, F.C. Determining geophysical properties of a near surface cave through integrated microgravity vertical gradient and electrical resistivity tomography measurements. J. Cave Karst Stud. 2011, 73, 11–15. [Google Scholar] [CrossRef]
  44. Pánek, T.; Šilhán, K.; Tábořík, P.; Hradecký, J.; Smolková, V.; Lenart, J.; Pazdur, A. Catastrophic slope failure and its origins: Case of the May 2010 Girová Mountain long-runout rockslide (Czech Republic). Geomorphology 2011, 130, 352–364. [Google Scholar] [CrossRef]
  45. Loke, M.H. Tutorial: 2-D and 3-D Electrical Imaging Surveys; Geotomo Software: Penang, Malasya, 2004. [Google Scholar]
  46. Sasaki, Y. Resolution of resistivity tomography inferred from numerical simulation. Geophys. Prospect. 1992, 54, 453–464. [Google Scholar] [CrossRef]
  47. Colangelo, G.; Lapenna, V.; Loperte, A.; Perrone, A.; Telesca, L. 2D electrical resistivity tomographies for investigating recent activation landslides in Basilicata Region (Southern Italy). Ann. Geophys. 2008, 51, 275–285. [Google Scholar]
  48. Lapenna, V.; Lorenzo, P.; Perrone, A.; Piscitelli, S.; Rizzo, E.; Sdao, F. 2D electrical resistivity imaging of some complex landslides in Lucanian Apennine chain, southern Italy. Geophysics 2005, 70, B11–B18. [Google Scholar] [CrossRef]
  49. Shebl, S.; Gemail, K.S.; Attwa, M.; Soliman, S.A.; Azab, A.; Farag, M.H. Utilizing shallow seismic refraction in defining the geotechnical properties of the foundation materials: A case study at New Minia City, Nile Valley, Egypt. Egypt. J. Pet. 2019, 28, 145–154. [Google Scholar] [CrossRef]
  50. Attwa, M.; El-Shinawi, A. An integrative approach for preliminary environmental engineering investigations amidst reclaiming desert-land: A case study at East Nile Delta, Egypt. Environ. Earth Sci. 2017, 76, 304. [Google Scholar] [CrossRef]
  51. McClymont, A.; Bauman, P.; Johnson, E.; Pankratow, L. Geophysical applications to construction engineering projects. CSEG Rec. 2016, 41, 4. [Google Scholar]
  52. Prekopová, M.; Janočko, J.; Budinský, V.; Friedmanová, M. Integration of seismic and sedimentological methods for analysis of Quaternary alluvial depositional systems. Environ. Earth Sci. 2017, 76, 25. [Google Scholar] [CrossRef]
  53. Shahrukh, M.; Soupios, P.; Papadopoulos, N.; Sarris, A. Geophysical investigations at the Istron archaeological site, eastern Crete, Greece using seismic refraction and electrical resistivity tomography. J. Geophys. Eng. 2012, 9, 749–760. [Google Scholar] [CrossRef]
  54. Brixová, B.; Mosná, A.; Putiška, R. Applications of shallow seismic refraction measurements in the Western Carpathians (Slovakia): Case studies. Contrib. Geophys. Geod. 2018, 48, 1–21. [Google Scholar] [CrossRef] [Green Version]
  55. Azwin, I.N.; Saad, R.; Nordiana, M. Applying the seismic refraction tomography for site characterization. APCBEE Proc. 2013, 5, 227–231. [Google Scholar] [CrossRef] [Green Version]
  56. Jug, J.; Grabar, K.; Strelec, S.; Dodigović, F. Investigation of dimension stone on the Island Brač-Geophysical approach to rock mass quality assessment. Geosciences 2020, 10, 112. [Google Scholar] [CrossRef] [Green Version]
  57. Hagedoorn, J.G. The plus-minus method of interpreting seismic refraction sections. Geophys. Prospect. 1959, 7, 158–182. [Google Scholar] [CrossRef]
  58. Babu, R.V.; Ram, S.; Sundararajan, N. Modeling and inversion of magnetic and VLF-EM data with an application to basement fractures: A case study from Raigarh, India. Geophysics 2007, 72, B133–B140. [Google Scholar] [CrossRef]
  59. Al-Tarazi, E.; Abu Rajab, J.; Al-Naqa, A.; El-Waheidi, M. Detecting leachate plumes and groundwater pollution at Ruseifa municipal landfill utilizing VLF-EM method. J. Appl. Geophys. 2008, 65, 121–131. [Google Scholar] [CrossRef]
  60. Poddar, M.; Rathor, B.S. VLF survey of the weathered layering southern India Geophys. Prospect 1983, 315, 24–37. [Google Scholar]
  61. Al-Oufi, A.; Mustafa, H.A.; Al-Tarazi, E.; Abu Rajab, J. Exploration of the extension of two lava tubes, faults and dikes using very low frequency-electromagnetic technique in NE Jordan. Acta Geophys. 2008, 56, 466–484. [Google Scholar] [CrossRef]
  62. Dindi, E. An assessment of the performance of the geophysical methods as a tool for the detection of zones of potential subsidence in the area southwest of Nakuru town, Kenya. Environ. Earth Sci. 2015, 73, 3643–3653. [Google Scholar] [CrossRef]
  63. Fraser, D.C. Contouring of VLF-EM data. Geophysics 1969, 34, 957–967. [Google Scholar] [CrossRef]
  64. Abdullahi, N.K.; Osazuwa, I.B. Geophysical imaging of municipal solid waste contaminant pathways. Environ. Earth Sci. 2011, 62, 1173–1181. [Google Scholar] [CrossRef]
  65. Ogilvy, R.D.; Lee, A.C. Interpretation of VLF-EM in-phase data using current density pseudosections 1. Geophys. Prospect. 1991, 39, 567–580. [Google Scholar] [CrossRef]
  66. Eluwole, A.B. An Interactive Manual on Qualitative and Computer Assisted Interpretation of Very Low Frequency Electromagnetic (VLF-EM) Data; Obafemi Awolowo University: Ife, Nigeria, 2012. [Google Scholar] [CrossRef]
  67. Hussain, Y.; Ullah, S.F.; Hussain, M.B.; Aslam, A.Q.; Akhter, G.; Martinez-Carvajal, H.; Cárdenas-Soto, M. Modelling the vulnerability of groundwater to contamination in an unconfined alluvial aquifer in Pakistan. Environ. Earth Sci. 2017, 76, 84. [Google Scholar] [CrossRef]
Figure 1. (A) The administrative boundary of the environmentally sensitive area of the River Vermelho on the map of Brazil, (B) location of the study area on the Tarimba cave, and (C) the locations of geophysical profiles (ERT, SRS, and VLF-EM) on zoomed Trimba Cave map.
Water 12 02835 g001
Figure 2. Simplified stratigraphic log of the study site, based on [35,36].
Water 12 02835 g002
Figure 3. Pictures of the study area (a) the escarpment; (b) the very flat upper part of the sandstone; (c) the formation of oxisoil; (d) dolines opened in convex-concave hill-slopes covered by claystone; (e) canyons compartment formed as a result of cave collapse; and (f) the lower base level, connected with the base level.
Water 12 02835 g003
Figure 4. Conceptual model describing the formation of caves in the region. The cross-section of the landscape in the area formed by the retraction of the escarpment of Cretaceous sandstone from Urucuia formation, over Proterozoic carbonates and claystone from the Lagoa do Jacaré Formation of Bambuí group. The dotted blue line is the position of potentiometric surface, thick black lines are the positions of caves and yellow spots are silicified sandstone. Based upon [33,34].
Water 12 02835 g004
Figure 5. The photographs of the dolines (ac) and a cave (d).
Water 12 02835 g005
Figure 6. ERT data analysis along profile A-A’: (A) raw data, (B) filtered data, (C) resistivity model of the filtered data, (D) filtered and trimmed data, (E) resistivity model of the filtered and trimmed data, (F) resistivity model refinement using the grid of cells of 2.5 × 2.5 m2, and (G) absolute errors values and the data sets with reference to the number of iterations.
Water 12 02835 g006
Figure 7. Electrical resistivity results collected using a dipole-dipole along A-A’ and C-C’ profile with 5 m electrode spacing covering a distance of 355 m and a depth of ~59 m. The black dotted lines show the thickness of claystone (perched aquifer).
Water 12 02835 g007
Figure 8. Electrical resistivity results collected using a dipole-dipole along B-B’ and D-D’ lines with 5 m electrode spacing covering a distance of 355 m and a depth of 59 m. The black dotted lines show the thickness of claystone (perched aquifer).
Water 12 02835 g008
Figure 9. Seismograms from the C-C’ refraction line showing the picked travel-times.
Water 12 02835 g009
Figure 10. Travel-time vs distance graphs derived from the A-A’ and C-C’ refraction lines data and respective P-wave velocity cross-sections.
Water 12 02835 g010
Figure 11. Travel-time vs distance graphs derived from the D-D’ and B-B’ refraction lines data and respective P-wave velocity sections (the travel-times of the seismogram related to the external shot point SE was not picked because of its low SNR).
Water 12 02835 g011
Figure 12. P-wave velocity tomographic models at the A-A’ and C-C’ seismic lines. The black dotted lines show the thickness of claystone (perched aquifer).
Water 12 02835 g012
Figure 13. P-wave velocity tomographic models at the D-D’ and B-B’ seismic lines. The black dotted lines show the thickness of claystone (perched aquifer).
Water 12 02835 g013
Figure 14. VLF-EM results along the A-A’ (station spacing 5 m) and C-C’ (station spacing 20 m) survey lines. These cross-sections show high resistive zones as a possible presence of a cave and sediment-filled doline. Red color represents conductive (hot) targets.
Water 12 02835 g014
Figure 15. Interpreted geological model based on ERT, SRS and SRT methods.
Water 12 02835 g015

