Article

Measurement of Biochemical Methane Potential of Heterogeneous Solid Substrates: Results of a Two-Phase French Inter-Laboratory Study

1
Institut Polytechnique UniLaSalle, EA7519 Transformations & AgroRessources, Rue Pierre Waguet, BP 30313, 60026 Beauvais CEDEX, France
2
INRAE Transfert Environnement, 102 Avenue des Etangs, 11100 Narbonne, France
3
TBI, Université de Toulouse, CNRS, INRAE, INSA, Toulouse, France, 135 avenue de Rangueil, 31077 Toulouse CEDEX 04, France
4
Ondalys, 4 rue Georges Besse, 34830 Clapiers, France
5
INRAE, UR OPAALE, 17 avenue de Cucillé, CS 64427, 35044 Rennes, France
6
INRAE, UR PROSE, Université Paris-Saclay, 92160 Antony, France
7
VEOLIA Recherche et Innovation, Zone Portuaire, 291 Avenue Dreyfous Ducas, 78520 Limay, France
8
Laboratoire Déchets Eaux Environnement et Pollutions (DEEP), INSA-Lyon, Université de Lyon, EA7429, 9, rue de la Physique, 69621 Villeurbanne CEDEX, France
9
SUEZ, 38 Rue du Président Wilson, 78230 Le Pecq, France
10
Université de Technologie de Compiègne, Alliance Sorbonne Universités, TIMR EA 4297 UTC/ESCOM, Centre de Recherches de Royallieu, CS60 319, 60203 Compiègne CEDEX, France
11
APESA, Hélioparc, 2 av. Pierre Angot, 64053 Pau, France
12
LBE, INRAE, Univ Montpellier, 102 Avenue des étangs, 11100 Narbonne, France
*
Author to whom correspondence should be addressed.
Water 2020, 12(10), 2814; https://doi.org/10.3390/w12102814
Submission received: 27 July 2020 / Revised: 30 September 2020 / Accepted: 2 October 2020 / Published: 10 October 2020

Abstract

:
Biochemical methane potential (BMP) is essential to determine the production of methane for various substrates; literature shows important discrepancies for the same substrates. In this paper, a harmonized BMP protocol was developed and tested with two phases of BMP tests carried out by eleven French laboratories. Surprisingly, for the three same solid tested substrates (straw; raw mix and dried-shredded mix of potatoes, maize, beef meat and straw; and mayonnaise), the standard deviations of the repeatability and reproducibility inter-laboratory were not enhanced by the harmonized protocol (average of about 25% depending on the substrate), as compared to a previous step where all laboratories used their own protocols. Moreover, statistical analyses of all the results, after removal of the outliers (about 15% of all observations), did not highlight significant effect of the operational effect on BMP (stirring, automatic or manual gas quantification, use of trace metal, uses a bicarbonate buffer, inoculum to substrate ratio) at least for the tested ranges. On the other hand, the average intra-laboratory repeatability was low, about 7%, whatever the protocol, the substrate and the laboratory. It also appears that drying the SA substrate, which contained proteins, carbohydrates, lipids and fibers, does not impact its BMP.

1. Introduction

The organic residue treatment sector, including anaerobic degradation, is currently increasing especially in France. This recent phenomenon can be explained by an environmental awareness in industrialized countries, certainly based on one part of the depletion of fossil energy resources, implying the need to develop alternatives in terms of renewable energy, another part of the necessary protection of the environment by limiting greenhouse gas emissions (ratified by the Kyoto Protocol).
Anaerobic digestion is a biological process where biodegradation of organic substrates (alone or through codigestion) was carried out by a microbial consortium giving in this way biogas (mainly composed by methane and carbon dioxide) and digestate. AD processes were widely used for energy conservation and recovery and to valorize organic waste [1,2,3].
At the end of 2018, 18,202 biogas plants were numbered in Europe, with 11,084 in Germany, 1655 in Italy and 837 in France [4].
In this context, many parameters are currently playing in favor of the development of anaerobic digestion: (i) installations equipped with biogas upgrading were largely autonomous in energy and allow the sale of electricity or biomethane; (ii) in this framework, the incentive nature of the cost of buying back of kWh ex-biogas, allowing a return on investment, which is now short for many biogas plants; (iii) from a regulatory point of view, waste after anaerobic digestion was considered as “recovered”; (iv) for the biggest installations, anaerobic digestion with recovery of biogas can claim an interest in terms of “non-produced” CO2, and gave rise to credits according to the rules set by the Kyoto Protocol.
Consequently, an increase in the number of projects for solid waste treatment by anaerobic digestion was observed. These projects mainly concern anaerobic digestion and co-digestion of agricultural, industrial or household waste, through territorial streams.
The determination of the methanogenic potential of substrates, also known as BMP (Biological Methane Potential), is a central and essential parameter for any anaerobic processes [5,6,7,8], playing an important role both for research [7,9,10,11,12,13,14] and biogas plant management [15,16,17]. Actually, it is used for the technical and economic analysis of a project, for the design of treatment and recovery facilities and for the evaluation of the process performance. It is also a key indicator of the stability of solid wastes stored in landfills. While some publications mention methodologies for the determination of the methanogenic potential, the methods are often very different, especially for solid and heterogeneous substrates and there was no standard method in the past available for BMP tests [18]. This variability in analytical methods directly results from the lack of standardized protocol or adapted normative reference. It raises many questions about the quality of the results and limits their interpretation.
The first published standardized BMP protocol was proposed by Owen et al. [19], and since this starting point, several attempts at setting guidelines for the standardization of the BMP protocols have been made. In particular, the expert working group on anaerobic digestion (Anaerobic Digestion Specialist Group) of the International Water Association (IWA) has initiated a task group entitled “Task Group for the Harmonization of Anaerobic Biodegradation, Activity and Inhibition Assays”. It resulted in the publication of a protocol for solid waste BMP determination [20]. This protocol relies on previous publications that had already attempted to make recommendations based on the analysis of the involved processes [21,22,23,24] or on the application of very specific problems such as the inoculum/substrate ratio [25] or specific substrates [26]. However, no further action has so far been proposed after this work and the task group recommendations [20] are still only partially followed by the laboratories. Despite these harmonization efforts, large disparities remain in the protocols effectively implemented in the laboratory for the BMP determination, and the conclusions of Angelidaki et al. [20] were limited to recommendations, rarely directives, which were not sufficient to ensure standardization of the protocol, and which, in fact, were very rarely applied within laboratories.
For 20 years, several protocols of BMP determination were proposed [27], and the most common used were those identified by Pham et al. [28] and other studies [20,23,29] including the standard procedure VD1 4630 [30] proposed by the Association of German Engineers. These protocols were divided in two groups: the first one focused on protocols for the determination of anaerobic biodegradability of chemicals [31,32,33,34,35,36,37], the second one on protocols for the determination of ultimate biodegradability of complex organic compounds or methane production [31,38]. The overview of these normalized protocols and their characteristics shows a clear divergence of approaches. These standardized protocols diverge on almost all the measurement parameters considered to be important: test volume, supplementation with nutritive solution, test duration, pretreatment, preparation and adaptation of inoculum.
The protocols of BMP determination used by researchers were commonly adapted from one study to another study in order to provide specific answers to the investigated problem. For example, 14 factors influencing BMP measurements, belonging to inoculum (origin, solid contents, pre-incubation or pre-digesting, concentration at the start-up experiment), physical (reactor capacity, temperature, stirring, test duration) and chemical (headspace gas, pH/alkalinity adjustment, mineral medium) experimental conditions, inoculum to substrate ratio, gas measurement systems characteristics, positive control substrate were described by Raposo et al. [14].
In the same way, Ohemeng-Ntiamoah and Datta [39] analyzed 78 peer-reviewed BMP studies published between 2007 and 2018 and focused on similarities and differences in the methodologies used and discussed the results obtained. Their conclusions were that many studies did not provide adequate information about BMP methodology and results were often reported in different units.
To summarize, these protocols used as well the operating conditions and the equipment varied from one study to another, even within the same lab. This large amount of data generated over the past twenty years at the academic level was very difficult to interpret.
As a consequence, the reliability of BMP measurements is still discussed. This was illustrated by recent inter-laboratory studies.
The first one was reported by Raposo et al. [40] and evaluated the results from 19 laboratories worldwide on simple model substrates (starch, cellulose, gelatin and mung beans). The second one was an Italian study reported by Porqueddu et al. [41] and involved 19 laboratories, which evaluated the BMP of freeze-dried samples of cheese whey, silage maize and biowaste. The findings of these studies support a wide dispersion of results with both a high number of outliers and poor reproducibility relative standard deviation.
The work coordinated by Raposo [40], as part of the ADRIL project (Anaerobic Digestion Research Inter-Laboratory), in collaboration with 19 international laboratories confirmed this observation. Four substrates were tested: cellulose, starch, gelatin, and two identical samples of mung beans. The experimental conditions were left to the discretion of the various laboratories, all involved in research or analysis services including these BMP tests. Only one parameter was imposed, due to its demonstrated influence on the results of the BMP tests: the inoculum/substrate ratio (I/S). The results obtained relate the huge variability of the values of methanogenic potentials measured from solid substrates, however homogeneous, and the heterogeneity of the experimental approaches implemented by the various laboratories. However, since the analytical results obtained were not linked to the experimental protocols used by the laboratories involved, this study did not allow the identification of the factor, or factors, having a significant influence on the measurement of methanogenic potential.
A Swiss study on the optimization of standardized digestibility tests in batch reactors was carried out in 2011 by EPFL under the mandate of the Federal Office of Energy [42]. BMP series of tests were carried out, applying a very strict basic protocol and varying certain key parameters in order to better understand the influence of some of these parameters on the methane production potential of a substrate. This study carried out from powders of homogeneous solid substrates (this assay did not include any pretreatment) allowed to specify certain fundamental figures for the standardization of a BMP test, mainly regarding the inoculum. It was thus shown that the origin and the adaptation of the inoculum had no decisive influence on the production potential of methane. However, these conclusions are limited to only four inocula used in the study.
An inter-laboratory study carried out by 19 Italian laboratories was also carried out on lyophilized powdered substrates (corn silage, bio-waste and whey), setting as the only constraint I/S ratio equal to two [41]. As in the study of Raposo et al. [40], the results showed a very large dispersion with reproducibility differences ranging from 40% to 110% depending on the substrates. However, the analysis of the factors potentially causing this dispersion was not carried out, and the need for standardization of the protocols was simply claimed.
In 2018, Weinrich et al. [43] summarizing batch tests for biogas potential analysis showed a global inter-laboratory reproducibility in the range of 8% to 26%, that is also the result of German tests [44].
The most recent BMP guidelines were proposed by Holliger et al. [45], VDI 4630 [30] and Hafner et al. [46], which recommends a set of compulsory elements for validating BMP results. In Hafner et al. [46], a standardized BMP protocol built from guidelines recommended by Holliger et al. [45] and carried out by more than thirty laboratories from fourteen countries was tested in a large inter-laboratory project, using multiple measurement methods, resulting in more than 400 BMP values. The inter-laboratory variability of BMP values was moderate, and the relative standard deviation was 7.8% to 24% but relative range was 31% to 130% [46].
The major part of the guidelines in the last decade [20,30,44,45,46,47] provided more or less detailed information about design and completion of BMP tests, and three guidelines gave clear criteria about the validation of the obtained results [44,45,46]. These guidelines highlighted the existing shortcomings of BMP tests and demonstrate the relevance of standardizing BMP experimental parameters and data reporting [39].
A similar inter-laboratory study was carried out for the determination of biohydrogen potential (BHP) and proposed the first standardized and validated protocol, evaluated by eight independent laboratories [48]. As quality criteria, the coefficient of variation of the cumulative hydrogen production was targeted to be less than 15% and two options (manual and automatic protocols) to run BHP batch tests were proposed. The validation showed acceptable repeatability and reproducibility, measured as intra-laboratory and inter-laboratory coefficient of variation, which can be reduced up to 9% [48].
This work concerns an inter-laboratory study achieved by eleven French laboratories. The study involved two experimental phases. For each of them, three substrates were sent to each participating laboratory, which achieved six methanogenic potential measurements for each substrate. During the first experimental phase, each partner achieved the methanogenic potential measurements according to its own protocol. During the second phase, each partner made new measurements according to the common protocol defined after analyzing the results of the first phase.
The relevance of this study and the strength of its drawn conclusions required the involvement of a representative number of private and French academic laboratories regularly carrying out BMP measurements.
The aim of this proposed French inter-laboratory study was to evaluate the current protocols used in the country for BMP evaluation and to establish their harmonization. Two of the main objectives were to identify key points and define good experimental practices, and to suggest a suitable methodological framework. The originality and the novelty of this inter-laboratory study were about the fact that this study was addressed to solid and heterogeneous substrates (origin and nature of substrates). Moreover, this study was organized in two phases allowing evaluating the repeatability, the intra- and inter-laboratory reproducibility with two triplicates launched for each lab with four weeks between both phases. In this way, this organization was clearly a differential point with other studies carried out in the past.

2. Materials and Methods

2.1. BMP Measurement

The methods for the BMP determination used by laboratories were often very different, in particular when the substrates analyzed were solid substrates. In general, these protocols aim to produce the optimal conditions for anaerobic digestion of organic matter, in order to express all, or the maximum, of the methanogenic potential of the substrate.
The measurement methods were based on the cultivation in bioreactors of well-known quantities of organic material and anaerobic microorganisms (inoculum), set in suitable conditions for development of optimal anaerobic biological activity. During the test, the microorganisms degraded the organic matter, which was converted to biogas. At the end of this reaction phase, the speed of biogas production dropped corresponding to the end of the biodegradation of organic matter. The biogas production (or the methane production after CO2 entrapment) is measured over time, and the composition of the biogas produced was generally analyzed by gas chromatography. The methane potential of each substrate was determined from the cumulative amount of methane produced during the test.
The methanogenic potential of the substrates can be determined using manual (volumetric or manometric measurements), automatic [24,30,49] or gravimetric methods [50,51,52]. In case of using automatic systems such as AMPTS® system (Automatic Methane Potential Test System, BioProcess Control), this device allowed to monitor 15 reactors simultaneously under mesophilic conditions at 37 ± 1 °C, and to record the gas flow during all the tests. AMPTS systems allowed to monitor online the biogas (or the methane production after CO2 entrapment in 3 M soda solution with thymolphtalein). The preparation steps of substrates were the same for automatic or conventional BMP tests.

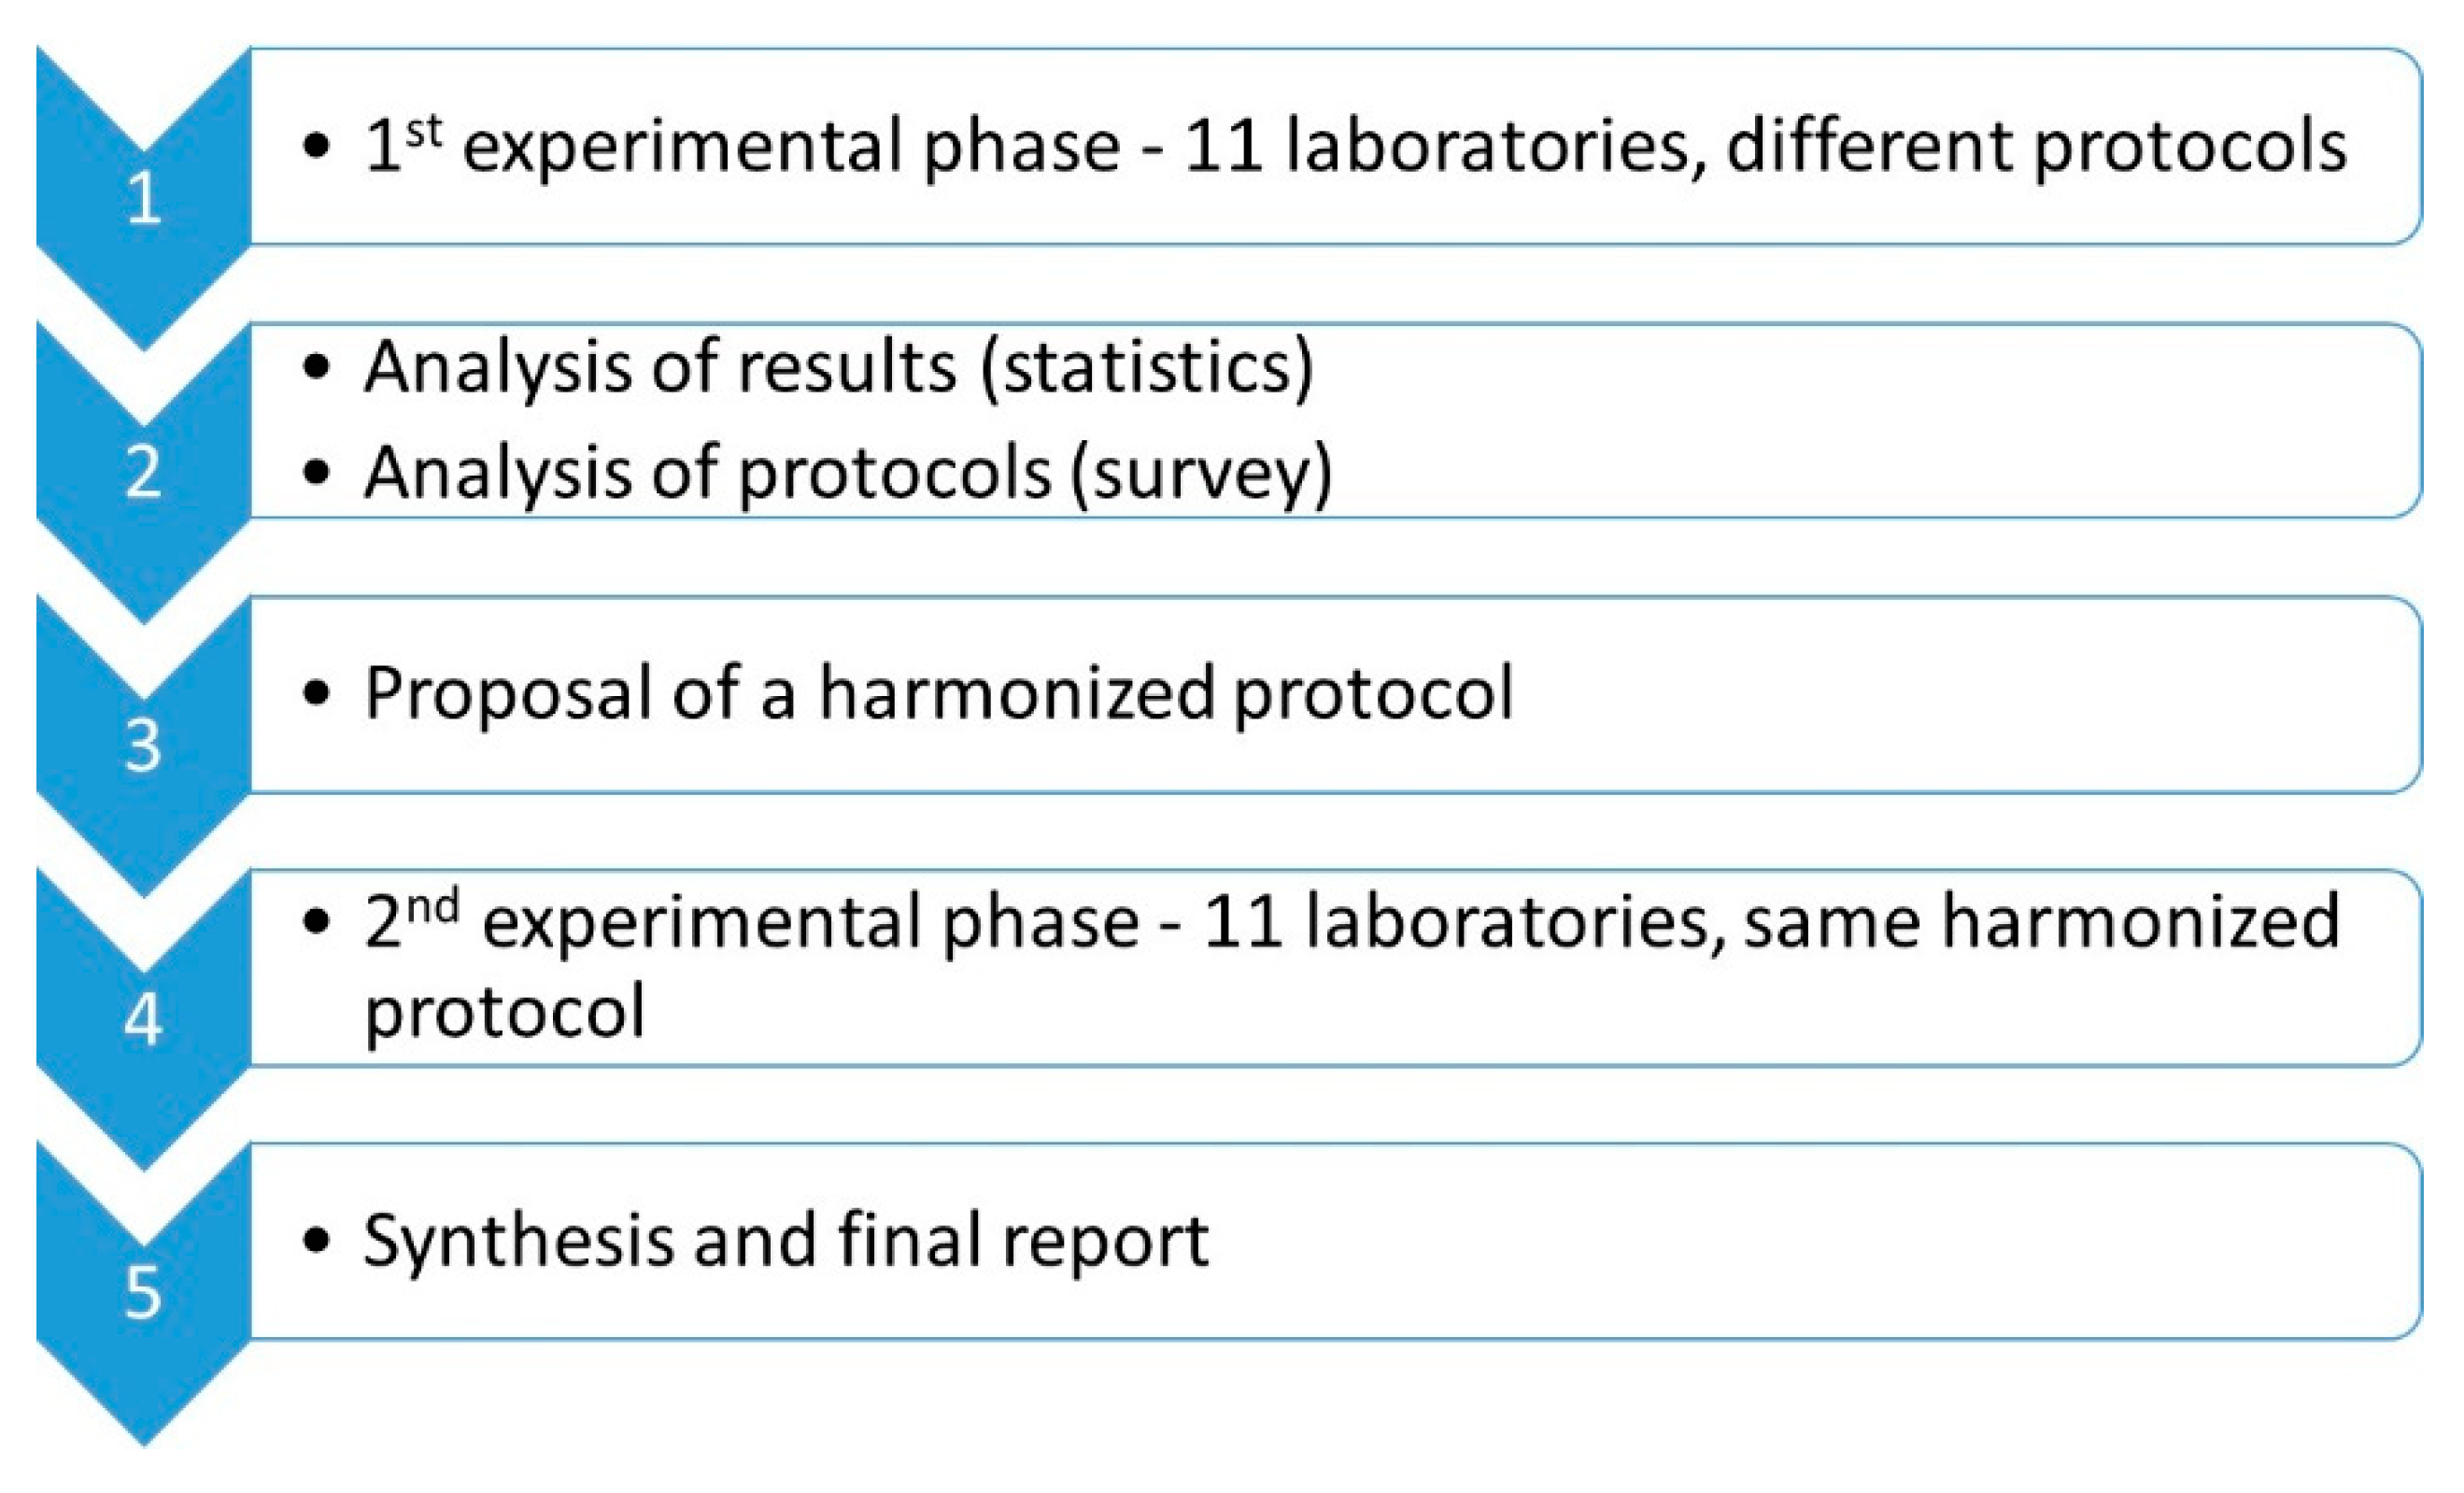
2.2. Organization and Methodology of the Inter-Laboratory Study

2.2.1. Generalities

The laboratories involved in this study were public (academic) and private research labs: APESA, DEEP INSA Lyon, HPAN INRAE, ITE INRAE, LBE INRAE, LISBP, ONDALYS, OPAALE INRAE, UniLaSalle, UTC, VEOLIA Recherche & Innovation, SUEZ. An encoding number (1 to 11) was assigned to each laboratory, and the results were randomized in order to anonymize them. Two of the eleven labs carried out the BMP tests in parallel with manual and automatic methods, giving 13 datasets.
In the face of heterogeneity with several protocols used by French labs for the determination of the biochemical methane potential of solid heterogeneous solid substrates, it became necessary to investigate this point. The applied methodology must lead to clear conclusions (recommendations) concerning the current methodologies used and proposals for the harmonization of protocols.
The course of this study, divided into 5 phases, was depicted in Figure 1 and the total duration was 24 months. The approach was a classical inter-laboratory test methodology, based firstly on a literature survey related to several existing methodologies for the BMP determination. This first phase focused in particular on the measurement of the methanogenic potential of solid substrates. The following phase was dedicated to the design of the inter-laboratory test with the definition of the objectives, the choice of the model substrates (SA, SA’ and SB), and the building of a survey (Excel file) that each laboratory partner had to fill, allowing to collect and to compare all the experimental procedures carried out by each lab.
All participants applied their own typical BMP measuring protocol with the sole obligation to run the tests in two series of triplicates and to include blanks and positive controls. The identified factors differing from one laboratory to another were the main method (manual or automated via AMPTS® apparatus/devices), the gas volume measurement technique, the mixing regime, the inoculum/substrate ratio (I/S), the pH buffer addition, the mineral medium complementation and the level of endogenous methane production.
The data collected at the end of this first phase should make possible to carry out a comparative study of the protocols used by the several laboratories, both qualitative (nature of the protocols used) and quantitative (values of methane potential obtained). A complete analysis of the results obtained, correlated to the various experimental protocols, was carried out with the objective to propose a common protocol discussed and built from a collective consensus; this new protocol was the deliverable of the intermediate stage of this study. This new common protocol was then applied by each lab during a second experimental phase starting with sending solid substrates (SA’, SB and SC) to each lab; each lab had to follow precisely the recommendations made during the previous phase: use of a common mineral medium, use of 3 g L−1 NaHCO3 as pH buffer and set the volatile solid inoculum/substrate ratio to two.
This validation step should make it possible, on one hand, to verify that the possible methodological freedoms granted within the framework of the common protocol were not prohibitive, on the other hand, to determine the inter-laboratory and intra-laboratory variability of the measurement. The last phase of the study consisted in writing a summary report presenting the approach adopted, the results obtained as well as the standardized protocol, which will serve as a reference for the standardization of the BMP measurement protocol.

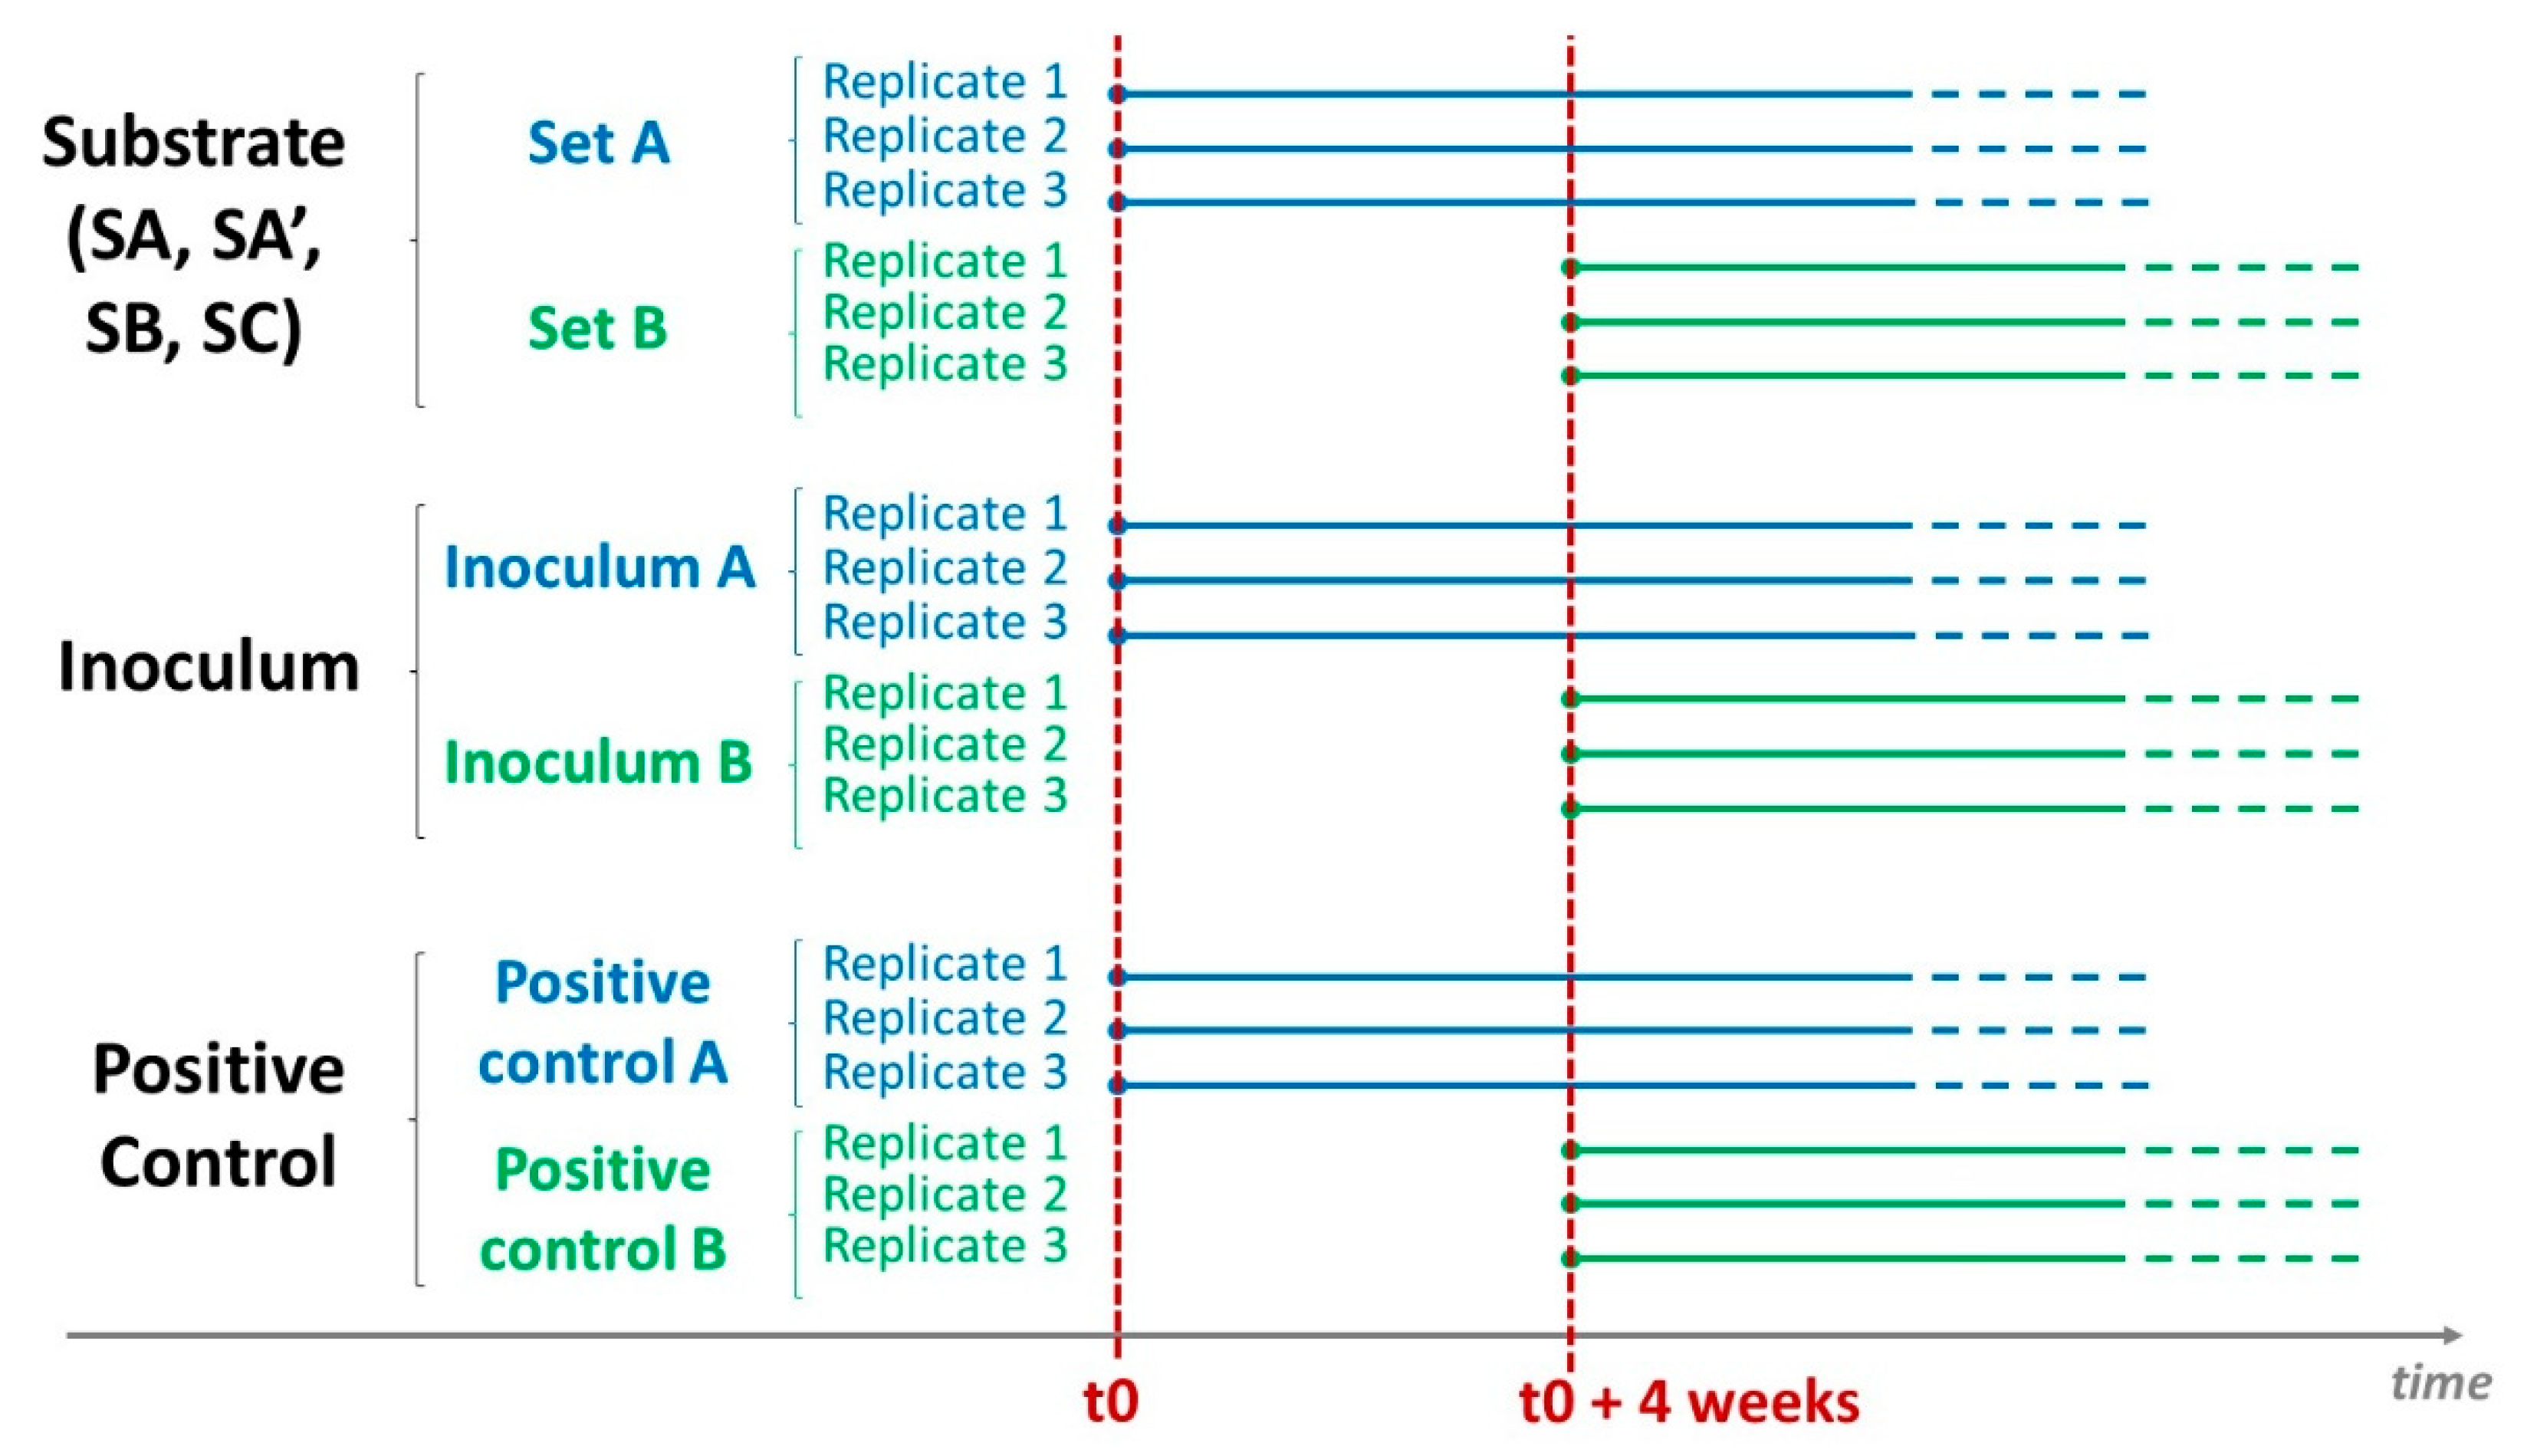
2.2.2. Building of the Inter-Laboratory Study

For both phases, the three substrates described above were sent to each participating laboratory, which carried 6 BMP measurements for each substrate, blanks (endogenous activity of the inoculum) and positive control (standard compound for methanogenic activity determination) as described in Figure 2.
During the first experimental phase, each partner carried out 6 BMP measurements according to their own protocol. During the second phase, each partner again carried out 6 BMP measurements according to the common protocol defined in the context of phase 5 of this study. For each of the experimental phases, laboratories were asked to carry out 2 series of 3 measurements, the second series having to start at least 4 weeks after the first series. The objective of these repetitions was to test the inter-laboratory reproducibility but also the intra-laboratory reproducibility of the measurement.

2.2.3. Experimental Data Collection

Two Excel files were sent to each lab respectively to summarize the protocols and the results at the beginning of the first phase of the inter-laboratory study. The analysis of the information collected allowed to draw up a precise overview of the techniques and methods used by the different participants and to interpret the results obtained at the end of the first phase of the inter-laboratory test according to the experimental and analytical practices of each laboratory.
The first Excel survey file, only sent for the first phase of the inter-laboratory study, summarized the protocols used for substrate preparation and test performance, as well as the calculations to assess the values of methane potential. This survey, which was written as templates with the aim of allowing the most complete analysis possible of the protocol of each laboratory, was the most exhaustive possible. The following information was collected: transportation (condition, duration), storage (duration, temperature), pretreatment (if yes, which one, mass of substrate) and characterization (parameters) of the substrate; experimental setup (replication, volume, headspace volume, opened system, stirring, temperature, blank with inoculum for endogenous production, positive control substrate); medium (origin, characterization, preparation such dilution, concentration, depletion, incubation, activity measurement, I/S ratio, supplementation with nutrients and mineral solution, buffer), monitoring of assays (biogas and/or methane quantification, biogas composition, method of gas measurement (manual, automatic, volumetric, manometric), gas measurement (opened or closed system), characterization of the medium at the end of the test), experimental data analysis and results presentation (detailed calculation of methane production, units, curves).
The second Excel file survey, sent before the two phases of the inter-laboratory study, summarized the results of experimental tests such as substrate analysis (TS, VS, COD, pH of substrate and inoculum), composition of the vials at the start of the tests (volume, headspace volume, inoculum, nutrients and mineral solution), gas measurement method (automatic, manual, volumetric, manometric), kinetics of biogas production for each vial (time, methane production), and final results of BMP for each test expressed in NmL per gram of VS. The data were collected for each set (3 replicates) separately; calculations were automatically carried out with correction of temperature and pressure, and graphs were also automatically plotted for each set (substrate, blank, positive control) in order to standardize the data processing and to avoid errors.
At the end of the first and second phases, each lab sent to the coordinator of the inter-laboratory study the Excel files filled with data, calculations and graphs, respectively, already carried out.

2.2.4. Experimental Data Calculation

The measured gas volume was corrected to dry gas at standard temperature and pressure conditions (273.15 K and 101.325 kPa), and the data are expressed in normal cubic millimeters of methane per gram of volatile solid (NmLCH4 gVS−1).
  • Test Carried Out in a Closed System
The volume of biogas produced was evaluated:
  • By pressure measurement using a differential manometer;
  • By volumetric measurement using a suitable device (flowmeter, “inverted specimen”, syringe, etc.)
The composition of the biogas produced in methane (CH4) was analyzed each time the volume was measured using a suitable measuring device (chromatograph, infrared analyzer, etc.)
The measuring and analysis devices must be calibrated and checked in accordance with the recommendations of the supplier of the measurement equipment.
  • Monitoring by pressure measurement
Parameter to be measured:
  • The differential pressure ΔP(i);
  • The methane content;
  • Atmospheric pressure on the day of analysis;
The pressure in the reaction chamber was equilibrated to the atmosphere after each measurement.
Each time a sample was taken, ΔP(i), Patm(i) and y(i) were measured.
Calculations:
  • The pressure in the reaction chamber:
P ( i ) = Δ P ( i ) + P atm ( i ) ,
  • The saturating vapor pressure of water at the working temperature T, e.g., according to the Rankine formula:
P sat ( T ) = 101325 exp ( 13.7 5120 T )
  • The volume of methane (NCTP) produced since the last sampling:
Δ V ( i ) = [ ( y ( i ) ( P ( i ) P sat ( T ) ) Vh T ) ( y ( i 1 ) ( P atm ( i 1 ) P sat ( T ) ) Vh T ) ] T 0 P 0
with
-
P(i)—the pressure in the reaction chamber at the time of analysis (Pa);
-
ΔP(i)—the differential pressure read on the pressure gauge (Pa);
-
Patm(i−1)—the atmospheric pressure on the time i−1 of the previous analysis (Pa);
-
Patm(i)—the atmospheric pressure on the time i of analysis (Pa);
-
Psat(T)—the saturating vapor pressure of water at temperature T (Pa);
-
Y(i−1)—the CH4 content in the dry biogas on the time i−1 of previous sampling (%);
-
y(i)—the CH4 content in the dry biogas on the time i of sampling (%);
-
ΔN(i)—the number of moles of methane produced since the last sample was taken (mol);
-
ΔV(i)—the volume of NCTP methane produced since the last sampling (Nm3);
-
Vh—the volume of the gas headspace (including the measuring device) (L);
-
T—temperature of the reaction chamber during measurement (K);
-
T0—standard temperature (273.15 K);
-
P0—standard pressure (1 × 10⁵ Pa).
  • Monitoring by volumetric measurement
Parameters to be measured:
  • Volume of biogas produced since the last collection;
  • Methane content of the biogas;
  • The atmospheric pressure on the day of the previous sampling.
  • The pressure in the reaction chamber is balanced to the atmosphere after each measurement.
  • Each time a sample was taken, ΔP(i), Patm(i) and y(i) were measured.
  • Calculations:
  • The saturating vapor pressure of the water at the working temperature T, by using the Rankine formula as shown above.
  • The volume of methane (NCTP) produced since the last sampling:
Δ V ( i ) = [ ( y ( i ) ( P atm ( i ) P sat ( T ) ) ( Vb ( i ) + Vh ) T ) ( y ( i 1 ) ( P atm ( i 1 ) P sat ( T ) ) Vh T ) ] T 0 P 0
where
-
Vb(i)—the volume of biogas measured on the time i of the analysis (m3);
-
Patm(i−1)—the atmospheric pressure on the time i−1 of the previous analysis (Pa);
-
Patm(i)—the atmospheric pressure on the time i of analysis (Pa);
-
Psat(T)—the saturating vapor pressure of water at temperature T (Pa);
-
Y(i−1)—the CH4 content in the dry biogas on the time i−1 of previous sampling (%);
-
y(i)—the CH4 content in the dry biogas on the time i of sampling (%);
-
ΔN(i)—the number of moles of methane produced since the last sample was taken (mol);
-
ΔV(i)—the volume of NCTP methane produced since the last sampling (Nm3);
-
Vh—the volume of the gas headspace (including the measuring device) (L);
-
T—temperature of the reaction chamber during measurement (K);
-
T0—standard temperature (273.15 K);
-
P0—standard pressure (1 × 10⁵ Pa).
  • Test Carried Out in an Open System
Parameter to be measured:
The volume of biogas produced is measured using a suitable device (flowmeter) that has been calibrated beforehand. The methane (CH4) composition of the biogas was analyzed periodically (or continuously) using a suitable device.
The volume of methane produced can be measured directly, after solubilization of the carbon dioxide in a basic solution. In this case:
  • The CO2 solubilization device (trap) must be separated from the reaction chamber, preventing the return of the CO2-free biogas into the headspace, in contact with the reaction medium;
  • Knowledge of the methane content of the biogas at the beginning and end of the test was necessary.
At each analysis, V(i), P and y(i) were measured.
Calculations:
The calculation of methane production between two analyses must take into account the following:
  • The variation of the methane content of the headspace in the reaction chamber;
  • The variation in the methane content of the biogas produced between two analyses.
The volume of methane produced between two analyses can be approximated by the following formula:
Δ V ( i ) = ( [ V h ( y ( i ) y ( i 1 ) ) ] ( P P sat ( T ) ) 10 5 273.15 T ) + ( [ Vb ( i ) y ( i ) + y ( i 1 ) 2 ] ( P P sat ( T ) ) 10 5 273.15 T )
  • With the saturating vapor pressure of water at the working temperature T by using the Rankine formula as shown above.
where
-
Vb(i)—the volume of biogas produced since the last analysis (m3);
-
P—the pressure in the reaction vessel (Pa);
-
Psat(T)—the saturating vapor pressure of water at temperature T (Pa);
-
y(i−1)—the CH4 content in the dry biogas on the time i−1 of previous sampling (%);
-
y(i)—the CH4 content in the dry biogas on the time i of sampling (%);
-
ΔV(i)—the volume of NCTP methane produced since the last analysis (Nm3);
-
Vh—the volume of headspace (including the of the gas phase measuring device) (m3);
-
T—reaction chamber temperature (K).
For an AMPTS device, these calculations were automatically included in the software.
Since this inter-laboratory study, Hafner et al. [46] have built a free website where normalized BMP calculation was given (available at www.dbfz.de/en/projetcs/bmp/methods).

2.2.5. Results Analysis

All Excel files were collected and treated by the Ondalys company (Clapiers, France), partner of the inter-laboratory study. On one hand, statistical data were drawn for each lab after removing the outliers. The repeatability was assessed with 3 assays per set; the intra-laboratory reproducibility was assessed with 2 sets for each lab, and finally, the inter-laboratory reproducibility was determined between the 11 labs involved in this study. The averages of the methane production of the blanks were always subtracted from those of the data before the analysis of the results. The uncertainty of the blank production was not considered.
On the other hand, statistical analyses were carried out by an independent way for the substrates SA (raw complex substrate) and SA’ (dried and shredded complex substrate), and SB (dried and shredded straw), using ANOVA and Newman–Keuls or Duncan tests. Factors of variability studied for SA and SA’ were the following: (i) Substrate preparation: raw vs shredded (2 modalities); (ii) Lab (11 modalities); (iii) Date of analysis (2 modalities) and for SB: lab (11 modalities); date of analysis (2 modalities).
The results for the statistical quantitation of significance for the different factors obtained by ANOVA should be interpreted with caution. The measurements were taken from actual laboratory practices, therefore forming an incomplete and unbalanced experiment design, with no randomly assignment for the factor levels. The sample size for some factor levels, especially for the experimental system (Manual/AMPTS), was for some factors small. Thereby, a certain number of precautions were applied during the statistical analysis in order to particularly dismiss the terms with too small sample size, and to consider the nested nature of certain factors (method/gas measurement/agitation).
Calculations of the Relative Standard Deviation (RSD) for repeatability and reproducibility were performed according to NF ISO 5725 [53] and NF ISO 13528 [54], using the following model
y = m + B + e,
where m is average, B the difference between steps series in one lab and e the residuals.
The intra-laboratory repeatability was calculated as
σ r = var ( e ) = SS r N p
where SSr is the sum of the squares of the intra-laboratory repeatability, N is the total number of observations and p is the number of series
The inter-laboratory reproducibility was calculated as
σ R = σ L 2 + σ r 2
where σ L 2 = ( p 1 ) ( SS L p 1 σ r 2 )   N is the inter-laboratory variance; SSL is the sum of the squares of the inter-laboratory reproducibility, and N = N i = 1 p n i 2 N is the corrected average number of repetitions per test with n the number of repetitions per test.
Concerning the outlier’s removal, some data have been identified by each lab for the first step in discussion with Ondalys. Each laboratory was allowed to decide which results have been justifiably withdrawn from the statistical analysis, with the following suggested rules:
-
1 test was eliminated from a series of 3 replicates if RSD was higher than 10% and the two other tests had close values;
-
1 whole series (the 3 replicates) was eliminated if RSD was higher than 10% and the three replicates were all sufficiently different from each other (RSD higher than 10% leaving 2 replicates);
-
1 test or 1 series was eliminated if technical justification (gas leakage, broken bottles, electrical shutdown, failure of devices or sensors, problem of heating system, etc.).
The basic idea behind these rules was that these results would not have been provided to a customer and were removed from statistical analysis because there was no objective reason to rule them out.
Table 1 indicates that a significant number of outliers had been ruled out. These outliers greatly impacted the different results but accounted for the initial objective, which was to analyze the variability of intra and inter-laboratory measurements in order to try in a second phase, to harmonize the measurement protocols.
In the harmonized protocol (described below in the Results section), the rules for the elimination of outliers had been requested as mandatory. Applying these rules and also the self-criticism of each laboratory as in the first phase, a significant number of outliers were detected in the second phase and ruled out, as shown in Table 2.

2.3. Choice, Composition and Preparation of Substrates

2.3.1. Choice of the Different Substrates

The solid organic substrates studied in anaerobic digestion projects were highly variable depending on the feedstocks considered. Two main criteria were considered for the choice of the substrates studied: biodegradability (biochemical properties) and physical structure (homogeneity, size). The choice of substrates was determined in order to study the response of the partners with regard to these two aspects: biodegradability and homogeneity. For this purpose, three distinct substrates were prepared with the targeted characteristics summarized in Table 3. The substrate SA ‘is identical to the substrate SA but was prepared before sending to all labs by drying and grinding into powder in order to obtain a homogeneous substrate. In this way, the impact of the preparation mode and the impact of the experimental measurement protocol on the BMP results could be determined.
The different labs decided to add, during the second experimental phase, a lipidic substrate (fats), because this type of substrate was very sensitive to the biological activities of the microbial populations provided by the ‘inoculum. Commercial mayonnaise was chosen.

2.3.2. Composition of the Substrates

All substrates SA, SA’ (same substrate as SA but dried and shredded), SB and SC were prepared by one laboratory and sent to all participants. For the first phase of this study, lots of SA, SA’ and SB were sent to the eleven labs in November 2012. For the second phase, lots of SA’, SB and SC were sent in May 2014.
The composition of these substrates is given in Table 3.

2.3.3. Preparation of Substrates

The mixtures SA were prepared for each lab partner in 5.1 kg lots while wheat straw (dry material) was packed in bags and the other components (wet materials) were packed in buckets. A total of 26 lots were prepared in September 2012 and frozen at −20 °C.
For the preparation of the substrate SA’ (homogeneous powder), 2 lots were dried at 80 °C to reduce the potential loss of volatile fatty acids (VFA) and ground to 1 cm (Blick BB 230). Due to the reduced capability of drying, the substrates were frozen at −20°C before shredding. The whole dried matter was grinded as powder with lab knives grinder (Fritsch Pulverisette 19) equipped with 0.5 mm grid in order to obtain a homogeneous dried powder. Then, lots of 100 g were packed in sealed vessels.
The lots SB were packed in buckets containing 100 g of wheat. Lots SC were mayonnaise buckets purchased from supermarkets.
A nutritive solution was prepared by one of the eleven labs and sent to other labs. The composition, adapted from the recommendations which Angelidaki et al. [20,24] themselves adapted from Madigan et al. [55], was given in Table 4.

2.4. Physicochemical Parameters
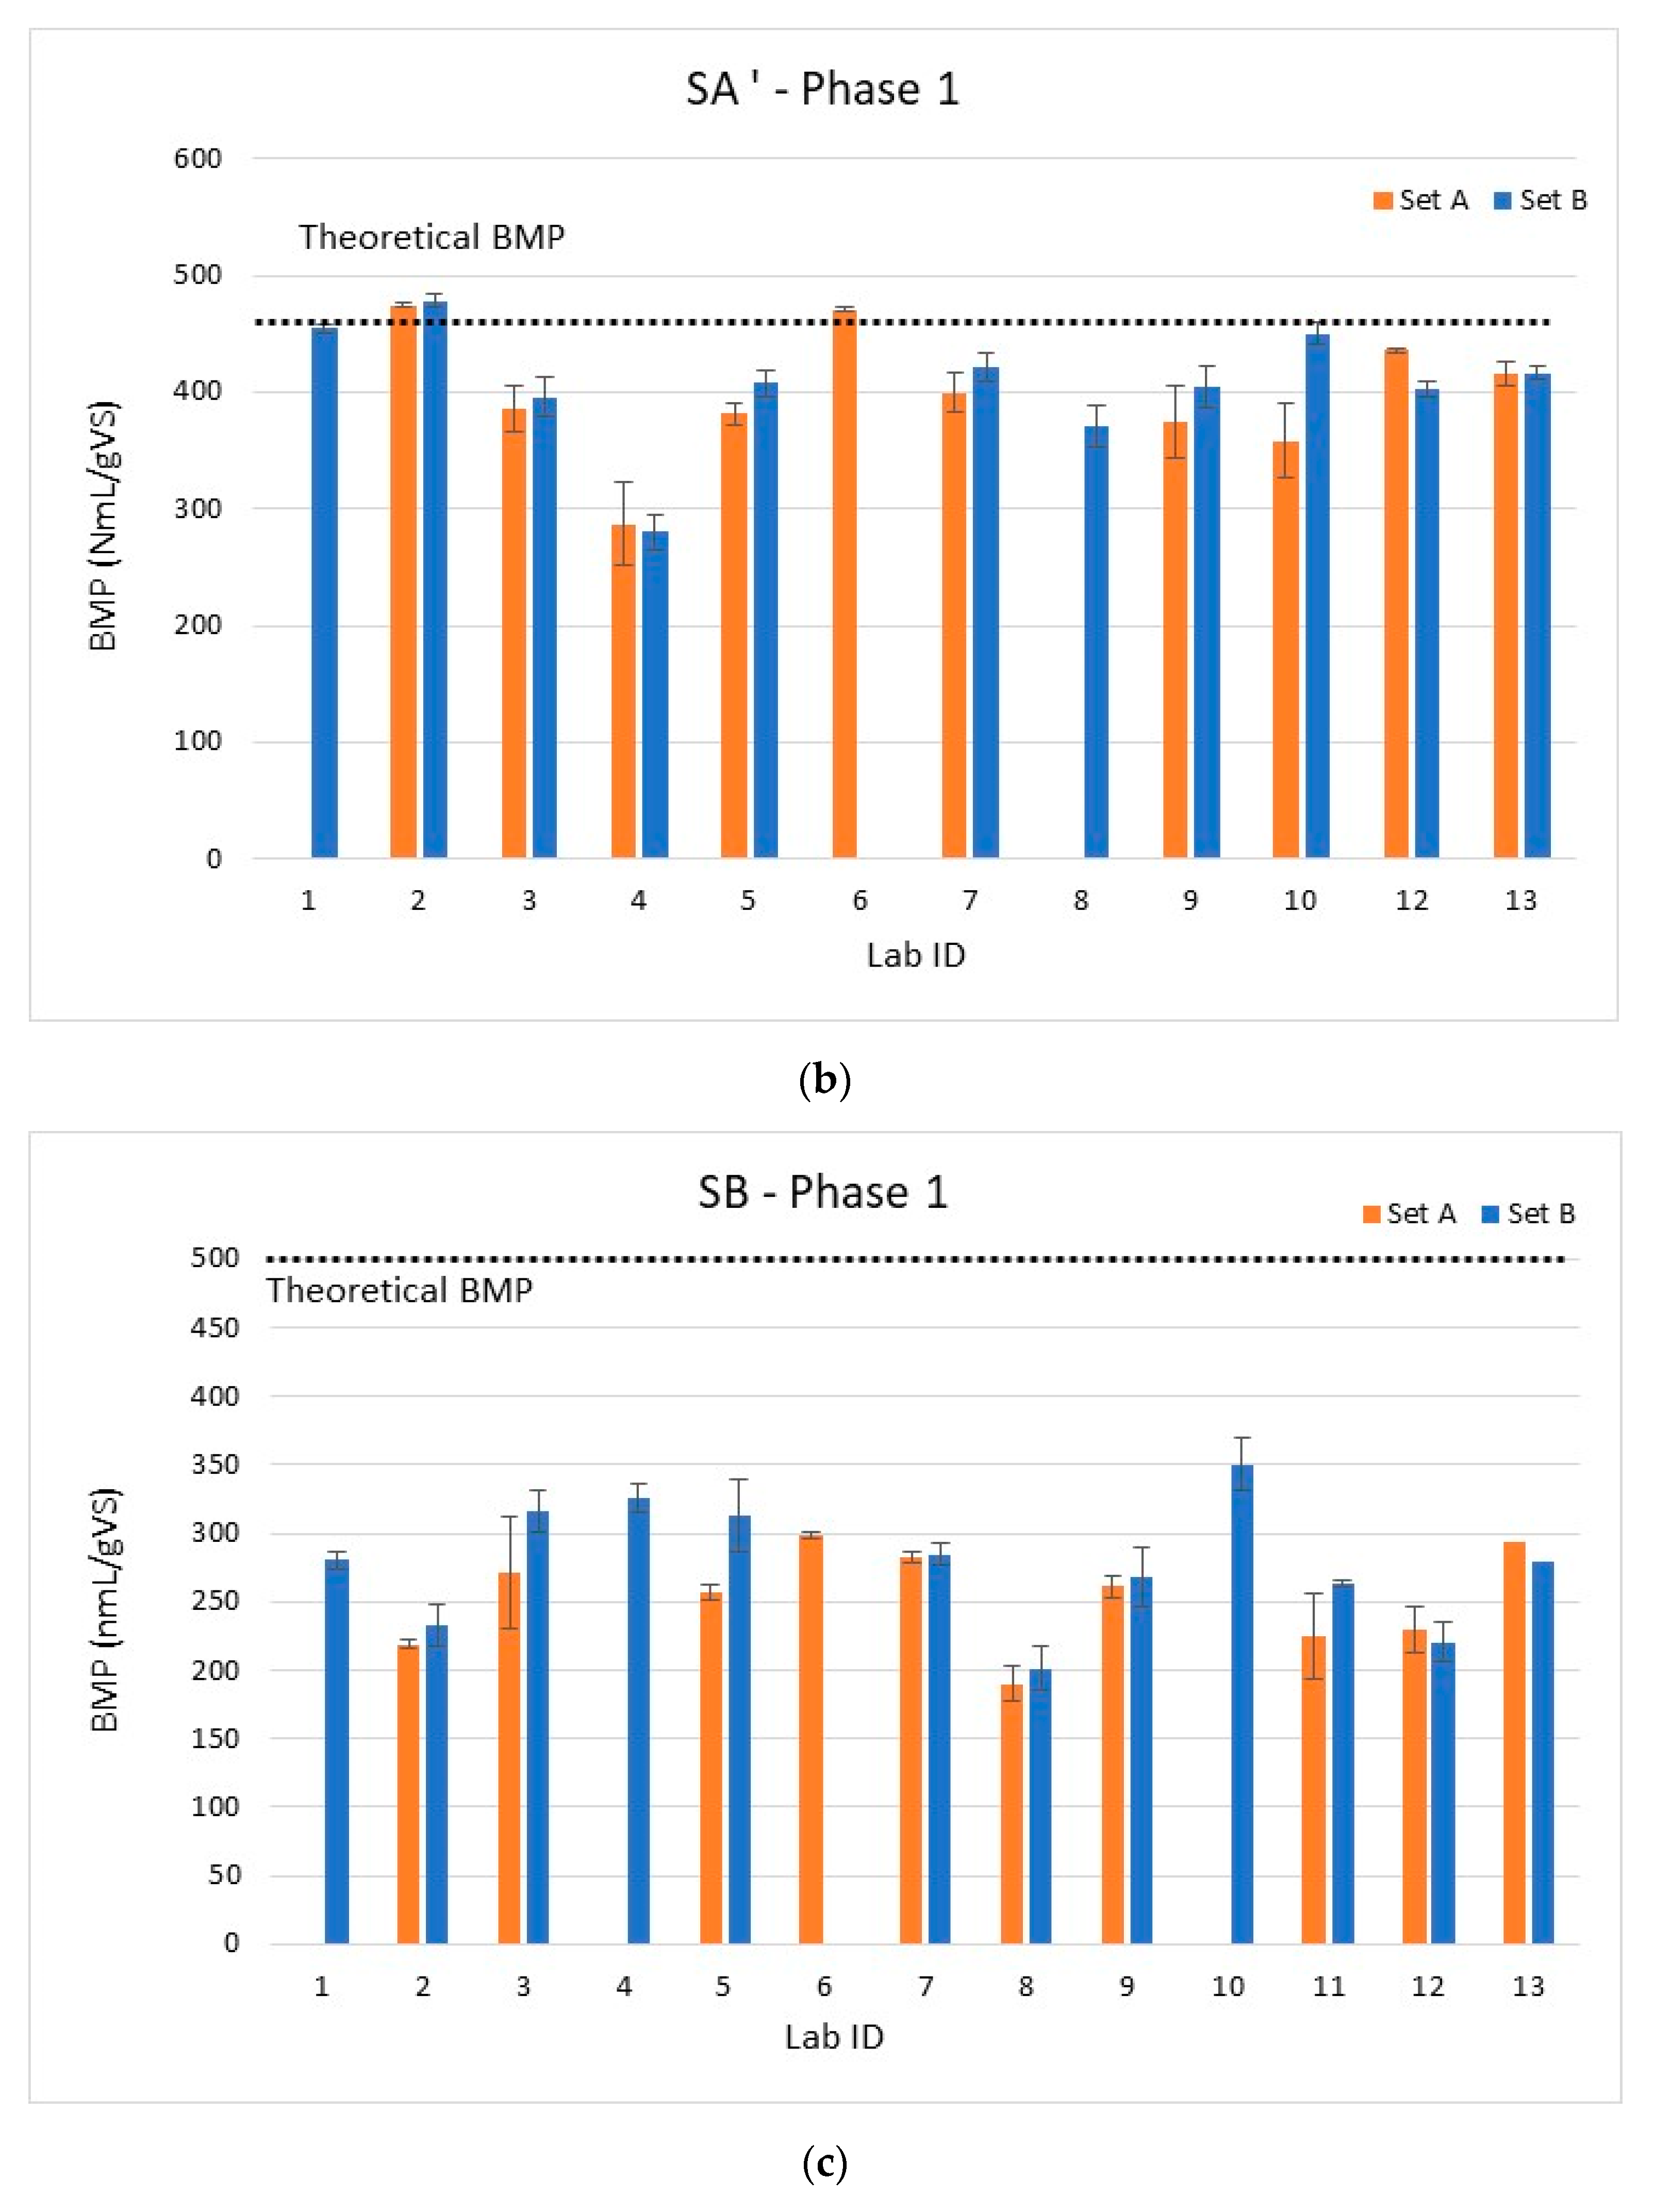
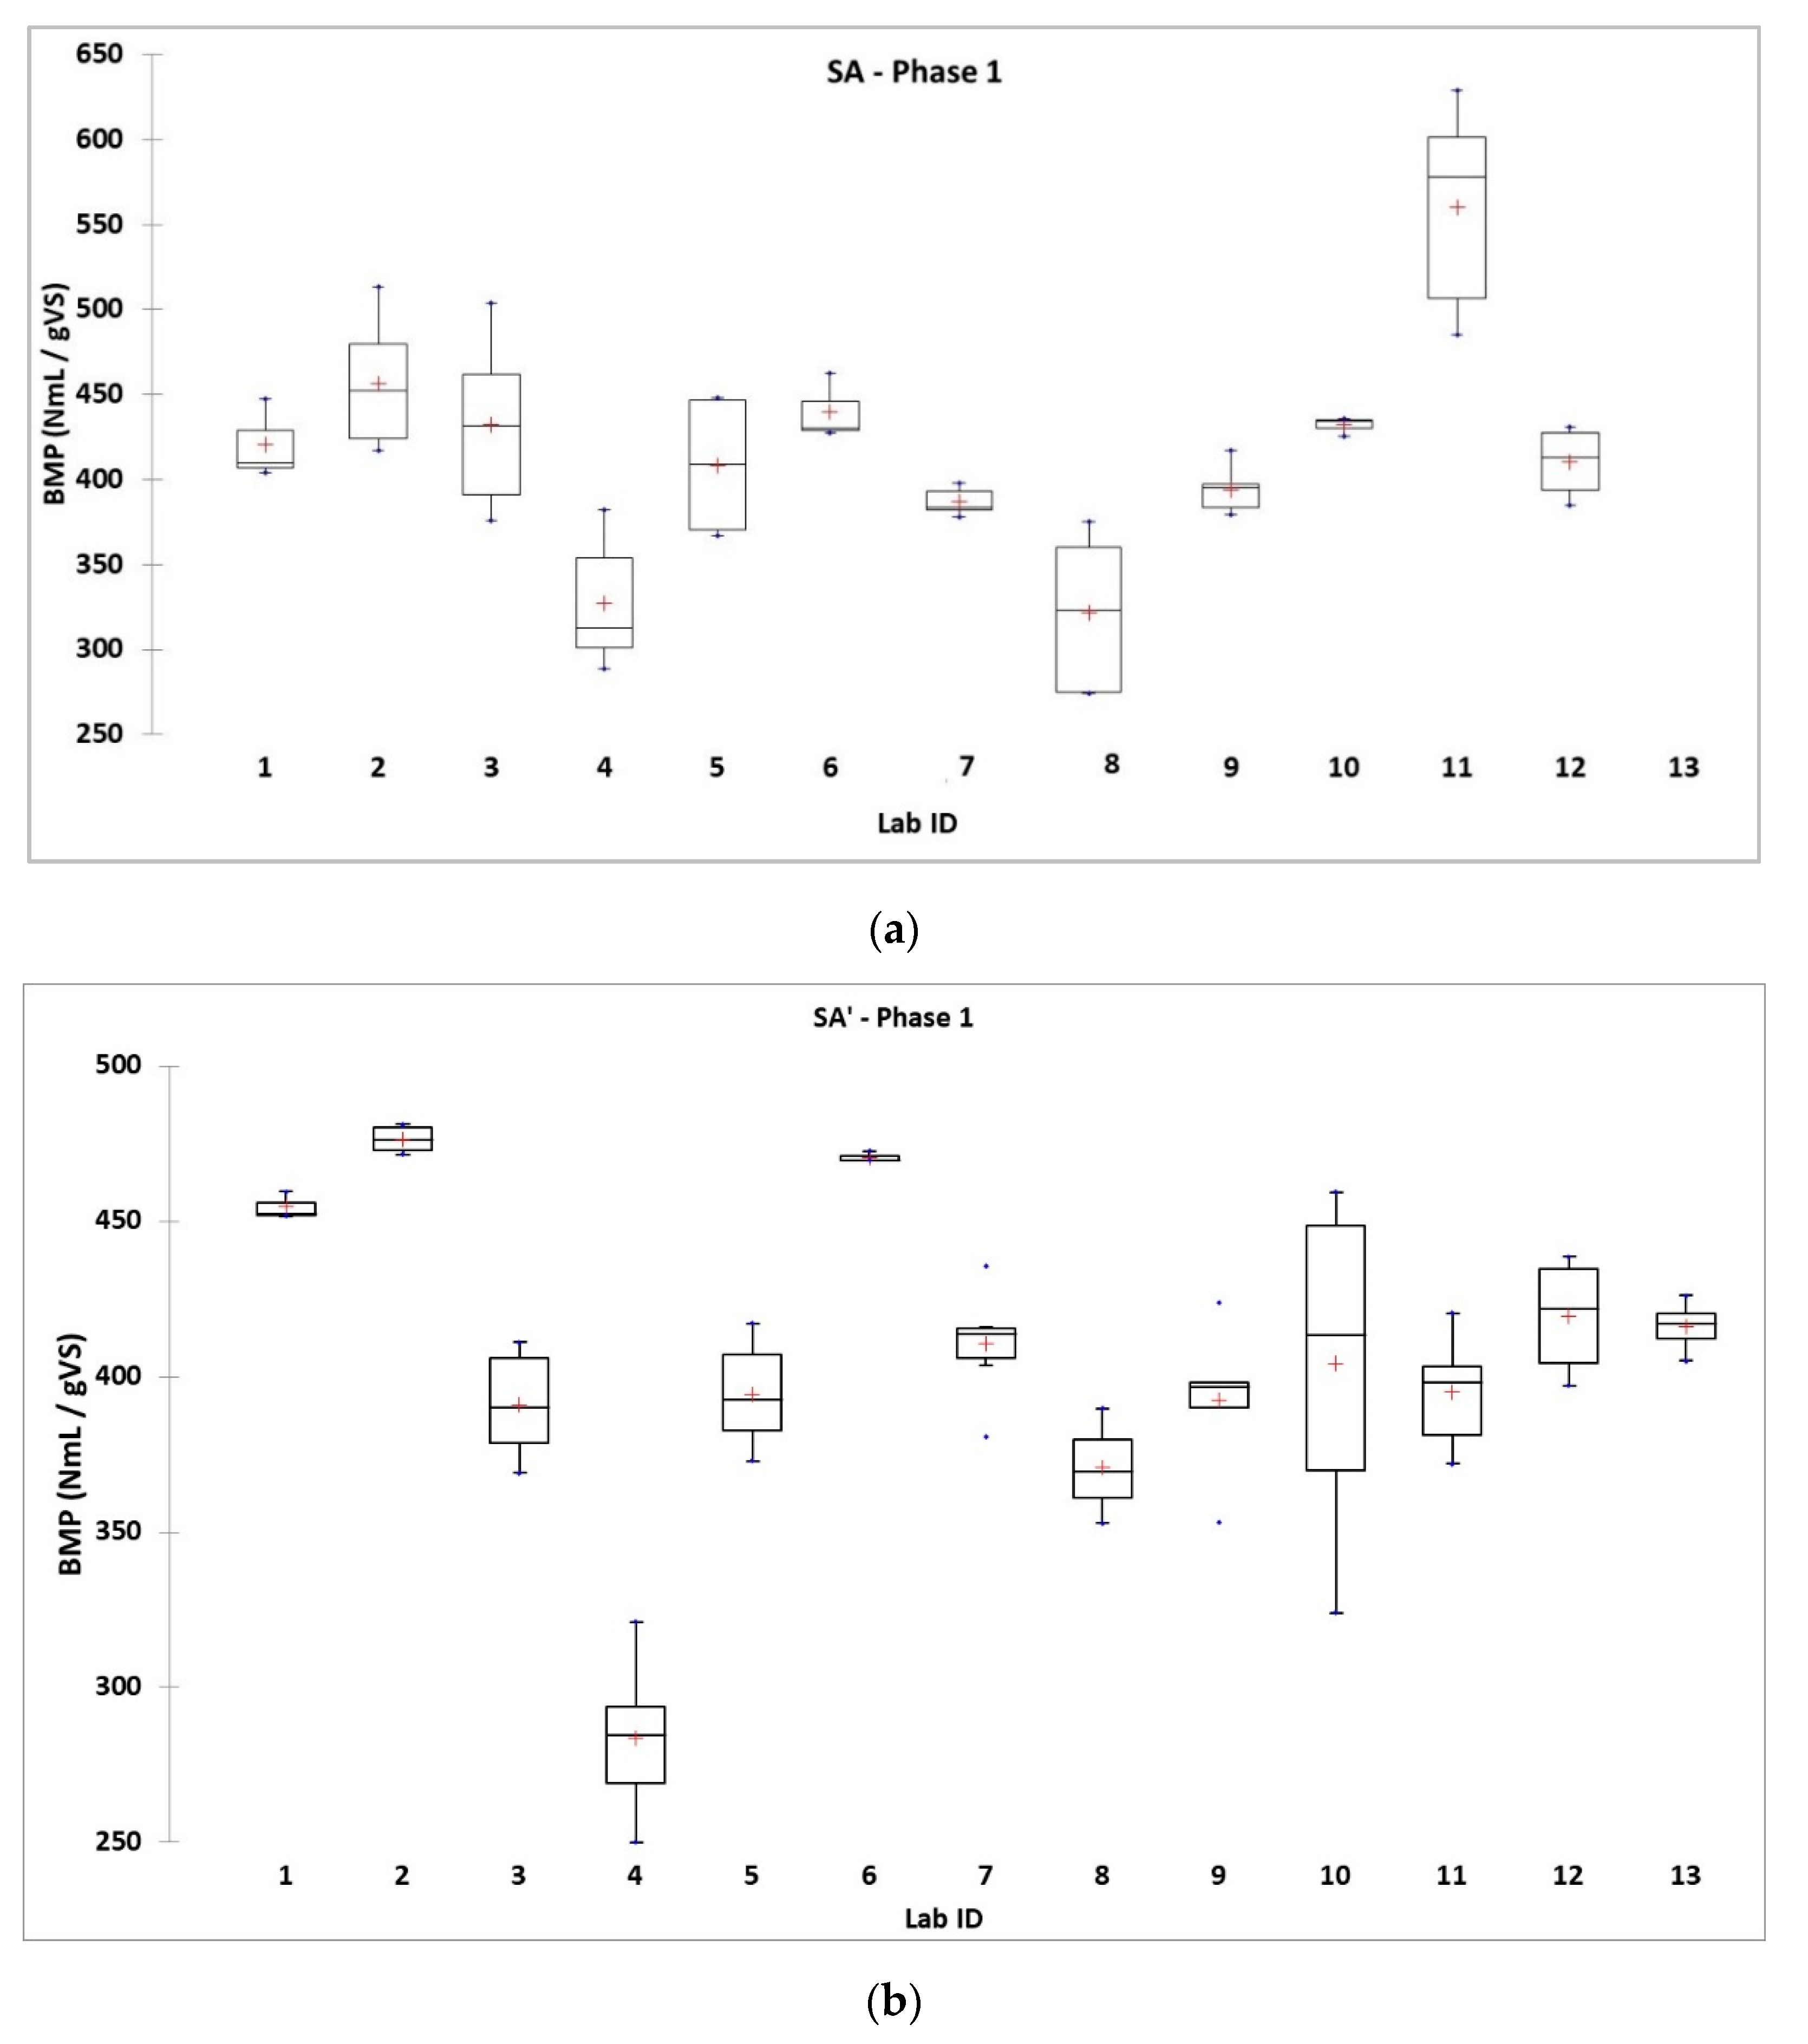
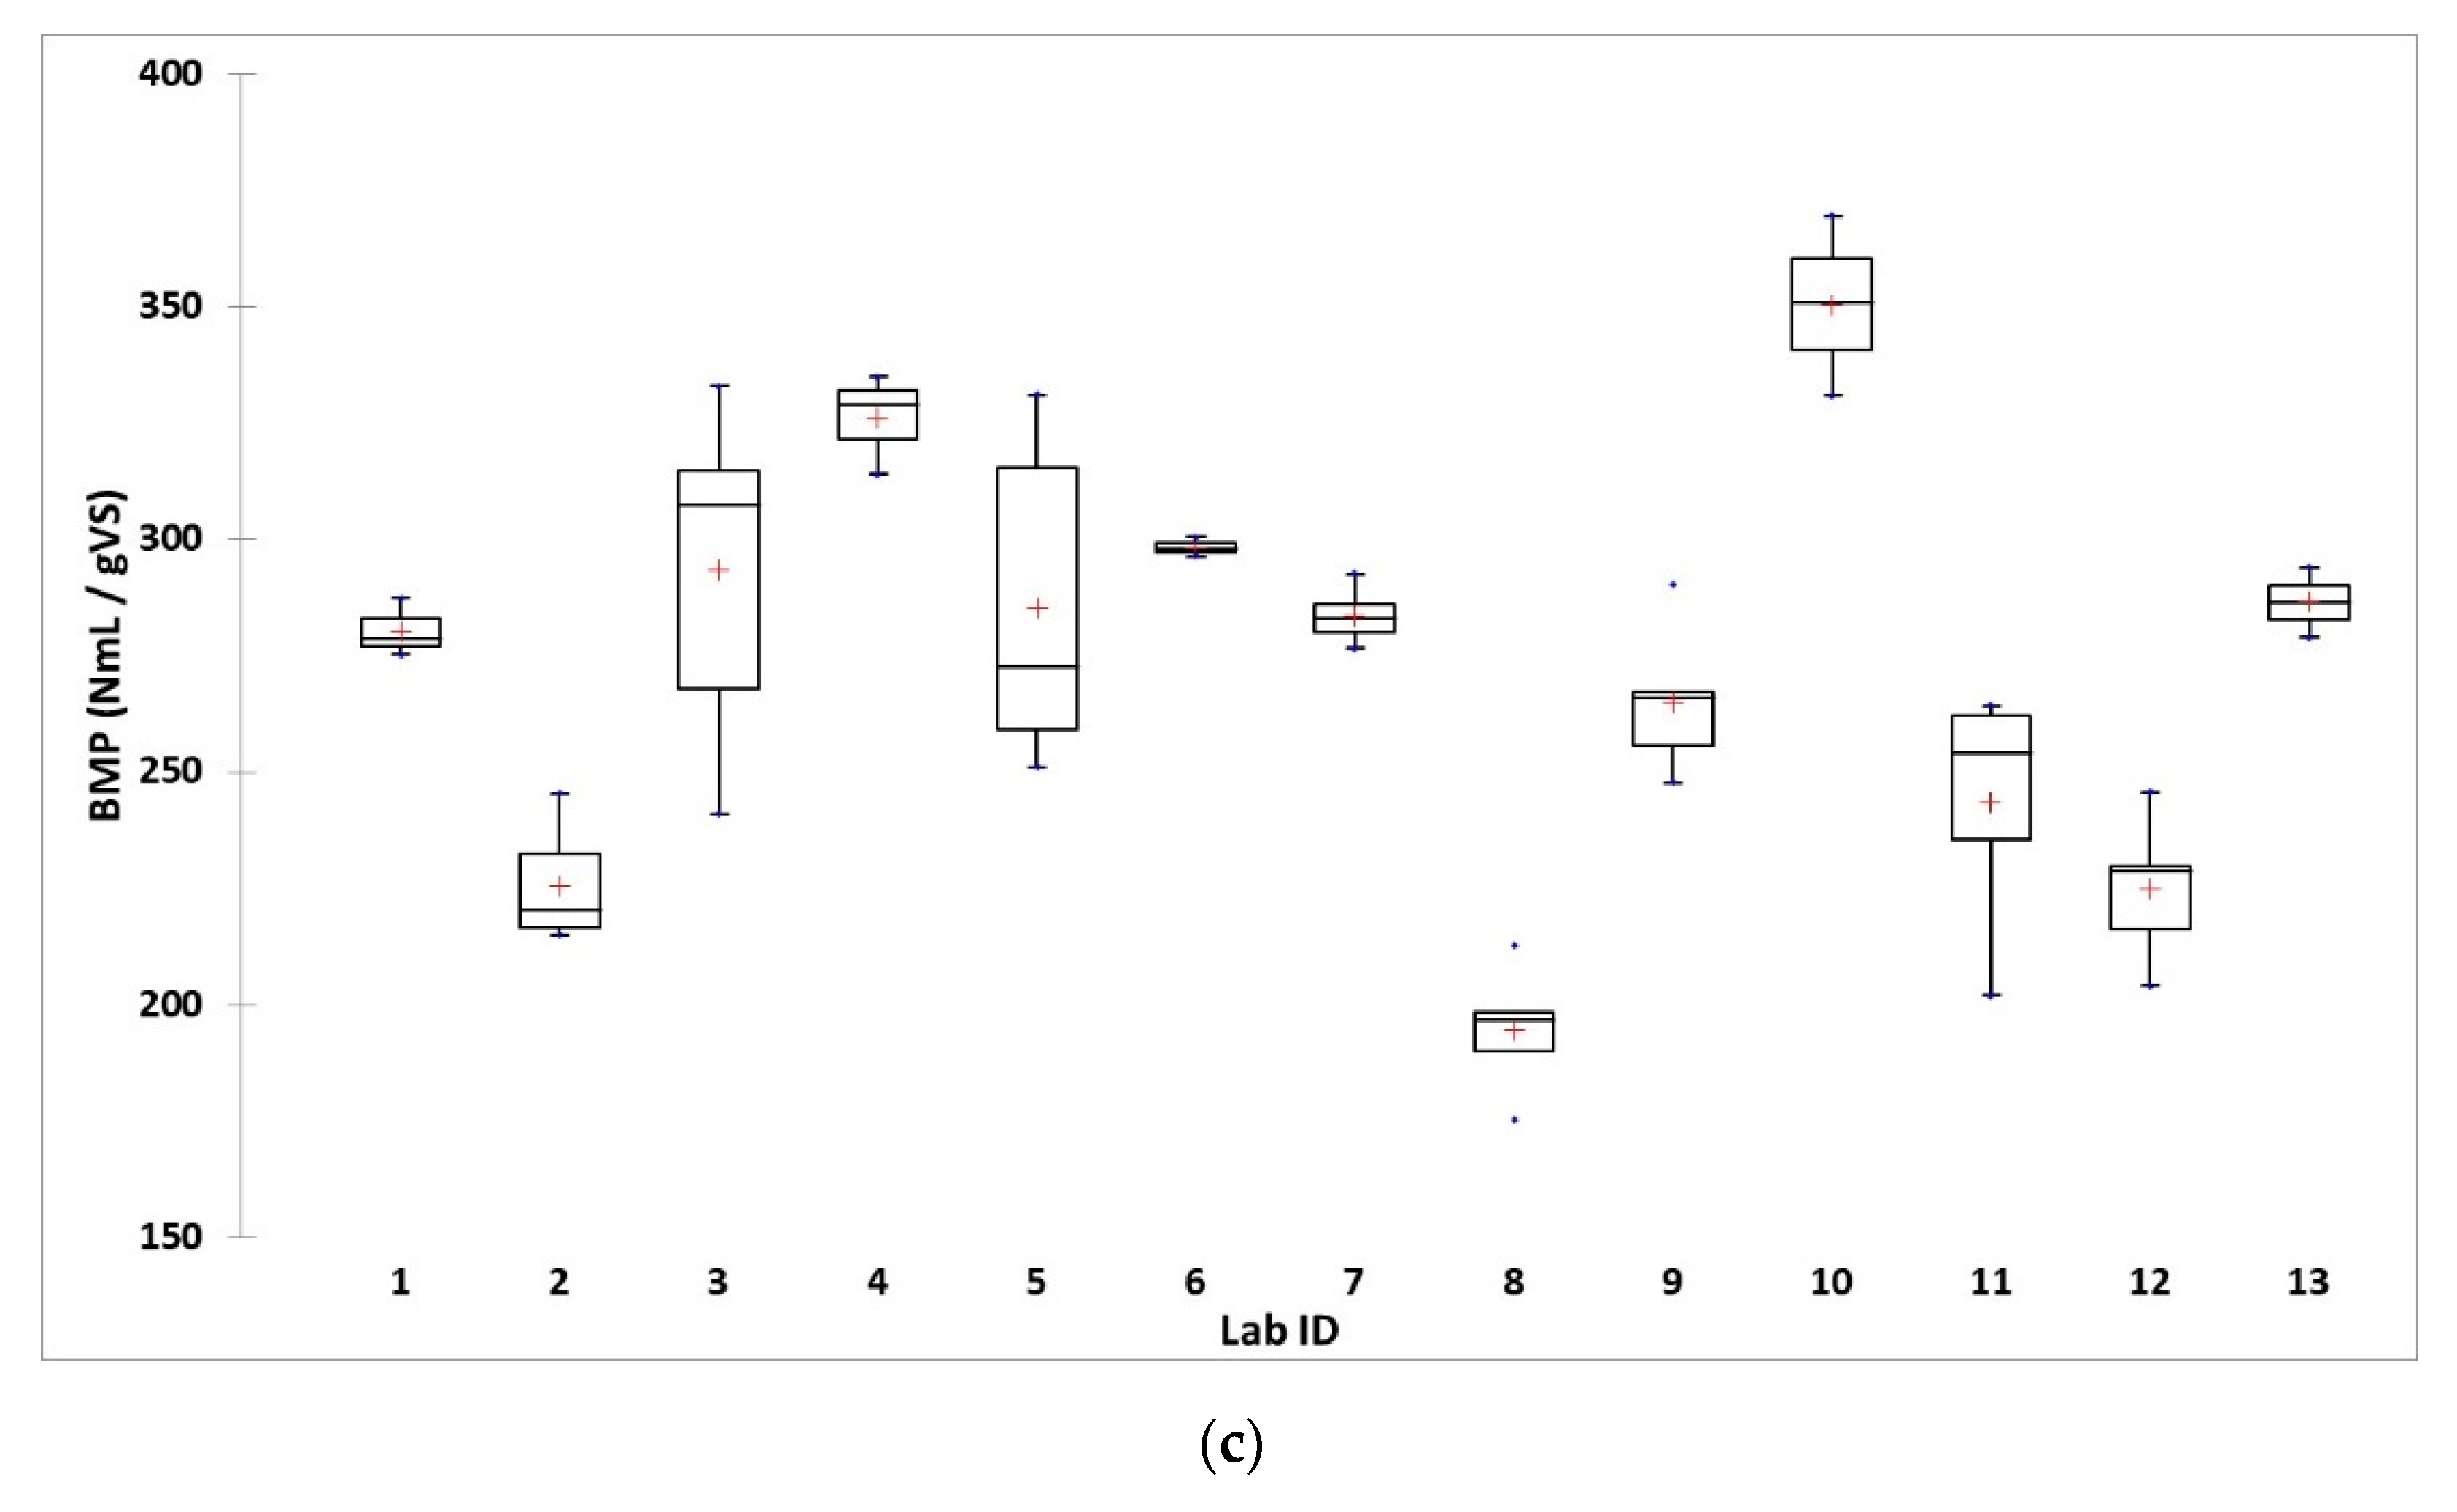
Total Solids (TS) and Volatile Solids (VS) contents of the solid and the liquid substrates, and inoculum, were determined by drying at 105 °C for 24 h and 550 °C for 2 h, respectively, and respecting APHA 2540-G [56]. The analyses were carried out in triplicate by all the labs for all substrates.

3. Results

3.1. Substrate Characterization

The characterization of the substrates SA, SA’, SB and SC carried out by each lab was summarized in Table 5, giving TS and VS contents, showing a good reproducibility of these values for each substrate. For each laboratory, both repeatability among triplicates and reproducibility between two sets of tests were good with standard deviation lower than 3% for all values. The theoretical BMP were also given for all substrates as target values and point of comparison with the experimental BMP values obtained during the inter-laboratory study for the four substrates. These theoretical methane productivities were calculated on the basis of substrate composition, literature data, and formula of Buswell and Müller [57]), completed by Boyle [58]. The calculation of theoretical BMP was detailed in Appendix A (Table A1, Table A2, Table A3 and Table A4).

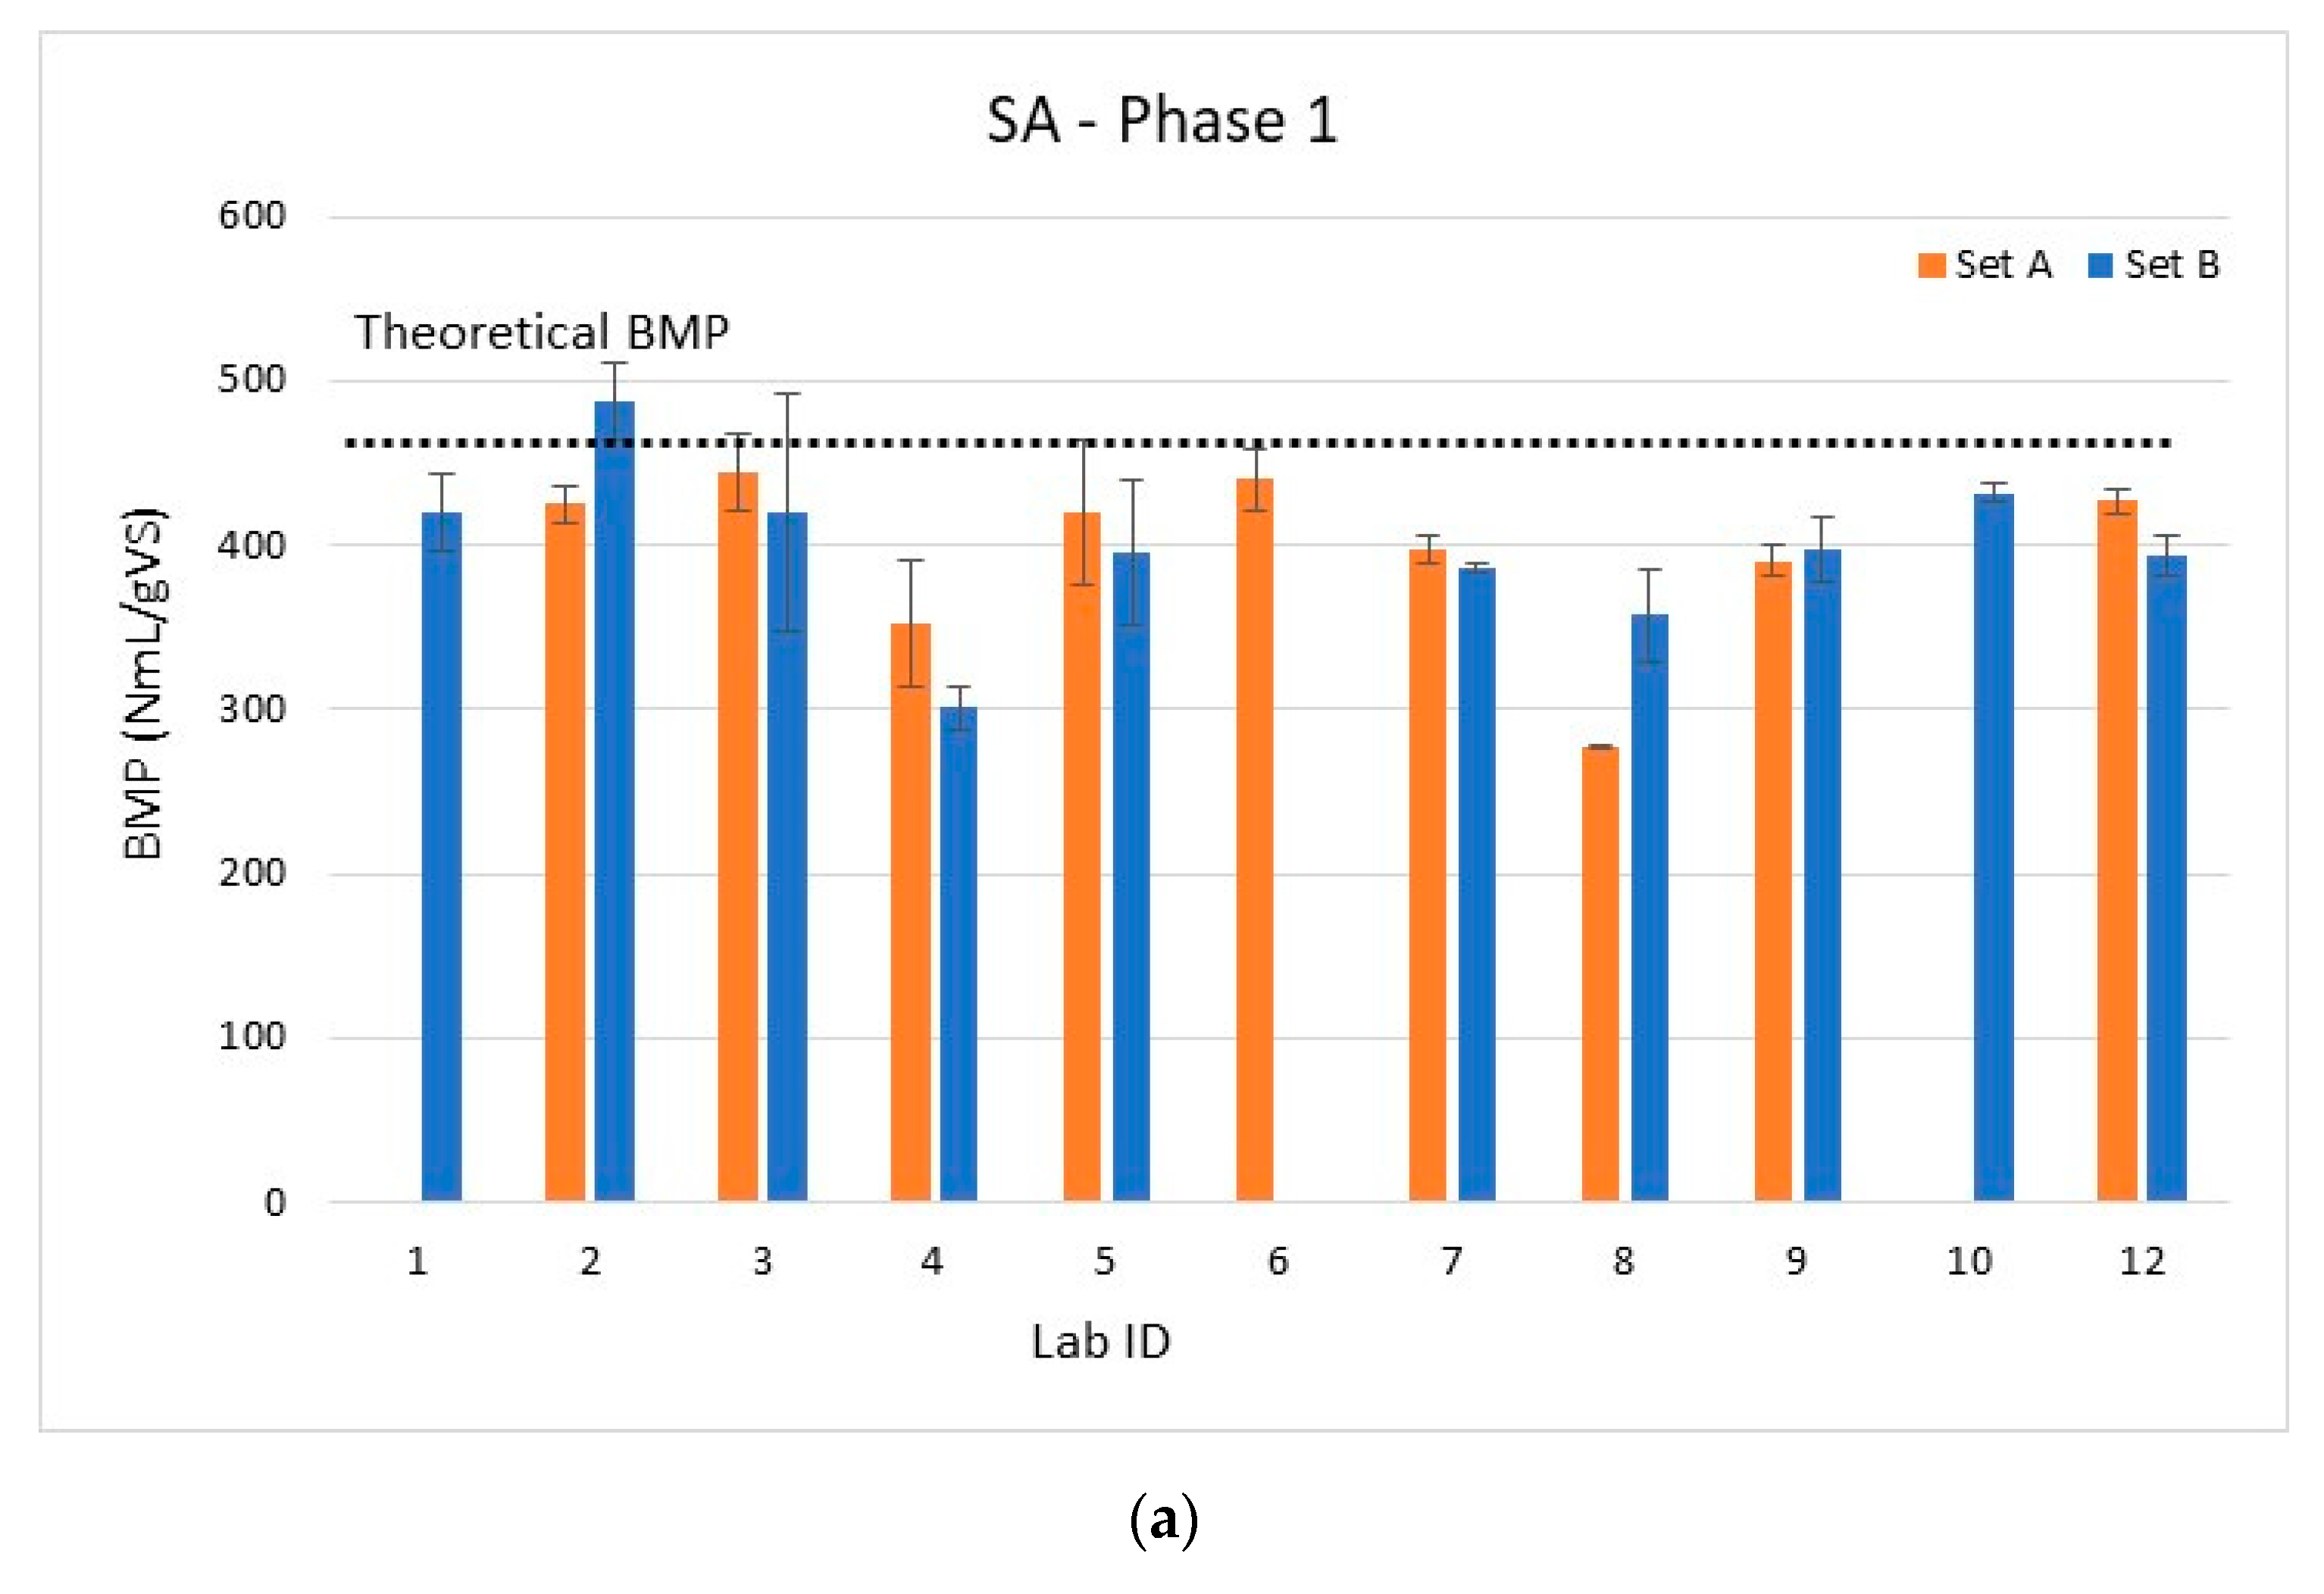
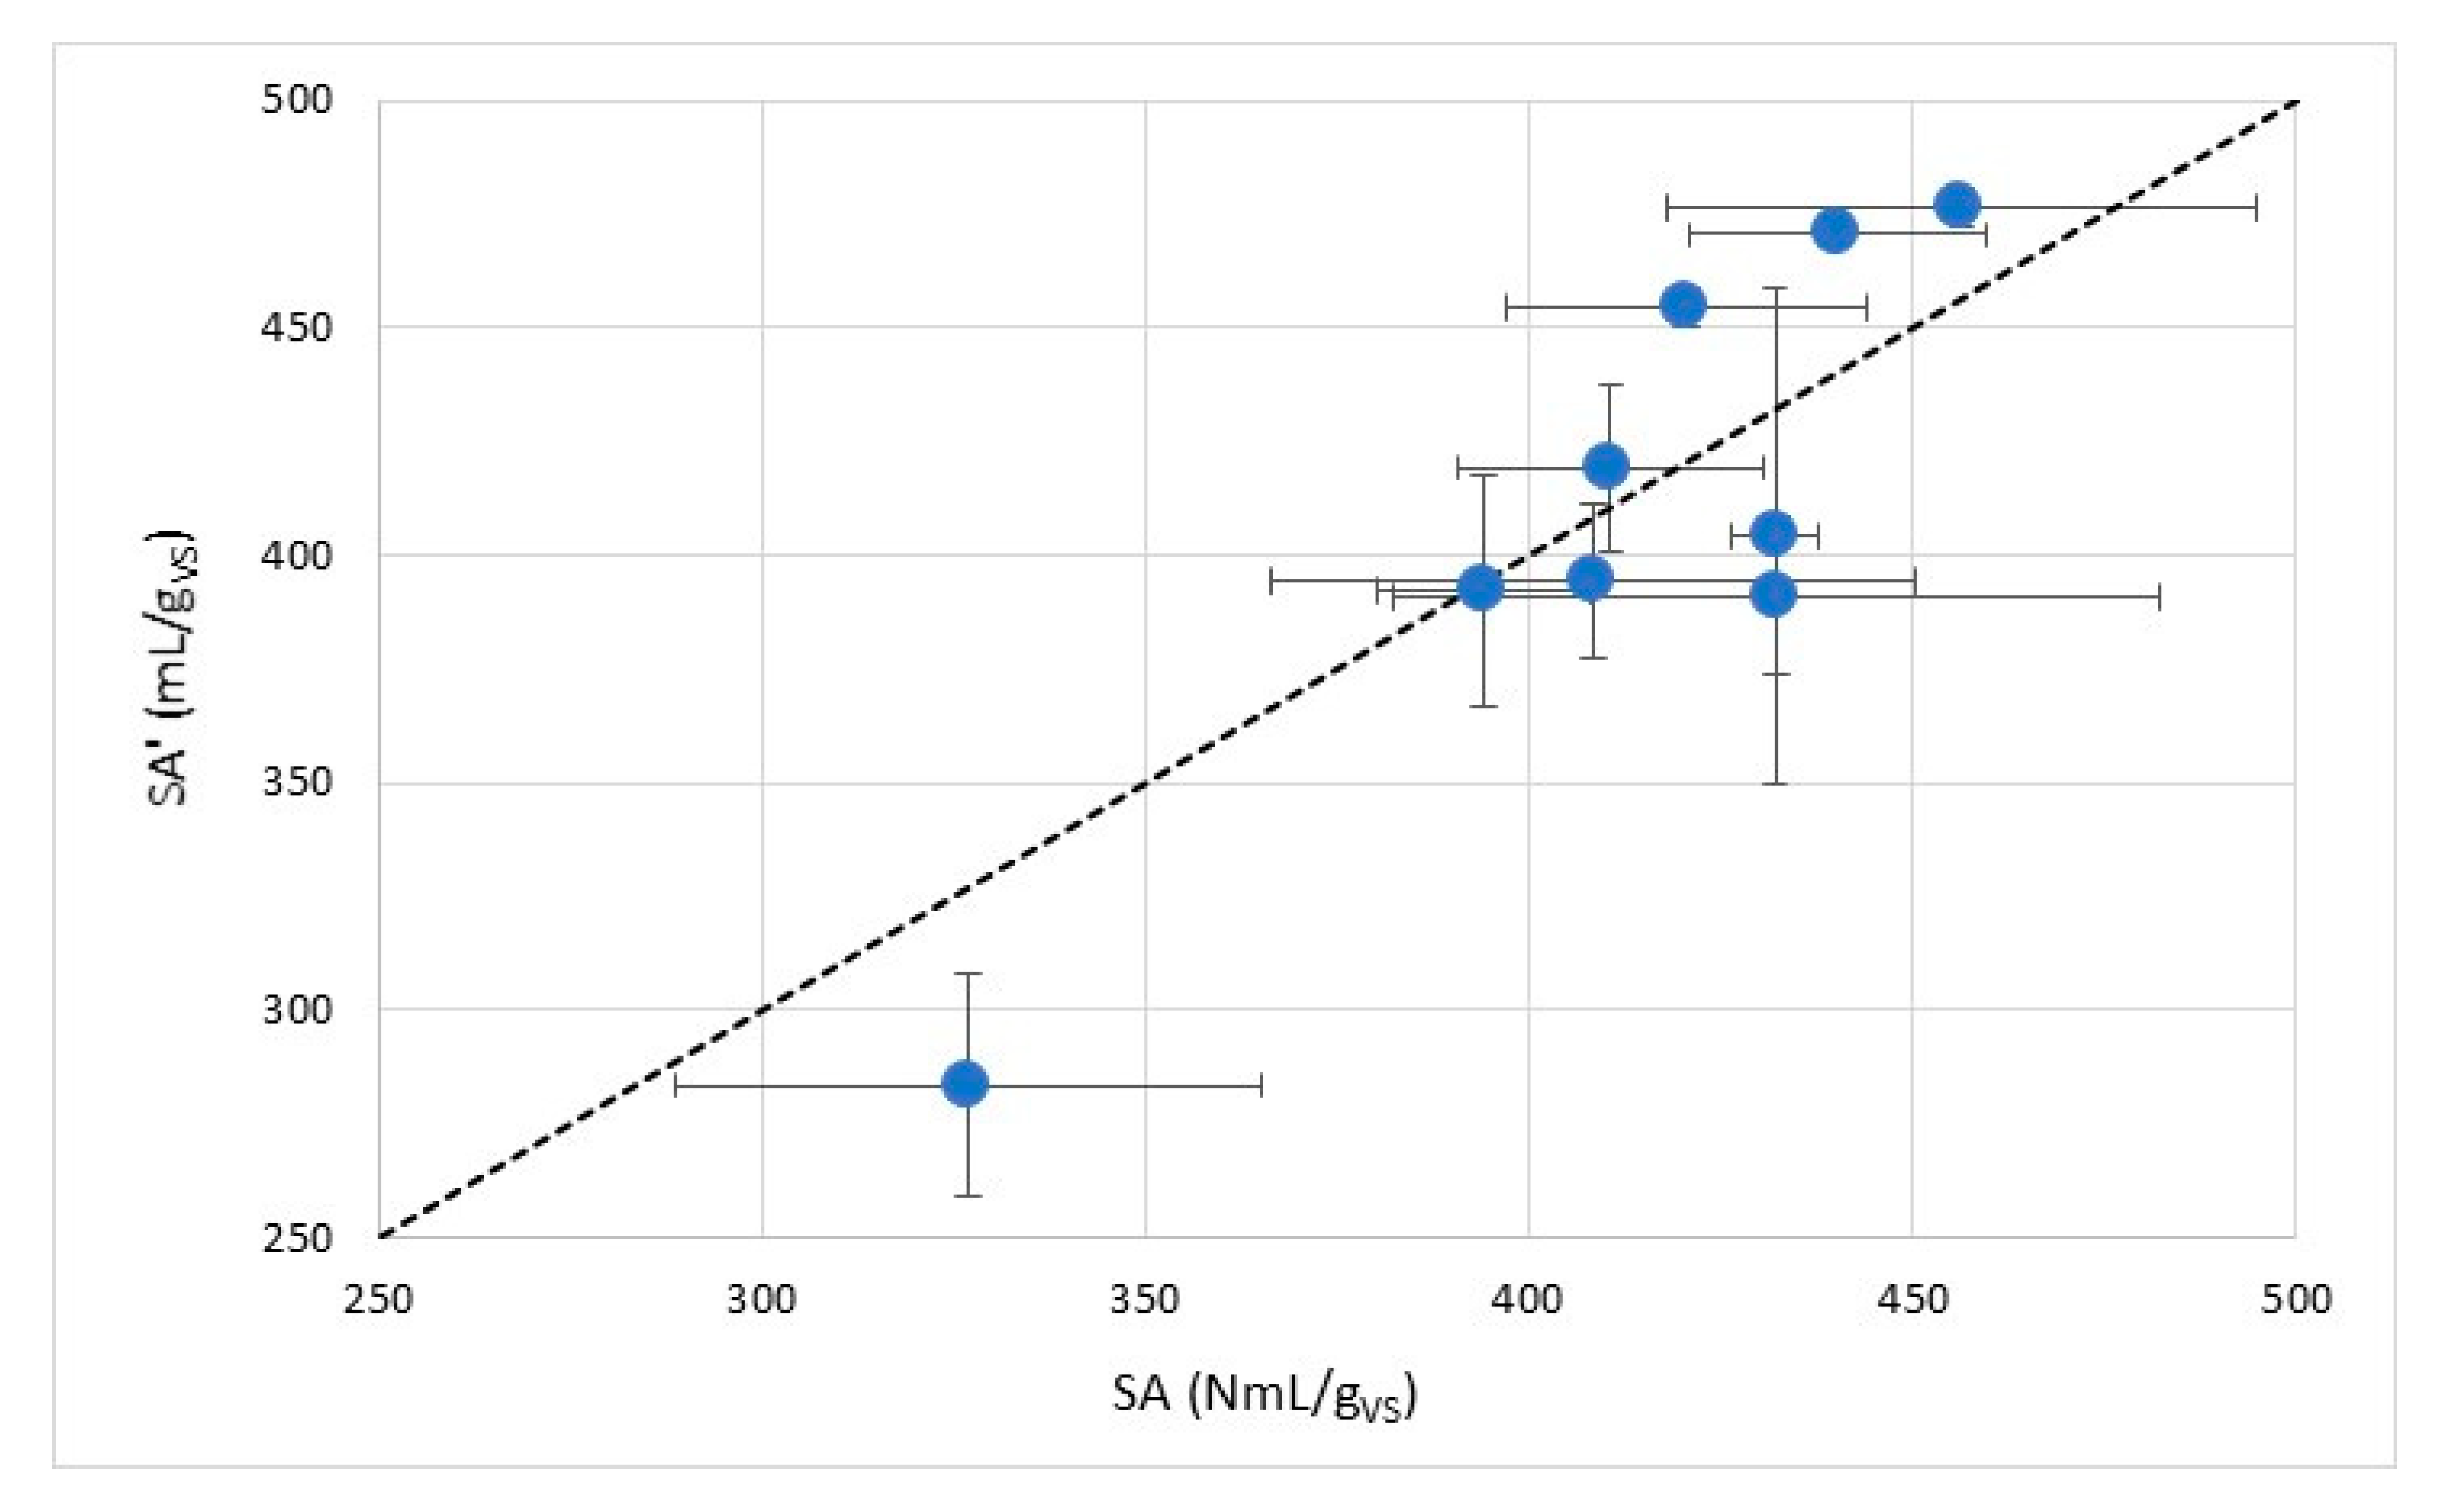
3.2. First Phase (Free Protocols)

The data collected at the end of this inter-laboratory study thus constitute the basis of the first comparative study, of the protocols used by French laboratories for the 235 BMP measurements of solid organic matrices, from a qualitative point of view (nature of the protocols implemented and impact of key parameters of the protocol of the measured value) and quantitative (repeatability and reproducibility of the measurement).
According to the inter-laboratory methodology, all the participating labs sent the Excel file survey concerning its own protocol used for the first phase to the coordinator. An analysis of the eleven Excel file surveys dedicated to the protocol used by each lab was carried out, and the main information about protocol was summarized in Figure 3 showing the repartition between manual and automatic (AMPTS) methods used; the implementation of a drying step; the use of pH buffer, nutrient and mineral solution or not; the choice of I/S ratio for the start-up of the BMP test; the choice of gas quantification and the stirring. The effect of these factors was studied by ANOVA analysis and was detailed below.
The first phase of the inter-laboratory study was carried for seven months. In this phase, two labs decided to carry out the BMP tests with two methods (manual and automatic) providing 13 instead of 11 lab results. In this way, the number of expected values for each substrate was 78 equal to 13 labs multiplied by 3 replicates per substrate (inoculum/blank or positive control substrate) multiplied by 2 sets. The numbers of expected, removed and considered values for the data curation and statistical analysis were summarized in Table 1. For each substrate, some values were removed due to the fact that one replicate or the whole set of replicates was atypical and considered as outliers. In this way, the statistical analysis was carried out only on the considered values. A significant number of outliers had been ruled out (22% for SA, 13% for SA’ and 24% for SB) that explained why some data are missing in Figure 4, for instance set A for substrate SA for lab ID 1.
The intra-laboratory repeatability (lower or equal to 7%) and the intra-laboratory reproducibility averages (lower or equal to 9%) were quite good for both sets A and B carried out during the first phase for SA, SA’ and SB, as shown in Figure 4 and summarized in Table 6. The inter-laboratory reproducibility was quite high with 17–20% for the three substrates, resulting of deviation for the BMP values between 289–629 NmLCH4/gVS for SA, 250–481 NmLCH4/gVS for SA’ and 175–370 NmLCH4/gVS for SB.
The experimental BMP values obtained for all the sets of the three substrates were lower than the theoretical BMP calculated and plotted in the Figure 4a–c. The experimental BMP averages reached were, respectively, 89.3%, 84.6% and 55.3% of the theoretical BMP calculated for for SA, SA’ and SB. For substrate SB (straw), this low value of BMP could be explained by the recalcitrance of polymers degradation such cellulose, hemicellulose and lignin due to the 3D-lignocellulosic structure preventing accessibility of enzymes. Another hypothesis could be an uncompleted biodegradation maybe due to the fact that the inocula used for the BMP test were not acclimatized and adapted for lignocellulosic substrate. One solution allowing to avoid this problem could be the acclimation of inoculum and to carry out successive batchs as described in Kouas et al. [59]. Indeed, the use of a single batch for the determination of BMP and estimation of degradation kinetics on solid substrates led to underestimations [60].
Nevertheless, the inter-laboratory reproducibility was quite poor, with an RSD around 20% whatever the substrate. ANOVA analysis did not show clear influence of the identified protocol factors, except for the mineral medium implementation which was found to raise the BMP value. For other factors like the assessment method (manual/automated), the I/S ratio and the buffer addition, the influence of the BMP value was found to be substrate-dependent. The solid substrate preparation before BMP assessment (fresh or freeze-dried) had no significant effect on the results.
Boxplots (box-and-whisker plots) were used for graphical comparisons as a typical graphical representation for results of such inter-laboratory study [46]. In all boxplots, the red cross shows the average, the black line shows the median, the box shows 25th and 75th percentiles, vertical lines (whiskers) show the range, and the lower and upper points (blue crosses) show respectively the minimum and the maximum and are plotted as points. To facilitate comparisons, extreme values were adjusted to the following limits: SA, 250–650; SA’, 250–500; SB, 150–400 NmLCH4 gVS−1 (Figure 5).
The dispersion of the obtained BMP values was synthetized in Table 6. For each laboratory, both repeatability among triplicates and reproducibility between two sets of tests were considered as acceptable and were, respectively, 4–7% and 6–9%.
The calculated repeatability and reproducibility standard deviations were of the same order of magnitude for the three substrates, slightly smaller for SA’ (non-harmonized substrate preparation and raw vs. dry introduction). This constitutes the error made on the standard BMP test in France before harmonization of the measurement protocol.
ANOVA analysis with two factors (lab, substrate) and with interaction for SA/SA’ was carried out with a sample size of 103 (50 for SA vs 53 for SA’). The ANOVA analysis provided a p-value equal to 0.563 for the factor Substrate showing no significance with a p-value upper than 0.005 and no difference between the two substrates SA and SA’. The effect of the factor Substrate SA vs SA’ was only due to one lab (p-value of 0.563 instead of 0.003 if the considered lab was removed or included in the ANOVA analysis) and if this lab was removed when carrying out the ANOVA analysis, no significant effect was observed between the substrates SA and SA’.
There was no significant difference between the averages for SA and SA’, as shown in Figure 6, reflecting there was no impact whatever the considered lab on the shredding steps and no impact with the fact to use the substrate as raw or dried (no impact of drying steps). There was also no significant effect of continuous mixing (data not shown).
The effects of parameters vs. factors of the measurement protocol on the BMP value were highly dependent on the considered substrate. The typology of the measurement protocols showed very little correlation with the classification of the different labs regarding their BMP values. The sole parameter showing a low effect, higher BMP values (about 9% for the three substrates with limited p-values), was the use or not of the mineral nutrient solution, more than the use of a buffer solution. The values were respectively given for with vs without mineral nutrient solution for SA, SA’ and SB: 414 vs 445 (p-value = 0.011), 389 vs 421 (p-value = 0.008) and 257 vs 281 NmL gVS−1 (p-value = 0.005).
The analysis of these results, with regard to the different experimental practices implemented and the expertise provided by each of the partner laboratories led to the development of a common protocol, accompanied by recommendations, intended to be widely distributed and used. This common protocol was applied and tested during a second experimental phase, where the substrates of solid organic substrates (SA’, SB, SC) were analyzed according to the methodological framework set.

3.3. Second Phase: Harmonized Protocol

3.3.1. Harmonization of the BMP Protocol

Based on the results obtained, curated and discussed by all the participants after the first phase of the inter-laboratory study, the main objective of this second phase was obviously to propose a harmonized protocol, to test it and to validate the criteria defined in the common rules and finally in order to reduce drastically the inter-laboratory reproducibility (around 20%).
After the first phase, discussions between the participants led to the proposal of a harmonized protocol with unified practices for the following factors: I/S ratio, pH buffer and mineral complementation (as described in the Materials and methods section). The subsequent second phase of the study was carried for eight months on substrates SA’ and SB (both same as for the first phase), as well as on a new lipidic substrate (SC).
The harmonization of the protocol was collectively discussed between all the participants, and all the criteria were discussed in depth and have been a subject of debate during these meetings. This step led to the choice of the following criteria as imposed conditions for the BMP tests:
  • BMP protocol
    • Systematic addition (20 mL in the cultivation medium) of a mineral nutritive solution;
    • Systematic use of carbonate buffer (3 g/L NaHCO3 added in the cultivation medium);
    • Fixed I/S Ratio equal to two (except for highly biodegradable substrates where the I/S ratio could be equal to 5 gVS/gVS);
    • Implementation of one blank and one positive control substrate both in triplicate, as described before in Material and Methods section, carried out in the same conditions as the substrates.
  • Validation criteria
    • The validation criteria were also defined according to the targeted consensus obtained among all participants. To validate the BMP test, all these following four criteria had to be reached together:
      • The repeatability of triplicates (RSD < 10%);
      • The final pH value had to be higher than 6.5;
      • The maximal methanogenic activity measured on the positive control during the test must be higher or equal to 35 NmLCH4 gVS−1 day−1, and the value of its methanogenic potential must be defined between 90 to (and) 100% of the stoichiometric methanogenic potential of acetate, i.e., 0.373 NLCH4 per gram of acetate;
      • The methane part due to the endogenic activity would not exceed one-third of the whole methane production of the assay.
    • If one of these criteria was not fulfilled, the test was considered as invalid.
  • End of the BMP criteria
    • The measurement was considered as over when the increase of the methanogenic potential did not excess 1% per day.

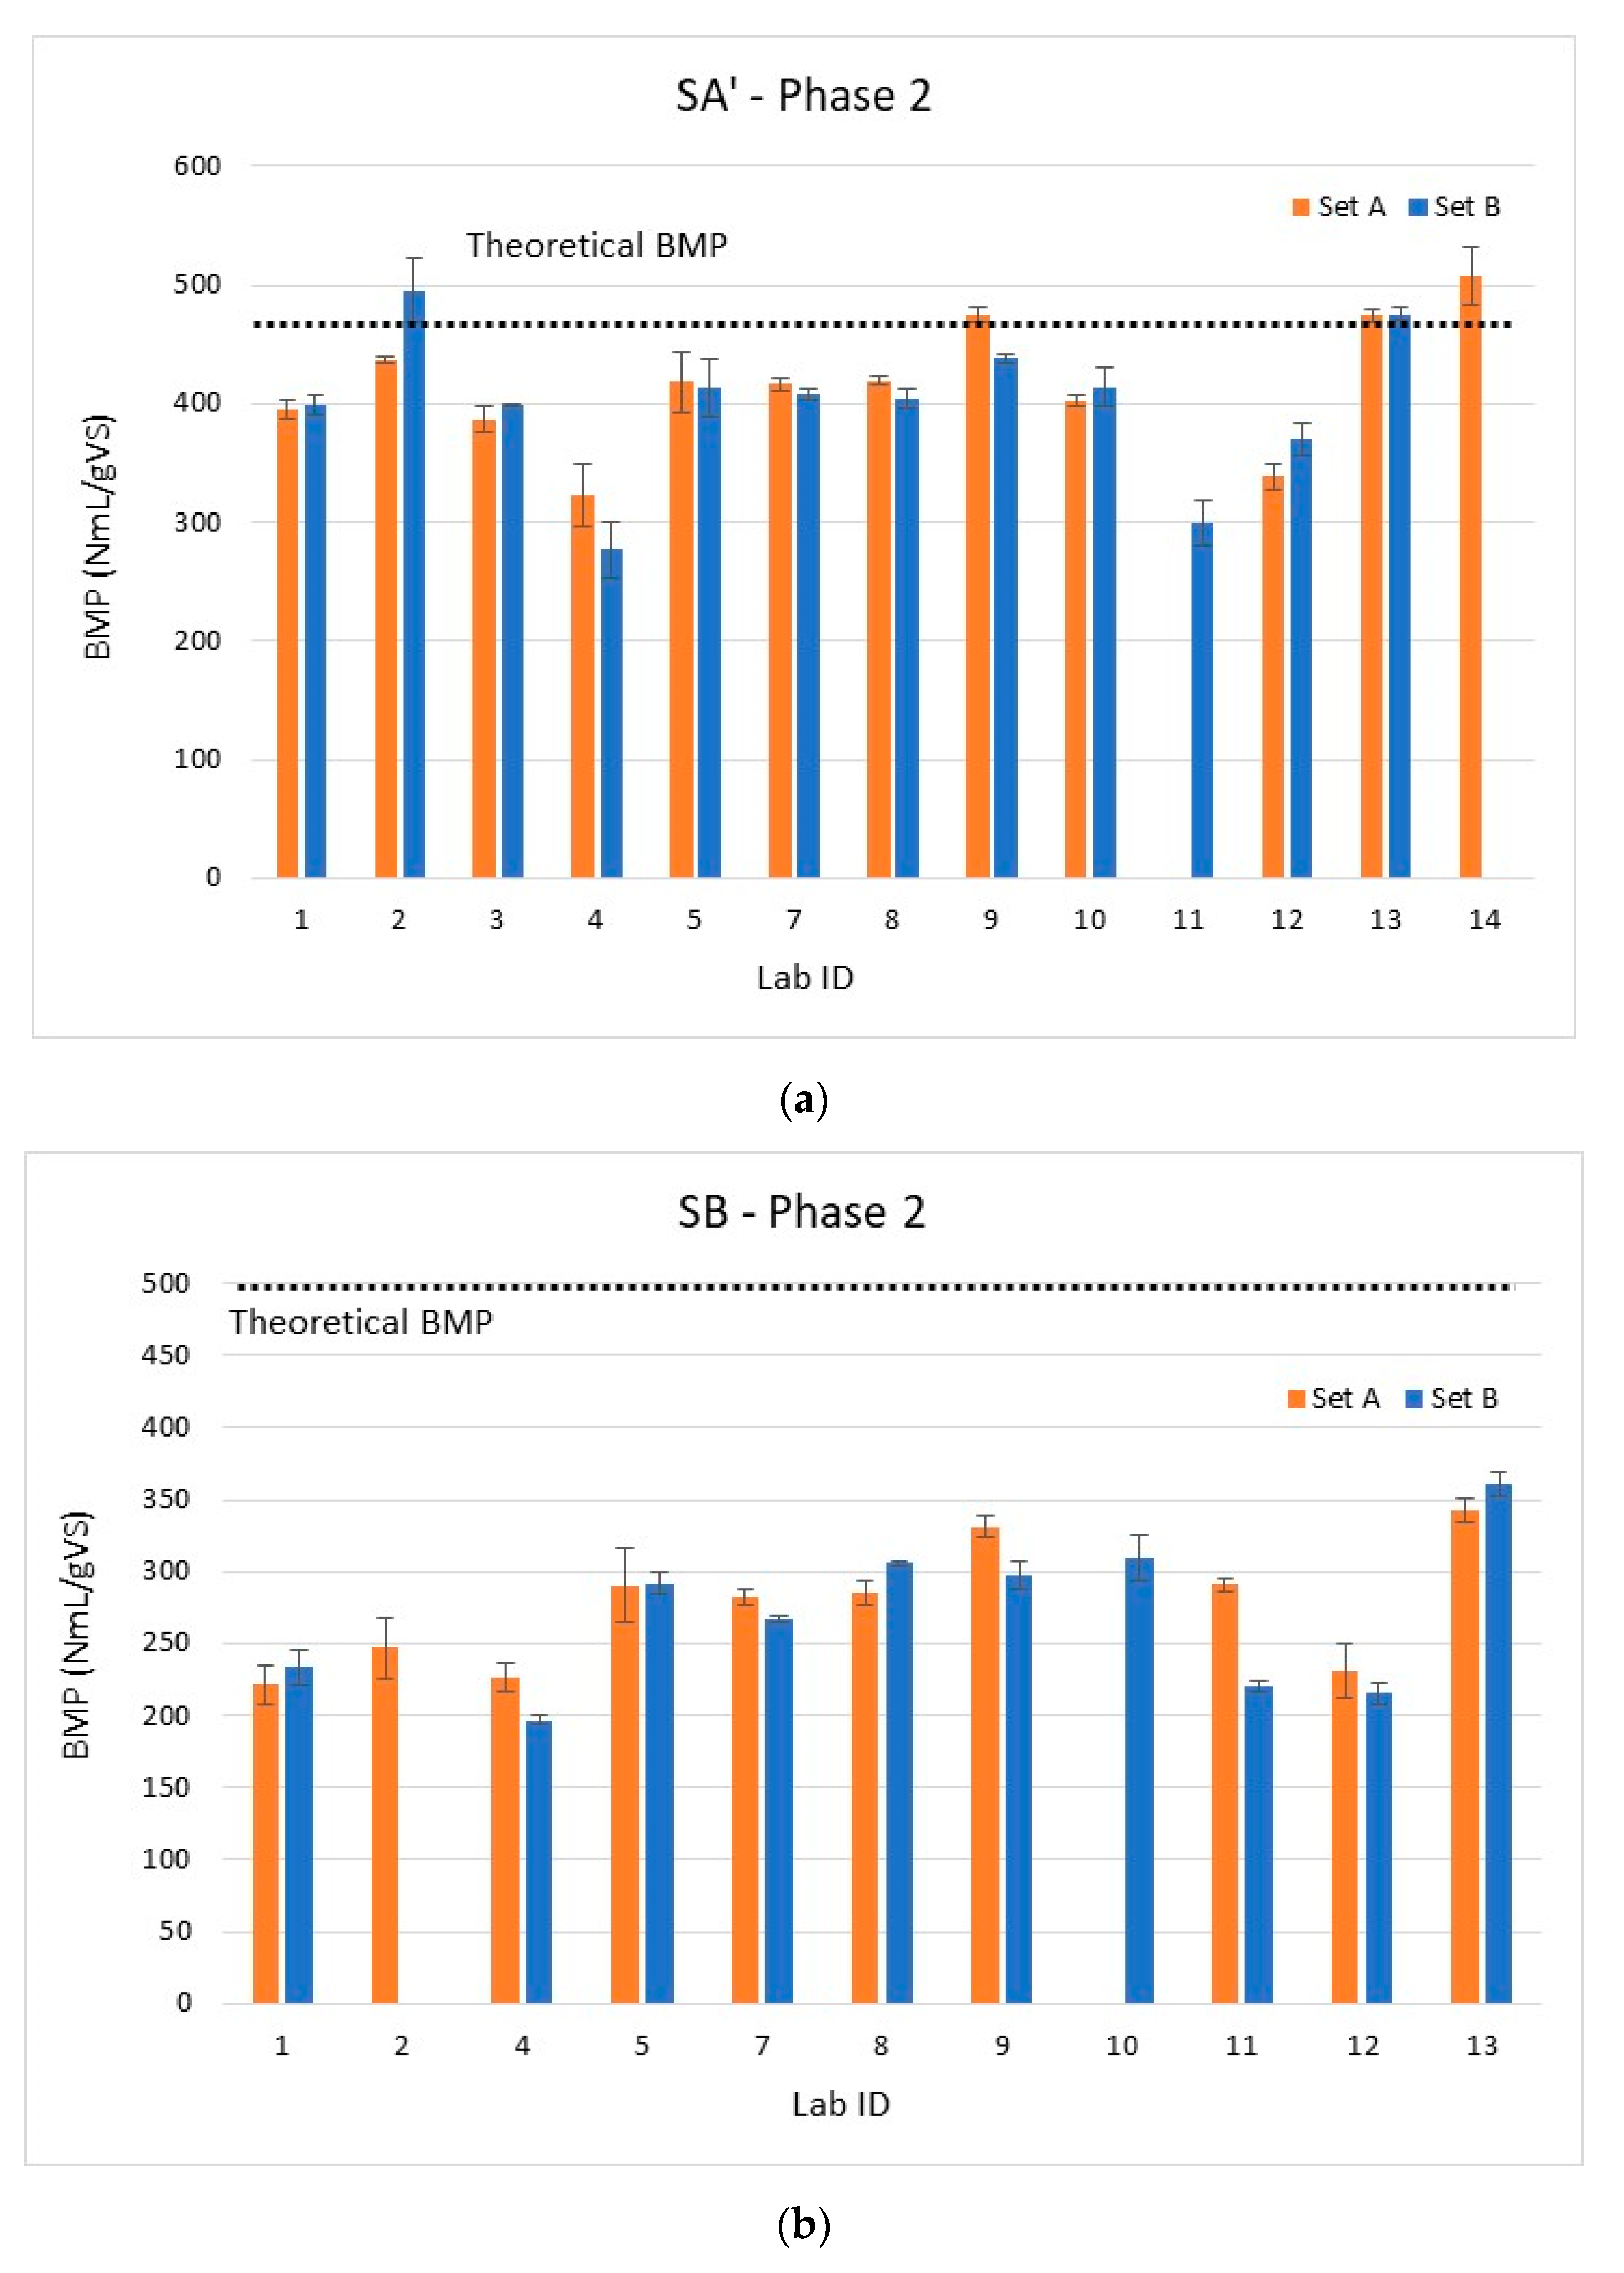
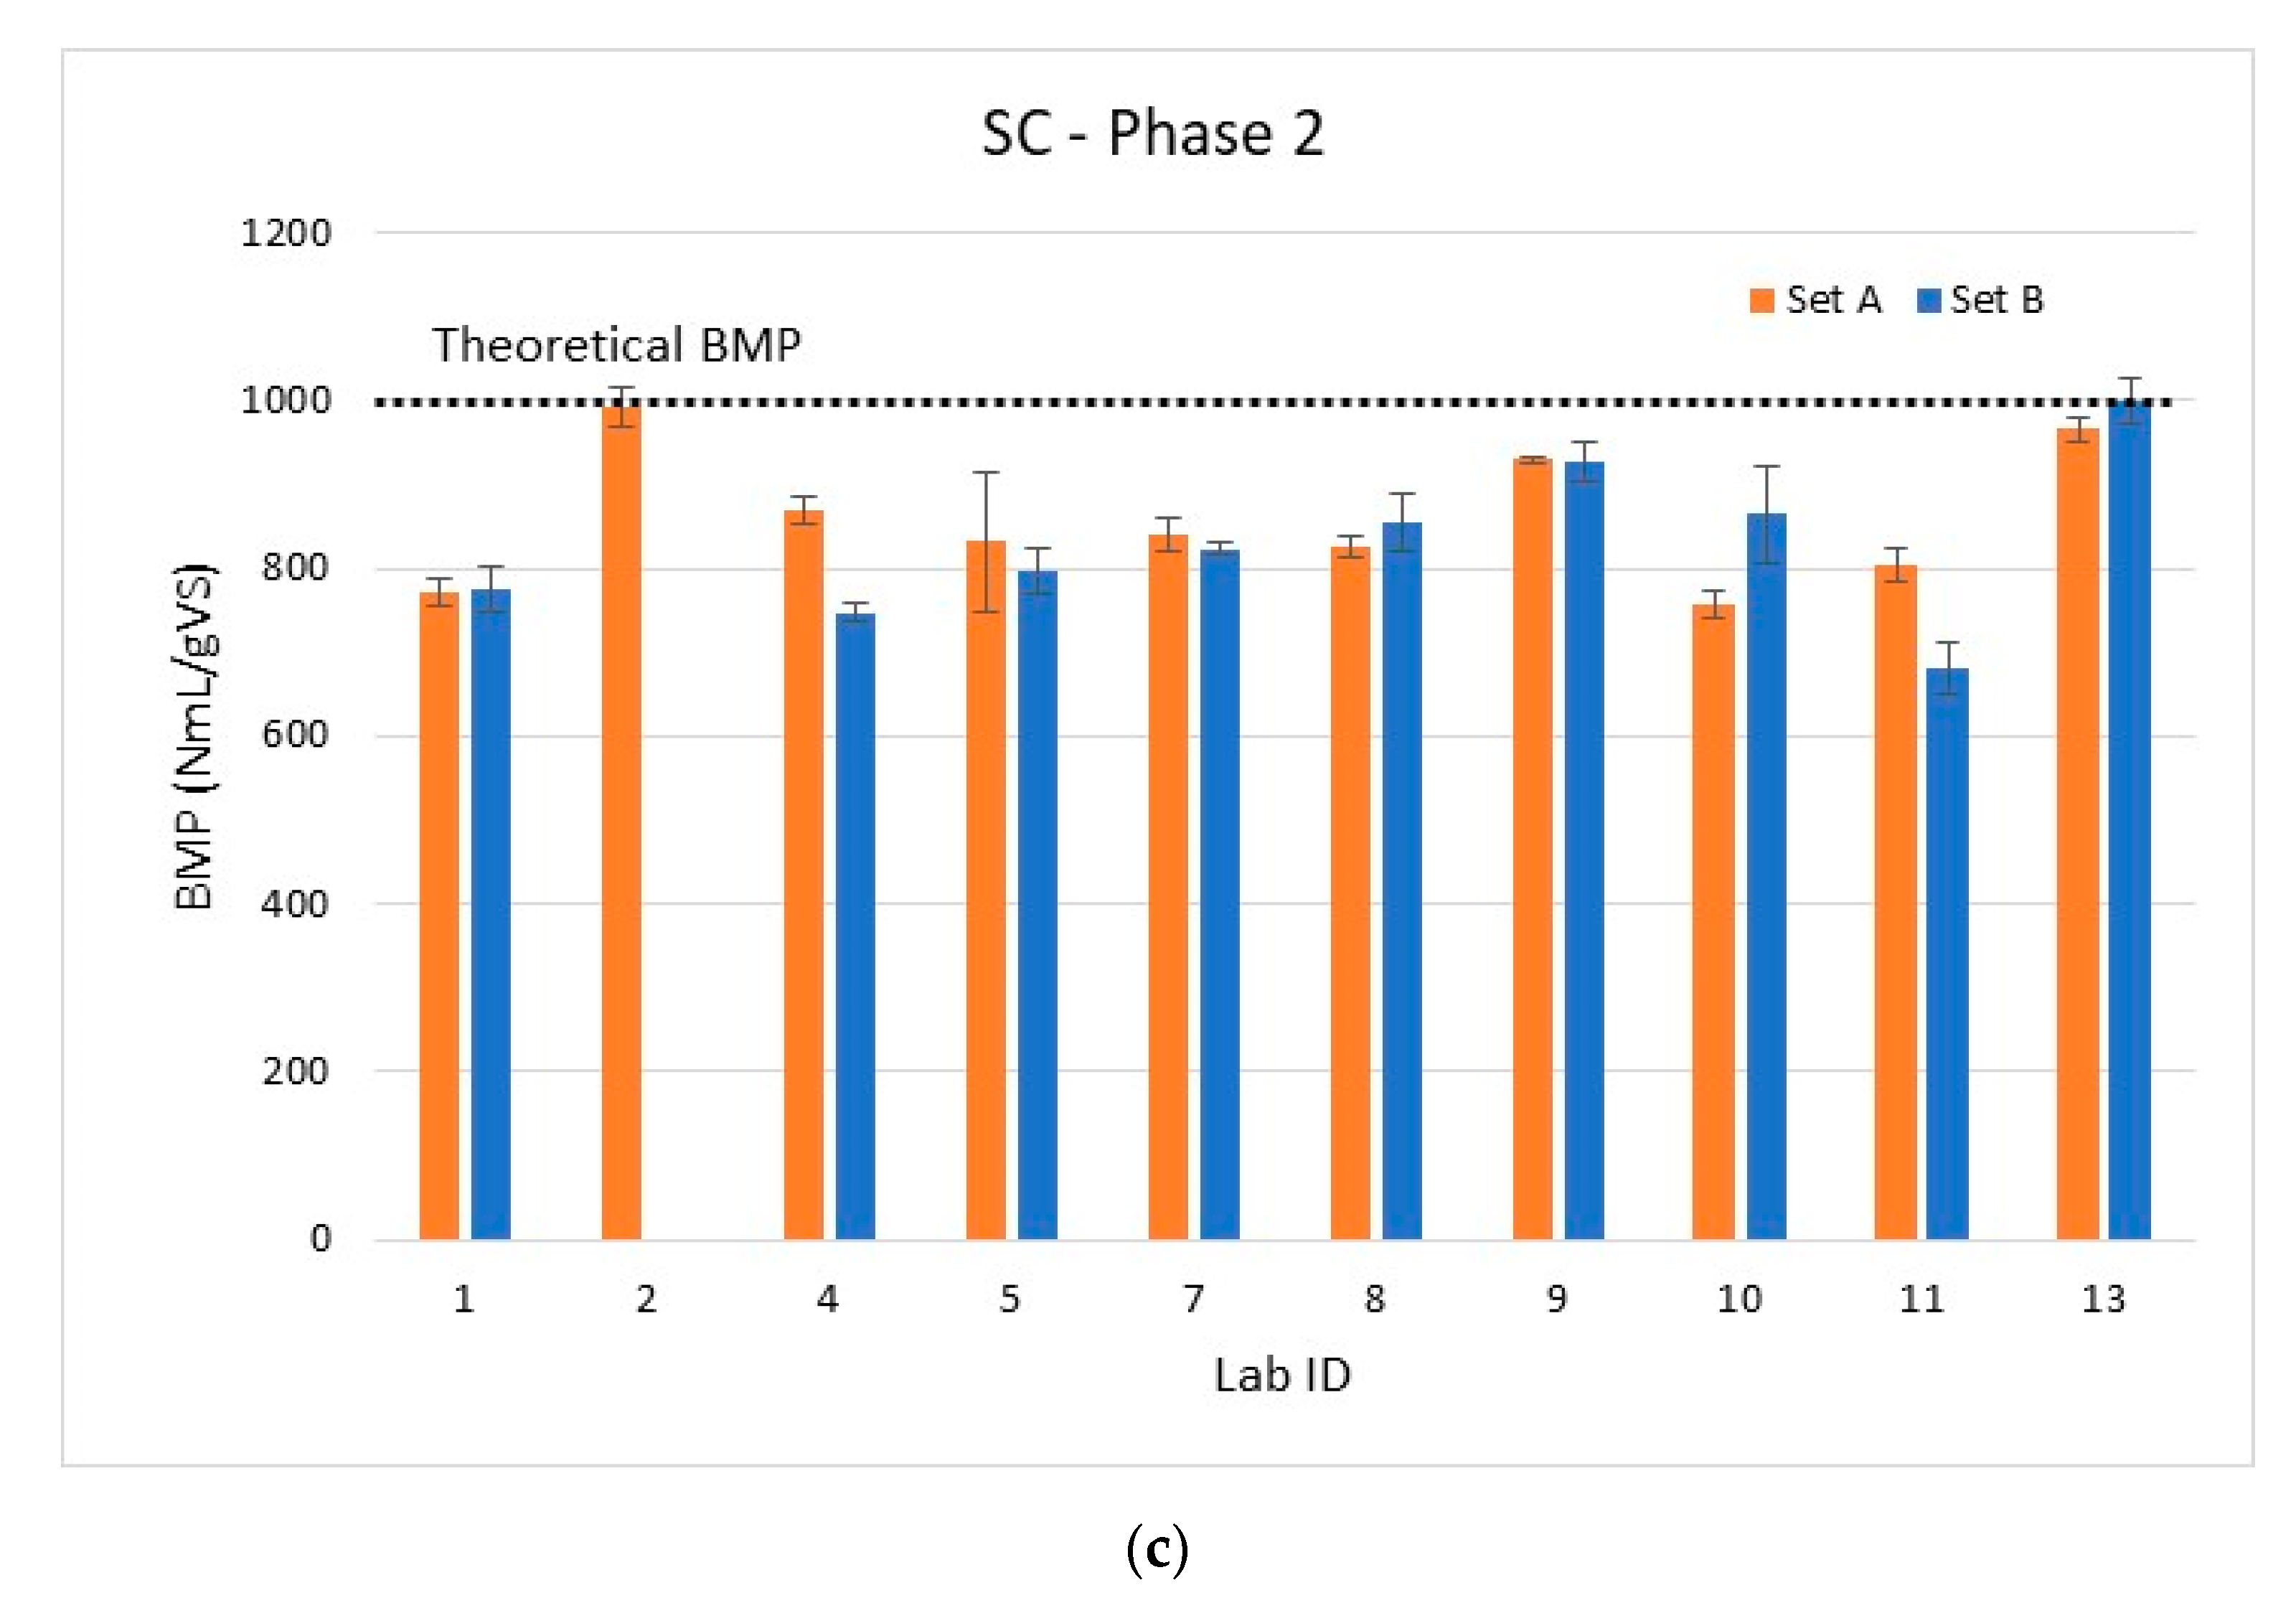
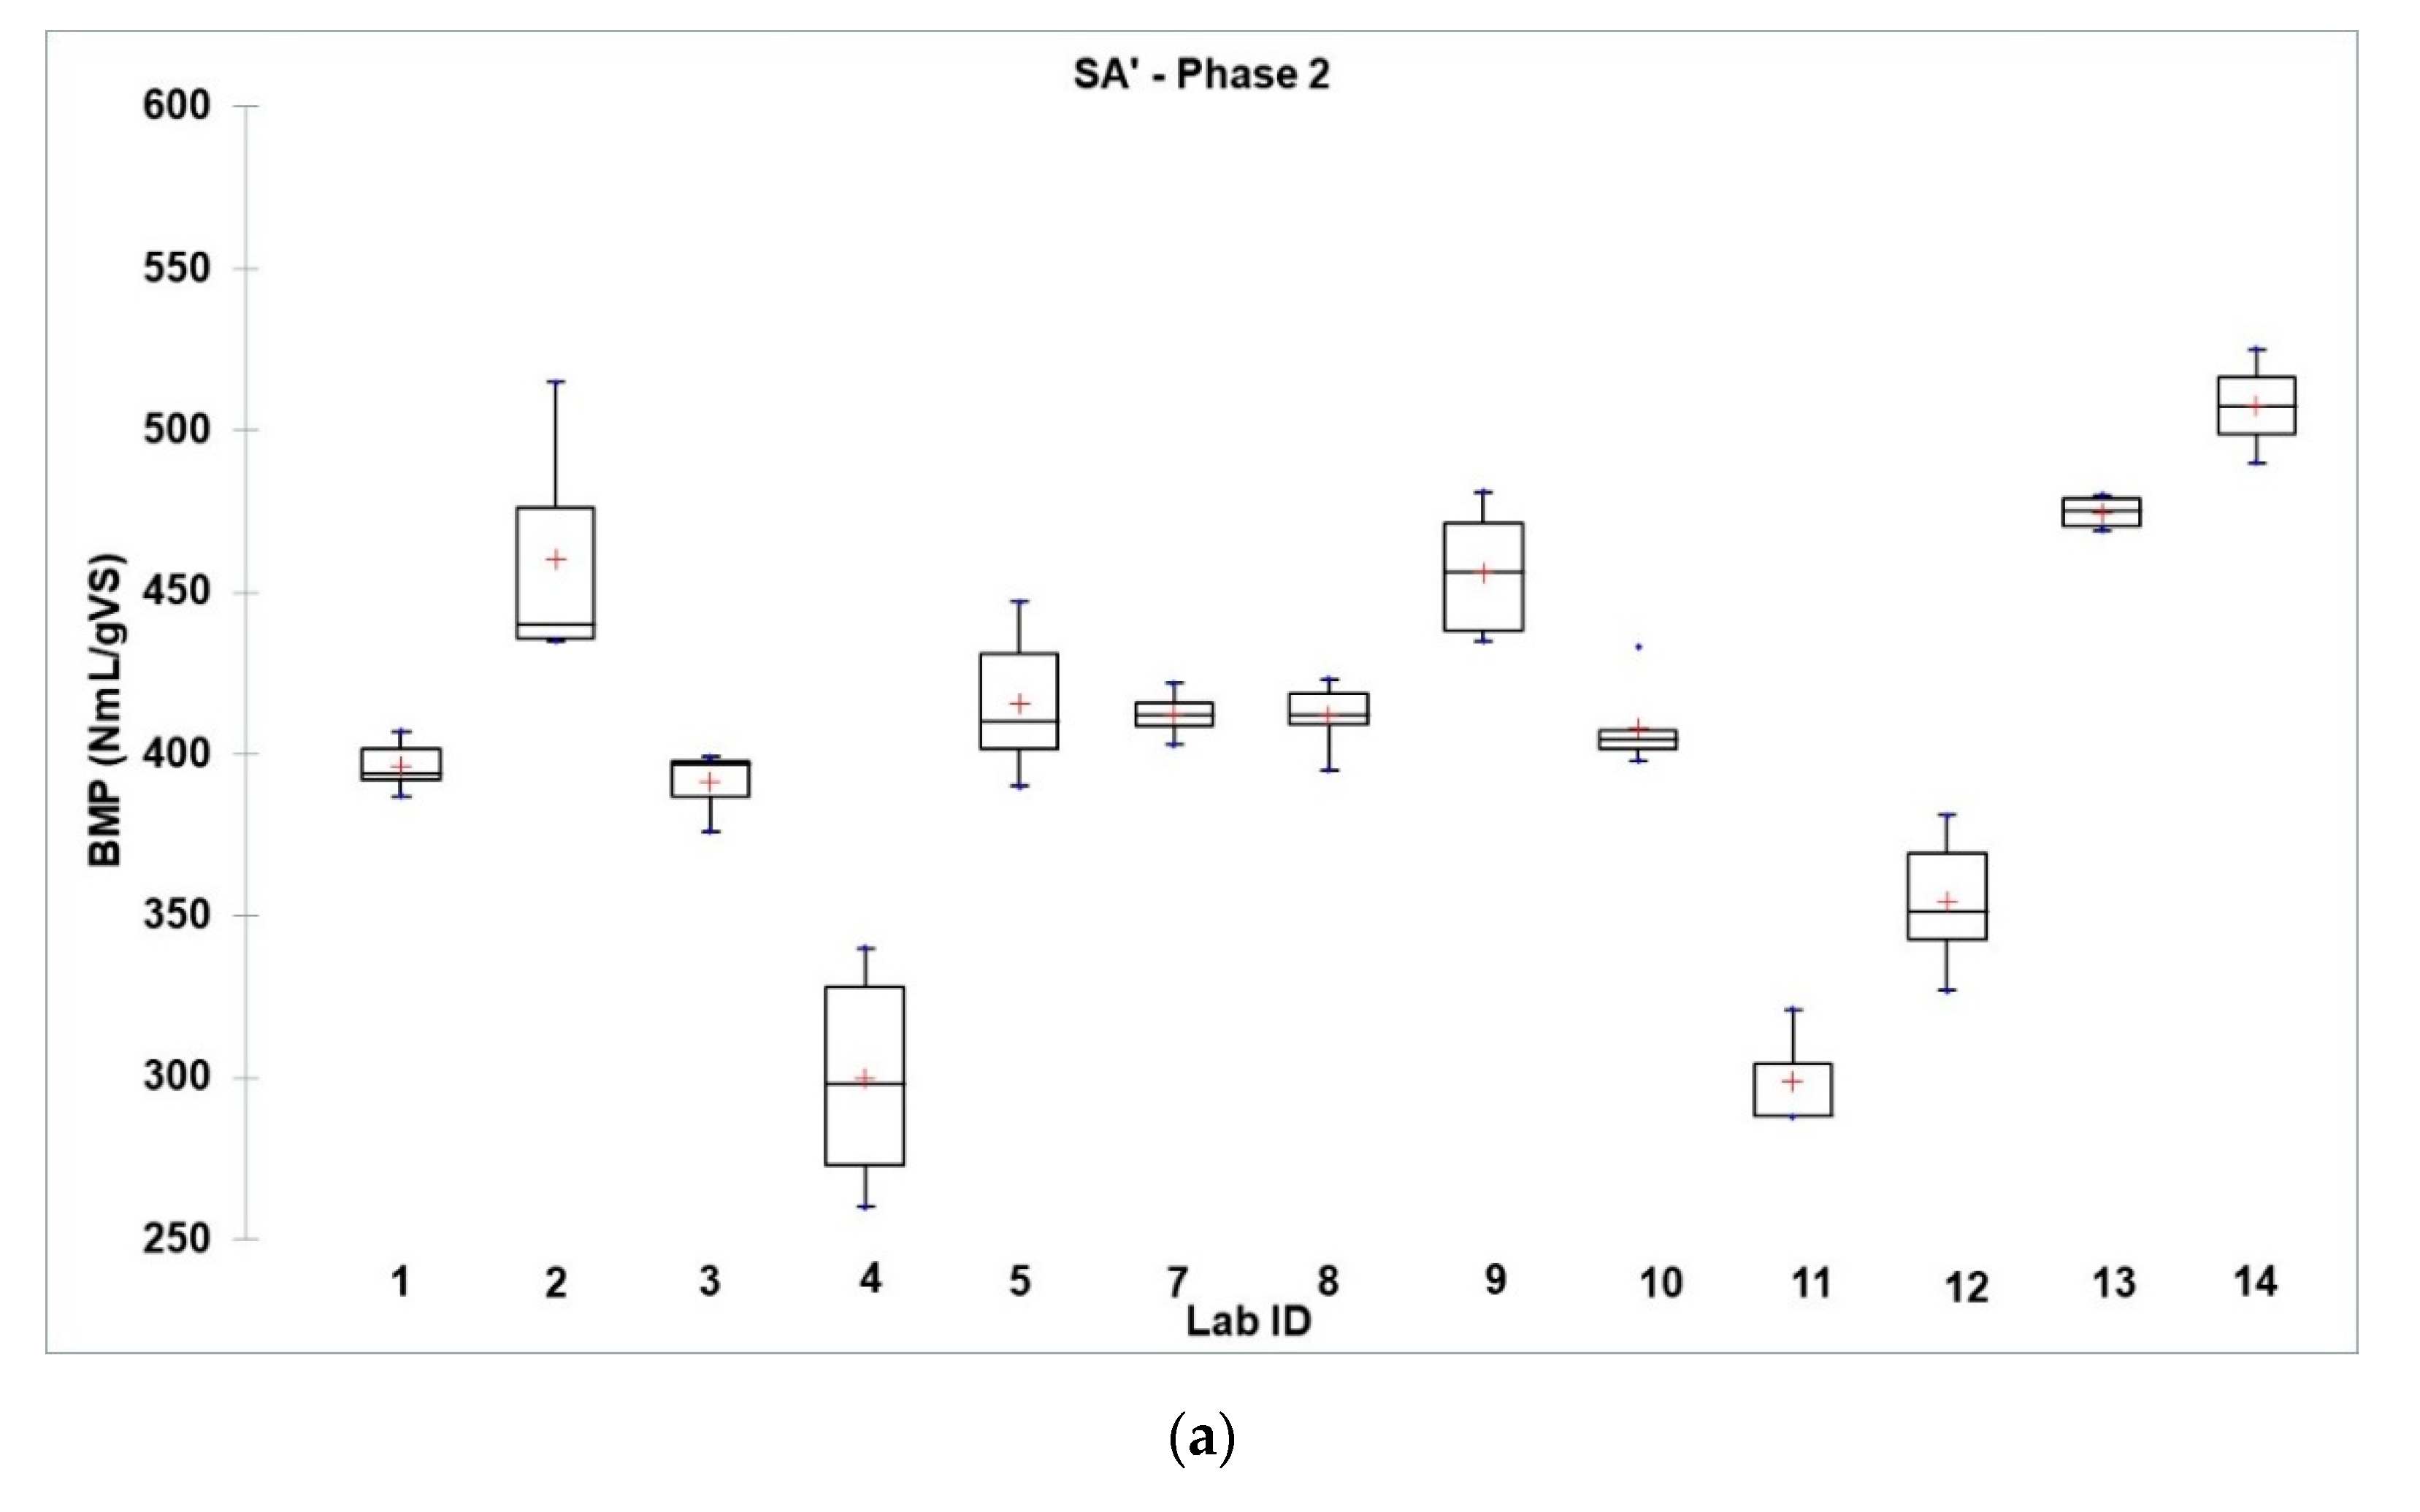
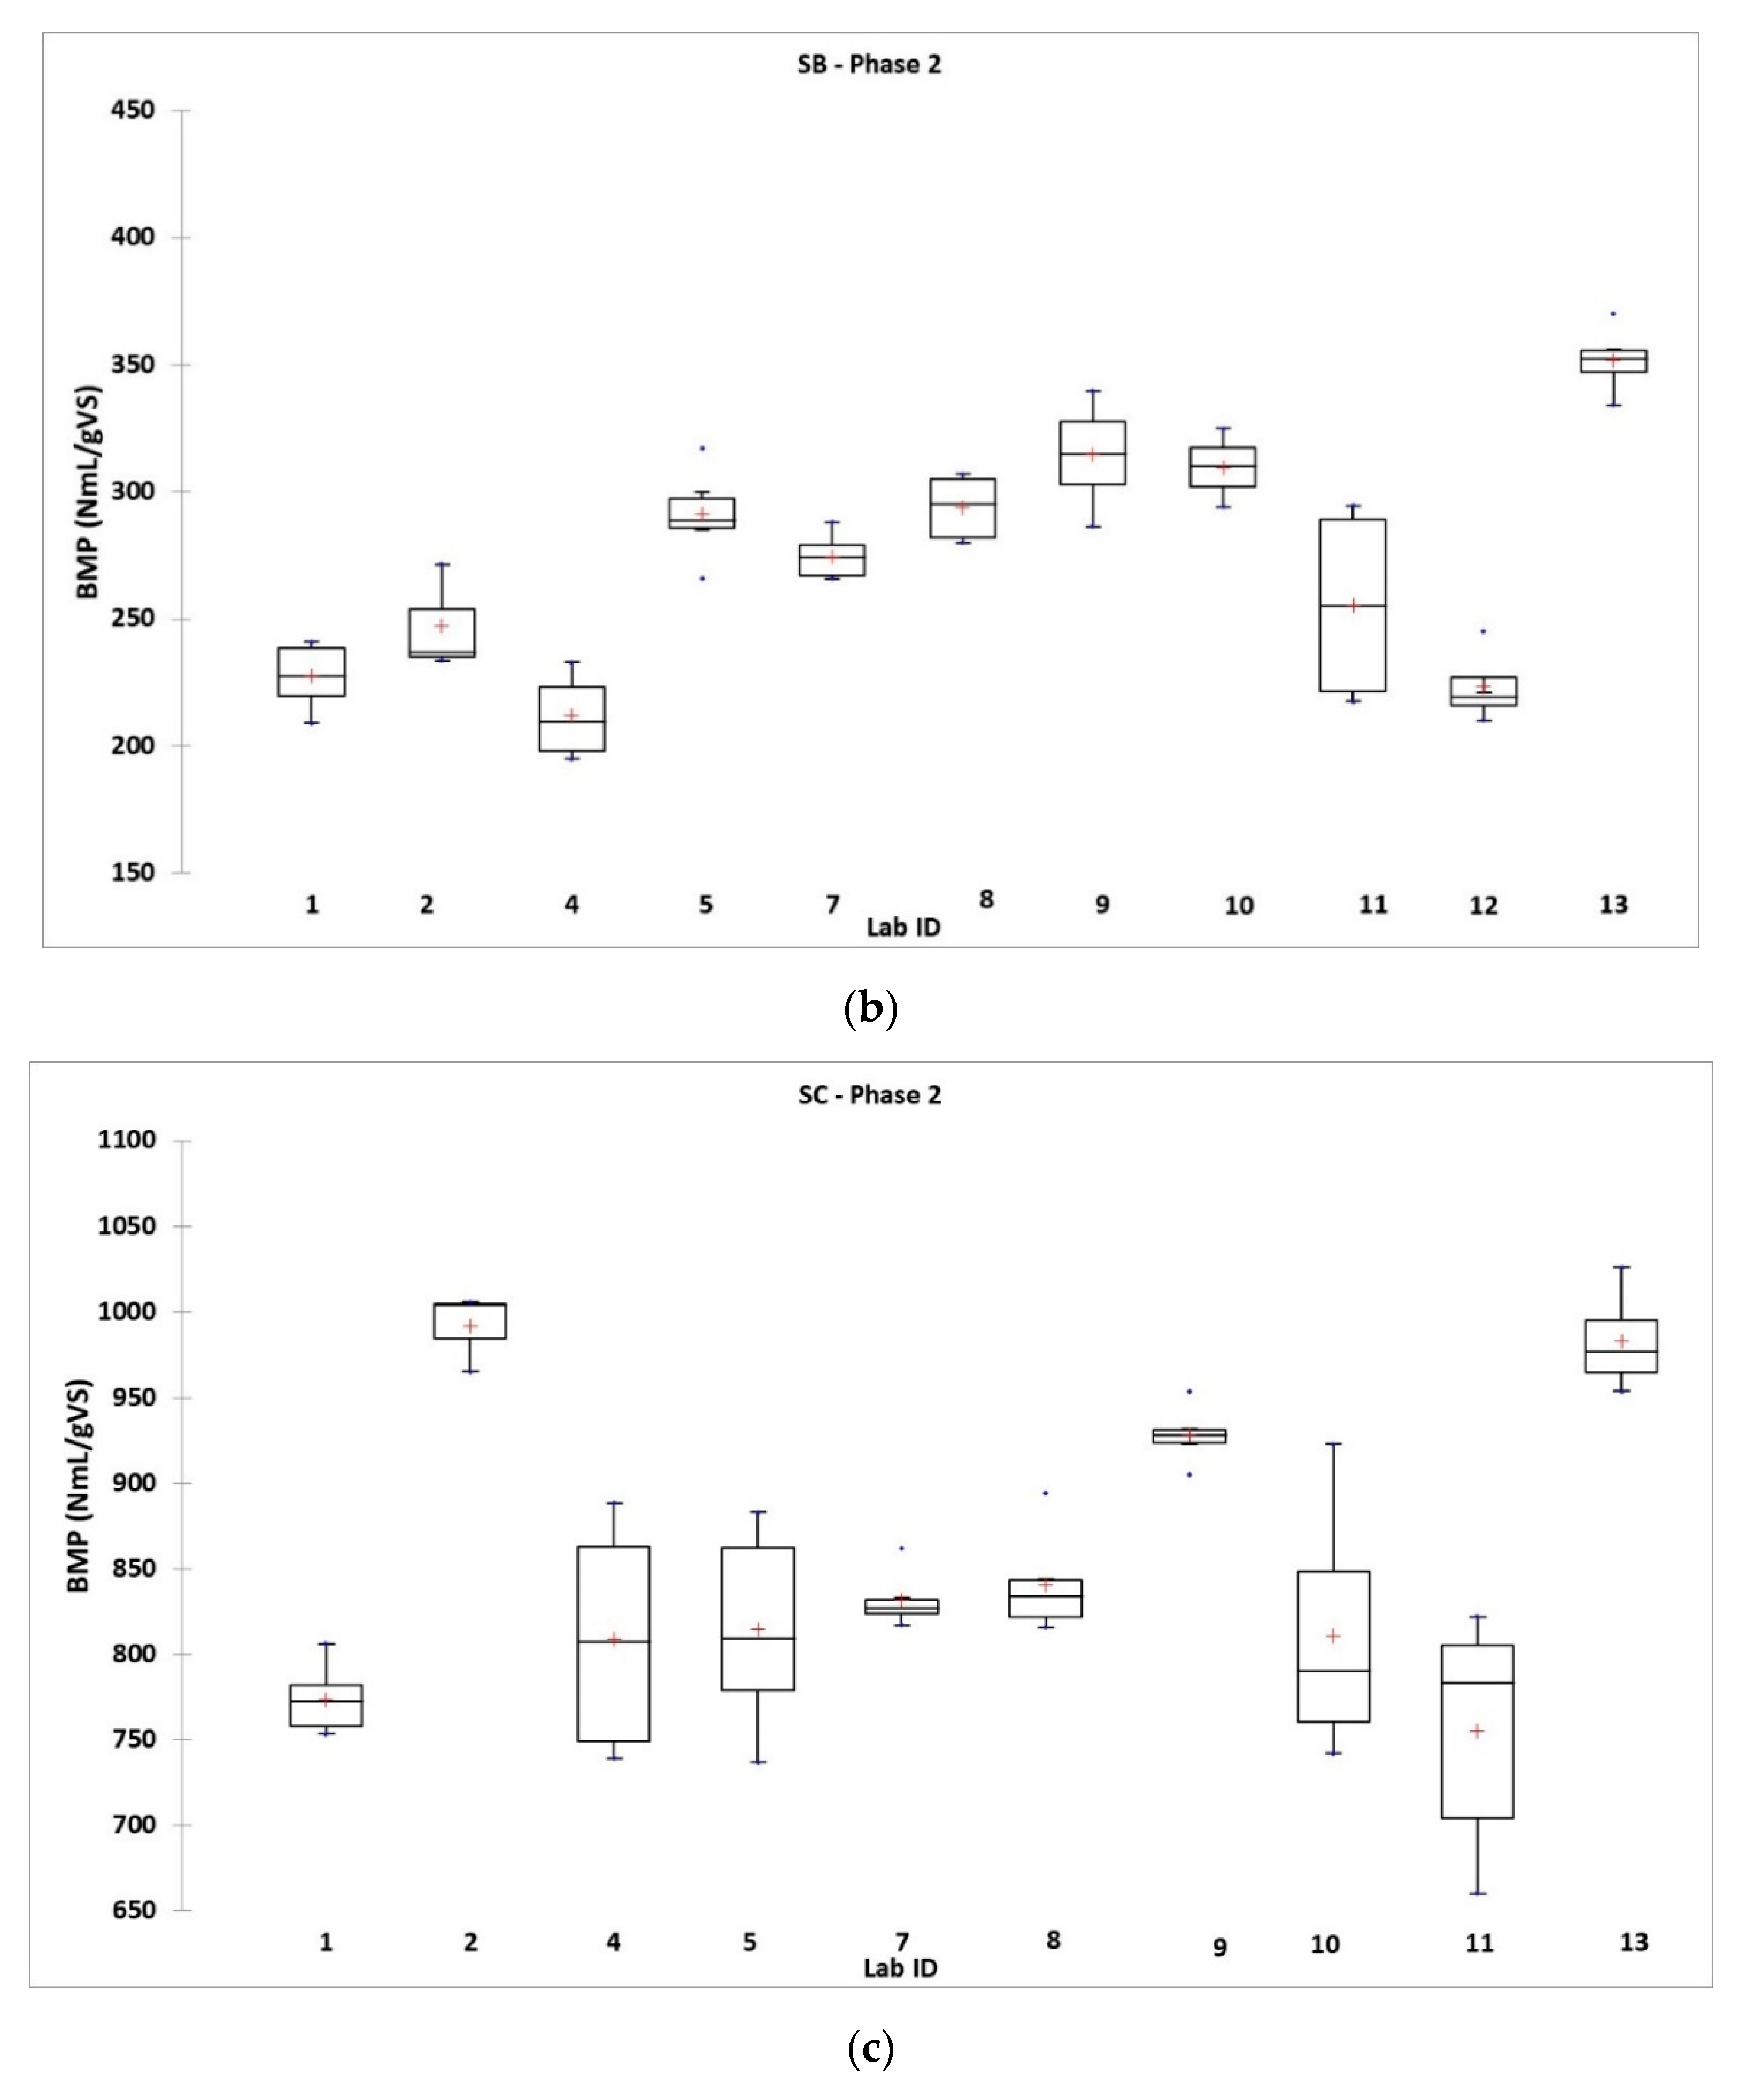
3.3.2. Results of the Second Phase

In this second phase, three labs decided to carry out the BMP tests with two methods (manual and automatic) providing 14 instead of 11 lab results. The numbers of expected, removed and considered values for the data curation and statistical analysis were summarized in Table 2. For each substrate, some values were removed due to the fact that one replicate or the whole set of replicates was atypical and considered as outliers. In this way, the statistical analysis was carried out only on the considered values. A significant number of outliers had been ruled out (8% for SA’, 23% for SB and 19% for SC), which explained why some data are missing in Figure 7, for instance, set A for substrate SB for lab ID 10.
The intra-laboratory repeatability and the intra-laboratory reproducibility were determined from the 330 measurements carried out during this second phase of the study and were good for both sets A and B carried out during the first phase for SA’, SB and SC, as shown in Figure 7 and summarized in Table 7.
The experimental BMP values obtained for all the sets of the three substrates were lower than the theoretical BMP calculated and plotted in the Figure 7a–c. The experimental BMP averages reached were, respectively, 85.1%, 55.5% and 83.7% of the theoretical BMP calculated for SA’, SB and SC.
To facilitate comparisons, extreme values in following boxplots in Figure 8 were adjusted to the limits: SA’, 250–600; SB, 150–450; SC, 650–1100 NmLCH4 gVS−1. The intra-laboratory repeatability and the intra-laboratory reproducibility averages were quite acceptable for SA’, SB and SC, as shown in Figure 8 and given in Table 7.

3.4. Synthesis of the Two Phases

3.4.1. Intra-Laboratory and Inter-Laboratory Reproducibility

As summarized in Table 8, despite the proposed harmonization, the standard deviations of repeatability and reproducibility calculated were not significantly enhanced as expected and were of the same order for the three substrates, except for the inter-laboratory reproducibility of SC, slightly better. They were not significantly different from those in phase 1; the use of the harmonized protocol therefore did not significantly improve the inter-laboratory reproducibility of the measurement.
In addition to intra-laboratory repeatability and inter-laboratory reproducibility, the methodology used also made it possible to assess intra-laboratory reproducibility. The values determined are fairly close to each of the three substrates tested. Their averages, presented in Table 8 below, allowed to quantify the metrological quality of the harmonized protocol.
Our results were of the same order than those reported in Hafner et al. [46] where the relative standard deviation among thirty laboratories from thirteen countries was 7.5 to 24%, obtained from BMP tests carried on four complex but homogeneous substrates and microcrystalline cellulose used as positive control.
Variability in BMP measured by different methods in different laboratories still remained as significant problem, as shown by round robin tests [40,46] including our study. Several explanations for the observed differences have been suggested, including measurement errors and differences among inoculum [7,46,61,62]. A recent large inter-laboratory study found evidence that differences among measurement methods were important [46].
Some hypotheses allowing to explain the remaining variability could be proposed such as volatile solids measurement, inoculum origin, stirring, choice of the method (automatic vs manual) and gas measurement method (volumetric vs manometric), data processing.
As shown also by Hafner et al. [46], the substrate volatile solids measurement reported here (Table 5) did not impact the observed variability. On the other hand, the use of Excel file surveys for data collection and curation with automatic calculation provided reduced these potential errors. The effect of inoculum origin was not investigated in our study, but results reported about this in several studies [63,64,65,66,67,68,69,70,71,72,73], especially Hafner et al. [46], did not confirm this hypothesis explaining the observed remaining variability.
Concerning the potential effect of BMP method (automatic vs. manual) or gas measurement method (manometric vs. volumetric) on the observed results, ANOVA on these factors carried out in our study allowed to conclude that these factors did not make major contributions to variability. Similar conclusions were given by Amodeo et al. [52] about the quantification of differences in BMP measurement using three measurement methods, including the two most used methods (automatic system AMPTS II and manual manometric) and a gravimetric method more recently described [50,74]. Amodeo et al. [52] have shown that all methods gave similar results and were reasonably accurate.
Stirring factor was not investigated in our study. This information was just collected as information in the Excel file protocol survey and no other special recommendation than BMP media should be stirred continuously or sequentially in a discontinuous way was defined in the harmonized protocol about stirring. Amodeo et al. [52] assessed the importance of the stirring position in the measurement sequence in their study and showed that mixing after biogas measurement resulted in 3% higher BMP for both manual methods than mixing before.
Overall, no single factor appears to explain the variability in the BMP alone; variability in laboratory practices probably explains most of it [46]. The reduction of BMP variability is still needed and requires current and continuous investigation carried out by the anaerobic digestion scientist community. Many other factors were already investigated such as effect of temperature [63] or mixing [75], headspace pressure [76,77], flushing of headspace [78], implementation of successive batches [59,60], origin [64,65,67,68,72] and acclimation of inoculum [67,70], substrate ratio and substrate mix ratio [65] and so on.

3.4.2. Control Positive Limits

As the factors method and gas measurement mentioned before, the maximum methanogenic activities were also influential in the phase 2 (p-value < 0.0001 from ANOVA with for SA’ and 0.005 for SC; respectively carried out on a sample size of 69 and 56). However, note that in our study, the values of maximum methanogenic activities (SMA) measured within the framework of the second experimental phase were, for the majority of laboratories, not usable while this criteria based on sodium acetate BMP may eliminate BMP values with high error resulting from several reasons, including measurement errors, calculation errors and inactive inoculum. Otherwise Hafner et al. [46] showed that this validation criteria are essential for reducing inter-laboratory variability. This fact showed that the choice of the positive control is very important and determinant for the success of the BMP tests. The choice of positive control should be considered from the beginning when building the BMP protocol test, allowing to avoid such problems and to validate both experimental test setup and inoculum performance [72]. Therefore, the use of positive control substrates with theoretical known methane potential is mandatory to check the quality of BMP results reported. Harmonization guidelines consider the use of standard compounds as a compulsory element to obtain reliable BMP results. Cellulose, with a theoretical methane potential of 414 mLCH4 gVS−1, has frequently been suggested as the most common choice of standard compound for quality control of BMP measurements [20,30,45]. Its full biodegradability, low price, high quality and worldwide distribution designates it as the favorite positive control substrate [14]. However, this theoretical value is not totally reached because around 10–15% of degradable substrate components are used for microbial growth and cell maintenance [14]. Other different compounds could be used as described in Koch et al. [79]; eight tested common supermarket products showed 81–91% of theoretical maximum BMP
Finally, Hafner et al. [46] recommend firstly a relative standard deviation for cellulose BMP not higher than 6% and, secondly, a mean cellulose BMP between 340 and 395 NmLCH4 gVS−1.

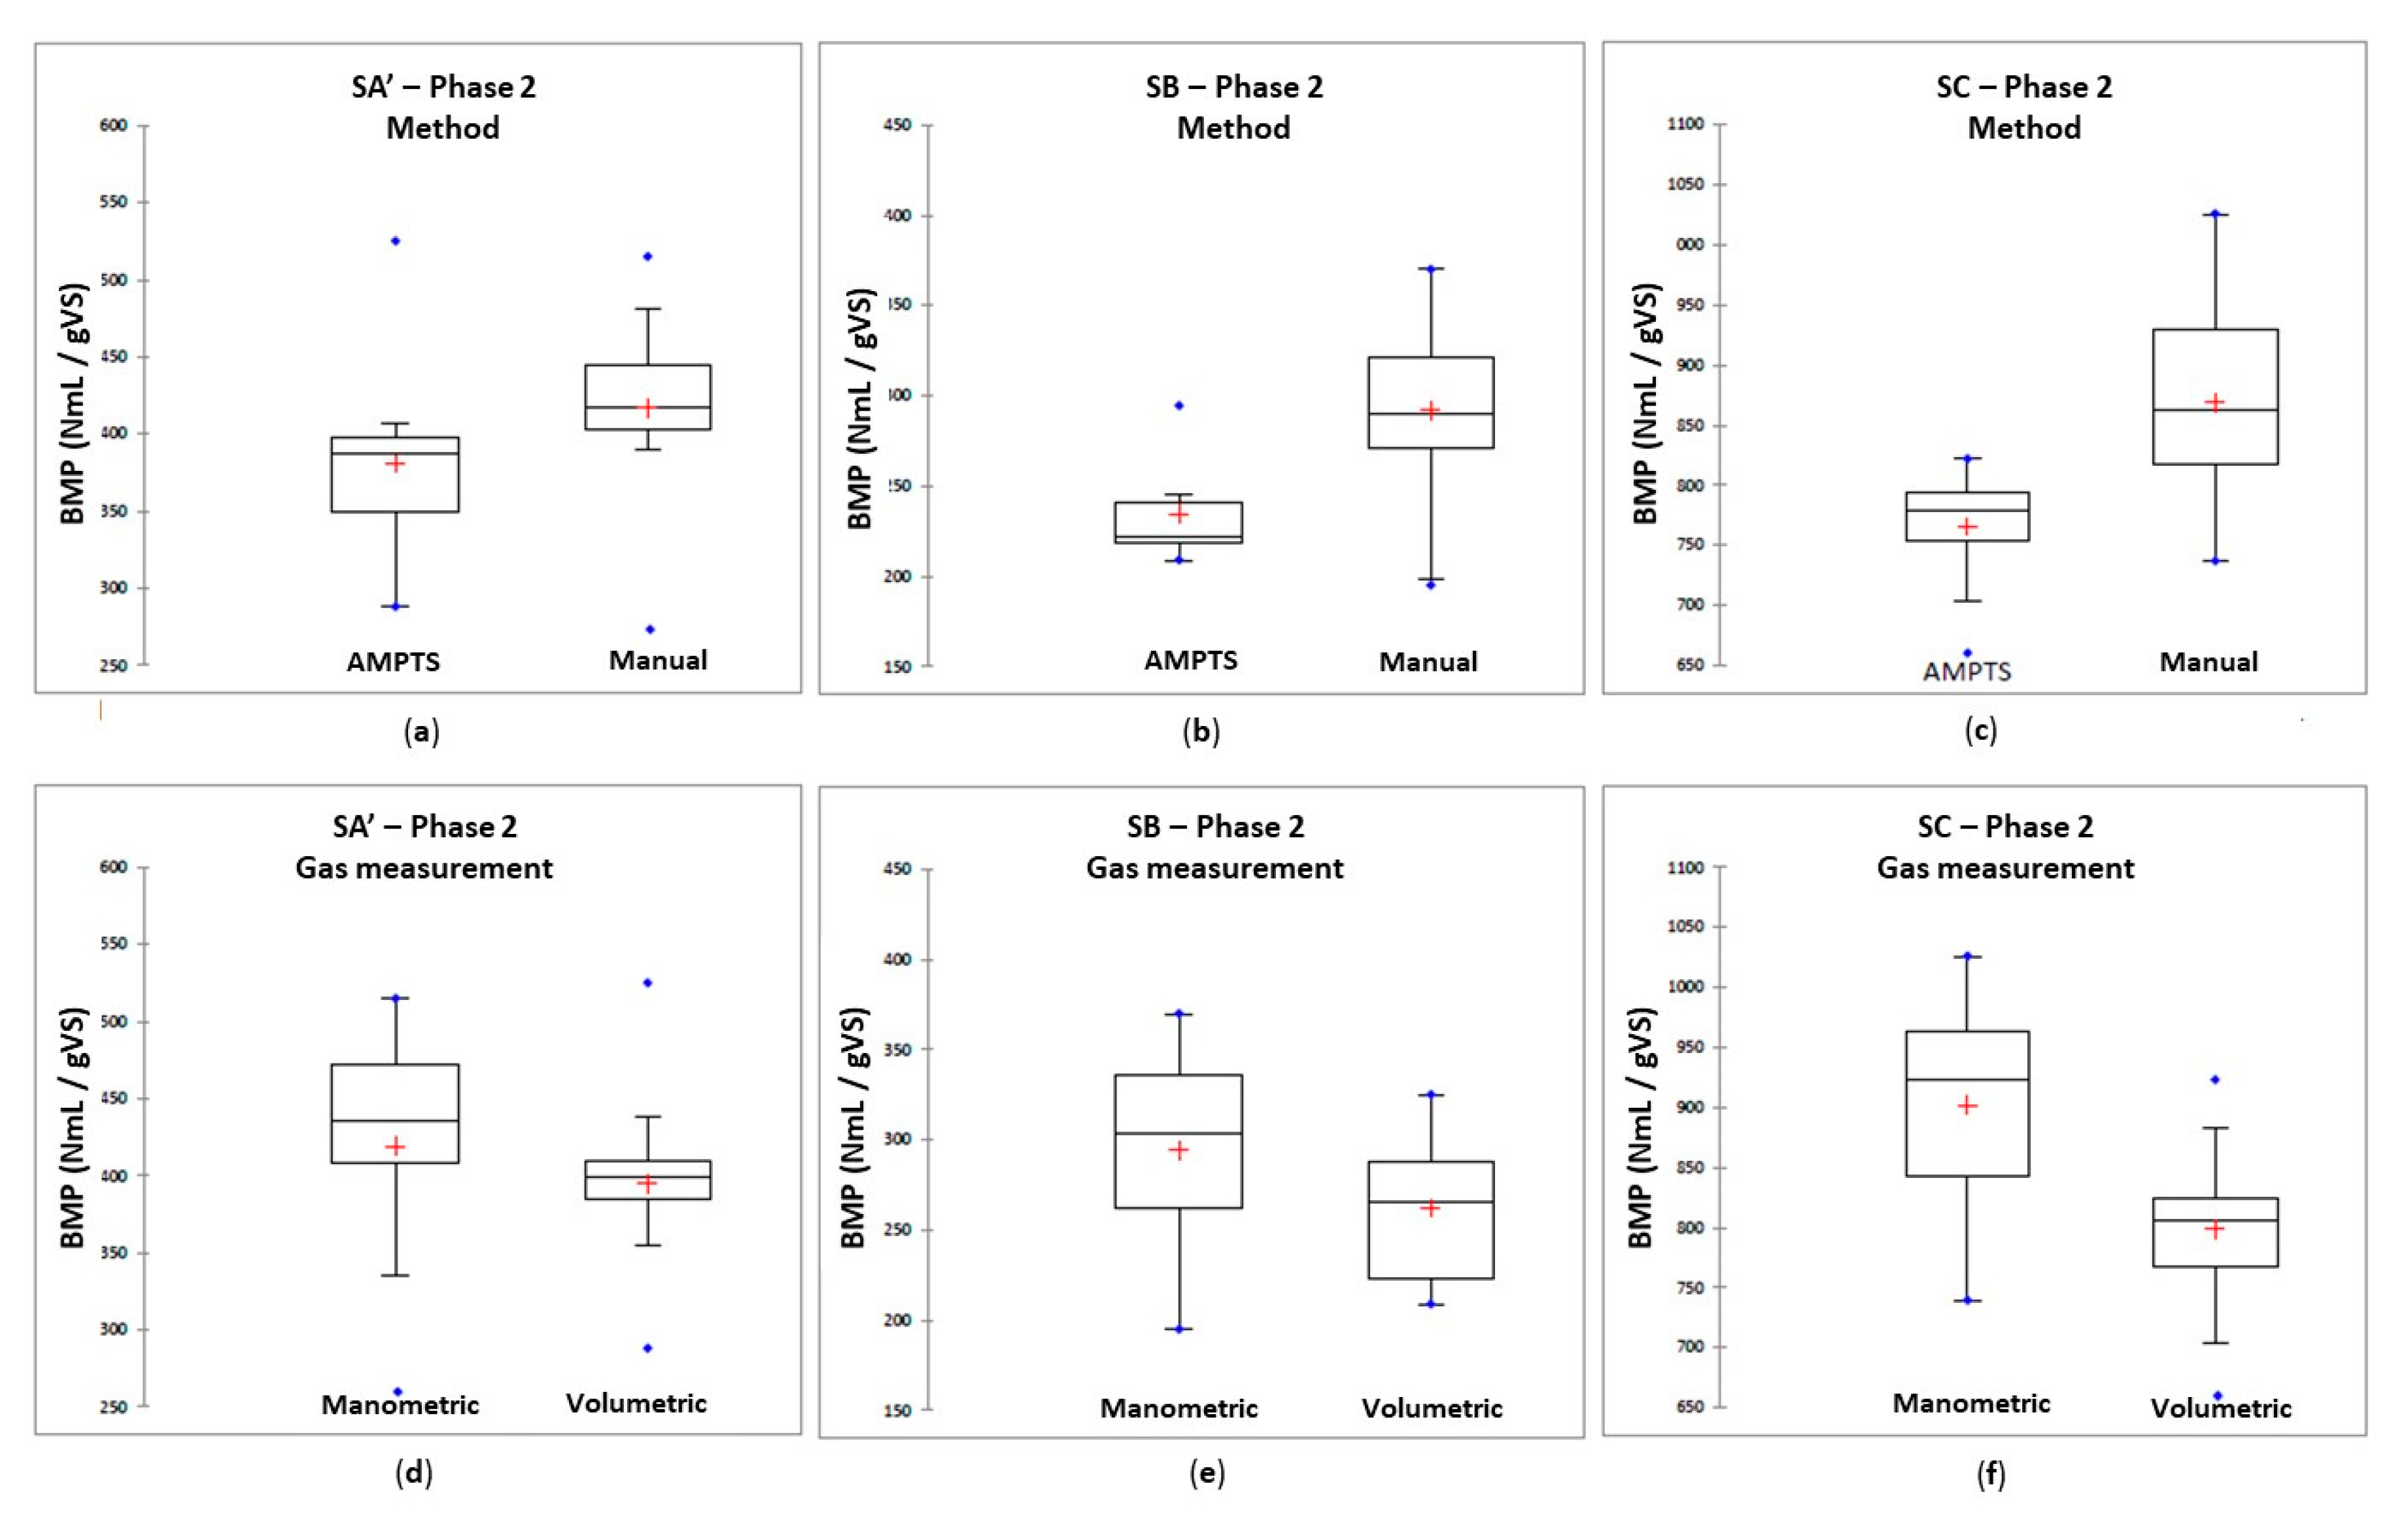
3.4.3. Effect of the Experimental Method on BMP

The analysis of the results of the second experimental phase, carried out according to the harmonized measurement protocol, highlighted the impact of the experimental method on BMP value. The identification of the parameters/factors of the measurement protocol influencing the BMP values was carried out by ANOVA with 4 factors for SA’, SB and SC (Table 9).
The parameters varying from one laboratory to another were the following:
-
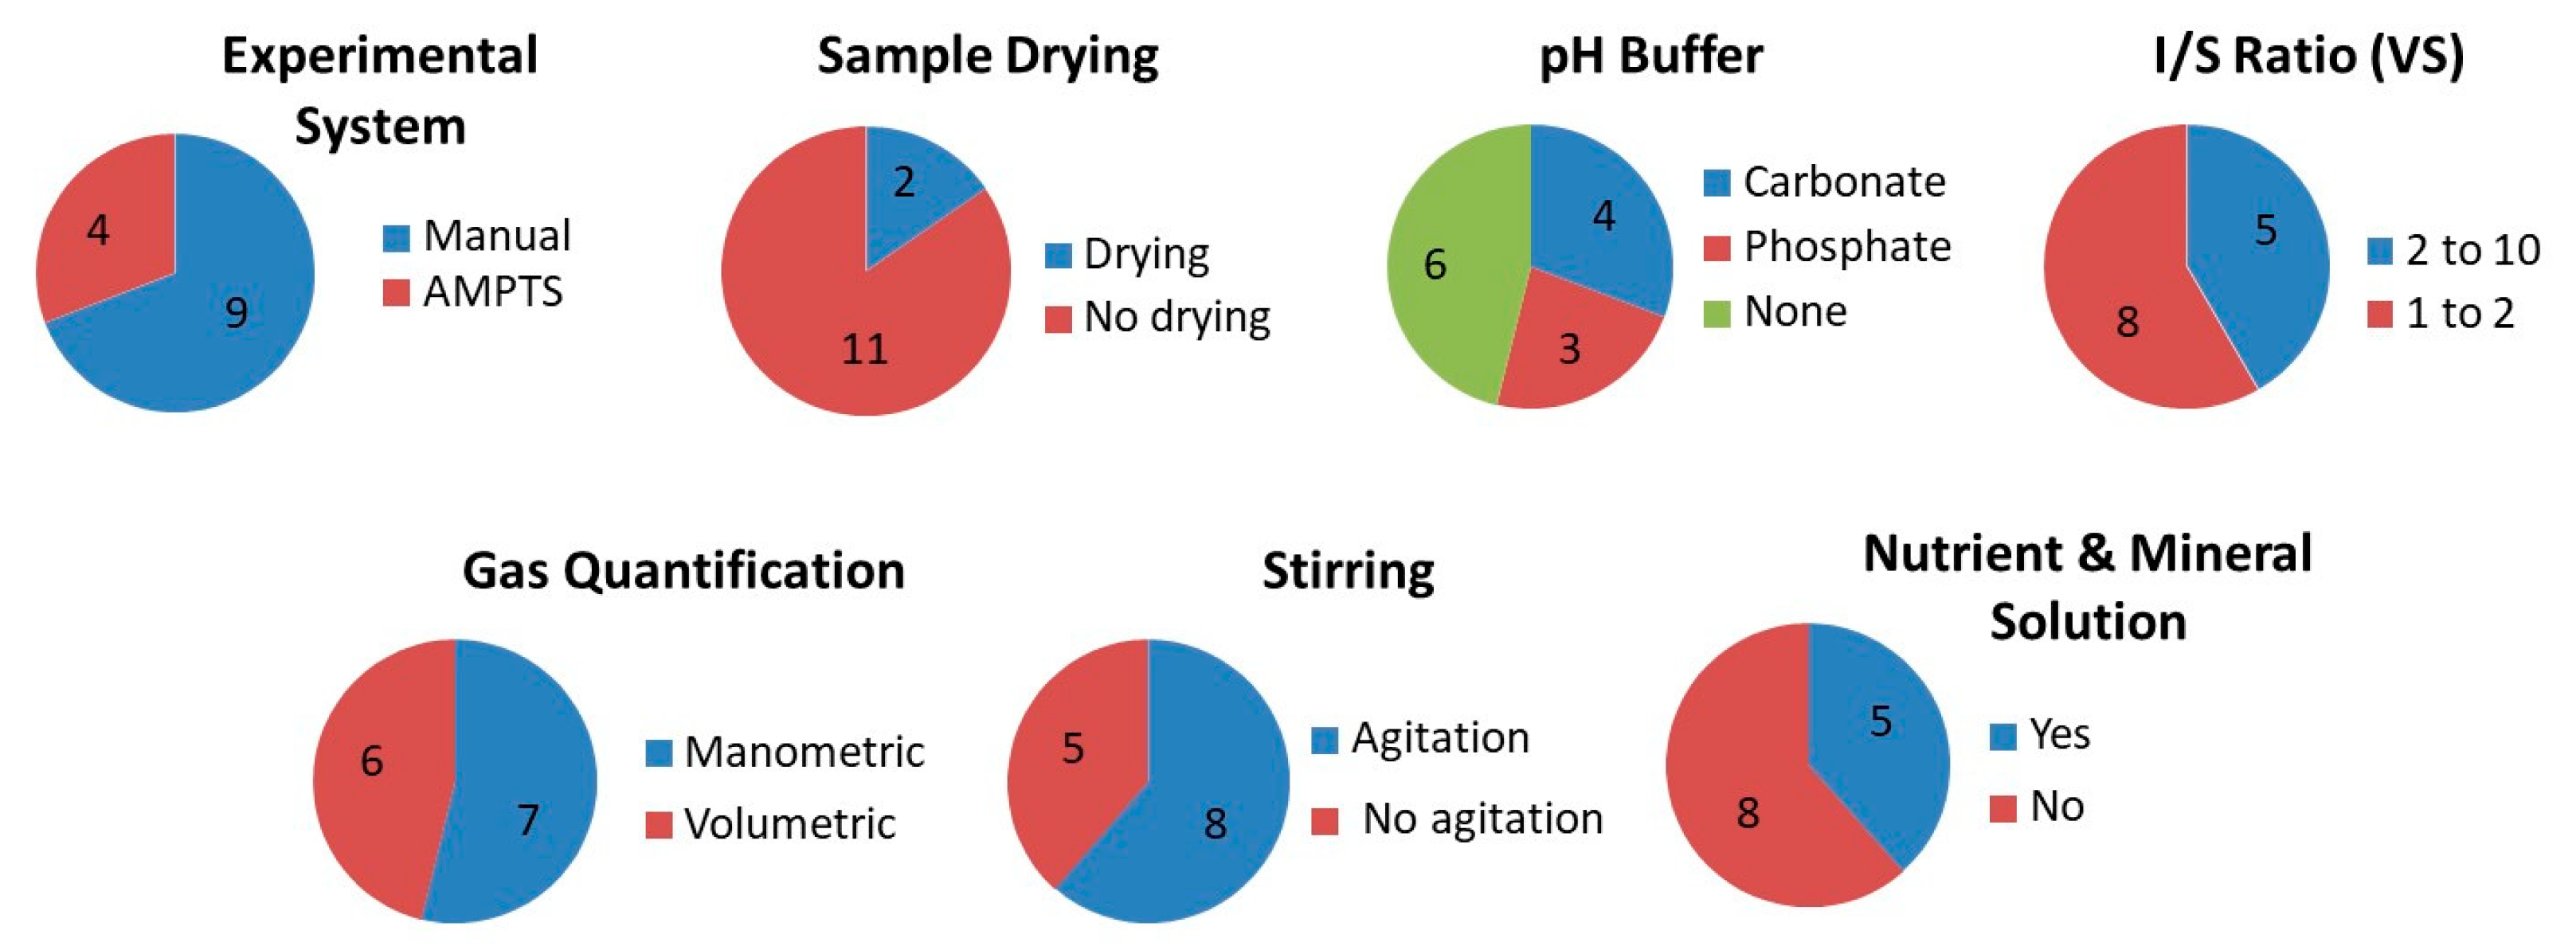
The experimental method, which was either “manual” if the monitoring of biogas production and its qualitative analysis were carried out manually by an operator or “automatic” when carried out using an automatic measurement system (AMPTS);
-
The biogas measurement method, carried out either using a manometer or using a volumetric flowmeter (the semi-automatic measuring device AMPTS was considered as volumetric measurement);
-
The initial substrate concentration [S], expressed in gVS/L;
-
The maximum methanogenic activity (SMA) expressed in NmLCH4 gVS−1 day−1;
-
The maximum endogenous activity (ENDO) expressed in NmLCH4 gVS−1 day−1.
Considering the p-values lower than 0.005 (Table 10) obtained from ANOVA for the factor method for the three substrates and boxplots (Figure 9) showing the comparisons between automatic and manual method and between volumetric and manometric gas measurement, the automatic method (which involved a volumetric measurement of biogas production) thus led to lower methanogenic potential values (of around 15%) compared to the manual method (volumetric measurements). However, this automatic method was only used by three participants of this inter-laboratory study, and if one dataset obtained by this method was not totally satisfying, its interpretation led to a wrong conclusion. From a statistical point of view, due to a very low number of considered substrates (3 substrates in this study) and the difference between data with AMPTS and manual determination, as shown in Table 8 (e.g., 11 vs 45 for SC substrate), the ANOVA was disproportionate, and the interpretation was very difficult. In this way, it was quite difficult to consider these conclusions as significant because of the too low statistical size, and not randomly assigned measurement methods and parameters.
Since this French inter-laboratory study, one other inter-laboratory was carried out with 31 participants where 15 labs using the automatic method (AMPTS® II devices); it showed that there was no effect or underestimation of the BMP values with the AMPTS device [45,52]. Finally, the results of ANOVA with four factors for SA’, SB and SC showed there was no correlation of the inoculum endogenous activity for all the laboratories (p-values > 0.005 and equal to 0.005, 0.071 and 0.668, respectively, for SA’, SB and SC).
Another recent study dealing with the comparison of BMP results of ten feedstocks using both AMPTS method and the German DIN 38,414 standard method [36] has shown that there was no statistically significant difference between the DIN method at 28 days and the AMPTS method at 21 days, thus supporting both methods in determining BMP of feedstocks [80].

3.4.4. Potential Effect of Inoculum on BMP

Considering the results obtained (inter-laboratory reproducibility of ±18%), under operating conditions strictly defined by the harmonized protocol, a large part of the inter-laboratory variability can be attributed to the nature of the microbial consortium used in these BMP tests, which remained the only parameter not fixed by the protocol. The improvement of the metrological quality of the BMP measurement was dependent on the evaluation of this variability, related to the microbiological composition and metabolic activity of the inoculum. Such an evaluation should/could be carried out as part of a subsequent inter-laboratory study third part, specifically dedicated on the impact of this parameter in the measurement.
Hafner et al. [46] showed that regular laboratory inocula were sufficient, and inoculum origin was not a major contributor to observed inter-laboratory variability in BMP. In this international interlaboratory assay, laboratories compared the BMP values obtained with their own regular inoculum and one shared inoculum per country. Surprisingly, no one of the shared inoculum showed a decrease in interlaboratory variation. Transport, and the storage of the inoculum, which greatly affects it [71,73,81], could explain these unexpected results.
Both phases allowed also to conclude that the pretreatment of the substrates (drying, shredding) did not affect significantly the BMP values. The assays also suggested that reliable statistical analyses, with the detection of the outlier values, are also recommended to evaluate the effect of the numerous factors that can impact the BMP tests.

4. Conclusions

This work results from inter-laboratory assays on three substrates. The main conclusions that can be drawn are as follows:
  • Using the protocols specific to each laboratory, the intra-laboratory variations are acceptable, with an average repeatability of 6%, after removal of about 16% of outliers. For each laboratory, the results are considered credible, but inter-laboratory variations are significant, on average 18%.
  • No experimental factor (agitation, method of measurement, data processing) can statistically explain these variations which persist, even with the use of a harmonized protocol.
  • The reasons for inter-laboratory variability in BMP remain unclear at the end of these trials; inoculum diversity and variability have been shown not to affect BMP in other recent studies.
  • The use of a positive control might have allowed a better sorting and refinement of the results.
  • Drying the SA complex substrate (containing proteins, carbohydrates, lipids and fibers) does not change the BMP. This net and interesting result can probably be extrapolated to other substrates but containing no volatile molecules.
  • Eleven laboratories participated in this trial, generating approximately 350 BMP. Despite this large number, due to the different measurement methods, the removal of the outliers resulted in variable and sometimes small numbers of results to compare. The mathematically accurate statistical conclusions are therefore to be considered with hindsight. Understanding the variability of BMPs would therefore require a much larger panel, which would not guarantee control of the conditions for obtaining reproducible and comparable BMPs. The inter-laboratory variability remains significant and comparable to those observed in this work, even in the study involving more than 30 laboratories [46].

Author Contributions

All the authors contributed to the conceptualization of assays, methodology, investigation, experimentation, data collection and analysis, T.R., R.C., S.P. (Sébastien Pommier), S.P. (Sébastien Preys), L.A., F.B., T.B., C.B., P.B., J.C., P.C., L.M., A.P., P.P., M.R., M.T.; data curation and statistical analysis, S.P. (Sébastien Preys); writing—original draft preparation, T.R.; A.P.; writing—review and editing, T.R.; A.P.; project administration and coordination, R.C., S.P. (Sébastien Pommier); funding acquisition, R.C., S.P. (Sébastien Pommier). All authors have read and agreed to the published version of the manuscript.

Funding

This research was funded by ADEME, grant number 1206C0036 (2012–2014).

Acknowledgments

This French inter-laboratory study was supported by ADEME. All these results were compiled in a report freely available only in French on the ADEME website (Cresson, R., Pommier, S., Béline, F., Bouchez, T., Bougrier, C., Buffière, P., Cacho, J., Camacho, P., Mazéas, L., Pauss, A., Pouech, P., Ribeiro, T., Rouez, M., Torrijos, M. 2014. Etude interlaboratoires pour l’harmonisation des protocoles de mesure du potentiel bio-méthanogène des matrices solides hétérogènes—Rapport final. ADEME. 121 pages) [82,83].

Conflicts of Interest

The authors declare no conflict of interest.

Appendix A. Calculation of Theoretical Methane Productivity

The theoretical methane productivity was calculated on the basis of substrate composition, literature data, and formula of Buswell and Müller [57]), completed by Boyle [58]:
CnHaObNcSd + (n − a/4 − b/2 + 3C/4 + d/2) H2O → (n/2 − a/8 + b/4 + 3d/8 + d/4) CO2 + (n/2 + a/8 − b/4 − 3d/8 − d/4) CH4 + c NH3 + d H2S
Table A1. Calculation of theoretical methane productivity of organic molecules.
ComponentCrude Formula and Weight Percentages of VSTheoretical Methane Yield (NL/gVS)
Cellulose, starch, galactose, mannose in macromoleculesC6H10O50.415
ProteinsC6H12O3N20.420
Lipides (glycerol trioleate)C57H104O61.013
XylosesC5H8O40.424
Coumarylic acid (in lignin)C9H10O20.784
Coniferylic acid (in lignin)C10H12O30.715
Sinapylic acid (in lignin)C11H14O40.666
Hemicellulosexylose66 %0.283
galactose, mannose33 %0.138
Total for hemicellulose0.421
LigninCoumarylic alcohol30 %0.235
Coniferylic alcohol40 %0.286
Sinapylic alcohol30 %0.200
Total for lignin0.721
SA and SA’ (same complex mixture but dried and shredded for SA’).
Table A2. Calculation of theoretical methane productivity of SA and SA’.
ComponentWeight Percentages of VS (%)Theoretical Methane Yield (NLCH4/gVS)
Potatostarch100270.112
Maizeglucides72180.054
proteins100.008
lipids80.015
lignin100.012
Meatproteins85260.093
lipids150.039
Straw (see below)290.145
Total0.476
SB (straw).
Table A3. Calculation of theoretical methane productivity of SB.
ComponentWeight Percentages of VS (%)Theoretical Methane Yield (NL CH4/gVS)
Cellulose430.178
Hemicellulose290.122
Lignin280.200
Total0.499
SC (mayonnaise).
Table A4. Calculation of theoretical methane productivity of SC.
ComponentWeight Percentages of VS (%)Theoretical Methane Yield (NL CH4/gVS)
Lipids1001.013

References

  1. Fedorov, V. Modern technologies of treatment and stabilization for sewage sludge from water treatment plant. Agric. Sci. Procedia 2016, 10, 417–430. [Google Scholar] [CrossRef] [Green Version]
  2. Jain, S.; Wolf, I.T.; Lee, J.; Tong, Y.W. A comprehensive review on operating parameters and different pretreatment methodologies for anaerobic digestion of municipal solid waste. Renew. Sustain. Energy Rev. 2012, 52, 142–154. [Google Scholar] [CrossRef]
  3. Tchobanoglous, G.; Burton, F.; Stensel, D. Wastewater Engineering Treatment Reuse, 4th ed.; McGraw-Hill Companies, Inc.: New York, NY, USA, 1991; pp. 1505–1533. [Google Scholar]
  4. EBA. Annual Statistical Report of the European Biogas Association—European Overview 2019. Available online: https://www.europeanbiogas.eu/eba-statistical-report-2019/ (accessed on 9 October 2020).
  5. Remigi, E.U.; Buckley, C.A. Co-Digestion of High-Strength/Toxic Organic Effluents in Anaerobic Digesters at Wastewater Treatment Works; Water Research Commission: Pretoria, South Africa, 2006. [Google Scholar]
  6. Achinas, S.; Euverink, G.J.W. Theoretical analysis of biogas potential prediction from agricultural waste. Resour. Effic. Technol. 2016, 2, 143–147. [Google Scholar] [CrossRef] [Green Version]
  7. Filer, J.; Huihuang, H.; Ding, H.H.; Chang, S. Biochemical methane potential (BMP) assay method for anaerobic digestion research. Water 2019, 11, 921. [Google Scholar] [CrossRef] [Green Version]
  8. Jingura, R.M.; Kamusoko, R. Methods for determination of biomethane potential of feedstocks: A review. Biofuel Res. J. 2017, 4, 573–586. [Google Scholar] [CrossRef]
  9. Ariunbaatar, J.; Esposito, G.; Yeh, D.H.; Lens, P.N.L. Enhanced anaerobic digestion of food waste by supplementing trace elements: Role of selenium (VI) and iron (II). Front. Environ. Sci. 2016, 4, 8. [Google Scholar] [CrossRef] [Green Version]
  10. Prabhudessai, V.; Ganguly, A.; Mutnuri, S. Biochemical methane potential of agro wastes. J. Energy. 2013, 2013, 350731. [Google Scholar] [CrossRef] [Green Version]
  11. Yeshanew, M.M.; Frunzo, L.; Lens, P.N.L.; Pirozzi, F.; Esposito, G. Mass loss controlled thermal pretreatment system to assess the effects of pretreatment temperature on organic matter solubilization and methane yield from food waste. Front. Environ. Sci. 2016, 4, 62. [Google Scholar] [CrossRef] [Green Version]
  12. Benn, N.; Zitomer, D. Pretreatment and anaerobic codigestion of selected PHB and PLA bioplastics. Front. Environ. Sci. 2018, 5, 93. [Google Scholar] [CrossRef] [Green Version]
  13. Hafner, S.D.; Koch, K.; Carrere, H.; Astals, S.; Weinrich, S.; Rennuit, C. Software for biogas research: Tools for measurement and prediction of methane production. SoftwareX 2018, 7, 205–210. [Google Scholar] [CrossRef]
  14. Raposo, F.; Borja, R.; Ibelli-Bianco, C. Predictive regression models for biochemical methane potential tests of biomass samples: Pitfalls and challenges of laboratory measurements. Renew. Sustain. Energy Rev. 2020, 127, 109890. [Google Scholar] [CrossRef]
  15. Koch, K.; Plabst, M.; Schmidt, A.; Helmreich, B.; Drewes, J.E. Co-digestion of food waste in a municipal wastewater treatment plant: Comparison of batch tests and full-scale experiences. Waste Manag. 2016, 47, 28–33. [Google Scholar] [CrossRef]
  16. Gandiglio, M.; Lanzini, A.; Soto, A.; Leone, P.; Santarelli, M. Enhancing the energy efficiency of wastewater treatment plants through co-digestion and fuel cell systems. Front. Environ. Sci. 2017, 5, 70. [Google Scholar] [CrossRef] [Green Version]
  17. Lippert, T.; Bandelin, J.; Musch, A.; Drewes, J.E.; Koch, K. Energy-positive sewage sludge pre-treatment with a novel ultrasonic flatbed reactor at low energy input. Bioresour. Technol. 2018, 264, 298–305. [Google Scholar] [CrossRef] [PubMed]
  18. Baird, R.B.; Eaton, A.D.; Rice, E.W. Standard Methods for the Examination of Water and Wastewater; American Public Health Association: Washington, DC, USA, 2017. [Google Scholar]
  19. Owen, W.F.; Stuckey, D.C.; Healy, J.B., Jr.; Young, L.Y.; McCarty, P.L. Bioassay for monitoring biochemical methane potential and anaerobic toxicity. Water Res. 1979, 13, 485–492. [Google Scholar] [CrossRef]
  20. Angelidaki, I.; Alves, M.; Bolzonella, D.; Borzacconi, L.; Campos, J.L.; Guwy, A.J.; Kalyuzhnyi, S.; Jenicek, P.; Van Lier, J.B. Defining the biomethane potential (BMP) of solid organic wastes and energy crops: A proposed protocol for batch assays. Water Sci. Technol. 2009, 59, 927–934. [Google Scholar] [CrossRef] [PubMed] [Green Version]
  21. Owens, J.M.; Chynoweth, D.P. Biochemical methane potential of municipal solid-waste (MSW) components. Water Sci. Technol. 1993, 27, 1–14. [Google Scholar] [CrossRef]
  22. Angelidaki, I.; Sanders, W. Assessment of the anaerobic biodegradability of macropollutants. Rev. Environ. Sci. Biotechnol. 2004, 3, 117. [Google Scholar] [CrossRef]
  23. Hansen, T.L.; Schmidt, J.E.; Angelidaki, I.; Marca, E.; La Cour Jansen, J.; Mosbæk, H.; Christensen, T.H. Method for determination of methane potentials of solid organic waste. Waste Manag. 2004, 24, 393. [Google Scholar]
  24. Rozzi, A.; Remigi, E. Methods of assessing microbial activity and inhibition under anaerobic conditions: A literature review. Rev. Environ. Sci. Biotechnol. 2004, 3, 93–115. [Google Scholar] [CrossRef]
  25. Fernandez, B.; Porrier, P.; Chamy, R. Effect of inoculum-substrate ratio on the start-up of solid waste anaerobic digesters. Water Sci. Technol. 2001, 44, 103–108. [Google Scholar] [CrossRef] [PubMed]
  26. Lin, J.G.; Ma, Y.S.; Chao, A.C.; Huang, C.L. BMP test on chemically pretreated sludge. Bioresour. Technol. 1999, 68, 187–192. [Google Scholar] [CrossRef]
  27. Muller, W.; Frommert, I.; Jörg, R. Standardized methods for anaerobic biodegradability testing. Rev. Environ. Sci. Biotechnol. 2004, 3, 141–158. [Google Scholar] [CrossRef]
  28. Pham, C.H.; Triolo, J.M.; Cu, T.T.T.; Pedersen, L.; Sommer, S.G. Validation and recommendation of methods to measure biogas production potential of animal manure. Asian Australas. J. Anim. Sci. 2013, 26, 864–873. [Google Scholar] [CrossRef] [Green Version]
  29. Möller, K.; Müller, T. Effects of anaerobic digestion on digestate nutrient availability and crop growth: A review. Eng. Life Sci. 2012, 12, 242–257. [Google Scholar] [CrossRef]
  30. VDI 4630. Fermentation of Organic Materials—Characterisation of the Substrate, Sampling, Collection of Material Data, Fermentation Tests; Verein Deutscher Ingenieure: Düsseldorf, Germany, 2016. [Google Scholar]
  31. ISO. ISO/DIS 14853:1999-04: Plastics—Determination of the Ultimate Anaerobic Biodegradability in an Aqueous System—Method by Measurement of Biogas Production; Bestimmmung der Vollständigen Anaeroben Bioabbaubarkeit in Einem Wässrigen System—Verfahren Mittels Messung von Biogasproduktion; ISO: Geneva, Switzerland, 1999. [Google Scholar]
  32. ISO. ISO 14853:2016: Plastics—Determination of the Ultimate Anaerobic Biodegradation of Plastic Materials in an Aqueous System—Method by Measurement of Biogas Production; ISO: Geneva, Switzerland, 2016; p. 28. [Google Scholar]
  33. ASTM International. ASTM D5511-94: Standard Test Method for Determining Anaerobic Biodegradation of Plastic Materials Under High-Solids Anaerobic-Digestion Conditions; ASTM International: West Conshohocken, PA, USA, 1994. [Google Scholar]
  34. ASTM International. ASTM 5210-1992: American Society for Testing and Materials: Test Method for Determining the Anaerobic Biodegradation of Plastic Materials in the Presence of Municipal Sewage Sludge; ASTM International: West Conshohocken, PA, USA, 1992. [Google Scholar]
  35. ASTM International. ASTM E 2170-2001: Test Method for Determining Anaerobic Biodegradation Potential of Organic Chemicals Under Methanogenic Conditions; ASTM International: West Conshohocken, PA, USA, 2001. [Google Scholar]
  36. Germany Institute for Normative. DIN 38414-8: Determination of the Amenability to Anaerobic Digestion (S8). German Standard Methods for the Examination of Water, Waste Water and Sludge: Sludge and Sediments (Group S); Deutsches Institut für Normung (Germany Institute for Normative): Koblenz, Germany, 1985. [Google Scholar]
  37. ISO. ISO 15473:2002: Qualité du Sol—Lignes Directrices Relatives aux Essais en Laboratoire pour la Biodégradation de Produits Chimiques Organiques dans le sol Sous Conditions Anaérobies, 1st ed.; ISO: Geneva, Switzerland, 2002; p. 13. [Google Scholar]
  38. ISO. ISO 11734:1995: Water Quality—Evaluation of the “Ultimate” Anaerobic Biodegradability of Organic Compounds in Digested Sludge—Method by Measurement of the Biogas Production, 1st ed.; ISO: Geneva, Switzerland, 1995; p. 13. [Google Scholar]
  39. Ohemeng-Ntiamoah, J.; Datta, T. Perspectives on variabilities in biomethane potential test parameters and outcomes: A review of studies published between 2007 and 2018. Sci. Total Environ. 2019, 664, 1052–1062. [Google Scholar] [CrossRef]
  40. Raposo, F.; Fernández-Cegrí, V.; De la Rubia, M.A.; Borja, R.; Béline, F.; Cavinato, C.; Demirer, G.; Fernández, B.; Fernández-Polanco, M.; Frigon, J.C.; et al. Biochemical methane potential (BMP) of solid organic substrates: Evaluation of anaerobic biodegradability using data from an international inter-laboratory study. J. Chem. Technol. Biotechnol. 2011, 86, 1088–1098. [Google Scholar] [CrossRef]
  41. Porqueddu, I.; Ficara, E.; Alibardi, L.; Bona, D.; Brina, A.; Calabrò, P.S.; Casaletta, E.; Cavinato, C.; Daffonchio, D.; De Gioannis, G.; et al. Results of an italian inter-laboratory study on biochemical methane potential. In Proceedings of the 13th World Congress on Anaerobic Digestion—Recovering (bio) Resources for the World, Santiago de Compostela, Spain, 25–28 June 2013. [Google Scholar]
  42. Bachmann, N.; Deront, M.; Fruteau, H.; Holliger, C.; Membrez, Y.; Wellinger, A. Optimisation des Tests Standardisés de Digestibilité dans des Reacteurs Batch; Office Fédéral de L’énergie OFEN: Ittigen, Switzerland, 2011; p. 79. [Google Scholar]
  43. Weinrich, S.; Schäfer, F.; Bochmann, G.; Liebetrau, J. Value of Batch Tests for Biogas Potential Analysis; Method Comparison and Challenges of Substrate and Efficiency Evaluation of Biogas Plants; Murphy, J.D., Ed.; IEA Bioenergy Task 37: Cork, Ireland, 2018; p. 10. ISBN 978-1-910154-49-6. (eBook electronic edition). [Google Scholar]
  44. KTBL/VDLUFA. Report for KTBL/VDLUFA Proficiency Test Biogas 2016; Edt. German Agricultural Analytic and Research Institutes (VDLUFA): Kassel, Germany; German Association for Technology and Structures in Agriculture (KTBL): Darmstadt, Germany, 2017. [Google Scholar]
  45. Holliger, C.; Alves, M.; Andrade, D.; Angelidaki, I.; Astals, S.; Baier, U.; Bougrier, C.; Buffière, P.; Carballa, M.; De Wilde, V.; et al. Towards a standardization of biomethane potential tests. Water Sci. Technol. 2016, 74, 2515–2522. [Google Scholar] [CrossRef]
  46. Hafner, S.D.; Fruteau de Laclos, H.; Koch, K.; Holliger, C. Improving inter-laboratory reproducibility in measurement of biochemical methane potential (BMP). Water 2020, 12, 1752. [Google Scholar] [CrossRef]
  47. VDLUFA. Measurement of Biogas and Methane Yields in Fermentation Tests; Verband Deutscher Landwirtschaftlicher Untersuchungsund Forschungsanstalten (VDLUFA): Speyer, Germany, 2011. [Google Scholar]
  48. Carrillo-Reyes, J.; Buitrón, G.; Moreno-Andrade, I.; Tapia-Rodríguez, A.C.; Palomo-Briones, R.; Razo-Flores, E.; Aguilar-Juárez, O.; Arreola-Vargas, J.; Bernet, N.; Ferreira Maluf Braga, A.; et al. Standardized protocol for determination of biohydrogen potential. MethodsX 2020, 7, 100754. [Google Scholar] [CrossRef]
  49. Pereira, C.P.P.; Castañares, G.; Lier, J.B. Van An OxiTop® protocol for screening plant material for its biochemical methane potential (BMP). Water Sci. Technol. 2012, 66, 1416–1423. [Google Scholar] [CrossRef] [PubMed]
  50. Hafner, S.D.; Rennuit, C.; Triolo, J.M.; Richards, B.K. Validation of a simple gravimetric method for measuring biogas production in laboratory experiments. Biomass Bioenergy 2015, 83, 297–301. [Google Scholar] [CrossRef]
  51. Justesen, C.G.; Astals, S.; Mortensen, J.R.; Thorsen, R.; Koch, K.; Weinrich, S.; Triolo, J.M.; Hafner, S.D. Development and validation of a low-cost gas density method for measuring biochemical methane potential (BMP). Water 2019, 11, 2431. [Google Scholar] [CrossRef] [Green Version]
  52. Amodeo, C.; Hafner, S.D.; Teixeira Franco, R.; Benbelkacem, H.; Moretti, P.; Bayard, R.; Buffière, P. How different are manometric, gravimetric, and automated volumetric BMP results? Water 2020, 12, 1839. [Google Scholar] [CrossRef]
  53. ISO. NF ISO 5725: Application de la Statistique—Exactitude (Justesse et Fidélité) des Résultats et Méthodes de Mesure; ISO: Geneva, Switzerland, 1994. [Google Scholar]
  54. ISO. ISO 13528:2015: Méthodes Statistiques Utilisées dans les Essais D’aptitude par Comparaison Interlaboratoires; ISO: Geneva, Switzerland, 2016; p. 95. [Google Scholar]
  55. Madigan, M.T.; Marinko, J.M.; Parker, J. Brock Biology of Microorganisms, 9th ed.; Prentice Hall: New York, NY, USA, 2000. [Google Scholar]
  56. APHA 2540-G: Standard Methods for the Examination of Water and Wastewater, 20th ed.; American Public Health Association; American Water Works Association and Water Environment Federation: Washington, DC, USA, 1998.
  57. Buswell, A.M.; Müller, H.F. Mechanism of methane fermentation. Ind. Eng. Chem. 1952, 44, 550–552. [Google Scholar] [CrossRef]
  58. Boyle, W.C. Energy recovery from sanitary landfills a review. In Microbial Energy Conversion; Schlegel, H.G., Barnea, S., Eds.; Pergamon Press: Oxford, UK, 1976. [Google Scholar]
  59. Kouas, M.; Torrijos, M.; Sousbie, P.; Steyer, J.P.; Sayadi, S.; Harmand, J. Robust assessment of both biochemical methane potential and degradation kinetics of solid residues in successive batches. Waste Manag. 2017, 70, 59–70. [Google Scholar] [CrossRef]
  60. Martinez-Sosa, D.; Torrijos, M.; Buitron, G.; Sousbie, P.; Devillers, P.H.; Delgenès, J.P. Treatment of fatty solid waste from the meat industry in an anaerobic sequencing batch reactor: Start-up period and establishment of the design criteria. Water Sci Technol. 2009, 60, 2245–2251. [Google Scholar] [CrossRef] [Green Version]
  61. Pearse, L.F.; Hettiaratchi, J.P.; Kumar, S.; Moreno-Andrade, I.; Buitrón, G. Towards developing a representative biochemical methane potential (BMP) assay for landfilled municipal solid waste–A review. Water Sci. Technol. 2018, 49, 312–324. [Google Scholar] [CrossRef] [PubMed]
  62. Raposo, F.; De La Rubia, M.A.; Fernández-Cegrí, V.; Borja, R. Anaerobic digestion of solid organic substrates in batch mode: An overview relating to methane yields and experimental procedures. Renew. Sustain. Energy Rev. 2012, 16, 861–877. [Google Scholar] [CrossRef]
  63. Nilsson Påledal, S.; Hellman, E.; Moestedt, J. The effect of temperature, storage time and collection method on biomethane potential of source separated household food waste. Waste Manag. 2018, 71, 636–643. [Google Scholar] [CrossRef]
  64. Elbeshbishy, E.; Nakhla, G.; Hafez, H. Biochemical methane potential (BMP) of food waste and primary sludge: Influence of inoculum pre-incubation and inoculum source. Bioresour. Technol. 2012, 110, 18–25. [Google Scholar] [CrossRef] [PubMed]
  65. Dechrugsa, S.; Kantachote, D.; Chaiprapat, S. Effects of inoculum to substrate ratio, substrate mix ratio and inoculum source on batch co-digestion of grass and pig manure. Bioresour. Technol. 2013, 146, 101–108. [Google Scholar] [CrossRef] [PubMed]
  66. Fabbri, A.; Serranti, S.; Bonifazi, G. Biochemical methane potential (BMP) of artichoke waste: The inoculum effect. Waste Manag. Res. J. Sustain. Circ. Econ. 2014, 32, 207–214. [Google Scholar] [CrossRef] [PubMed]
  67. Hülsemann, B.; Zhou, L.; Merkle, W.; Hassa, J.; Müller, J.; Oechsner, H. Biomethane potential test: Influence of inoculum and the digestion system. Appl. Sci. 2020, 10, 2589. [Google Scholar] [CrossRef] [Green Version]
  68. De Vrieze, J.; Raport, L.; Willems, B.; Verbrugge, S.; Volcke, E.; Meers, E.; Angenent, L.T.; Boon, N. Inoculum selection influences the biochemical methane potential of agro-industrial substrates. Microb. Biotechnol. 2015, 8, 776–786. [Google Scholar] [CrossRef]
  69. Hagen, L.H.; Vivekanand, V.; Pope, P.B.; Eijsink, V.G.H.; Horn, S.J. The effect of storage conditions on microbial community composition and biomethane potential in a biogas starter culture. Appl. Microbiol. Biotechnol. 2015, 99, 5749–5761. [Google Scholar] [CrossRef]
  70. Steinmetz, R.L.R.; Mezzari, M.P.; Busi da Silva, M.L.; Airton Kunz, A.; Cestonaro do Amaral, A.; Tápparo, D.C.; Moreira Soares, H. Enrichment and acclimation of an anaerobic mesophilic microorganism’s inoculum for standardization of BMP assays. Bioresour. Technol. 2016, 219, 21–28. [Google Scholar] [CrossRef] [Green Version]
  71. Wang, B.; Strömberg, S.; Nges, I.A.; Nistor, M.; Liu, J. Impacts of inoculum pre-treatments on enzyme activity and biochemical methane potential. J. Biosci. Bioeng. 2016, 121, 557–560. [Google Scholar] [CrossRef]
  72. Koch, K.; Lippert, T.; Drewes, J.E. The role of inoculum’s origin on the methane yield of different substrates in biochemical methane potential (BMP) tests. Bioresour. Technol. 2017, 243, 457–463. [Google Scholar] [CrossRef]
  73. Astals, S.; Koch, K.; Weinrich, S.; Hafner, S.D.; Tait, S.; Peces, M. Impact of storage conditions on the methanogenic activity of anaerobic digestion inocula. Water 2020, 12, 1321. [Google Scholar] [CrossRef]
  74. Hafner, S.D.; Richards, B.K.; Astals, S.; Holliger, C.; Koch, K.; Weinrich, S. Calculation of Methane Production from Gravimetric Measurements. Standard BMP Methods Document 203, Version 1.0. Available online: https://www.dbfz.de/en/BMP (accessed on 19 April 2020).
  75. Wang, B.; Björn, A.; Strömberg, S.; Achu Nges, I.; Nistor, M.; Liu, J. Evaluating the influences of mixing strategies on the Biochemical Methane Potential test. J. Environ. Manag. 2017, 185, 54–59. [Google Scholar] [CrossRef] [PubMed]
  76. Valero, D.; Montes, J.A.; Rico, J.L.; Rico, C. Influence of headspace pressure on methane production in Biochemical Methane Potential (BMP) tests. Waste Manag. 2016, 48, 193–198. [Google Scholar] [CrossRef] [PubMed] [Green Version]
  77. Himanshu, H.; Voelklein, M.A.; Murphy, J.D.; Grant, J.; O’Kiely, P. Factors controlling headspace pressure in a manual manometric BMP method can be used to produce a methane output comparable to AMPTS. Bioresour. Technol. 2017, 238, 633–642. [Google Scholar] [CrossRef] [PubMed]
  78. Koch, K.; Bajón Fernandez, Y.; Drewes, J.E. Influence of headspace flushing on methane production in Biochemical Methane Potential (BMP) tests. Bioresour. Technol. 2015, 186, 173–178. [Google Scholar] [CrossRef] [PubMed]
  79. Koch, K.; Hafner, S.D.; Astals, S.; Weinrich, S. Evaluation of common supermarket products as positive controls in Biochemical Methane Potential (BMP) Tests. Water 2020, 12, 1223. [Google Scholar] [CrossRef]
  80. Kleinheinz, G.; Hernandez, G. Comparison of two laboratory methods for the determination of biomethane potential of organic feedstocks. J. Microbiol. Methods 2016, 130, 54–60. [Google Scholar] [CrossRef] [PubMed]
  81. Koch, K.; Hafner, S.D.; Weinrich, S.; Astals, S. Identification of critical problems in biochemical methane potential (BMP) tests from methane production curves. Front. Environ. Sci. 2019, 7, 178. [Google Scholar] [CrossRef]
  82. Cresson, R.; Pommier, S.; Béline, F.; Bouchez, T.; Bougrier, C.; Buffière, P.; Cacho, J.; Camacho, P.; Mazéas, L.; Pauss, A.; et al. Etude Interlaboratoires pour L’harmonisation des Protocoles de Mesure du Potentiel Bio-Methanogène des Matrices Solides Hétérogènes—Rapport Final; ADEME: Paris, France, 2014; pp. 1–121. [Google Scholar]
  83. Cresson, R.; Pommier, S.; Beline, F.; Bouchez, T.; Bougrier, C.; Buffière, P.; Pauss, A.; Pouech, P.; Preys, S.; Ribeiro, T. Results from a French Inter-Laboratory Campaign on the Biological Methane Potential of Solid Substrates. 2015. Available online: https://hal.archives-ouvertes.fr/hal-01947463/ (accessed on 27 August 2020).
Figure 1. Schedule of the methodology applied during this inter-laboratory study.
Water 12 02814 g001
Figure 2. Schematic and organizational schedule of the inter-laboratory study; this process was carried out twice (phases 1 and 2).
Water 12 02814 g002
Figure 3. Overview of the existing experimental practices among the lab protocols, for the first phase of the inter-laboratory study. Numbers refer to the 13 lab results.
Water 12 02814 g003
Figure 4. Summary of BMP values measured for the results of the first phase—free protocols showing intra-laboratory repeatability and intra-laboratory reproducibility: (a) SA; (b) SA’; (c) SB.
Water 12 02814 g004aWater 12 02814 g004b
Figure 5. Box plots for the results of the first phase—free protocols: (a) SA; (b) SA’; (c) SB.
Water 12 02814 g005aWater 12 02814 g005b
Figure 6. Scatterplot SA vs SA’, mean values and standard deviation for each lab.
Water 12 02814 g006
Figure 7. Summary of BMP values measured for the results of the second phase—harmonized protocol showing intra-laboratory repeatability and intra-laboratory reproducibility: (a) SA’; (b) SB; (c) SC.
Water 12 02814 g007aWater 12 02814 g007b
Figure 8. Box plots for the results of the second phase—harmonized protocols: (a) SA’; (b) SB; (c) SC.
Water 12 02814 g008aWater 12 02814 g008b
Figure 9. Box plots for the variables Method (ac) and Gas measurement (df) for SA’, SB and SC.
Water 12 02814 g009
Table 1. Numbers of expected, removed and considered values for the data curation and statistical analysis of the first phase.
Values for the 1st Phase SASA’SB
Number of expected values787878
Number of removed values171019
Number of considered values616859
Table 2. Numbers of expected, removed and considered values for the data curation and statistical analysis of the secondphase.
Values for the 2nd Phase SA’SBSC
Number of expected values756969
Number of removed values61613
Number of considered values695356
Table 3. Composition and main characteristics of the substrates used in the inter-laboratory study.
SubstrateComposition (% w)Main Characteristics
SAPotato
Grain maize
Beef
Wheat straw
Total
40%
20%
30%
10%
100%
Complex composition (mix of compounds easily and slowly biodegradable)
High heterogeneity
High content of moisture
SA’Idem SA but dried and shredded (1 mm)100%Complex composition (same as SA)
Homogeneous
Dry
SBWheat straw100%Unique substrate slowly biodegradable
Homogeneous
Dry
SCMayonnaise100%Lipidic substrate
Homogeneous
Immiscible with water
Table 4. Composition of the nutritive solution used in the second phase.
ChemicalsConcentration (g L−1)
NH4Cl26.6
KH2PO410
MgCl2·6H2O6
CaCl2·2H2O3
FeCl2·4H2O2
CoCl2·6H2O0.5
MnCl2·4H2O0.1
NiCl2·6H2O0.1
ZnCl20.05
H3BO30.05
Na2SeO30.05
CuCl2·2H2O0.04
Na2MoO4·2H2O0.01
Table 5. Composition of the substrates used in the inter-laboratory study.
Substraten *TS (%)VS (% TS)Theoretical BMP (NmL CH4/gVS) **
SA1130.20 ± 2.2895.22 ± 1.25476
SA’2197.09 ± 0.9294.43 ± 1.06476
SB2291.86 ± 1.7992.13 ± 2.87499
SC1074.49 ± 1.7998.66 ± 0.261013
* n was the number of independent triplicates analyzed by all the labs, including the 2 phases for SA’ and SB, only the first phase for SA and the second phase for SC. ** The theoretical BMP was determined from calculation described in the Appendix A.
Table 6. Synthesis for the first phase of the French inter-laboratory study.
BMP (NmLCH4 gVS−1)SASA’SB
Mean425403267
Median422407267
Min289250175
Max629481370
Intra-laboratory repeatability RSD7%4%6%
Intra-laboratory reproducibility RSD9%6%8%
Inter-laboratory reproducibility RSD20%17%20%
Table 7. Synthesis for the second phase of the French inter-laboratory study.
BMP (NmLCH4 gVS−1)SA’SBSC
Mean405277848
Median408282828
Min260195660
Max5253701026
Intra-laboratory repeatability RSD4%4%4%
Intra-laboratory reproducibility RSD5%7%5%
Inter-laboratory reproducibility RSD19%21%13%
Table 8. Synthesis of the French inter-laboratory study.
Intra- and Inter-Laboratory RSDs Harmonized Protocol
Intra-laboratory repeatability RSD4%
Intra-laboratory reproducibility RSD6%
Inter-laboratory reproducibility RSD18%
Table 9. ANOVA with 4 factors for SA’, SB and SC.
VariableFactorData Number
SA’SBSC
Total695356
MethodAutomatic221411
Manual473945
Gas measurementManometric292427
Volumetric402929
Table 10. Size of ANOVA with 4 factors for SA’, SB and SC.
FactorSubstrateFD *Sum of SquaresFp-Value
MethodSA’137,297.73418.207<0.0001
SB131,758.84624.33<0.0001
SC170,302.02813.3490.001
Gas measurementSA’111,076.3714.5060.038
SB112,932.6887.6190.008
SC1100,817.88621.958<0.0001
* FD: Freedom degree; F: Law’s Fisher.

