An Improved Configuration of Vertical-Flow Mesh Tube Filters for Seawater Pretreatment: Performance, Cleaning, and Energy Consumption


Abstract

1. Introduction
2. Materials and Methods
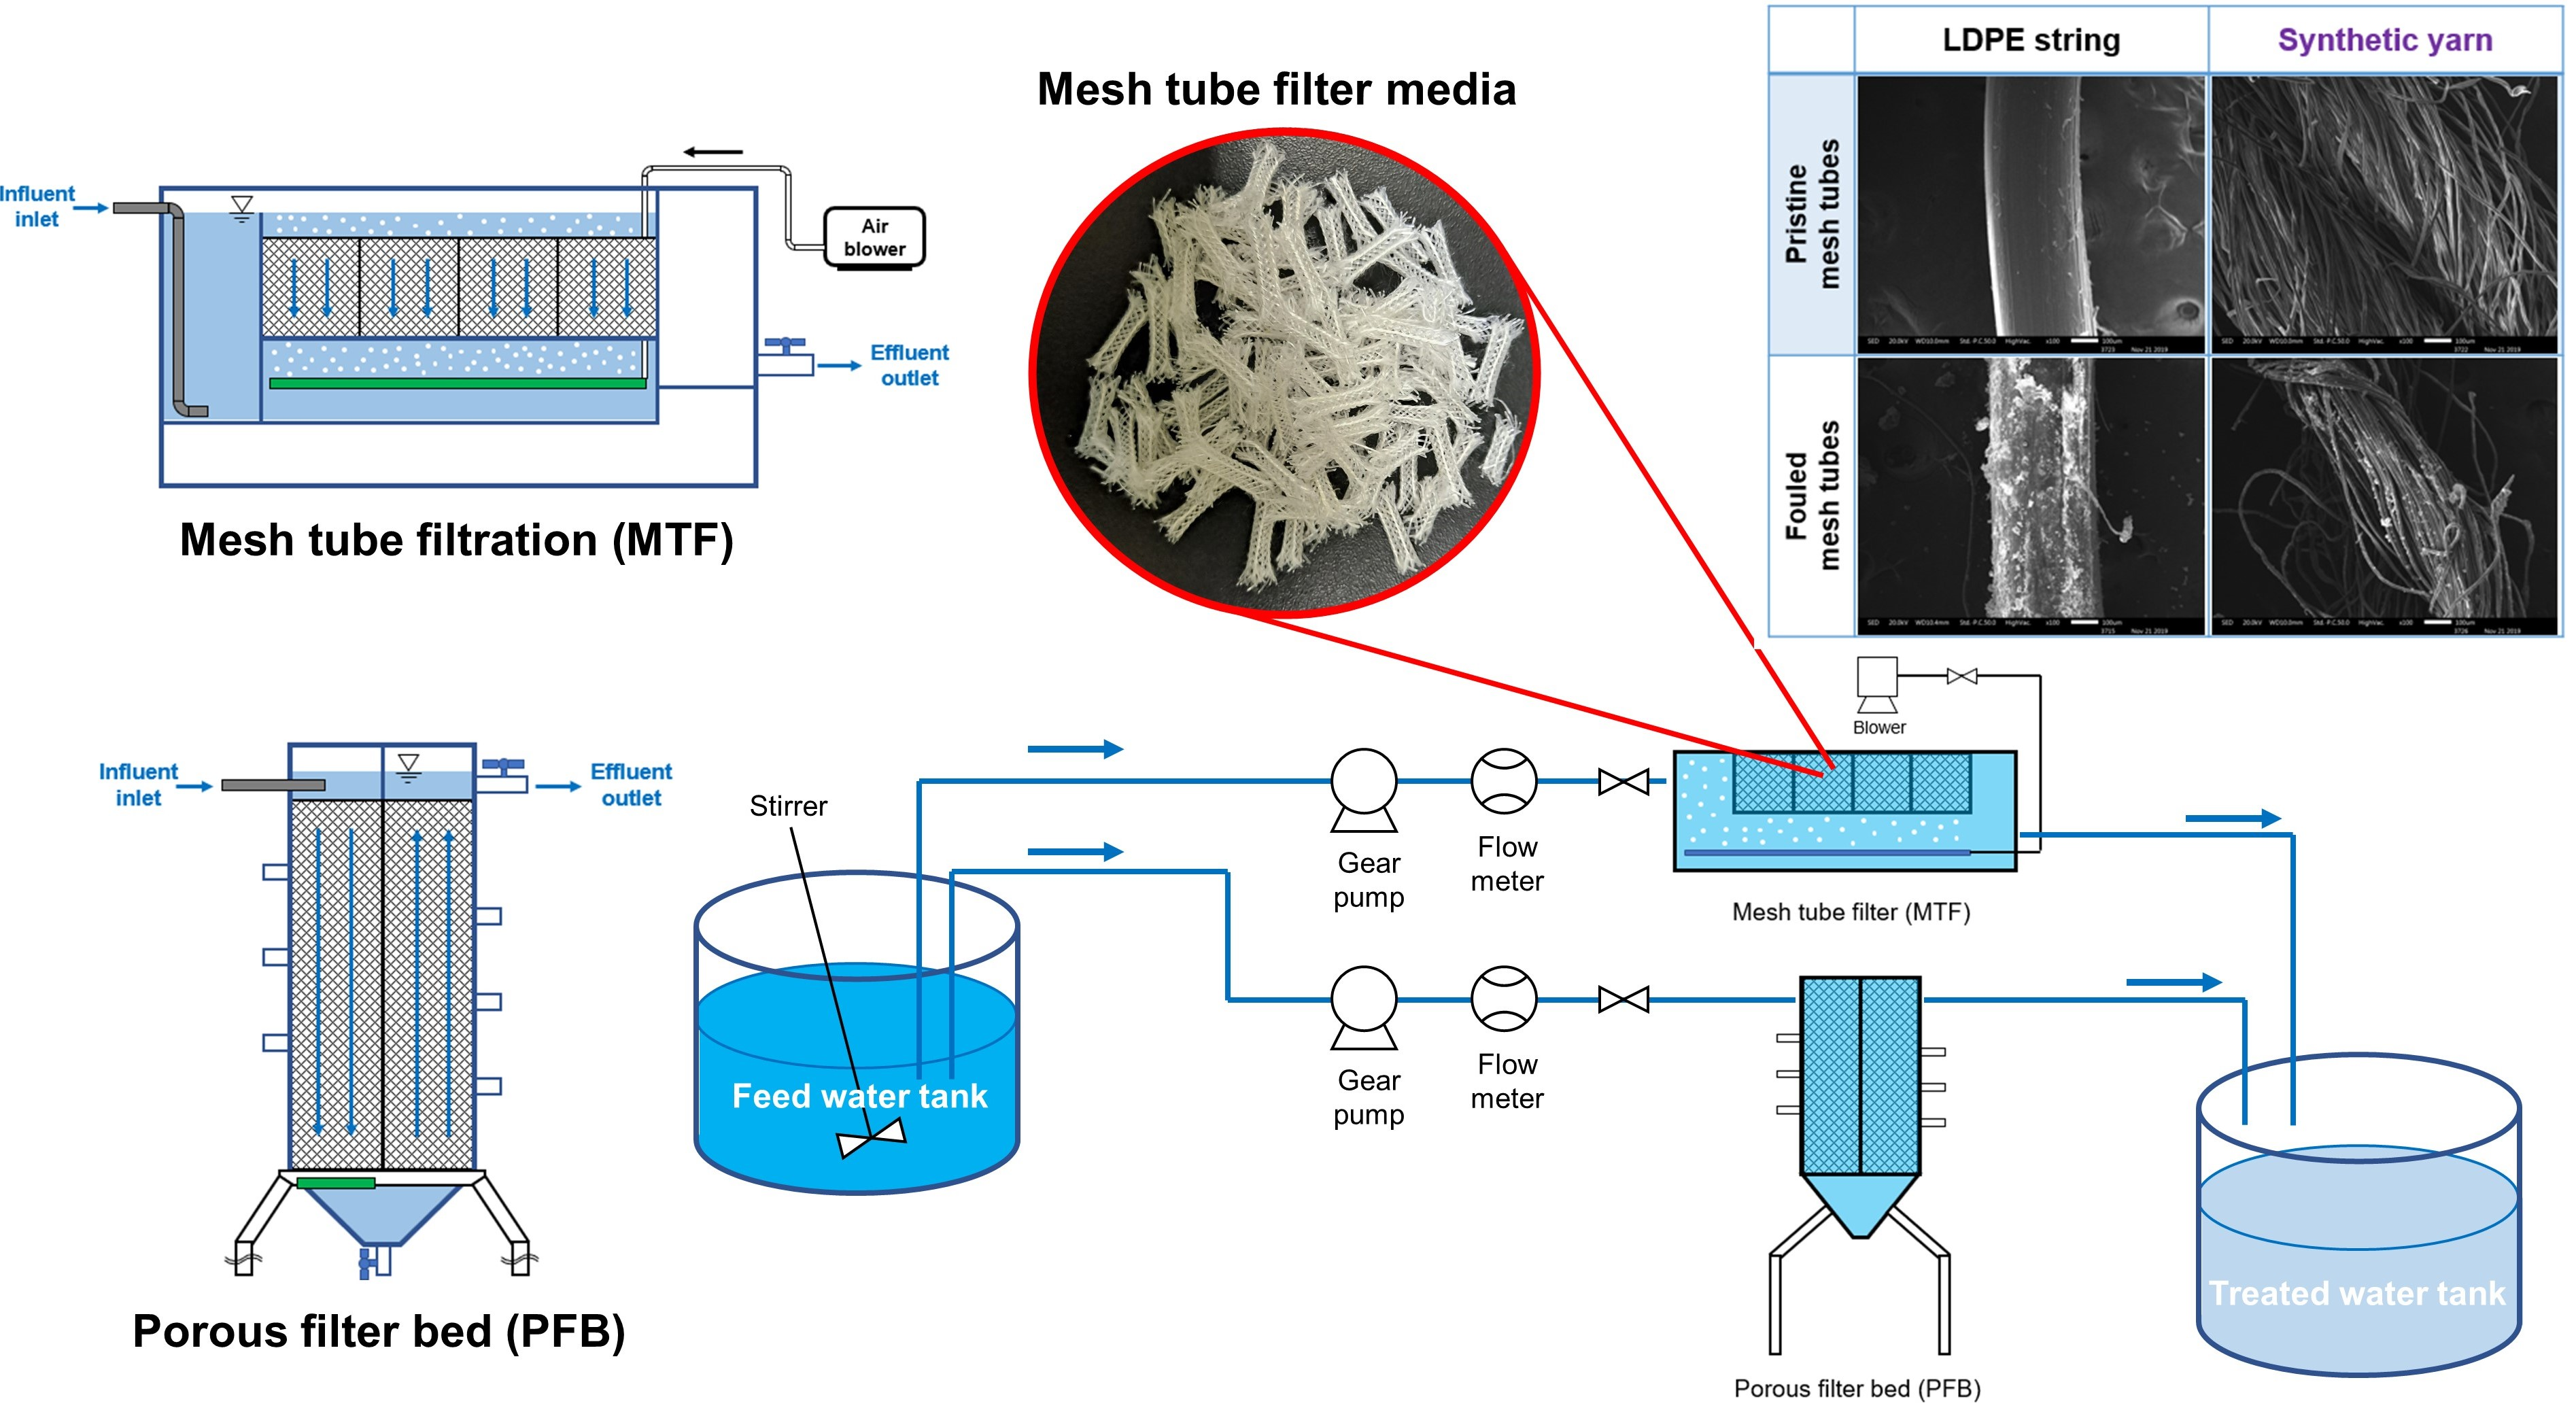
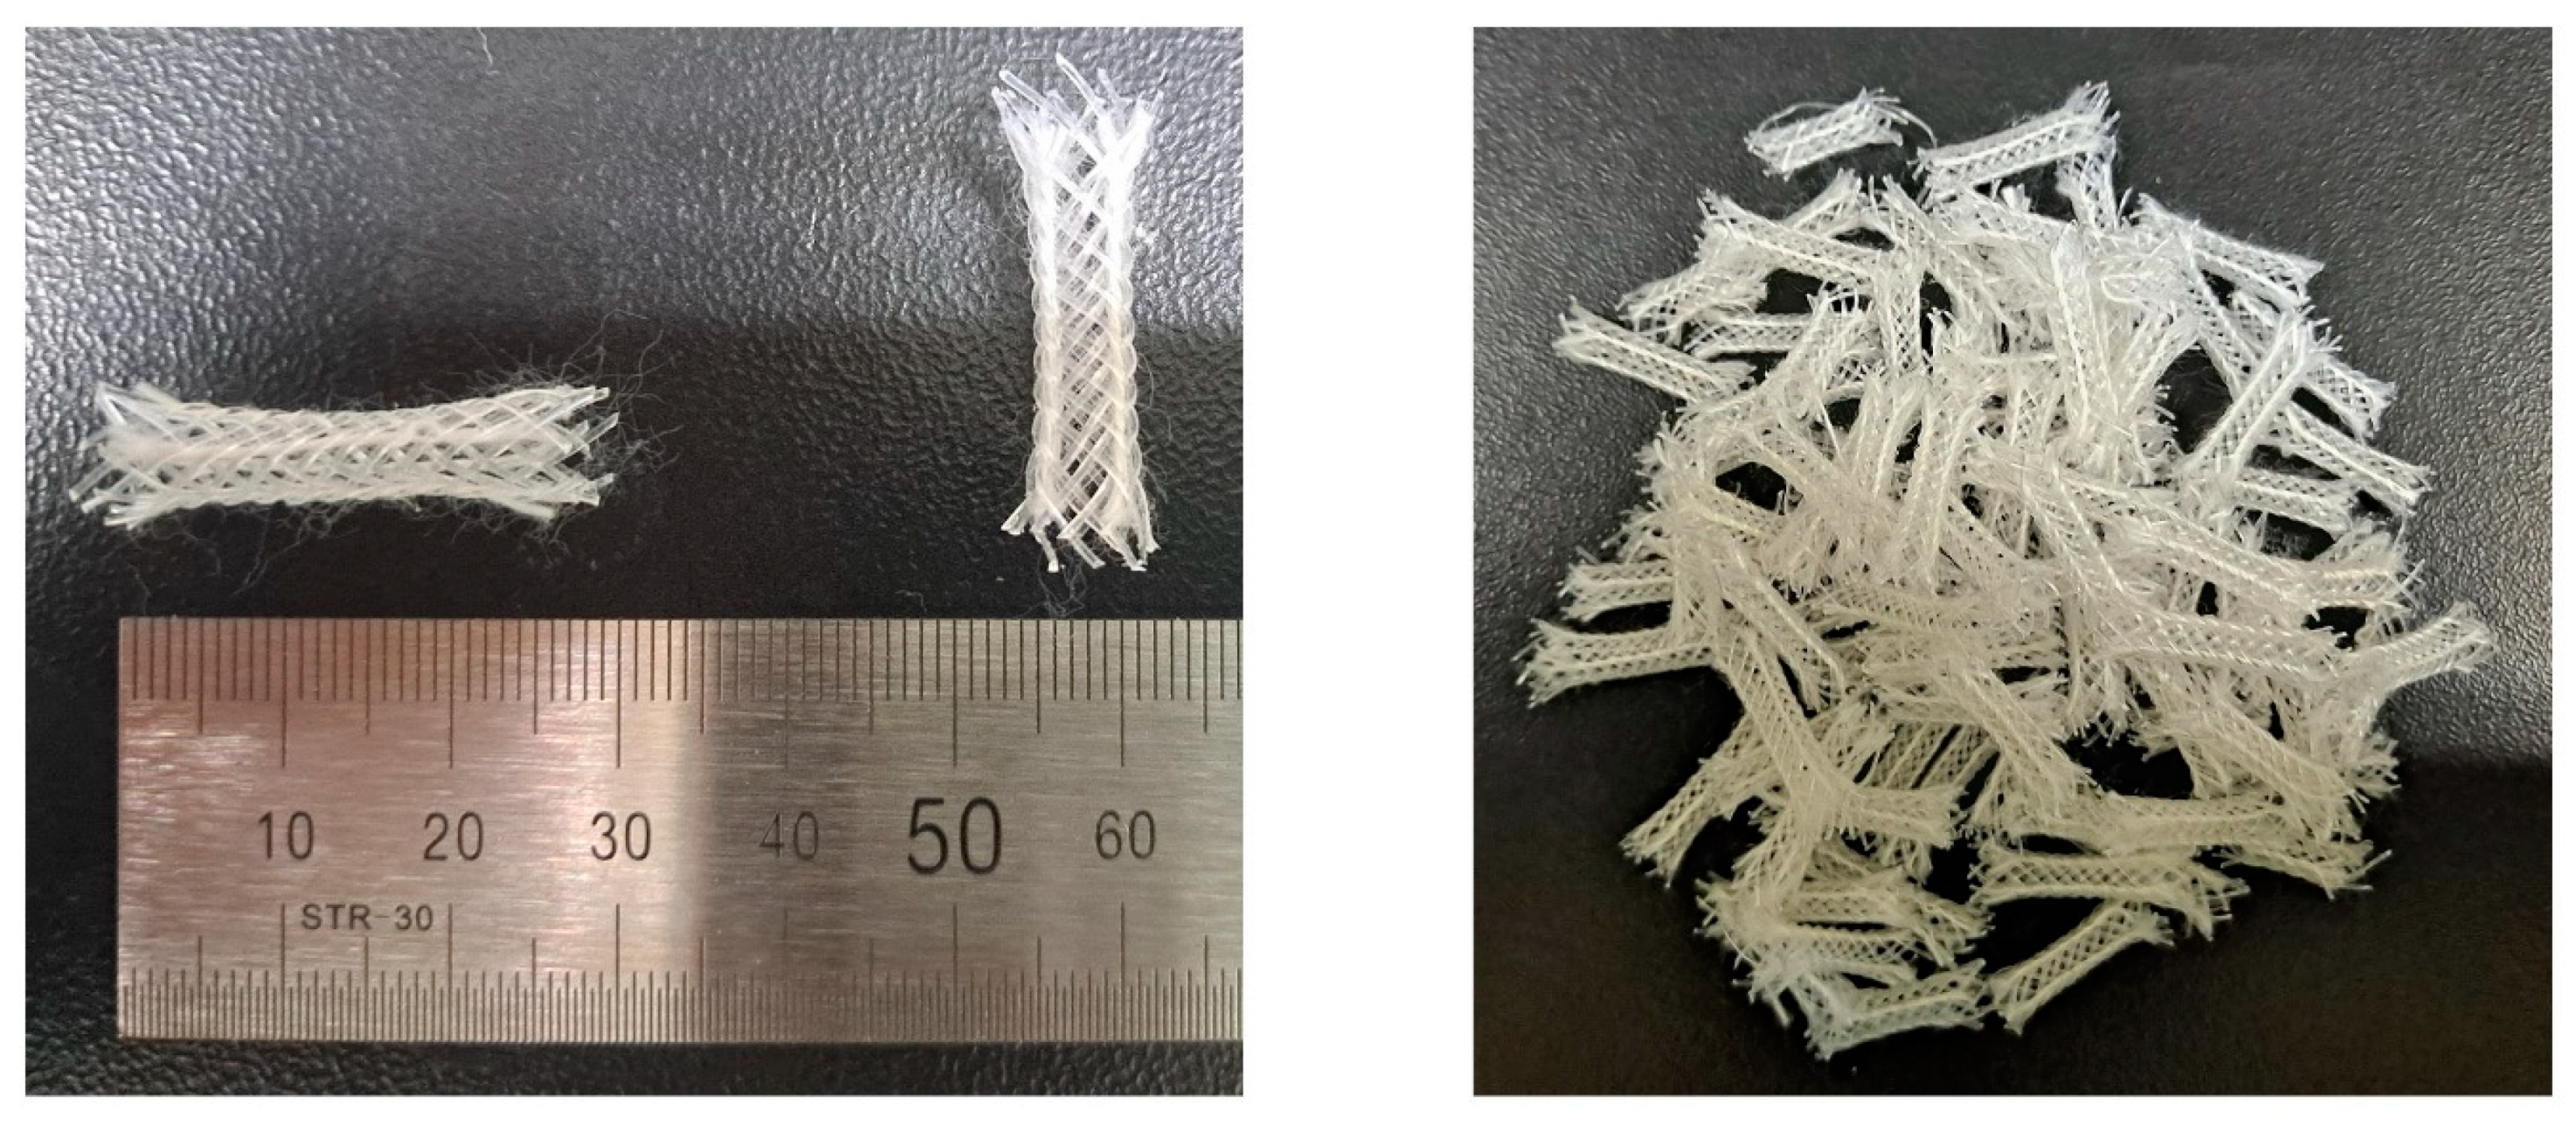
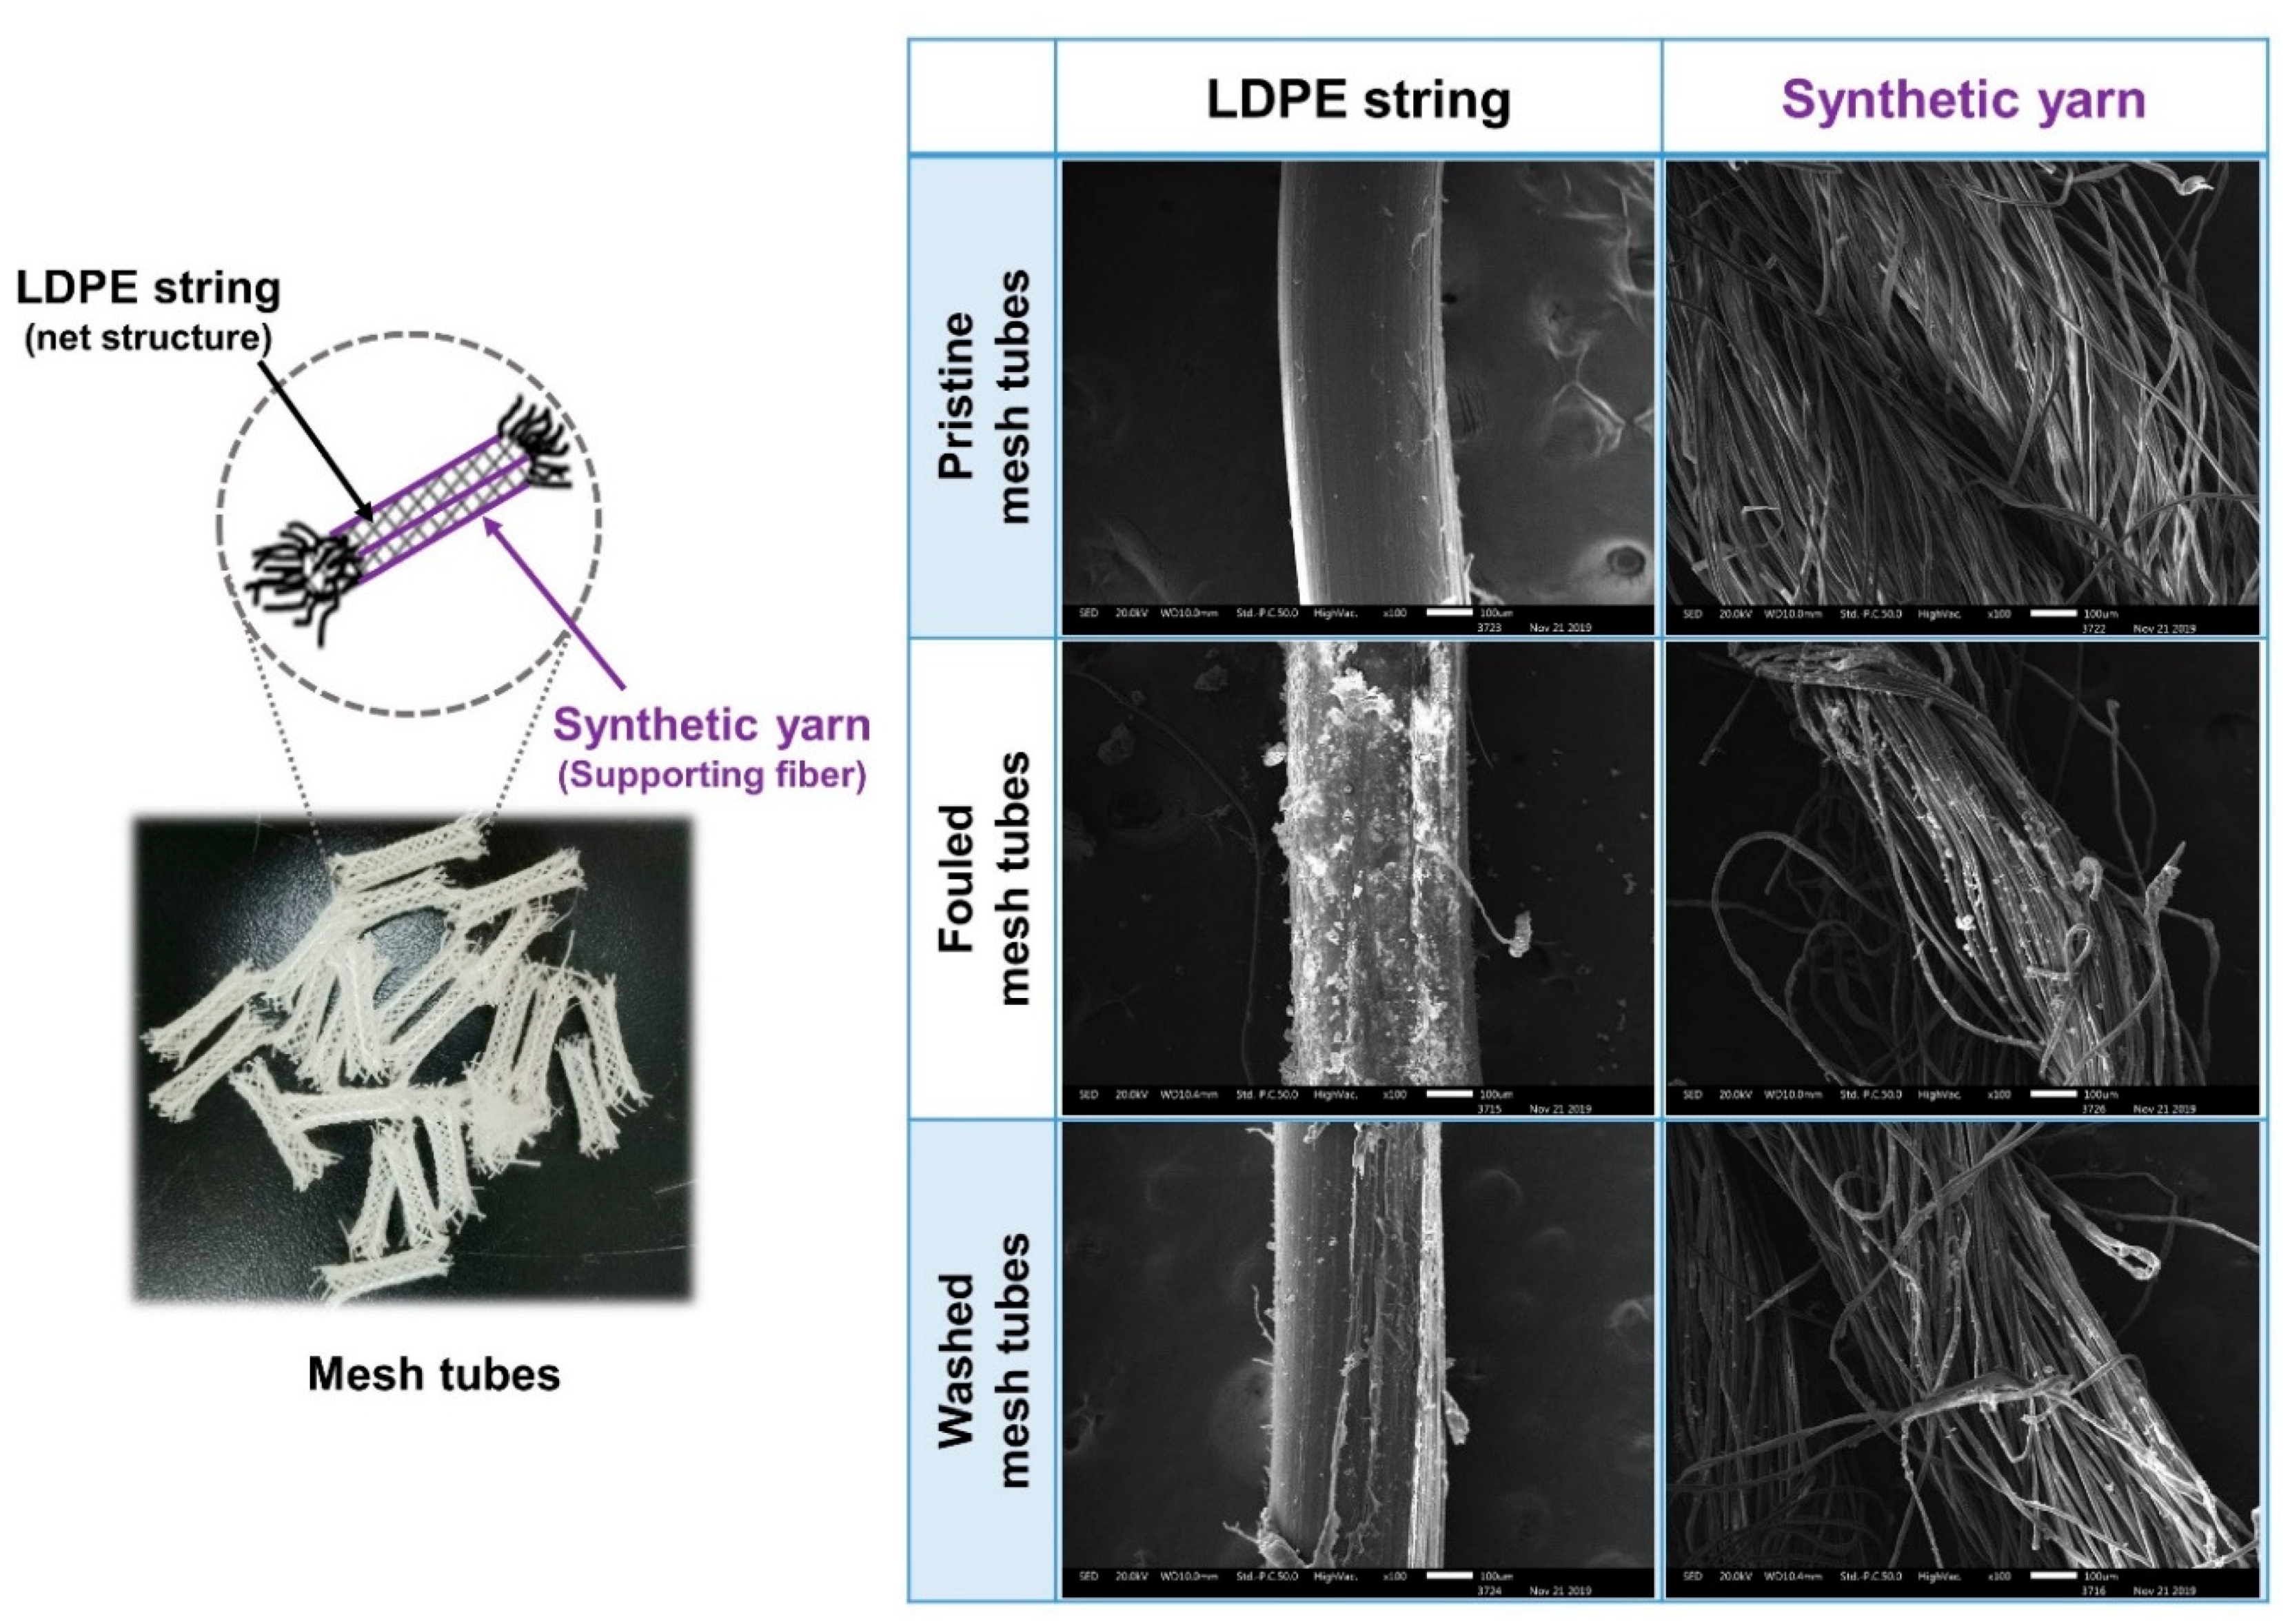
2.1. MTF Media
2.2. Characterization of Suspended Particles (SPs)
2.3. Suspended Particle Filtration Experiments
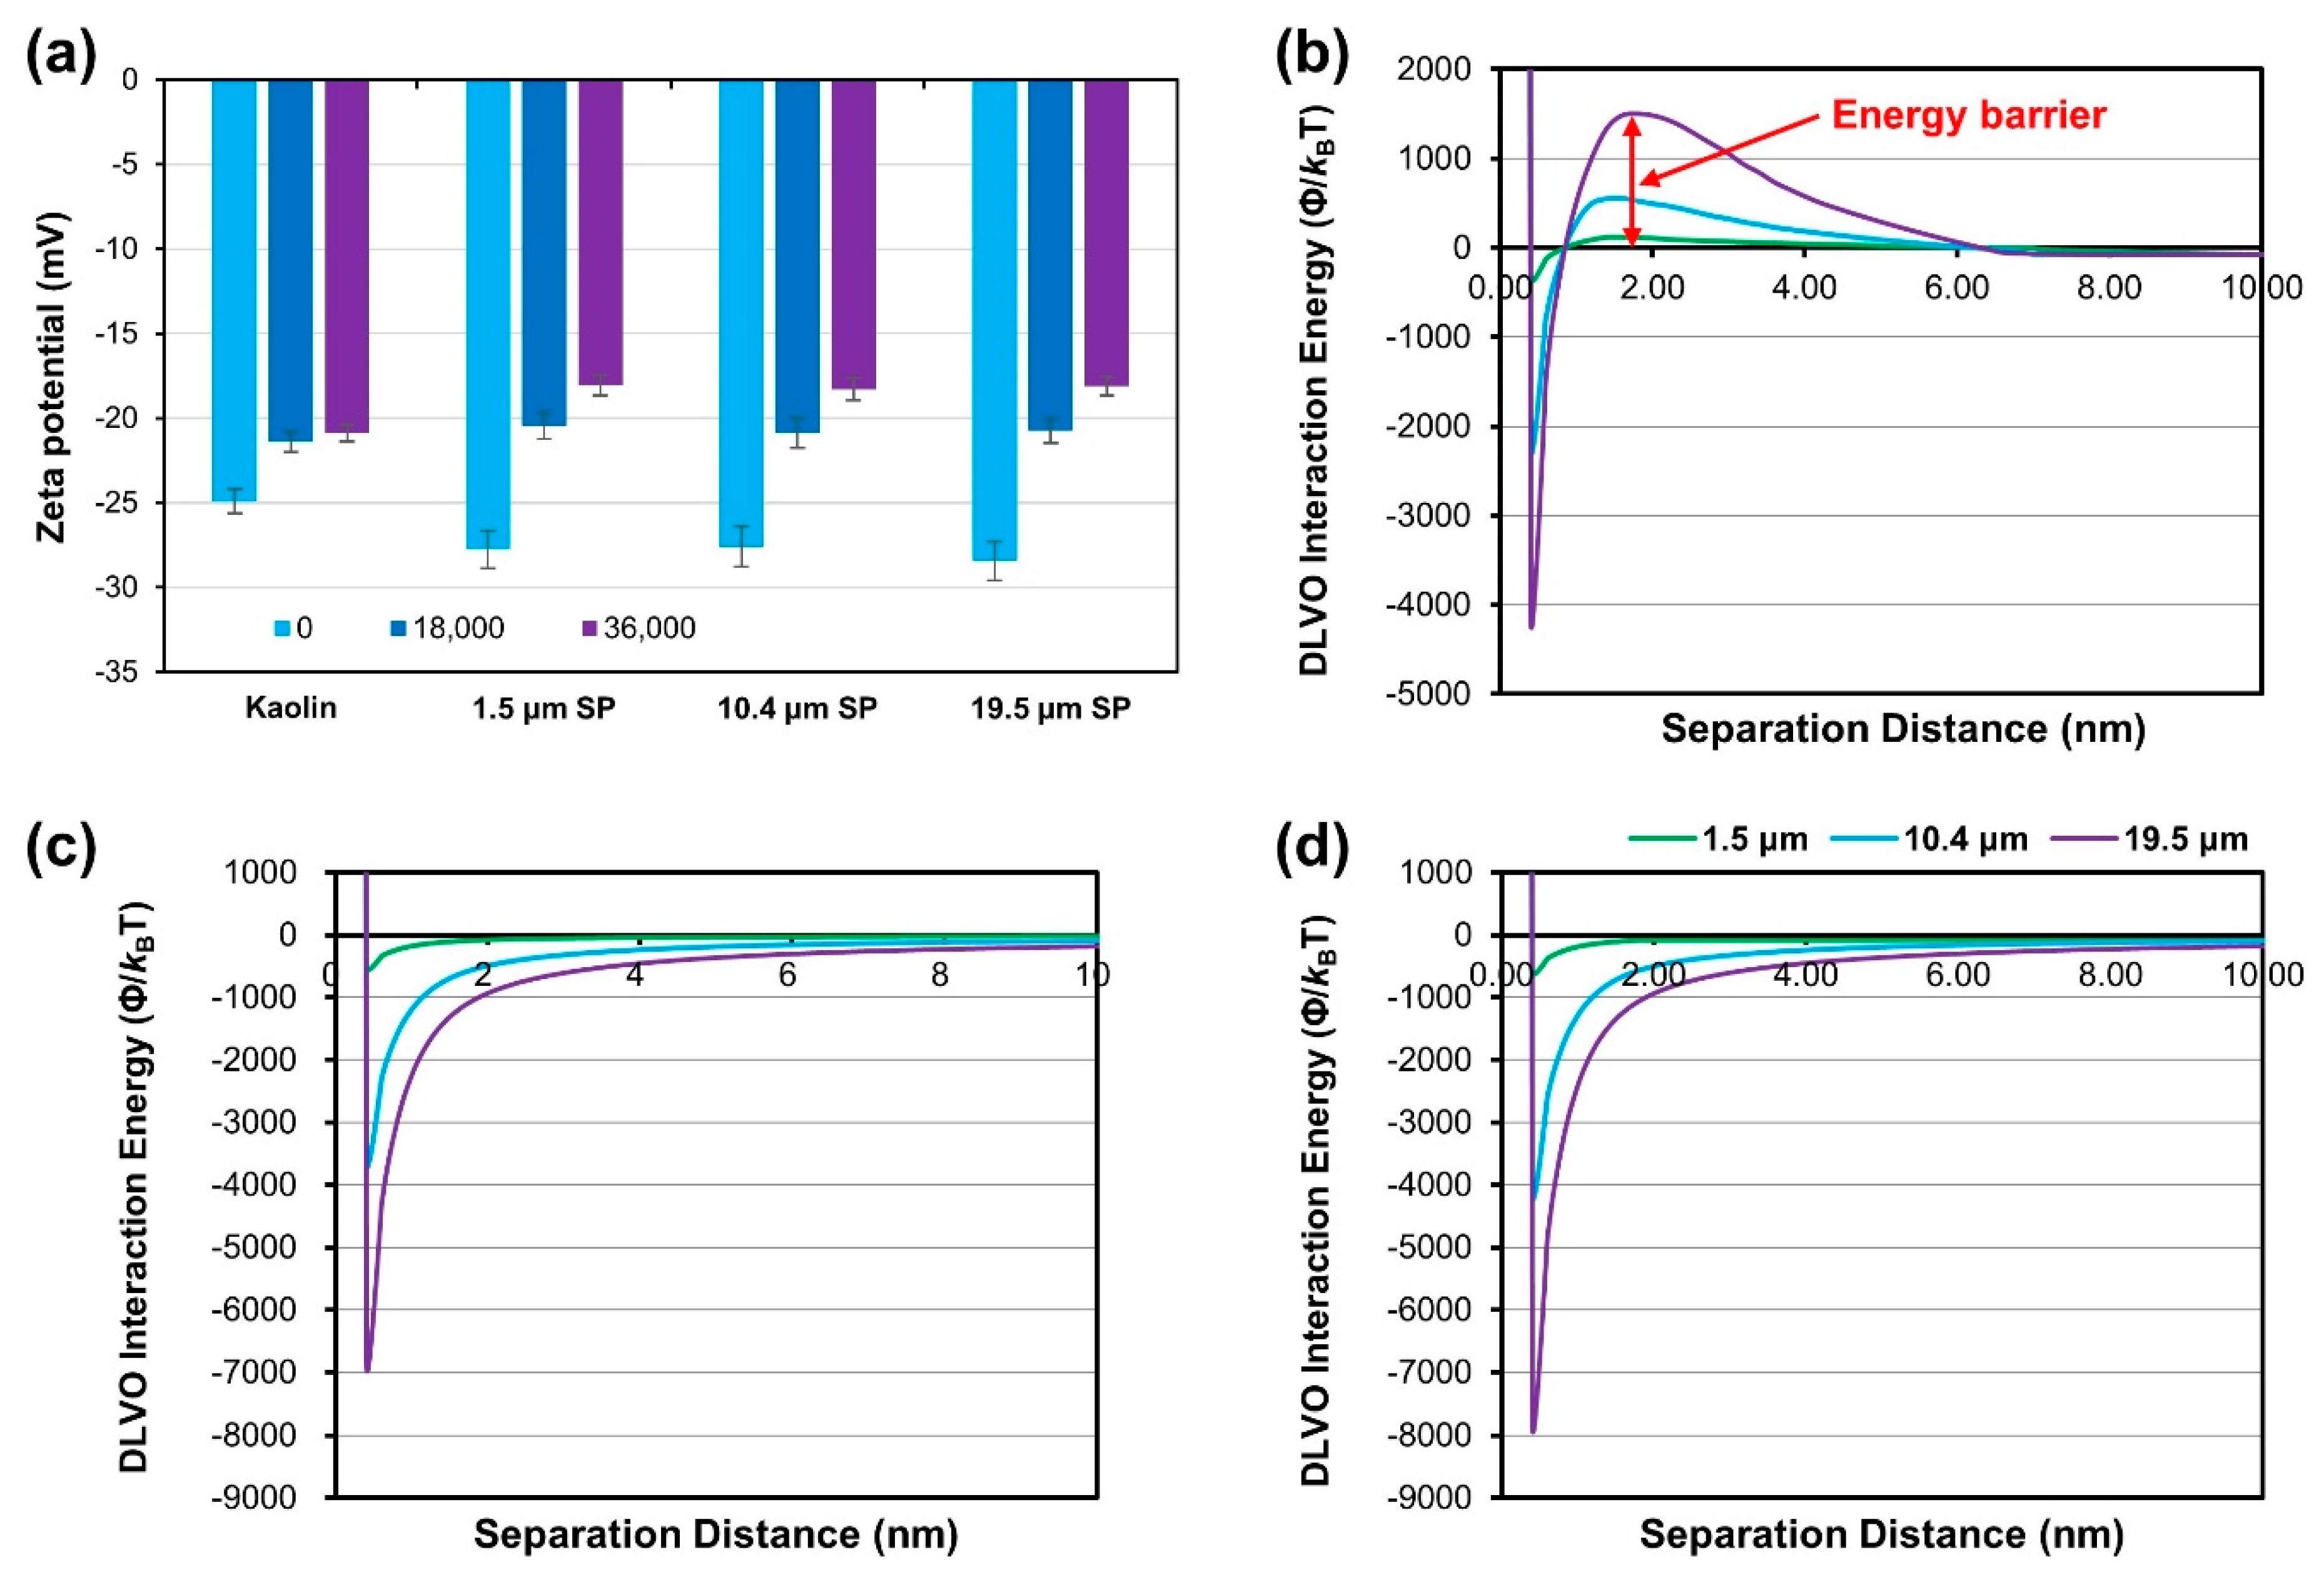
2.4. DLVO Interaction Energy Calculation
2.5. Computational Fluid Dynamics (CFD) Modeling of MTF and PFB for Specific Energy Consumption (SEC) Calculation
2.6. Field Experiments Using Natural Seawater and Secondary Wastewater Effluent
2.7. Organic Suspended Matter Analysis Using LC–OCD
3. Results and Discussion
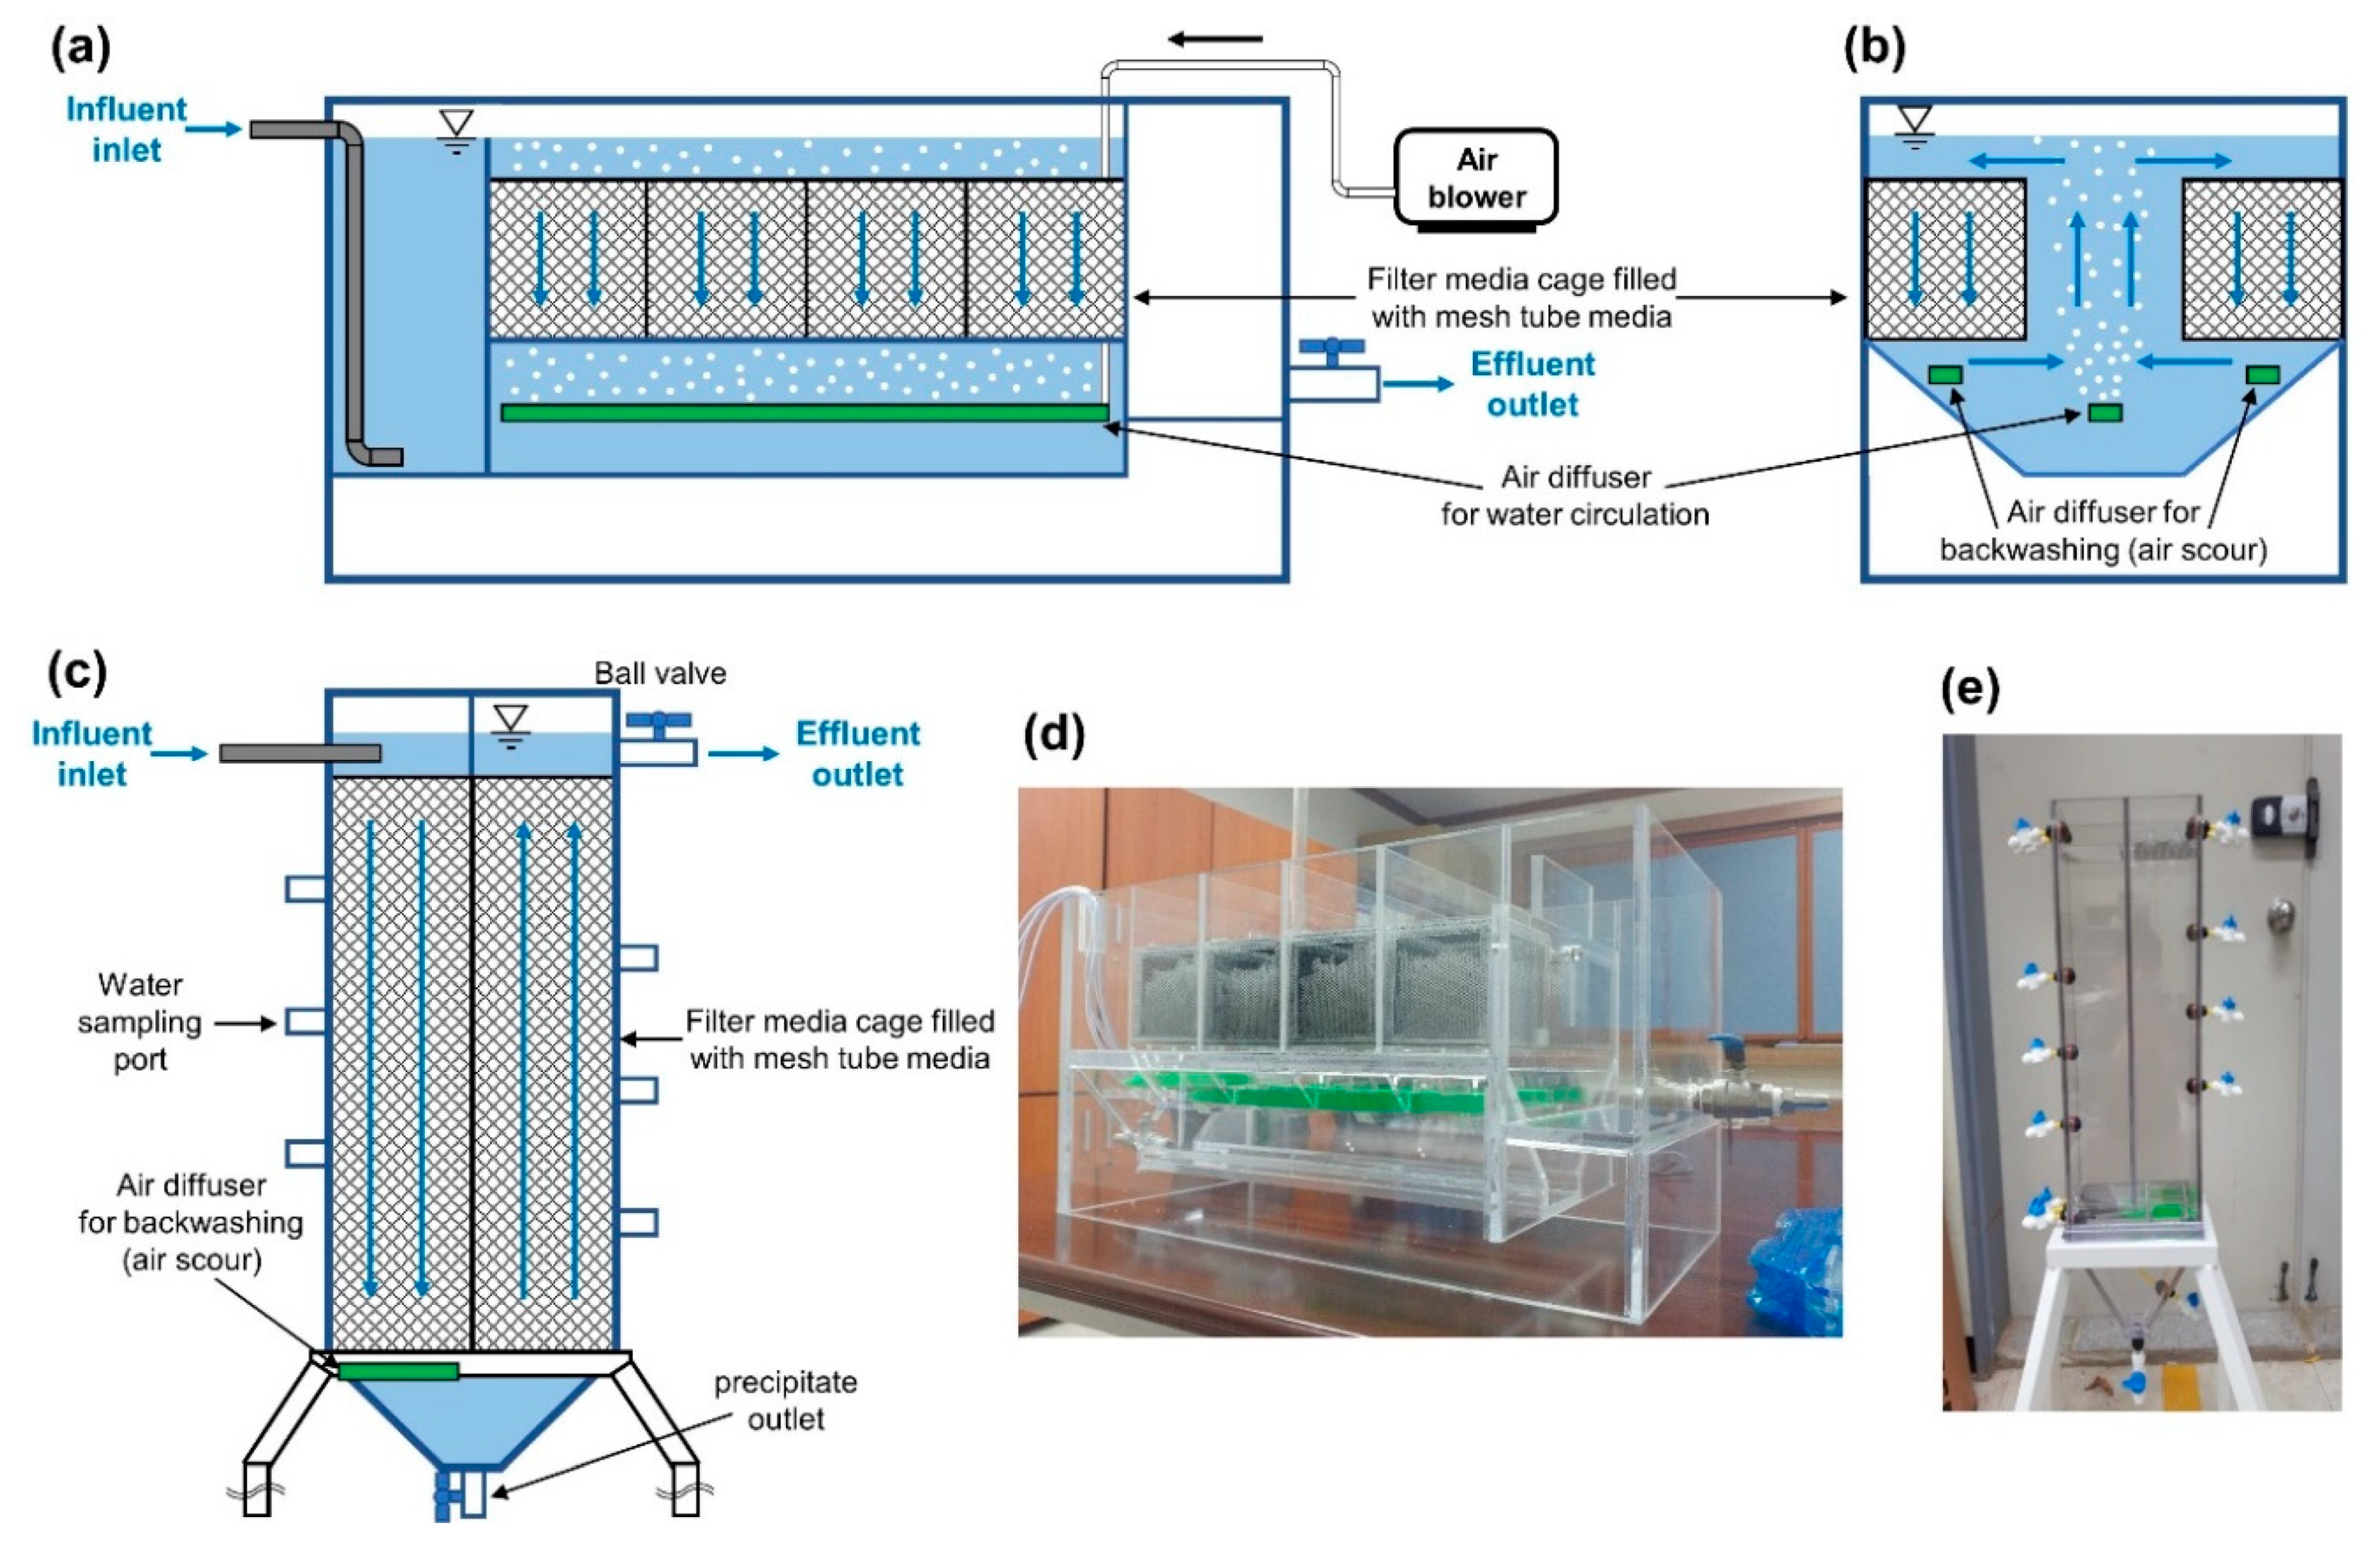
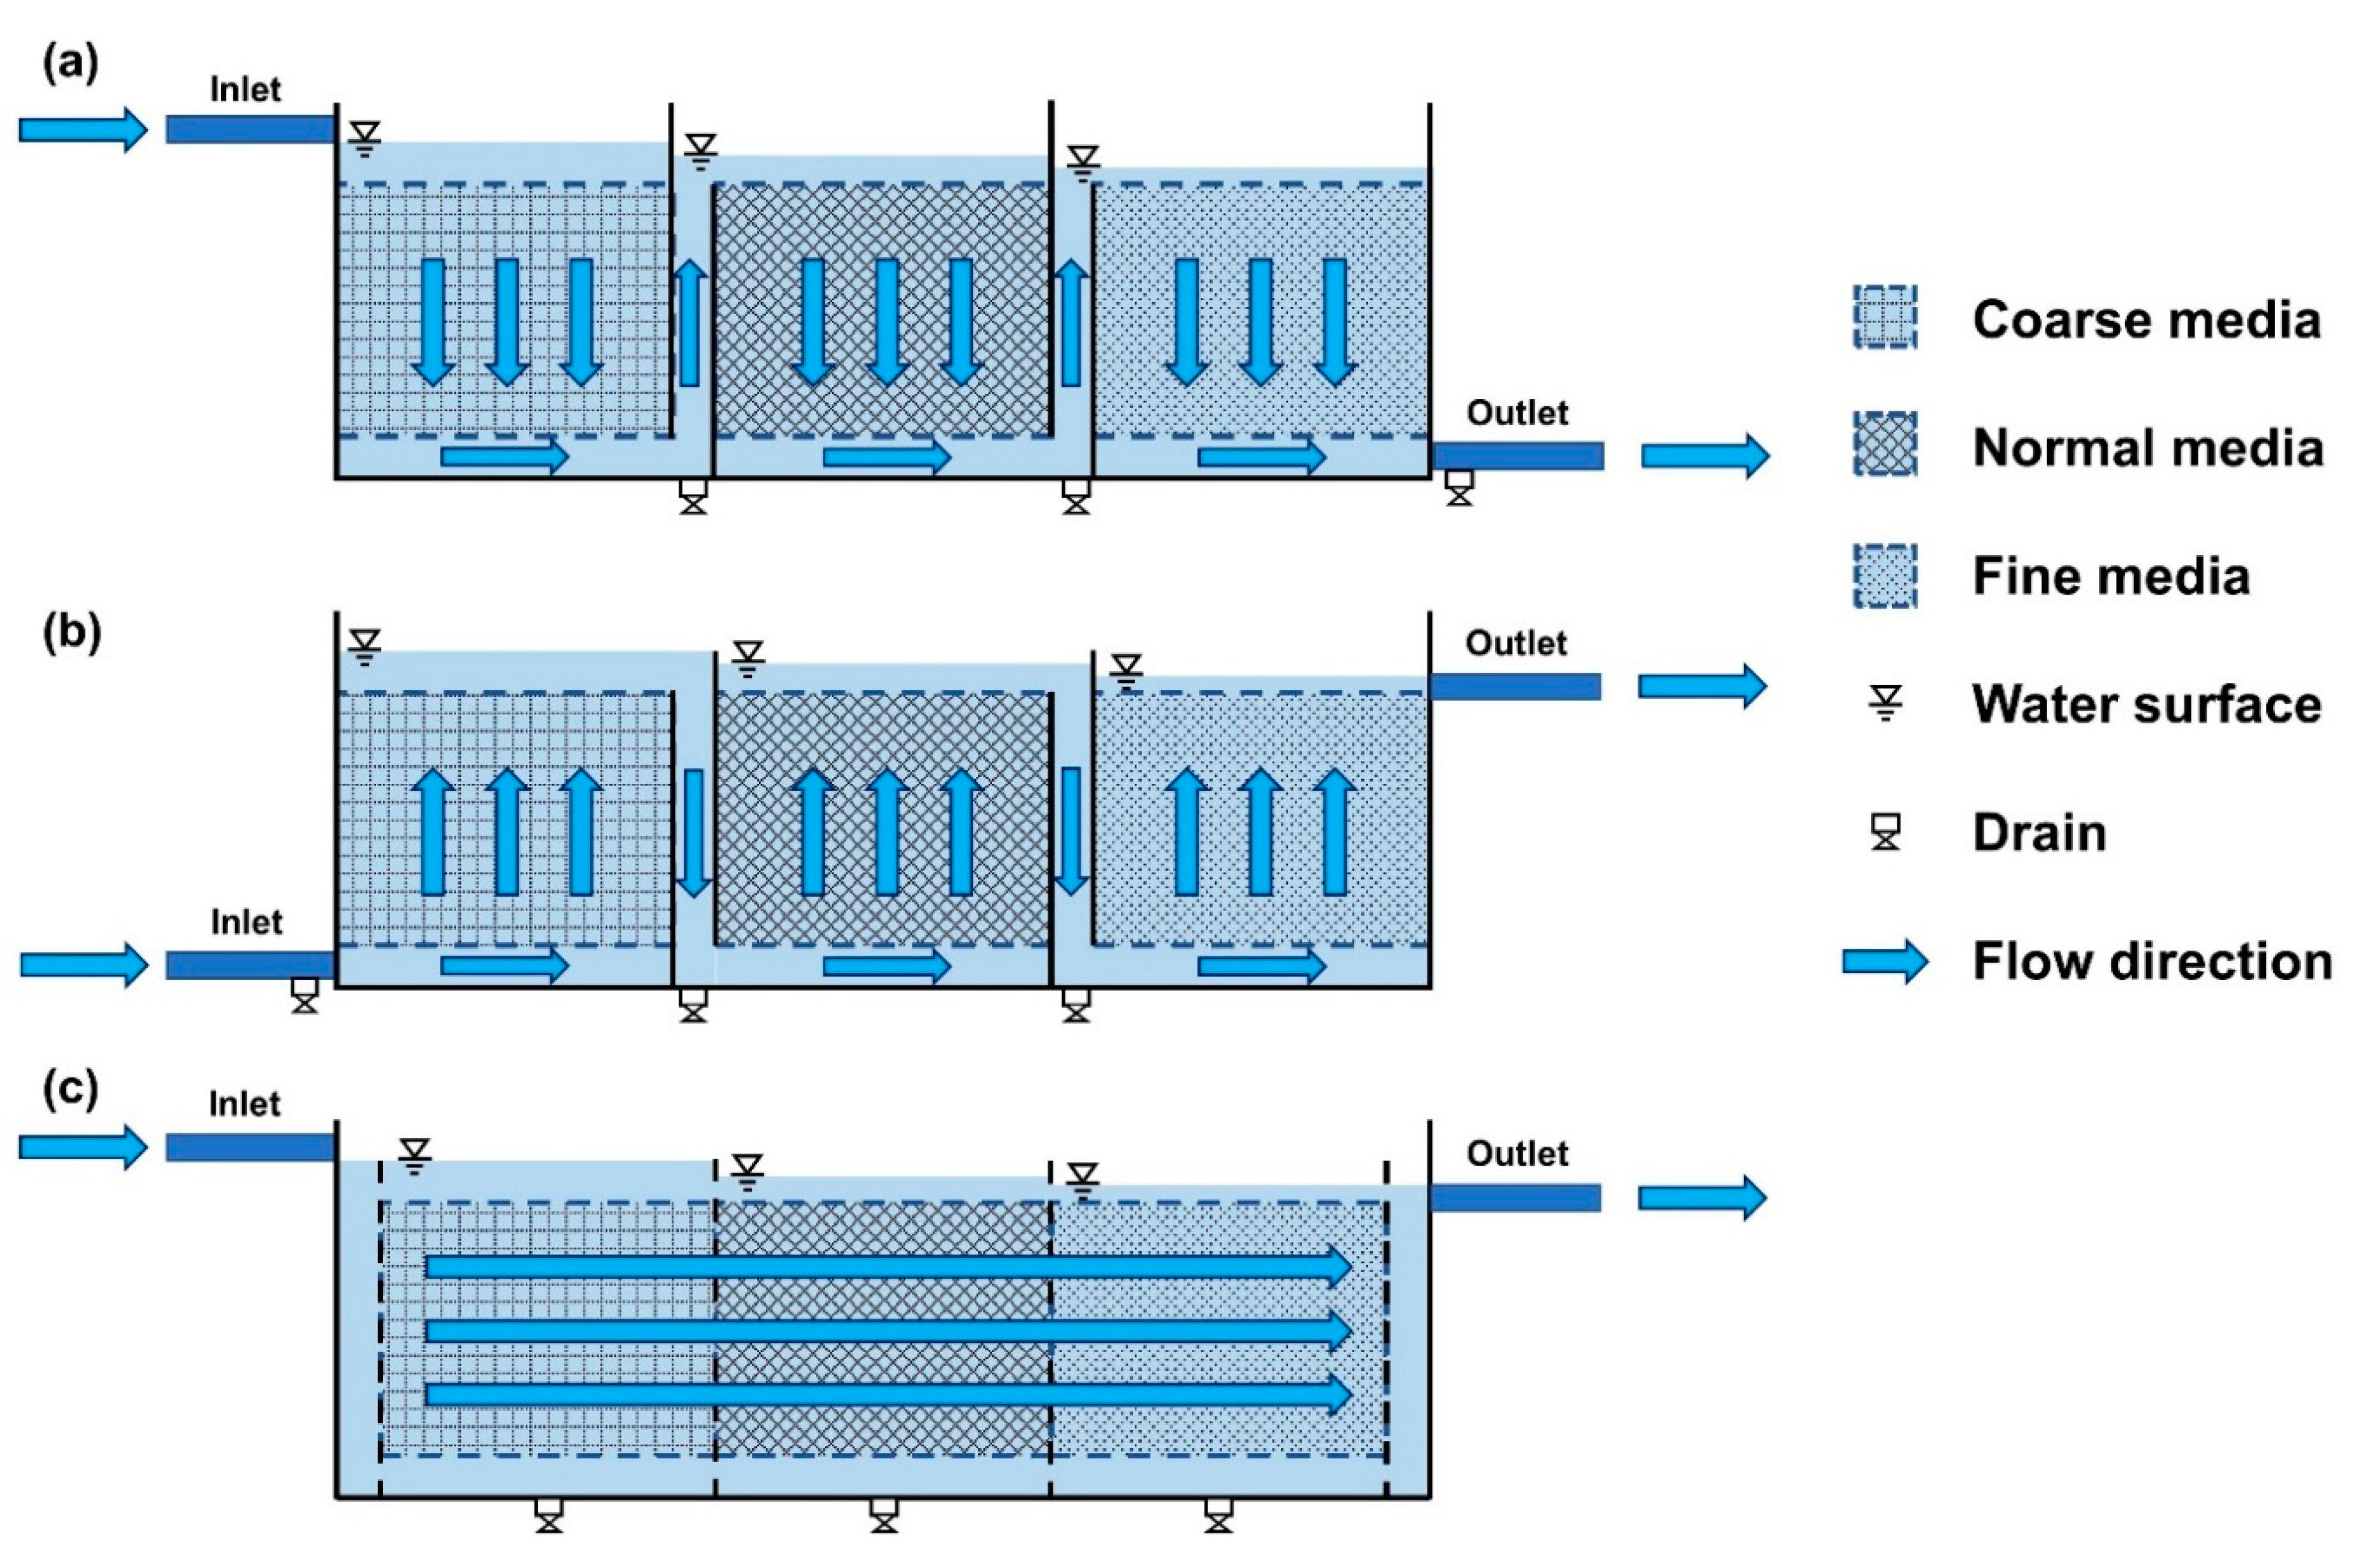
3.1. Fluid Flow Analysis of Two Vertical-Flow Roughing Filters
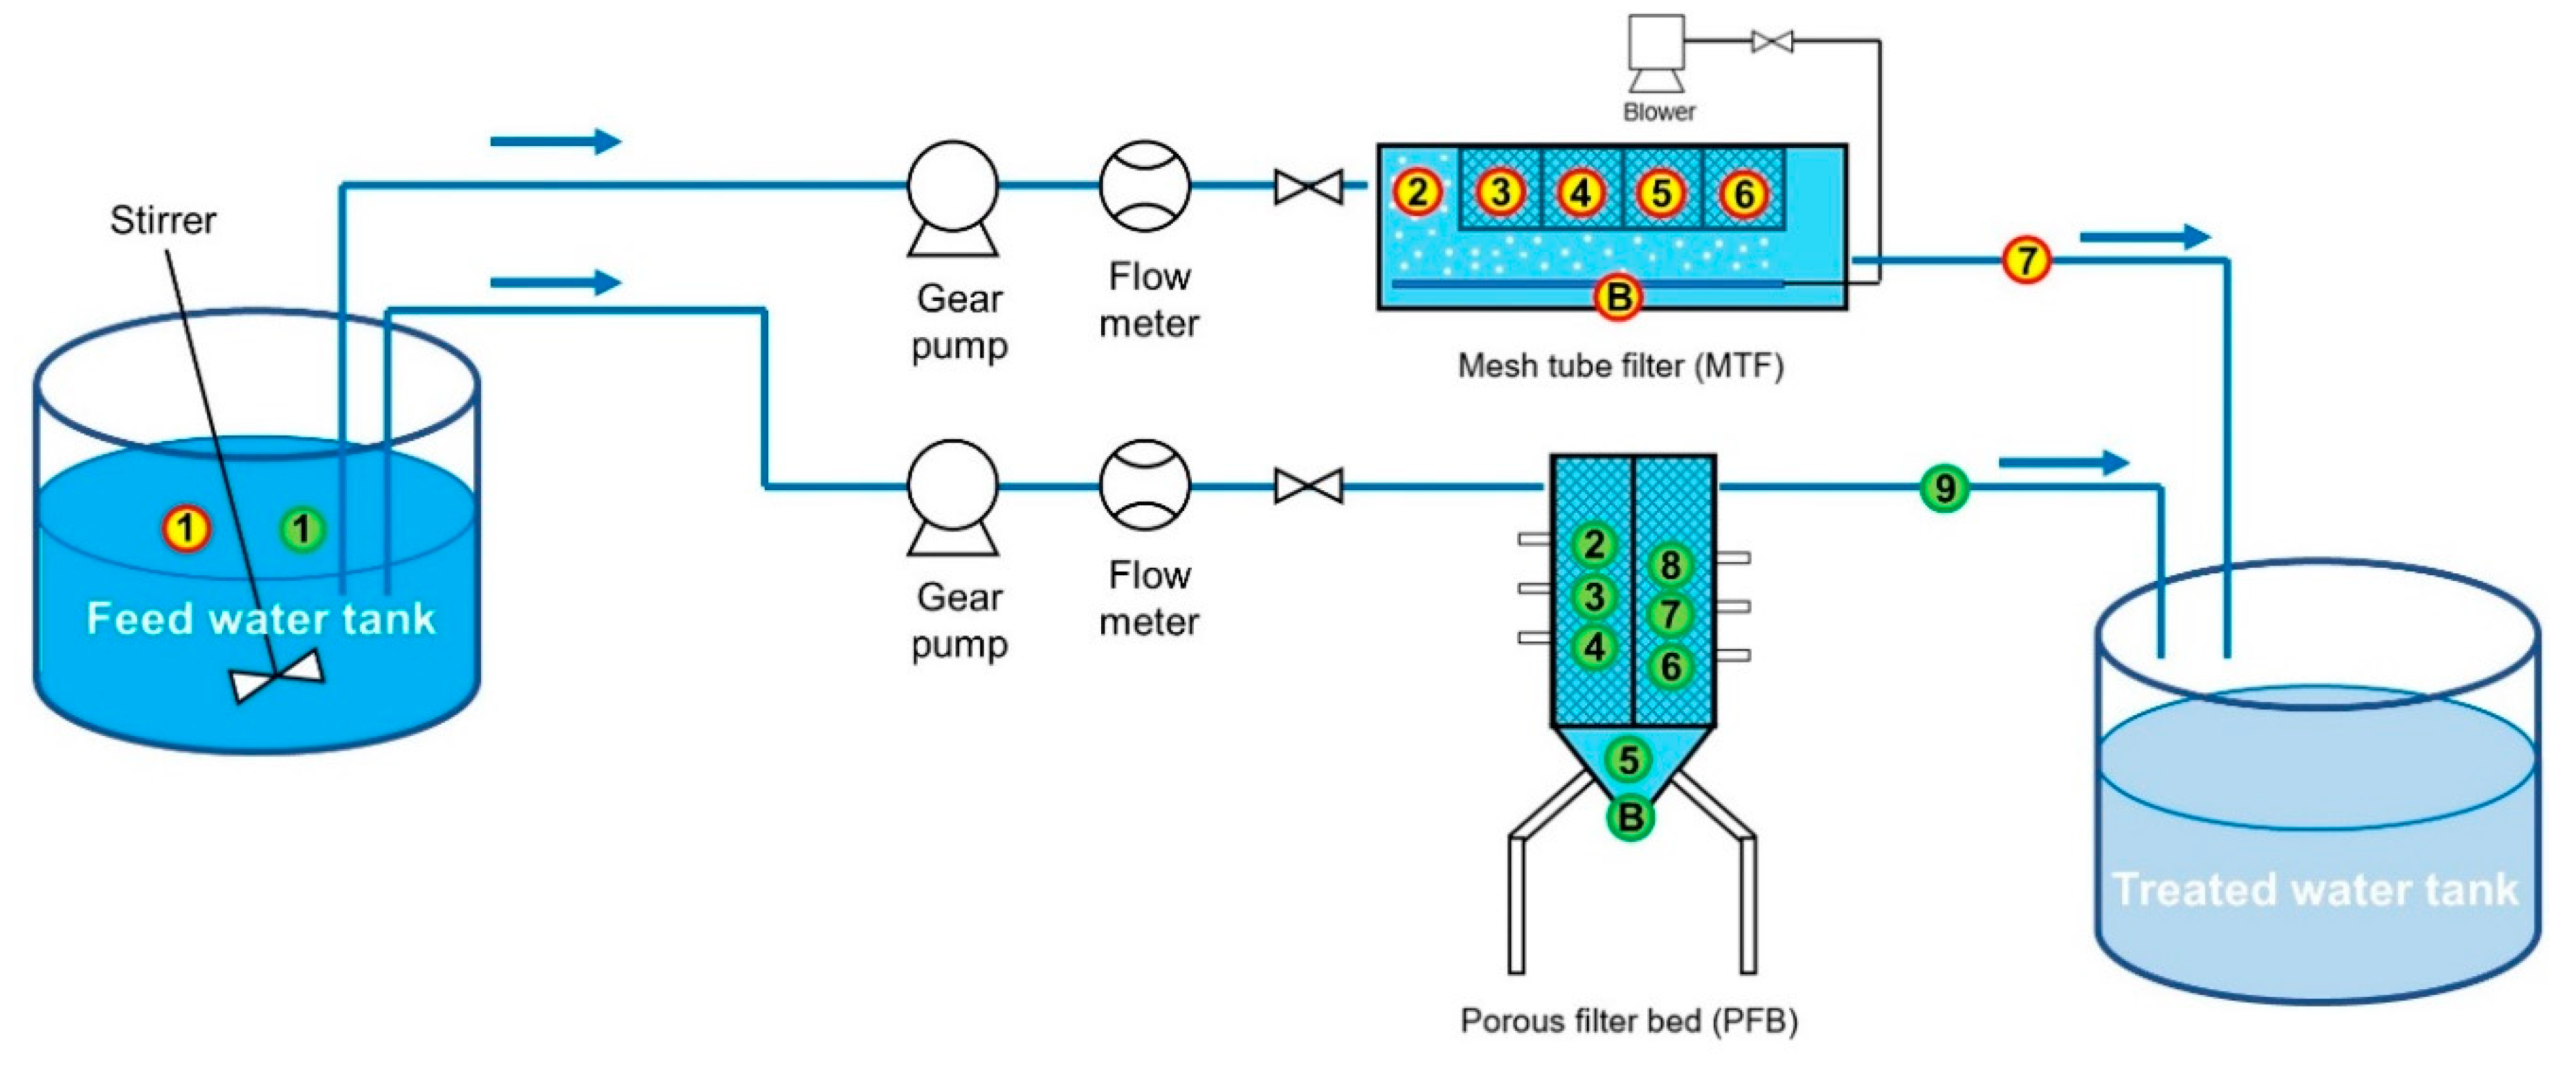
3.2. Comparison of SP Removal Performance for Bench-Scale MTF and PFB Reactors
3.3. Comparison of Filter Performance and Contamination Characteristics of MTF and PFB Field Experiments Using Blended Wastewater–Seawater Influent
4. Conclusions
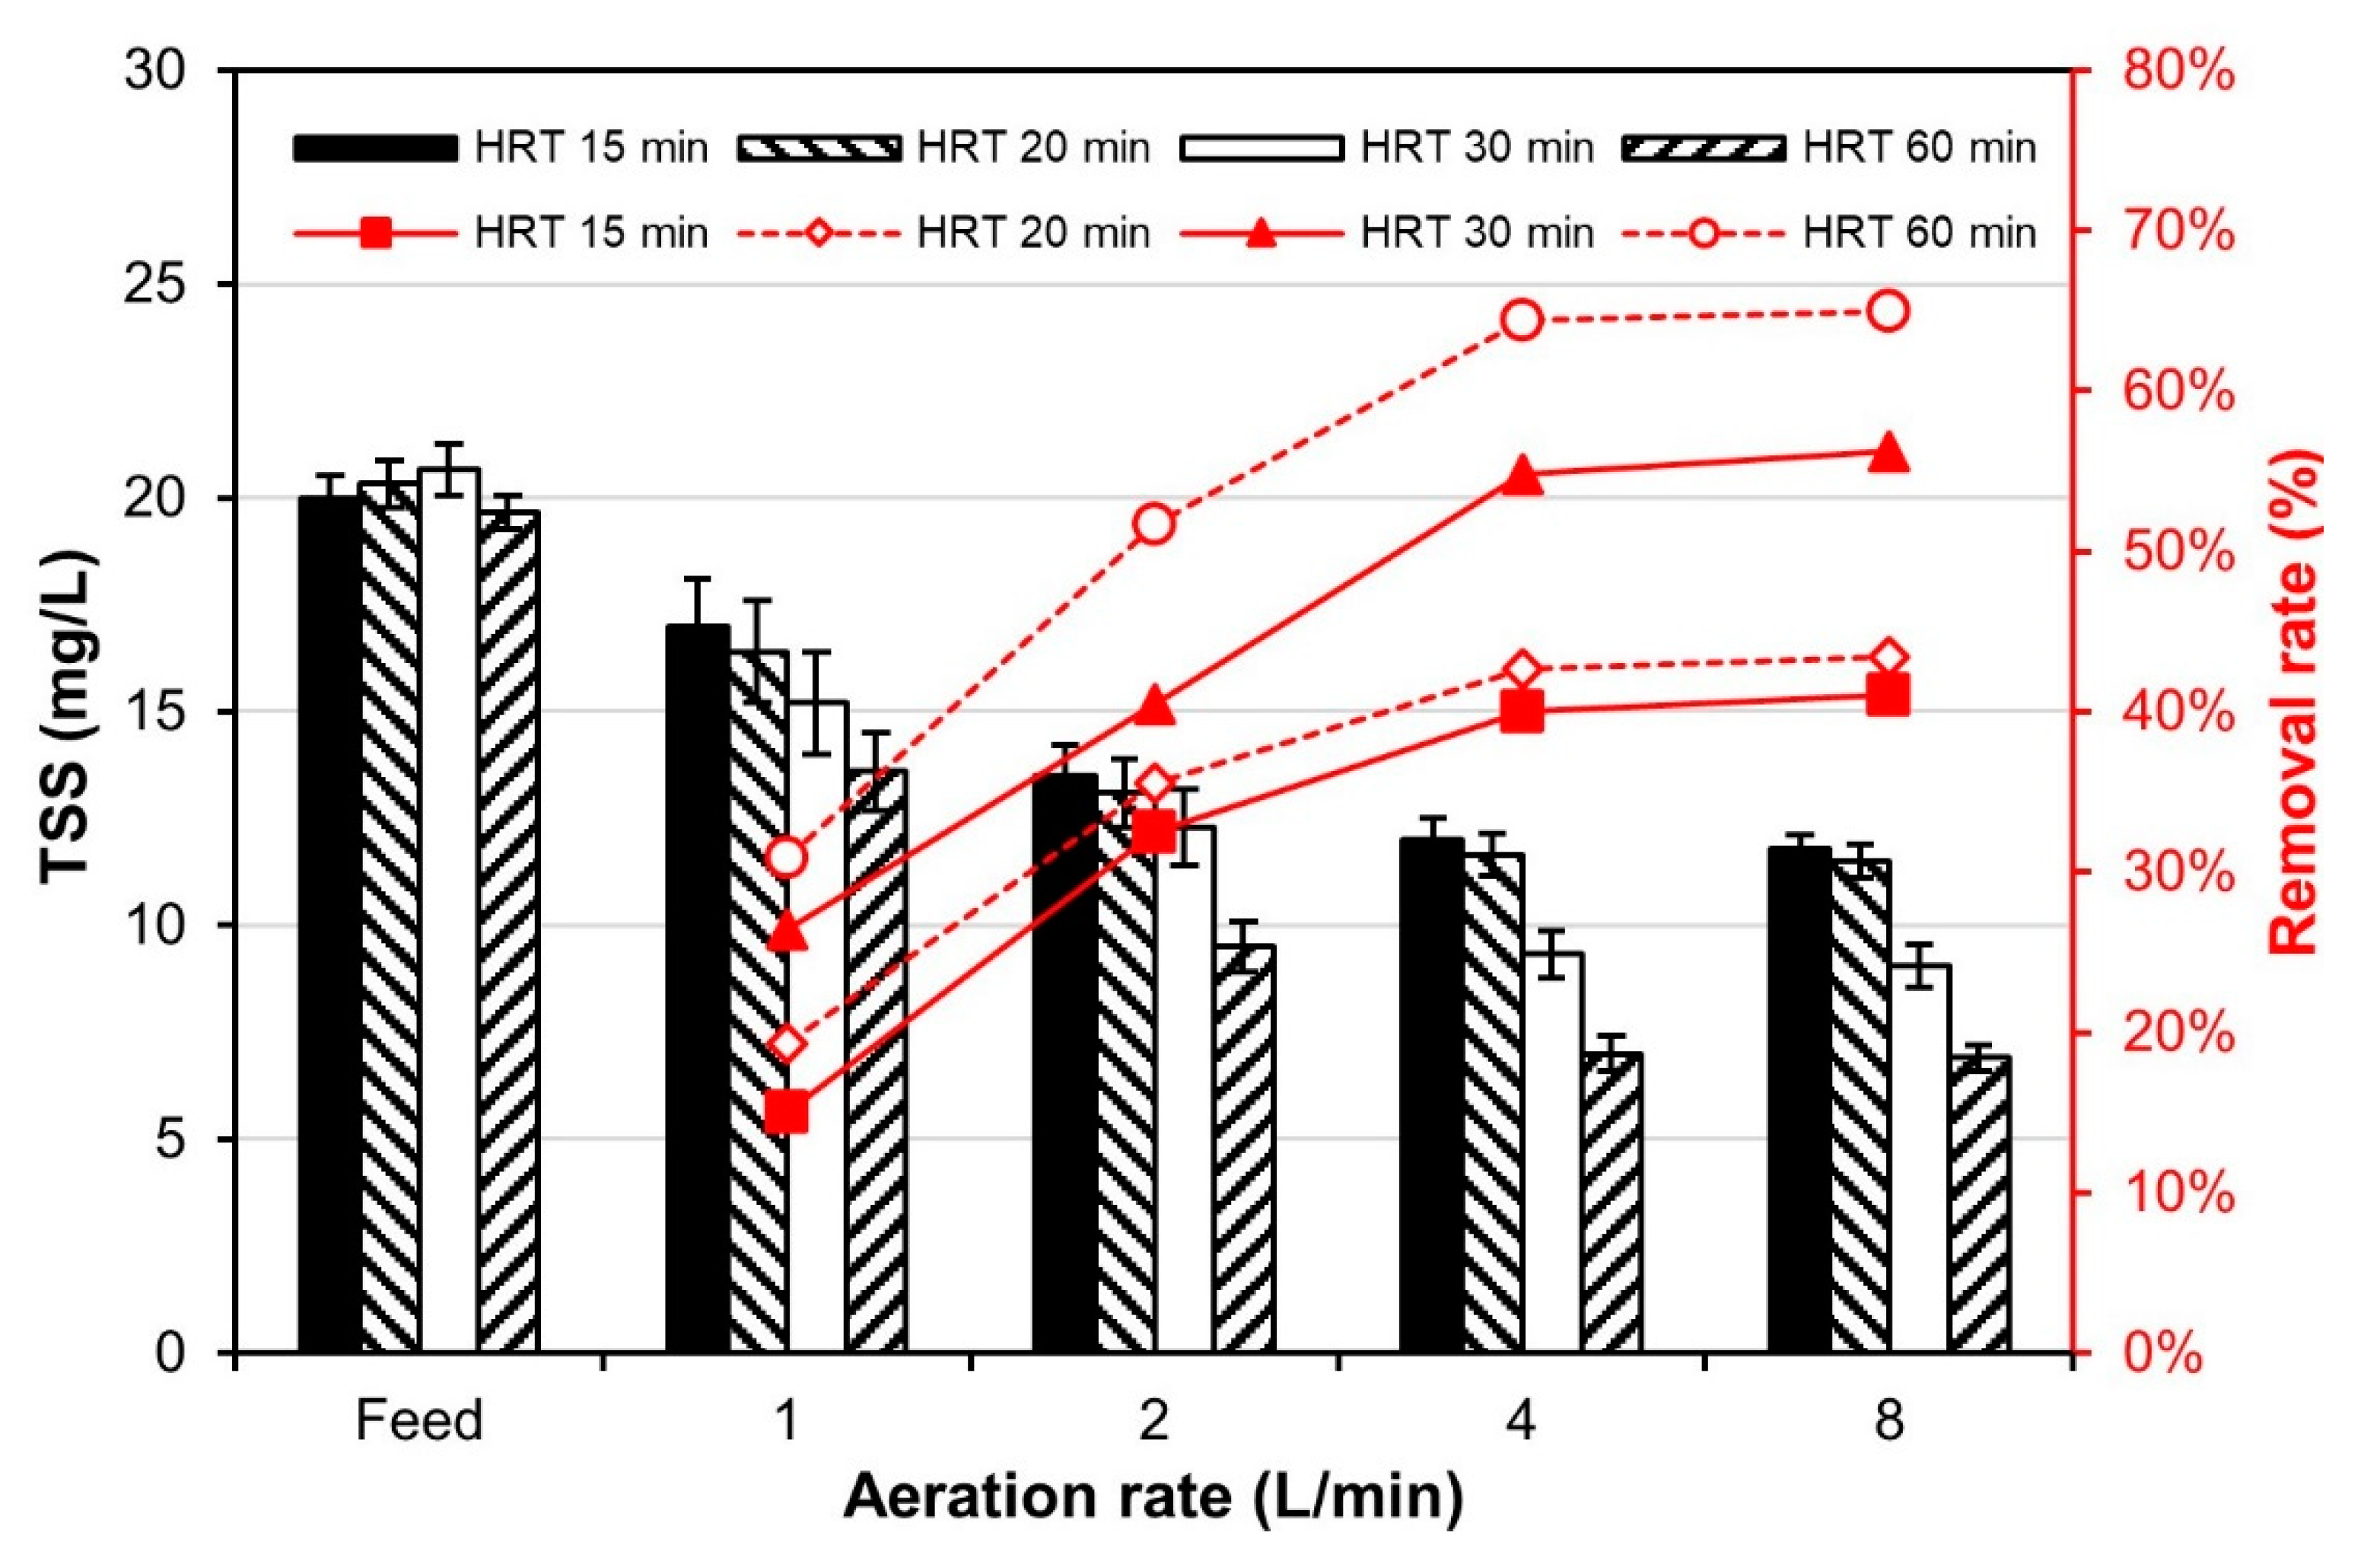
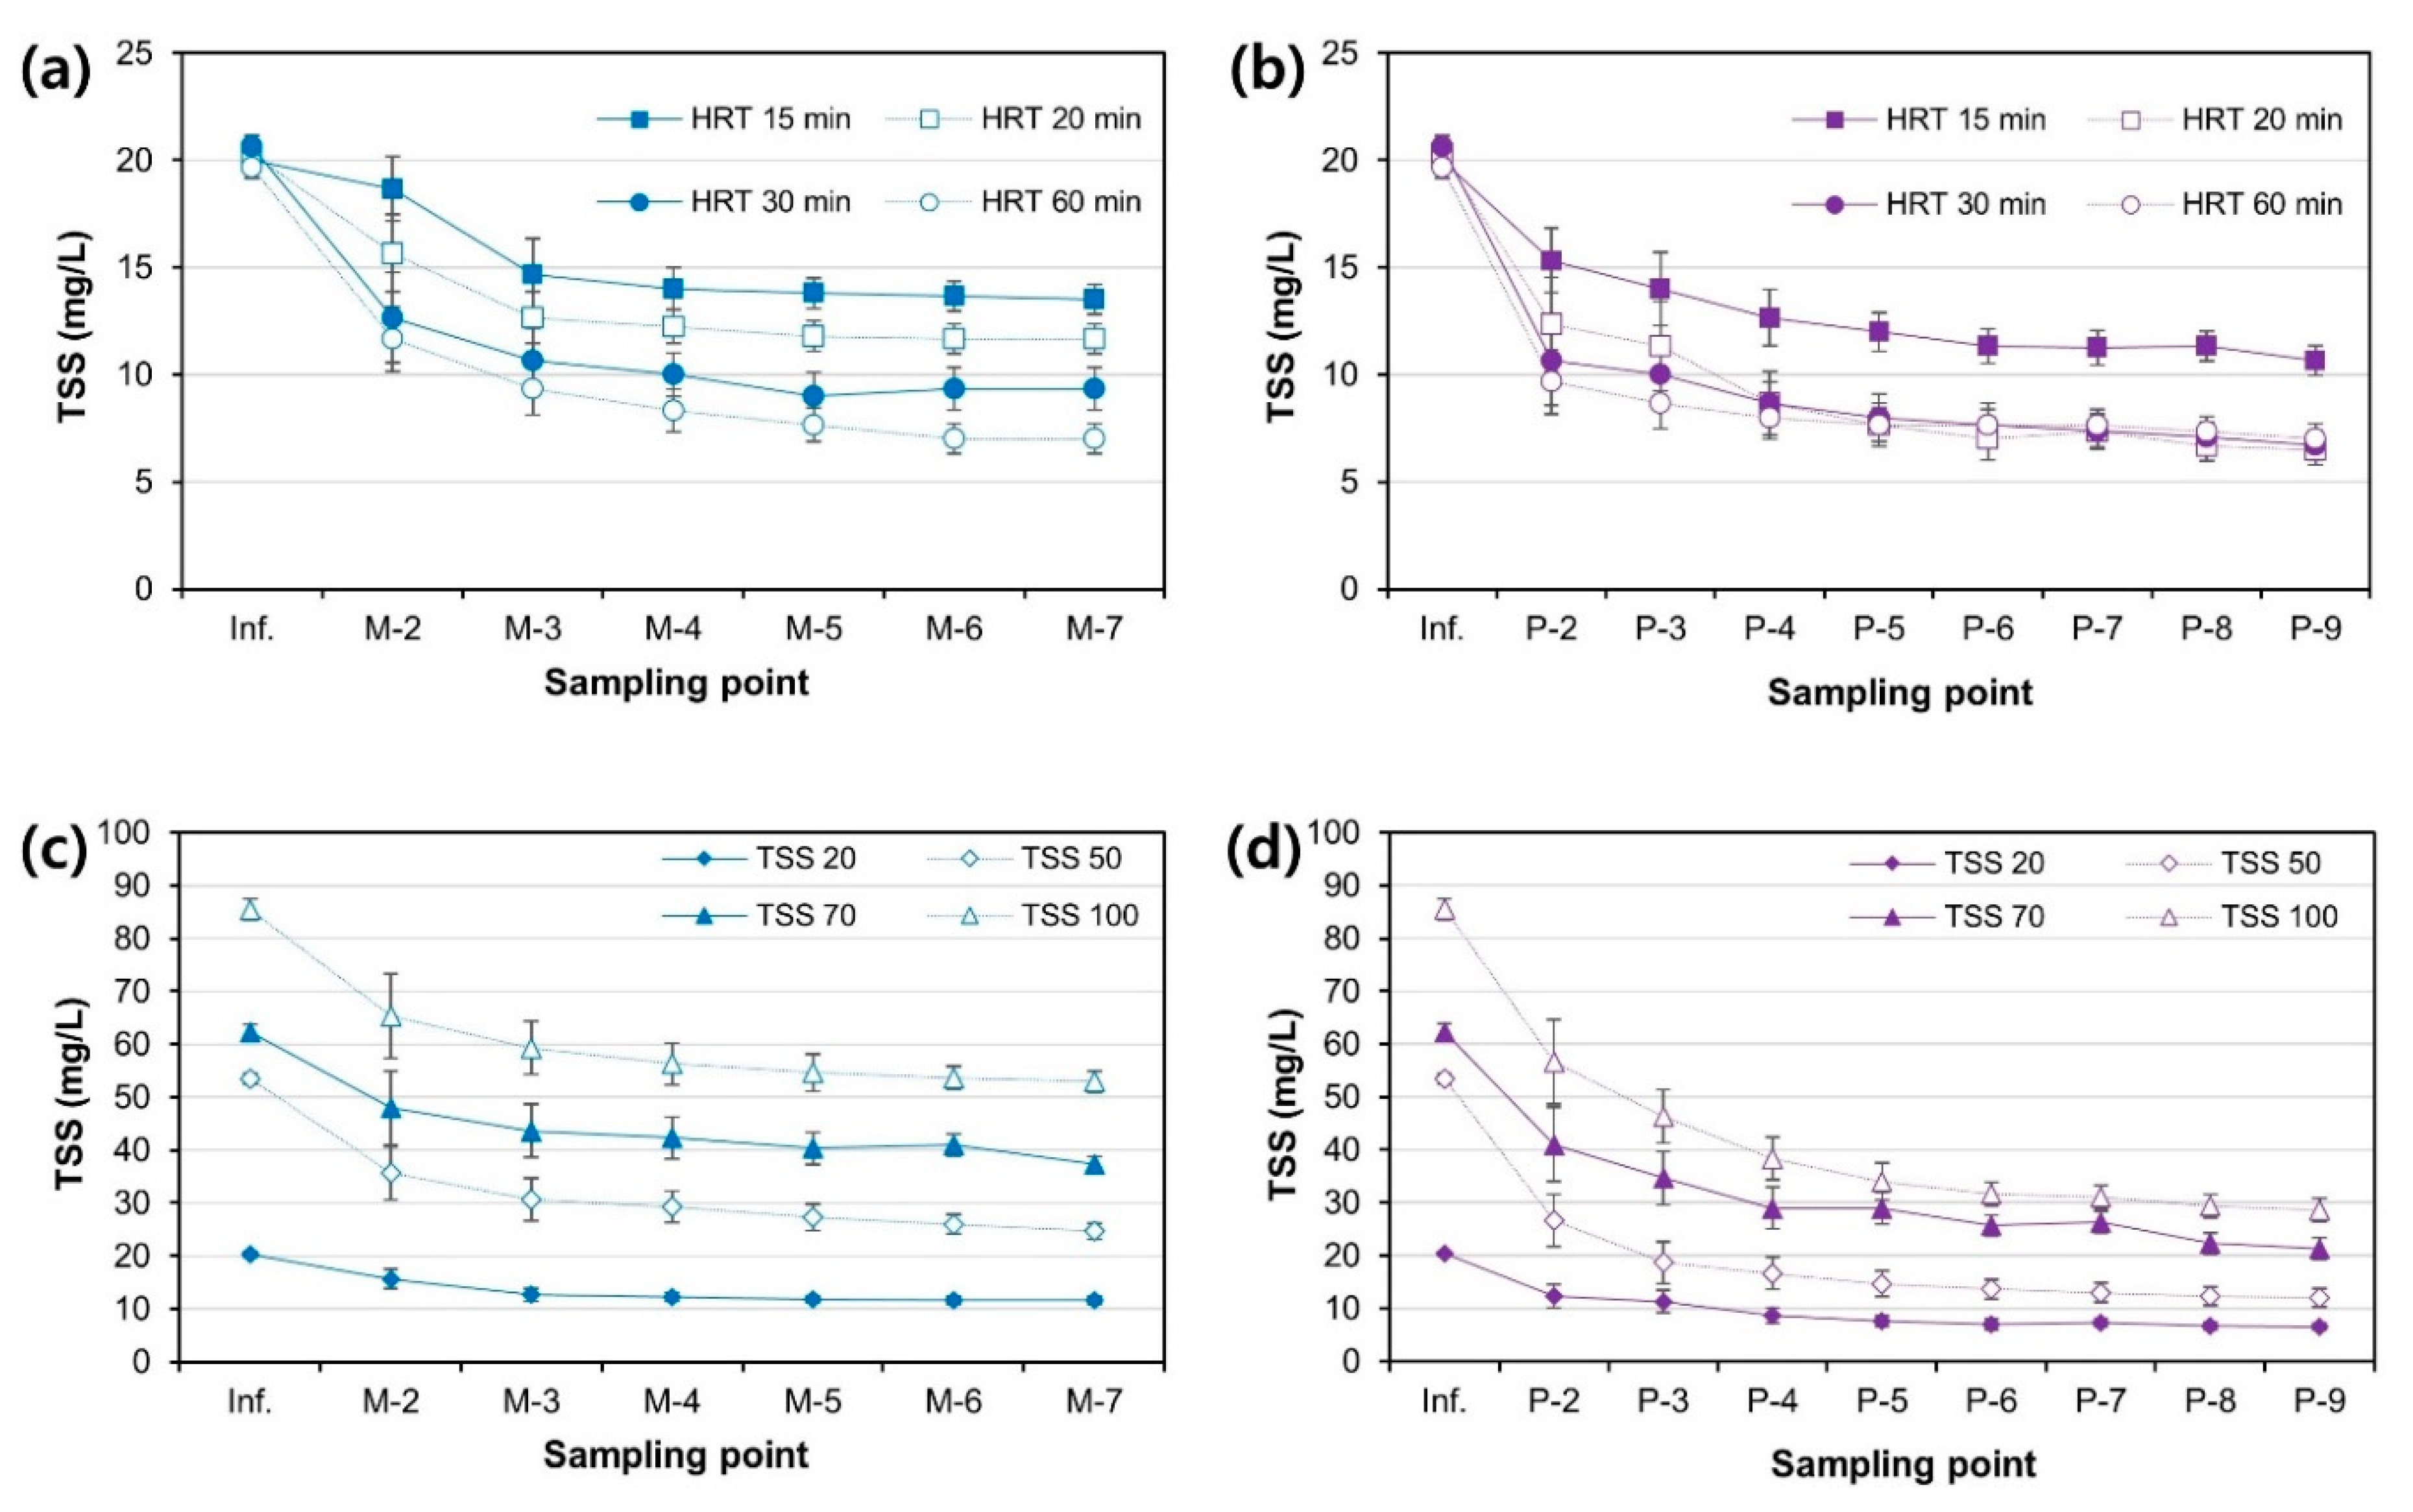
- In experiments to remove SPs using bench-scale MTF and PFB reactors, PFB exhibited better SP removal performance than MTF under various HRT and TSS conditions. At an HRT of 15, 20, 30, and 60 min, the SP removal rates for MTF were 32.5%, 42.6%, 54.8%, and 64.4%, respectively, whereas those for PFB were 46.7%, 68.0%, 67.6%, and 68.4%, respectively.
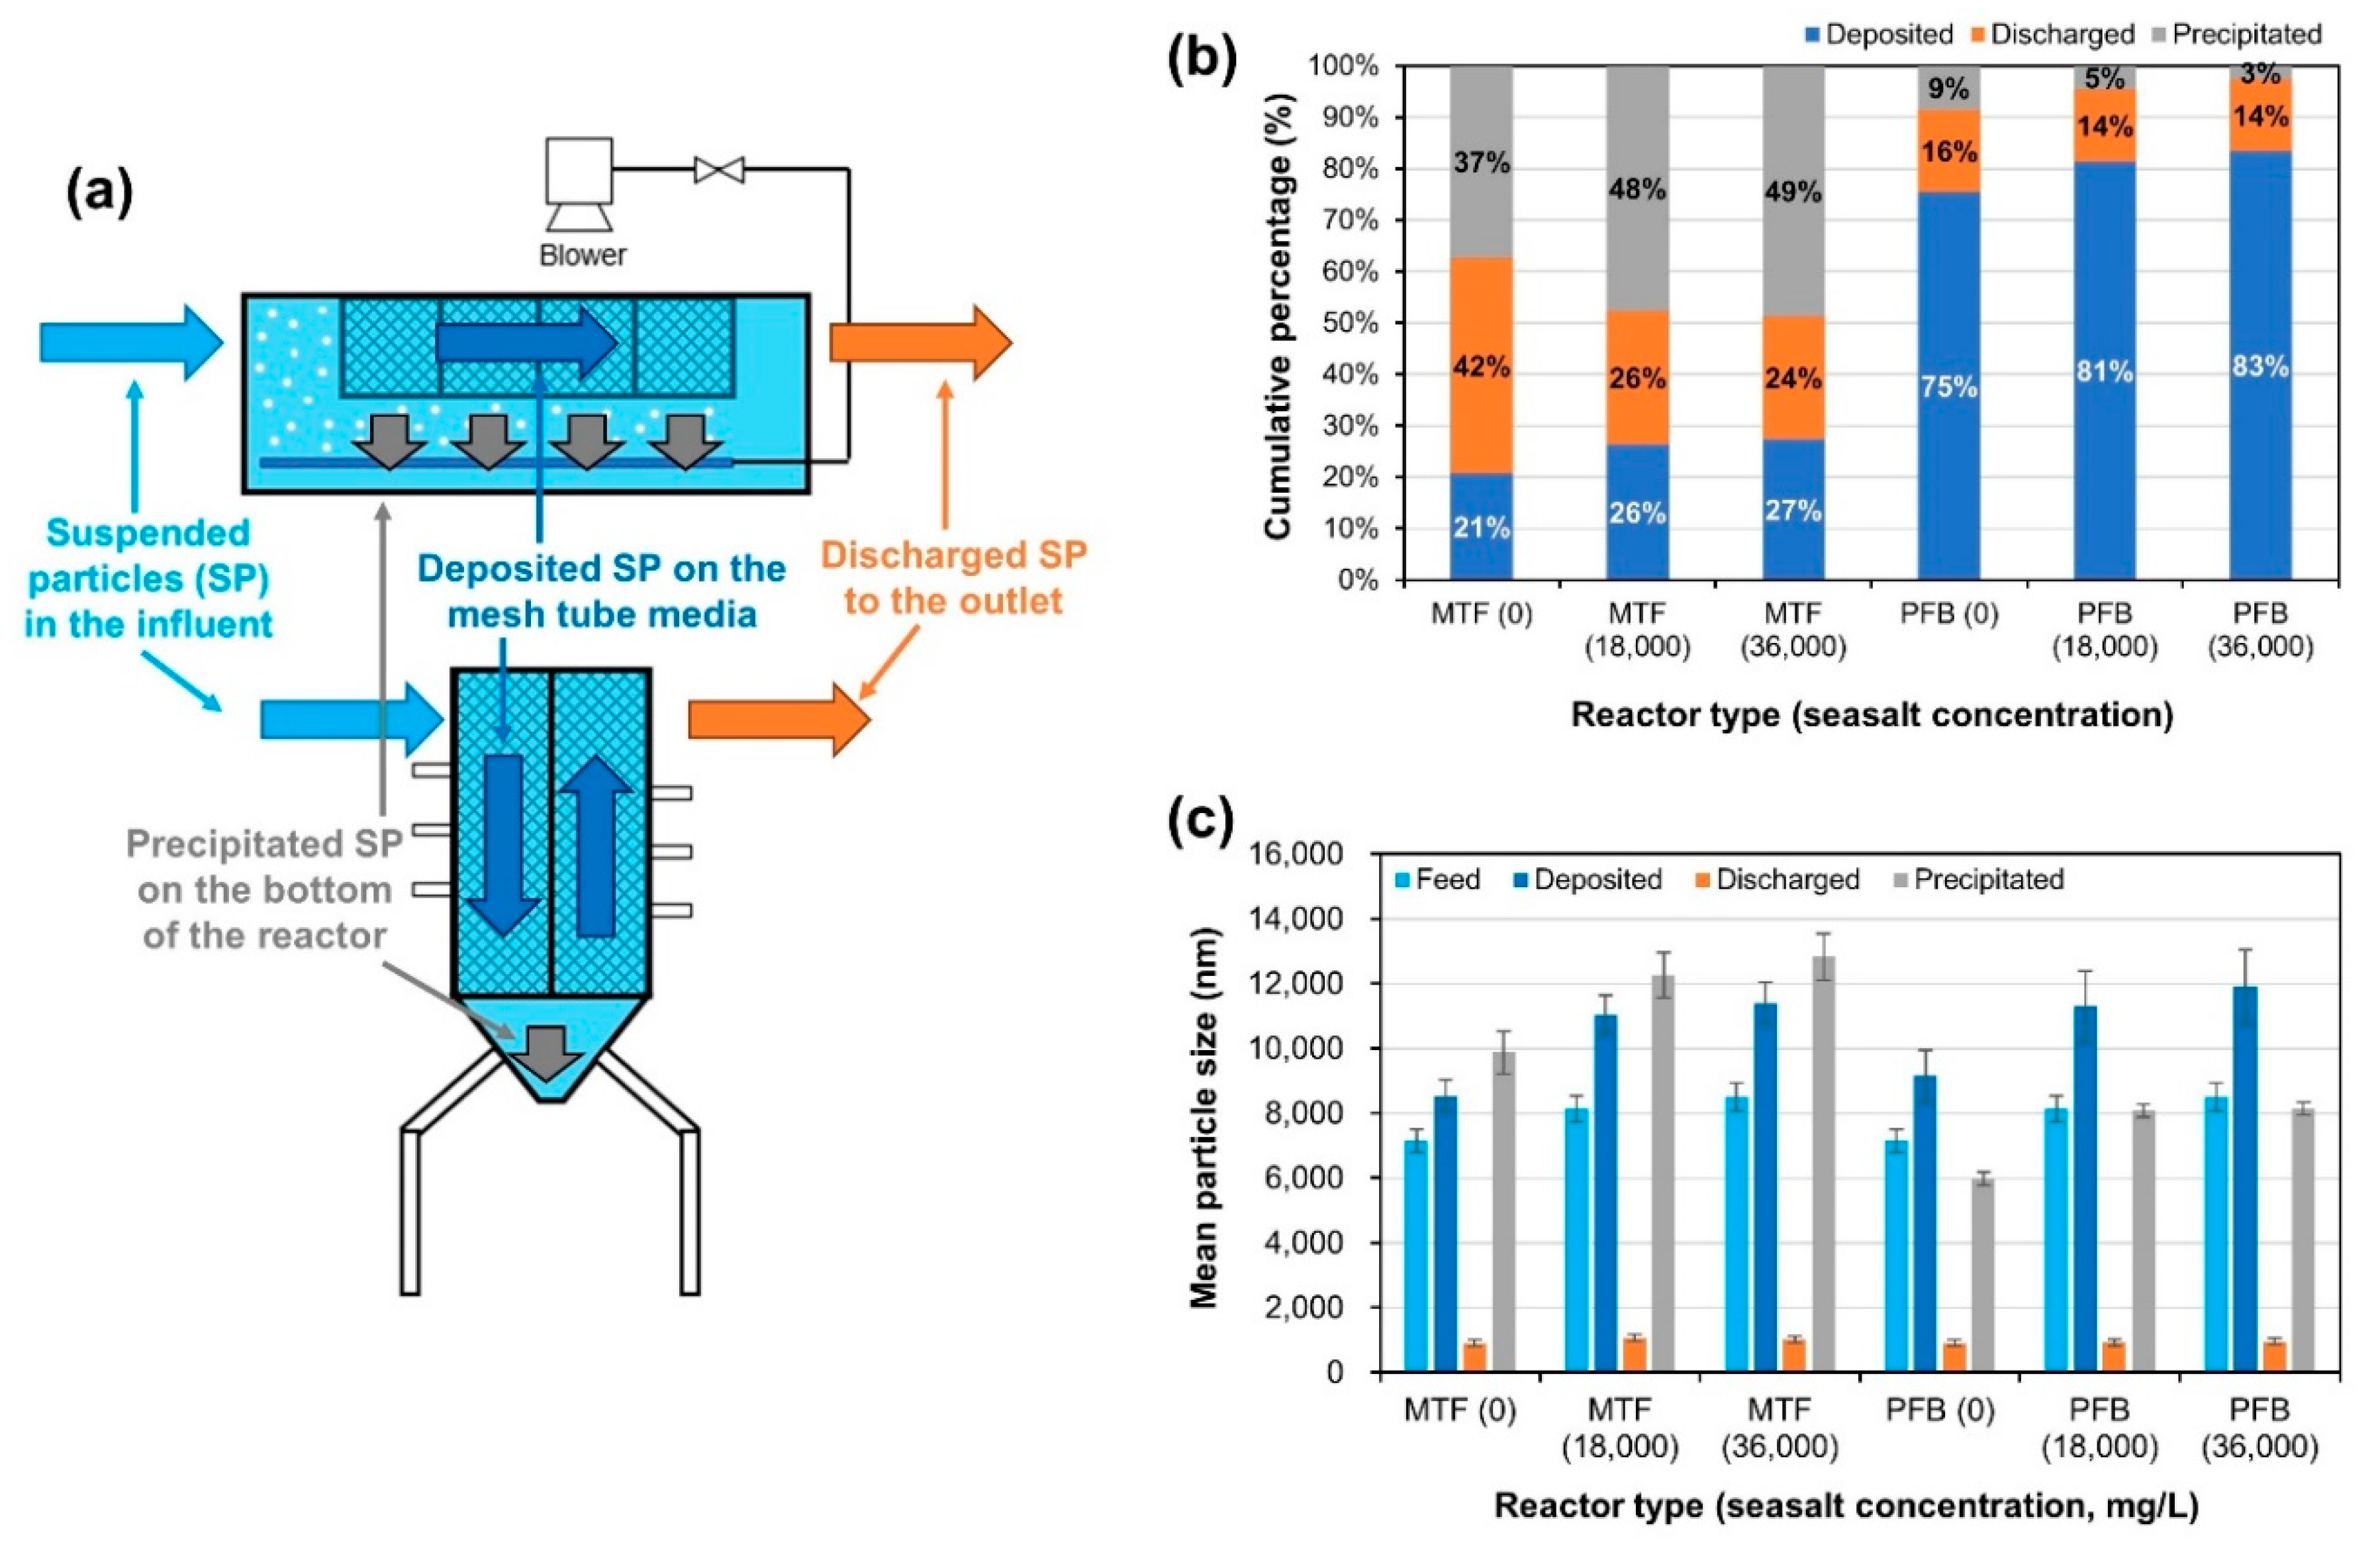
- The fate of SPs injected into MTF and PFB reactors was divided into three categories: particles deposited on the surface of the mesh tube media, particles precipitated on the bottom of the reactor tank, and particles flowing out of the reactor tank through the outlet. MTF predominantly removed SPs by precipitation, whereas PFB predominantly removed SPs by deposition of mesh tube media. The fate of SPs was also affected by the ion concentration in the water.
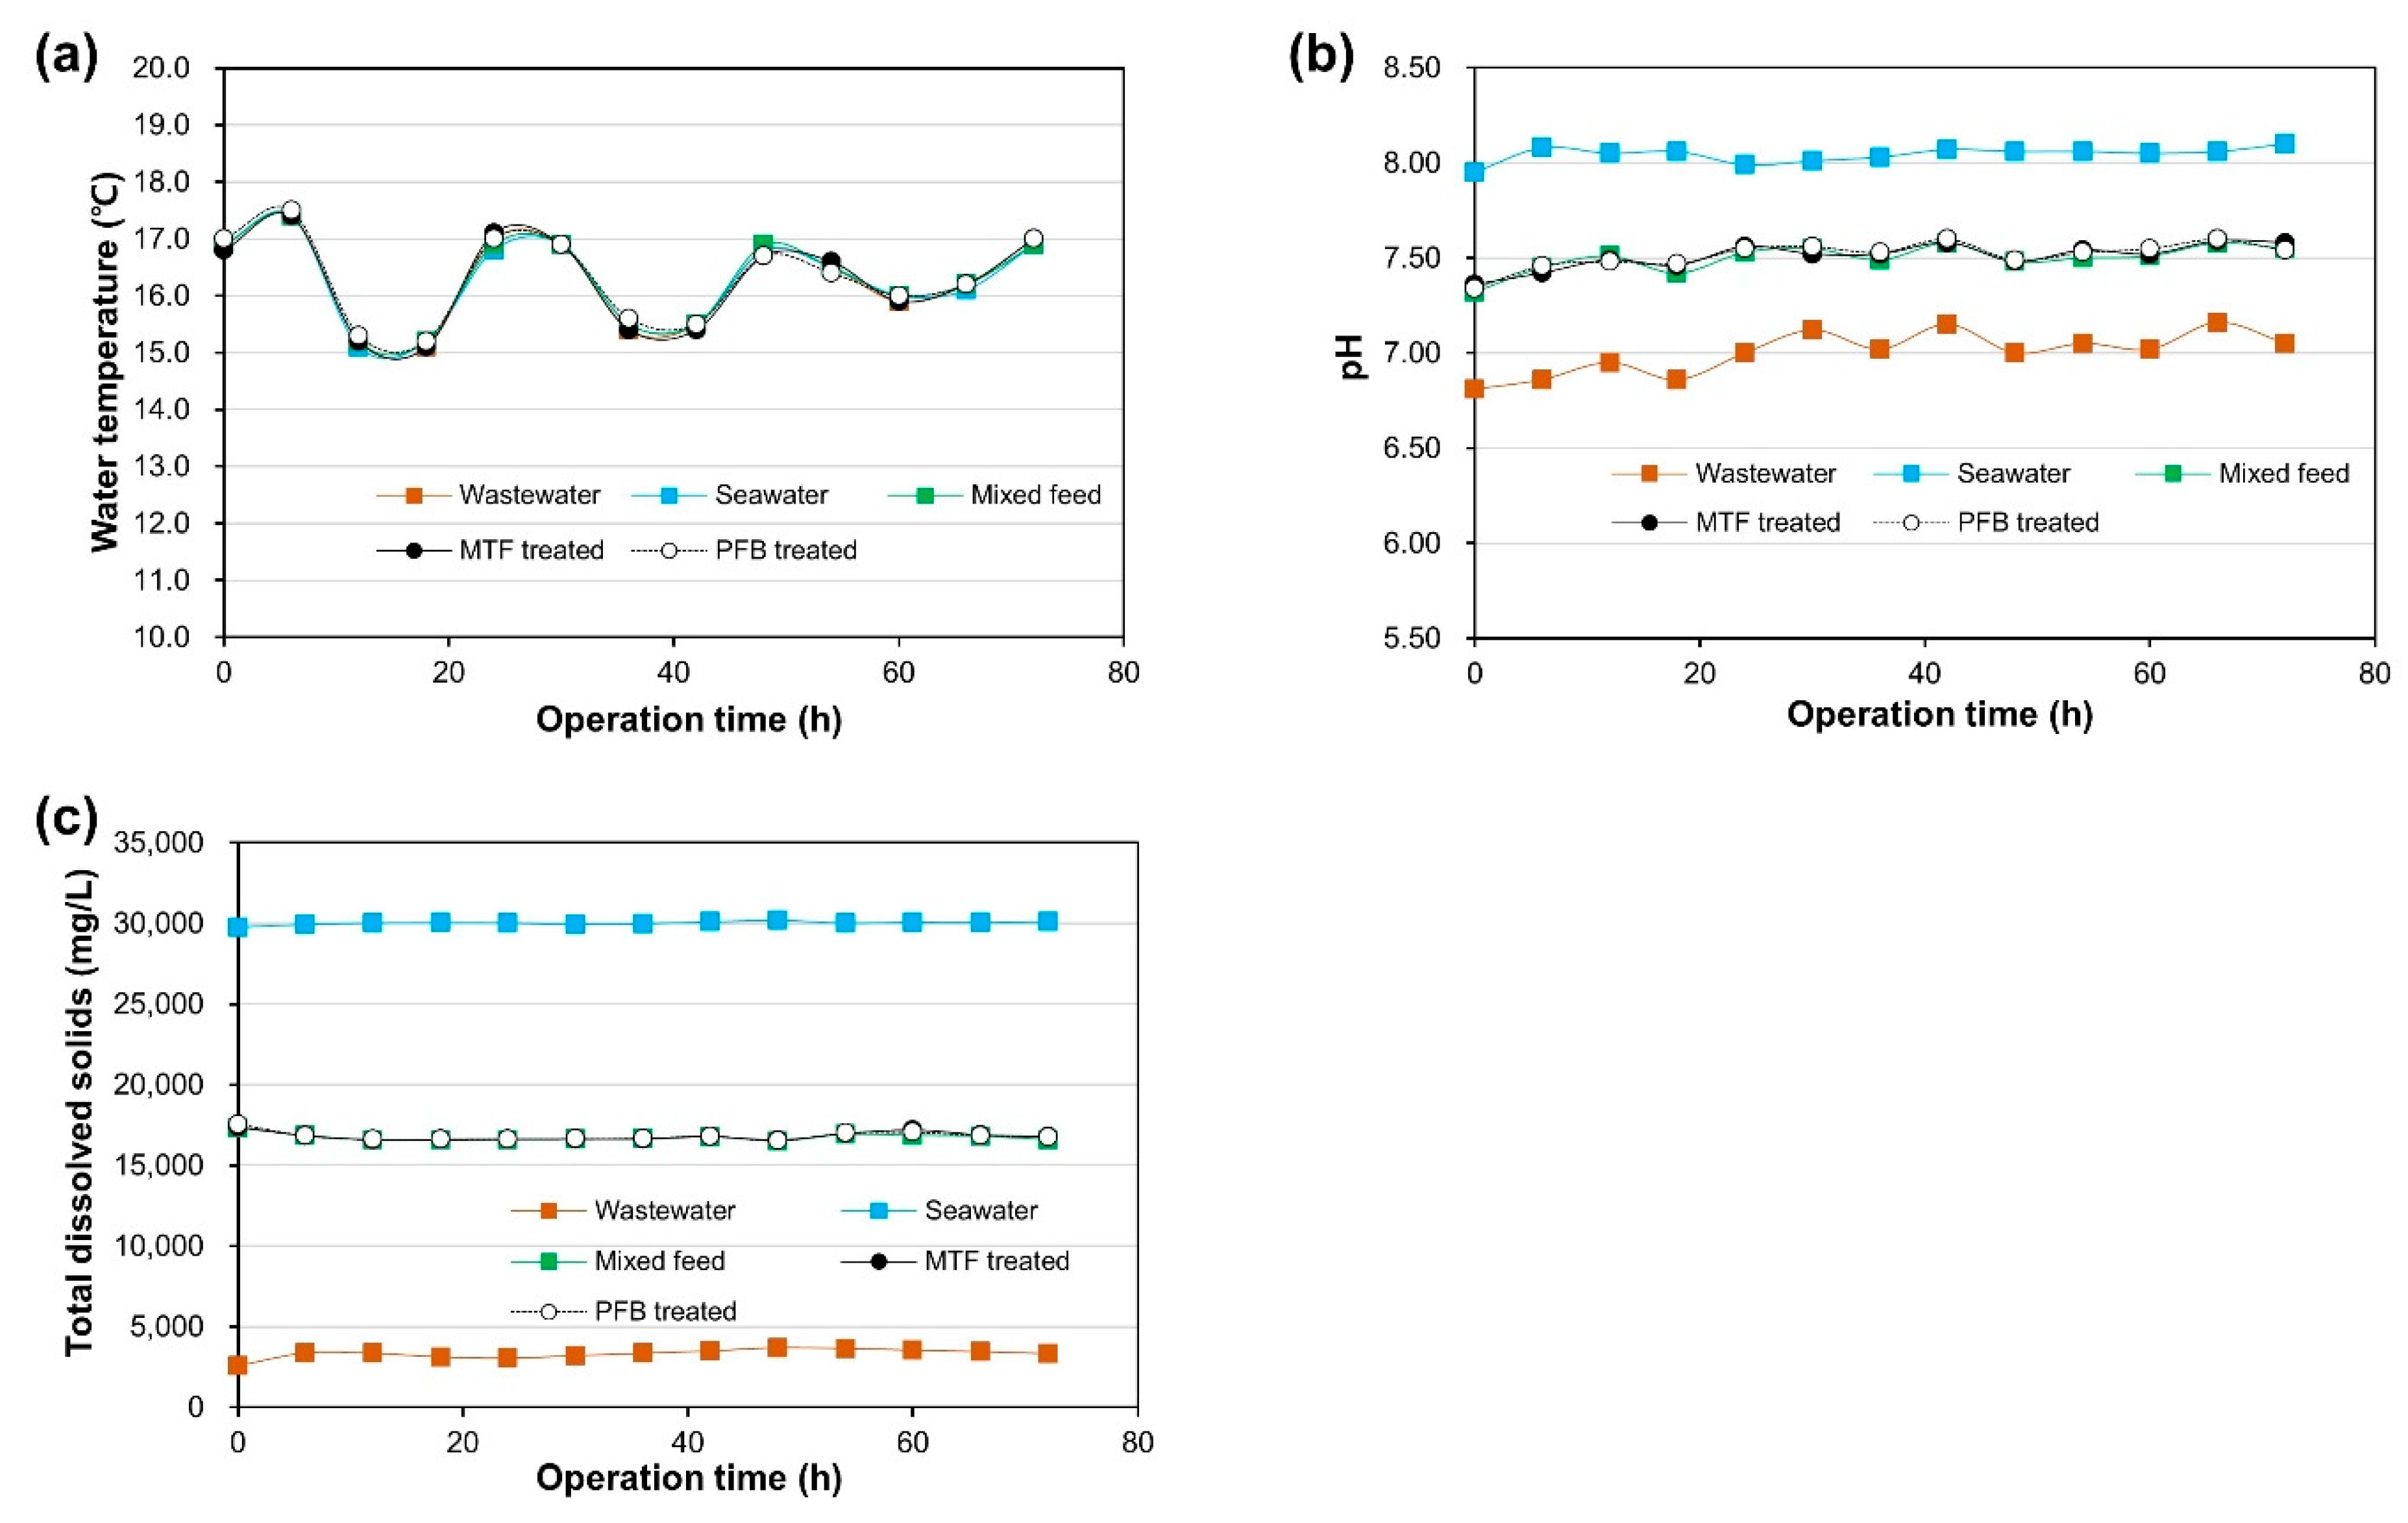
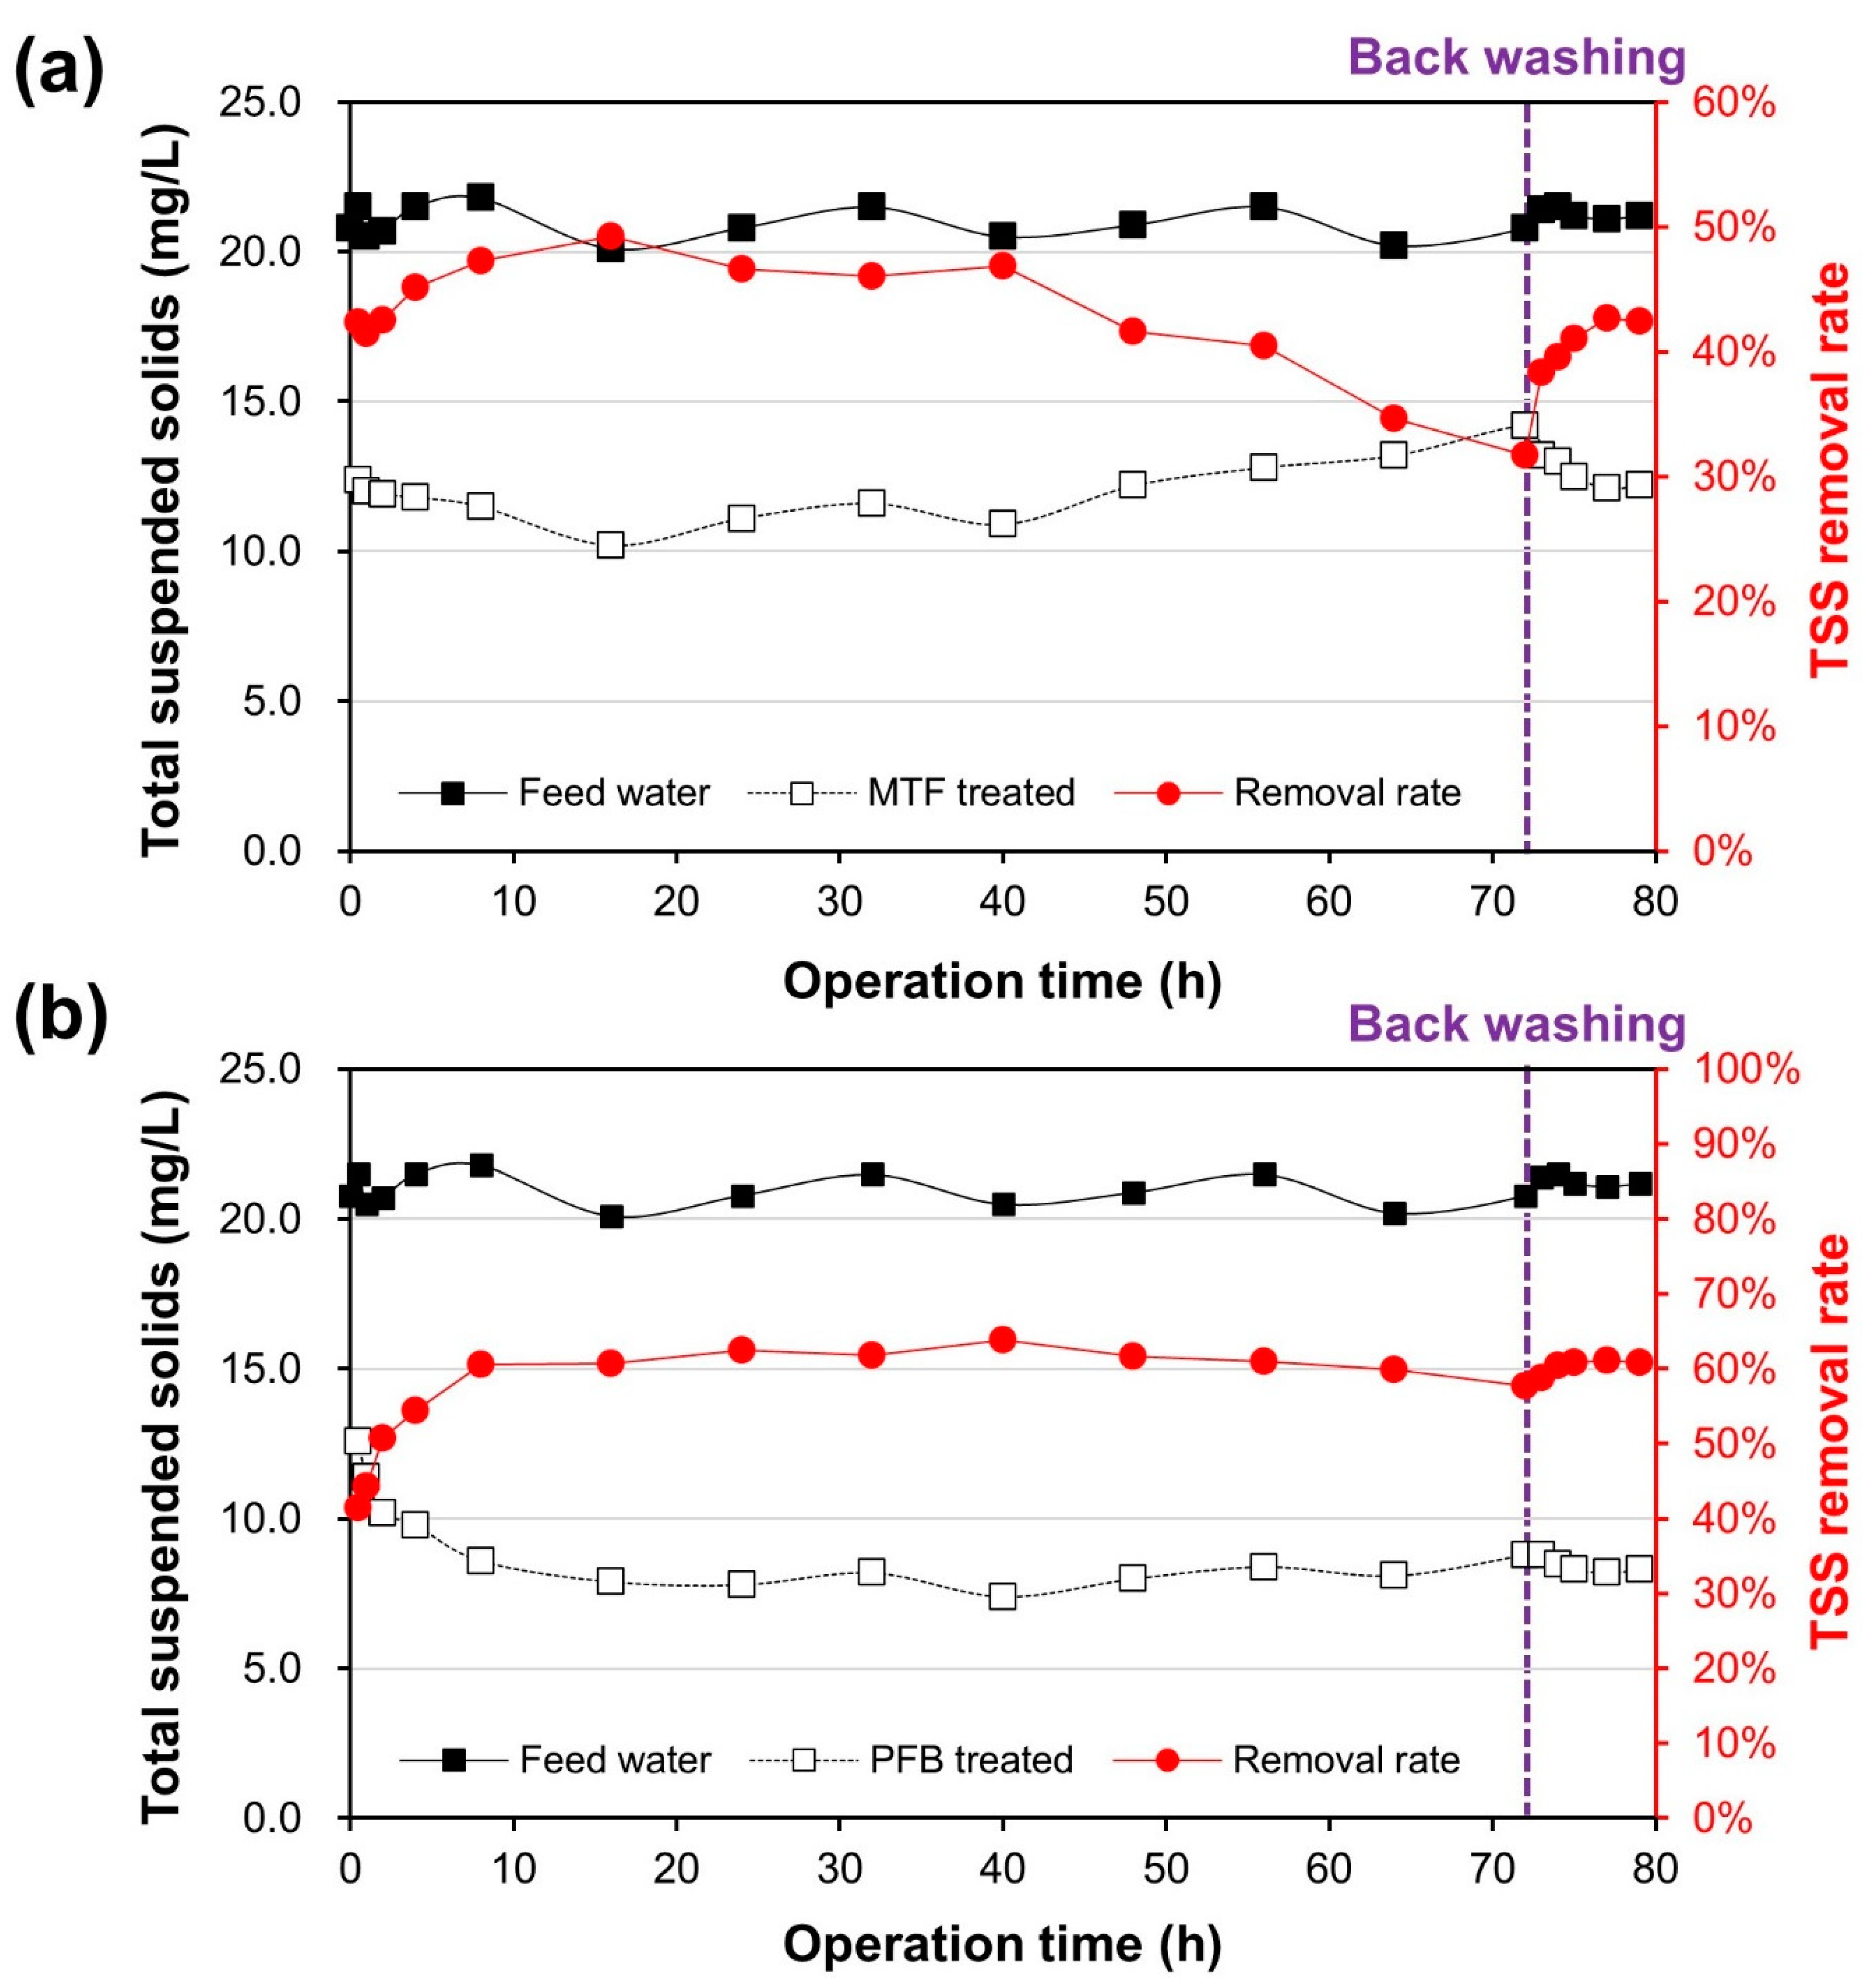
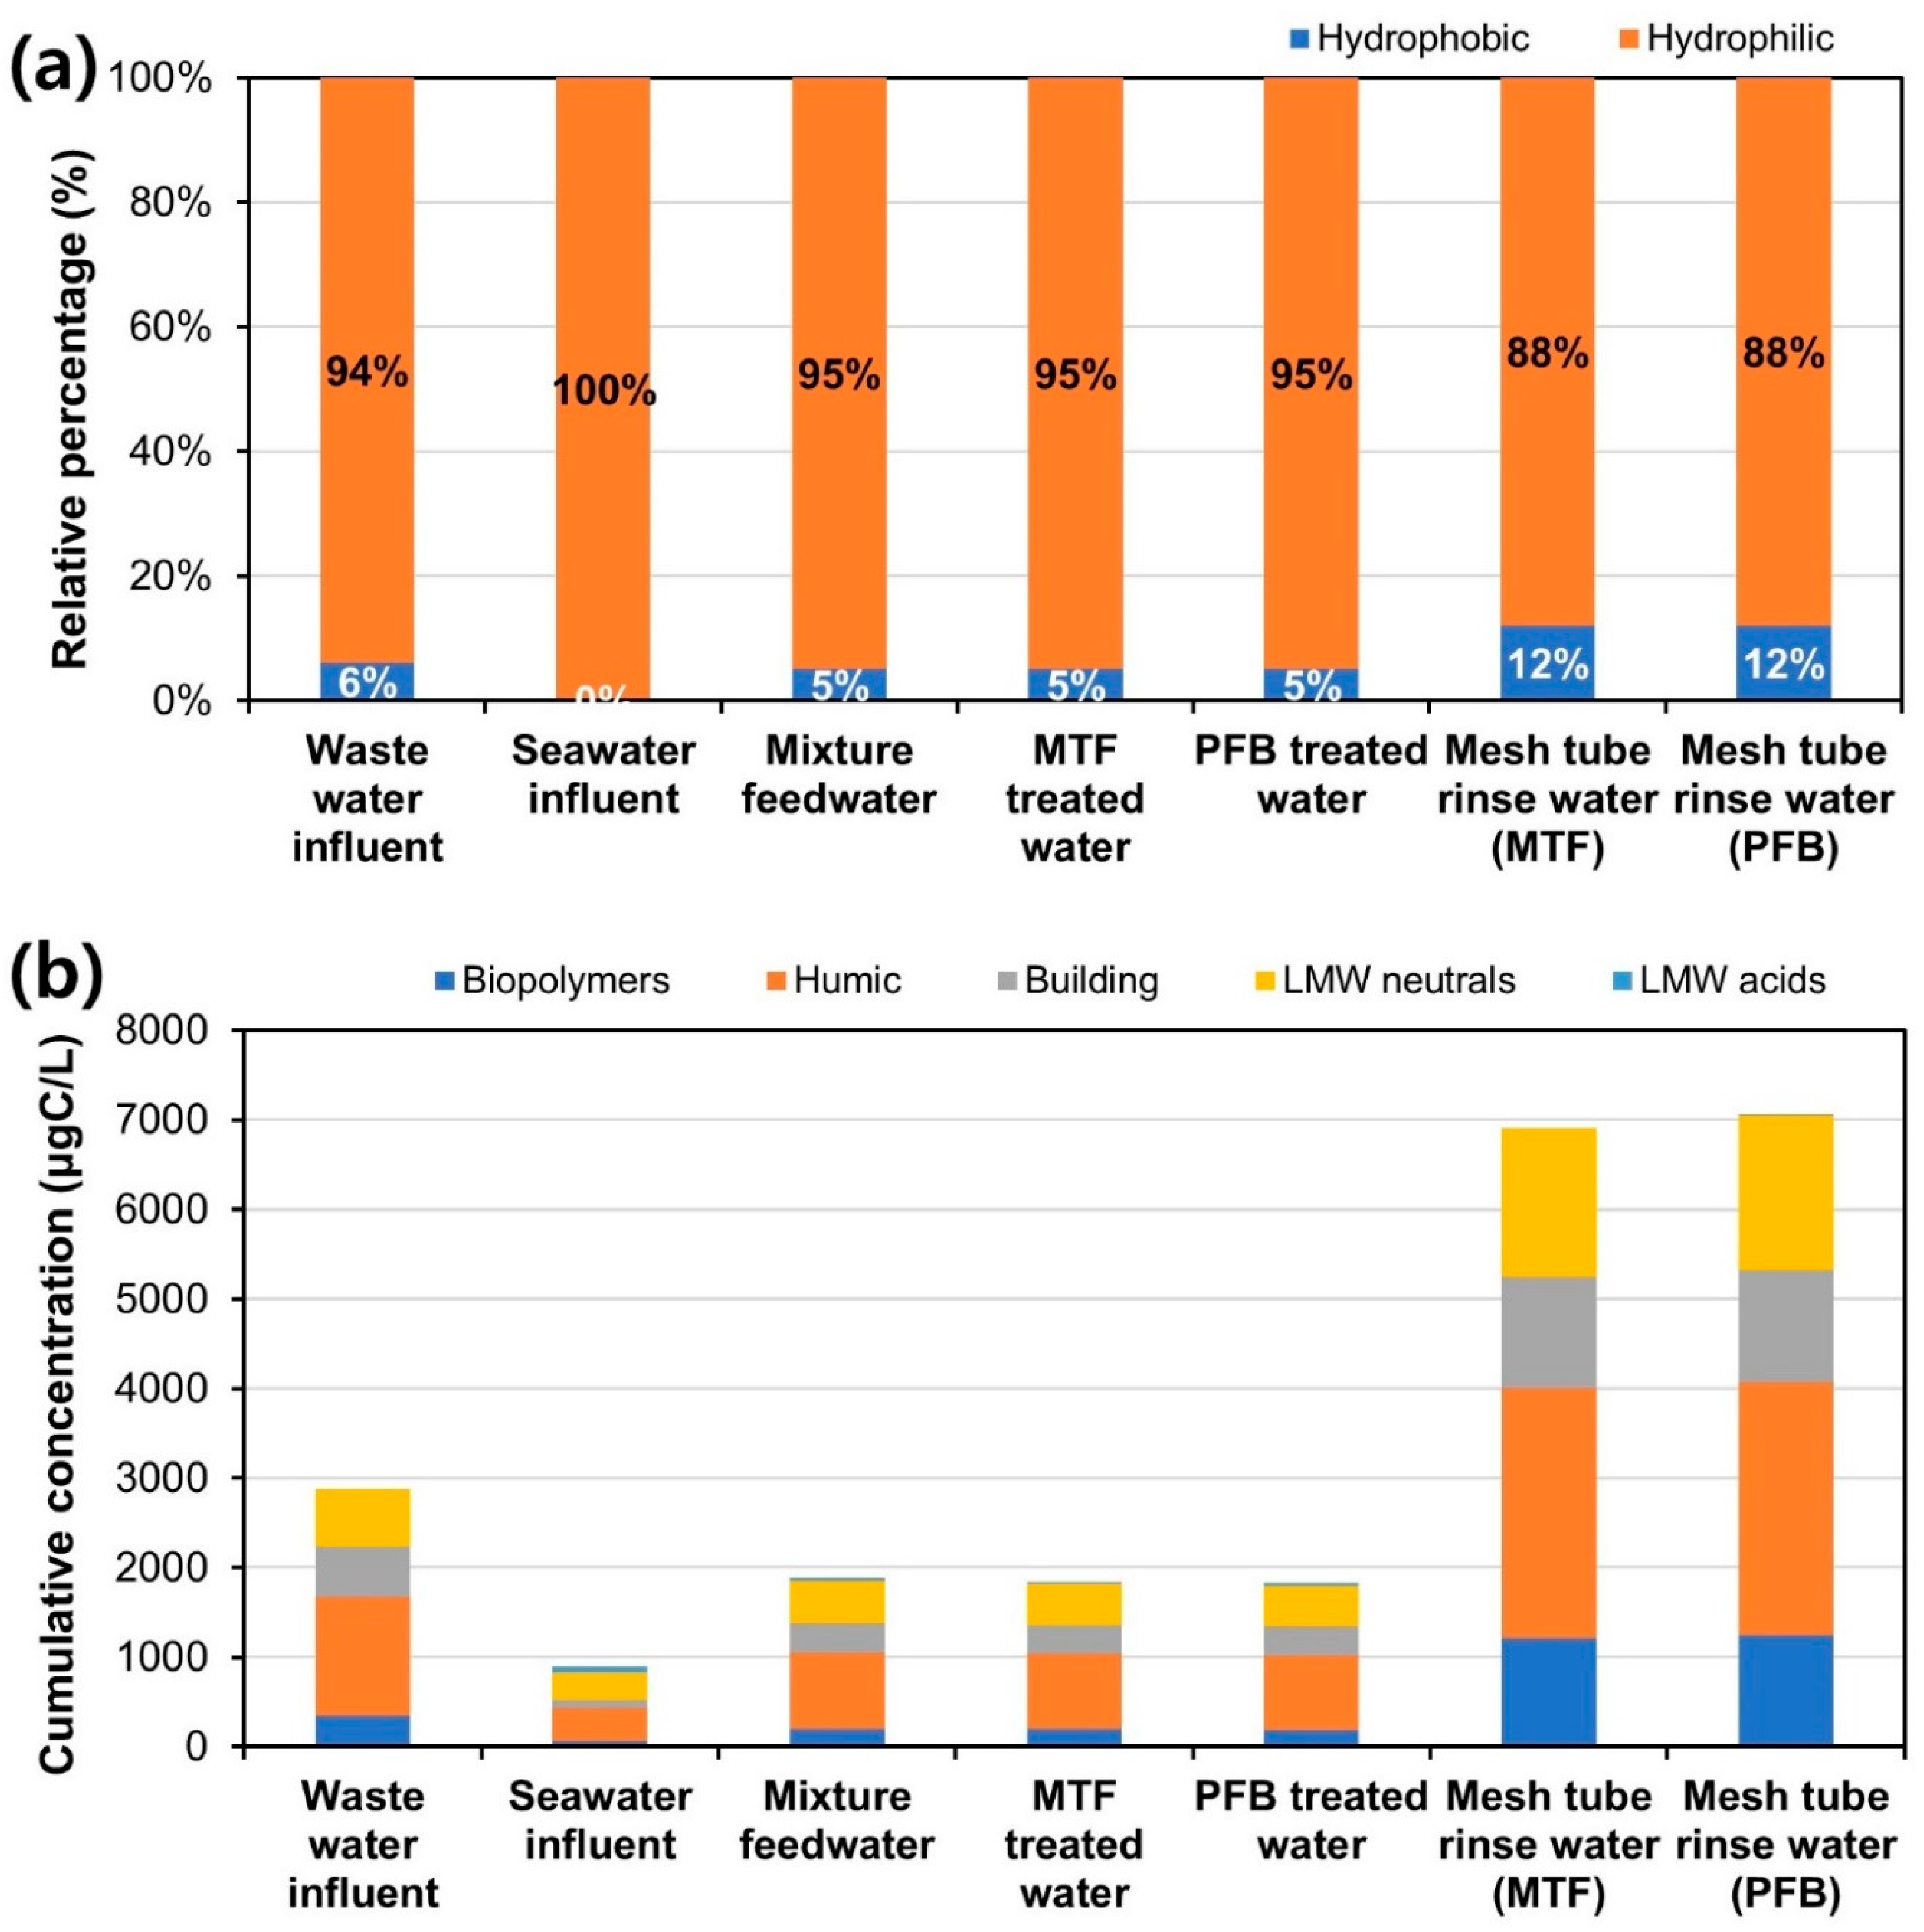
- In the extended performance analysis of a 72 h operation using blended influent water comprising natural seawater and secondary treated wastewater, PFB again showed better and more stable SP removal performance than MTF. Moreover, air scouring-based backwashing effectively removed SPs deposited on the mesh tube media. Although MTF and PFB have low organic-SP removal performance, relatively hydrophobic SPs were more efficiently deposited on the mesh tube due to the hydrophobicity of the mesh tube.
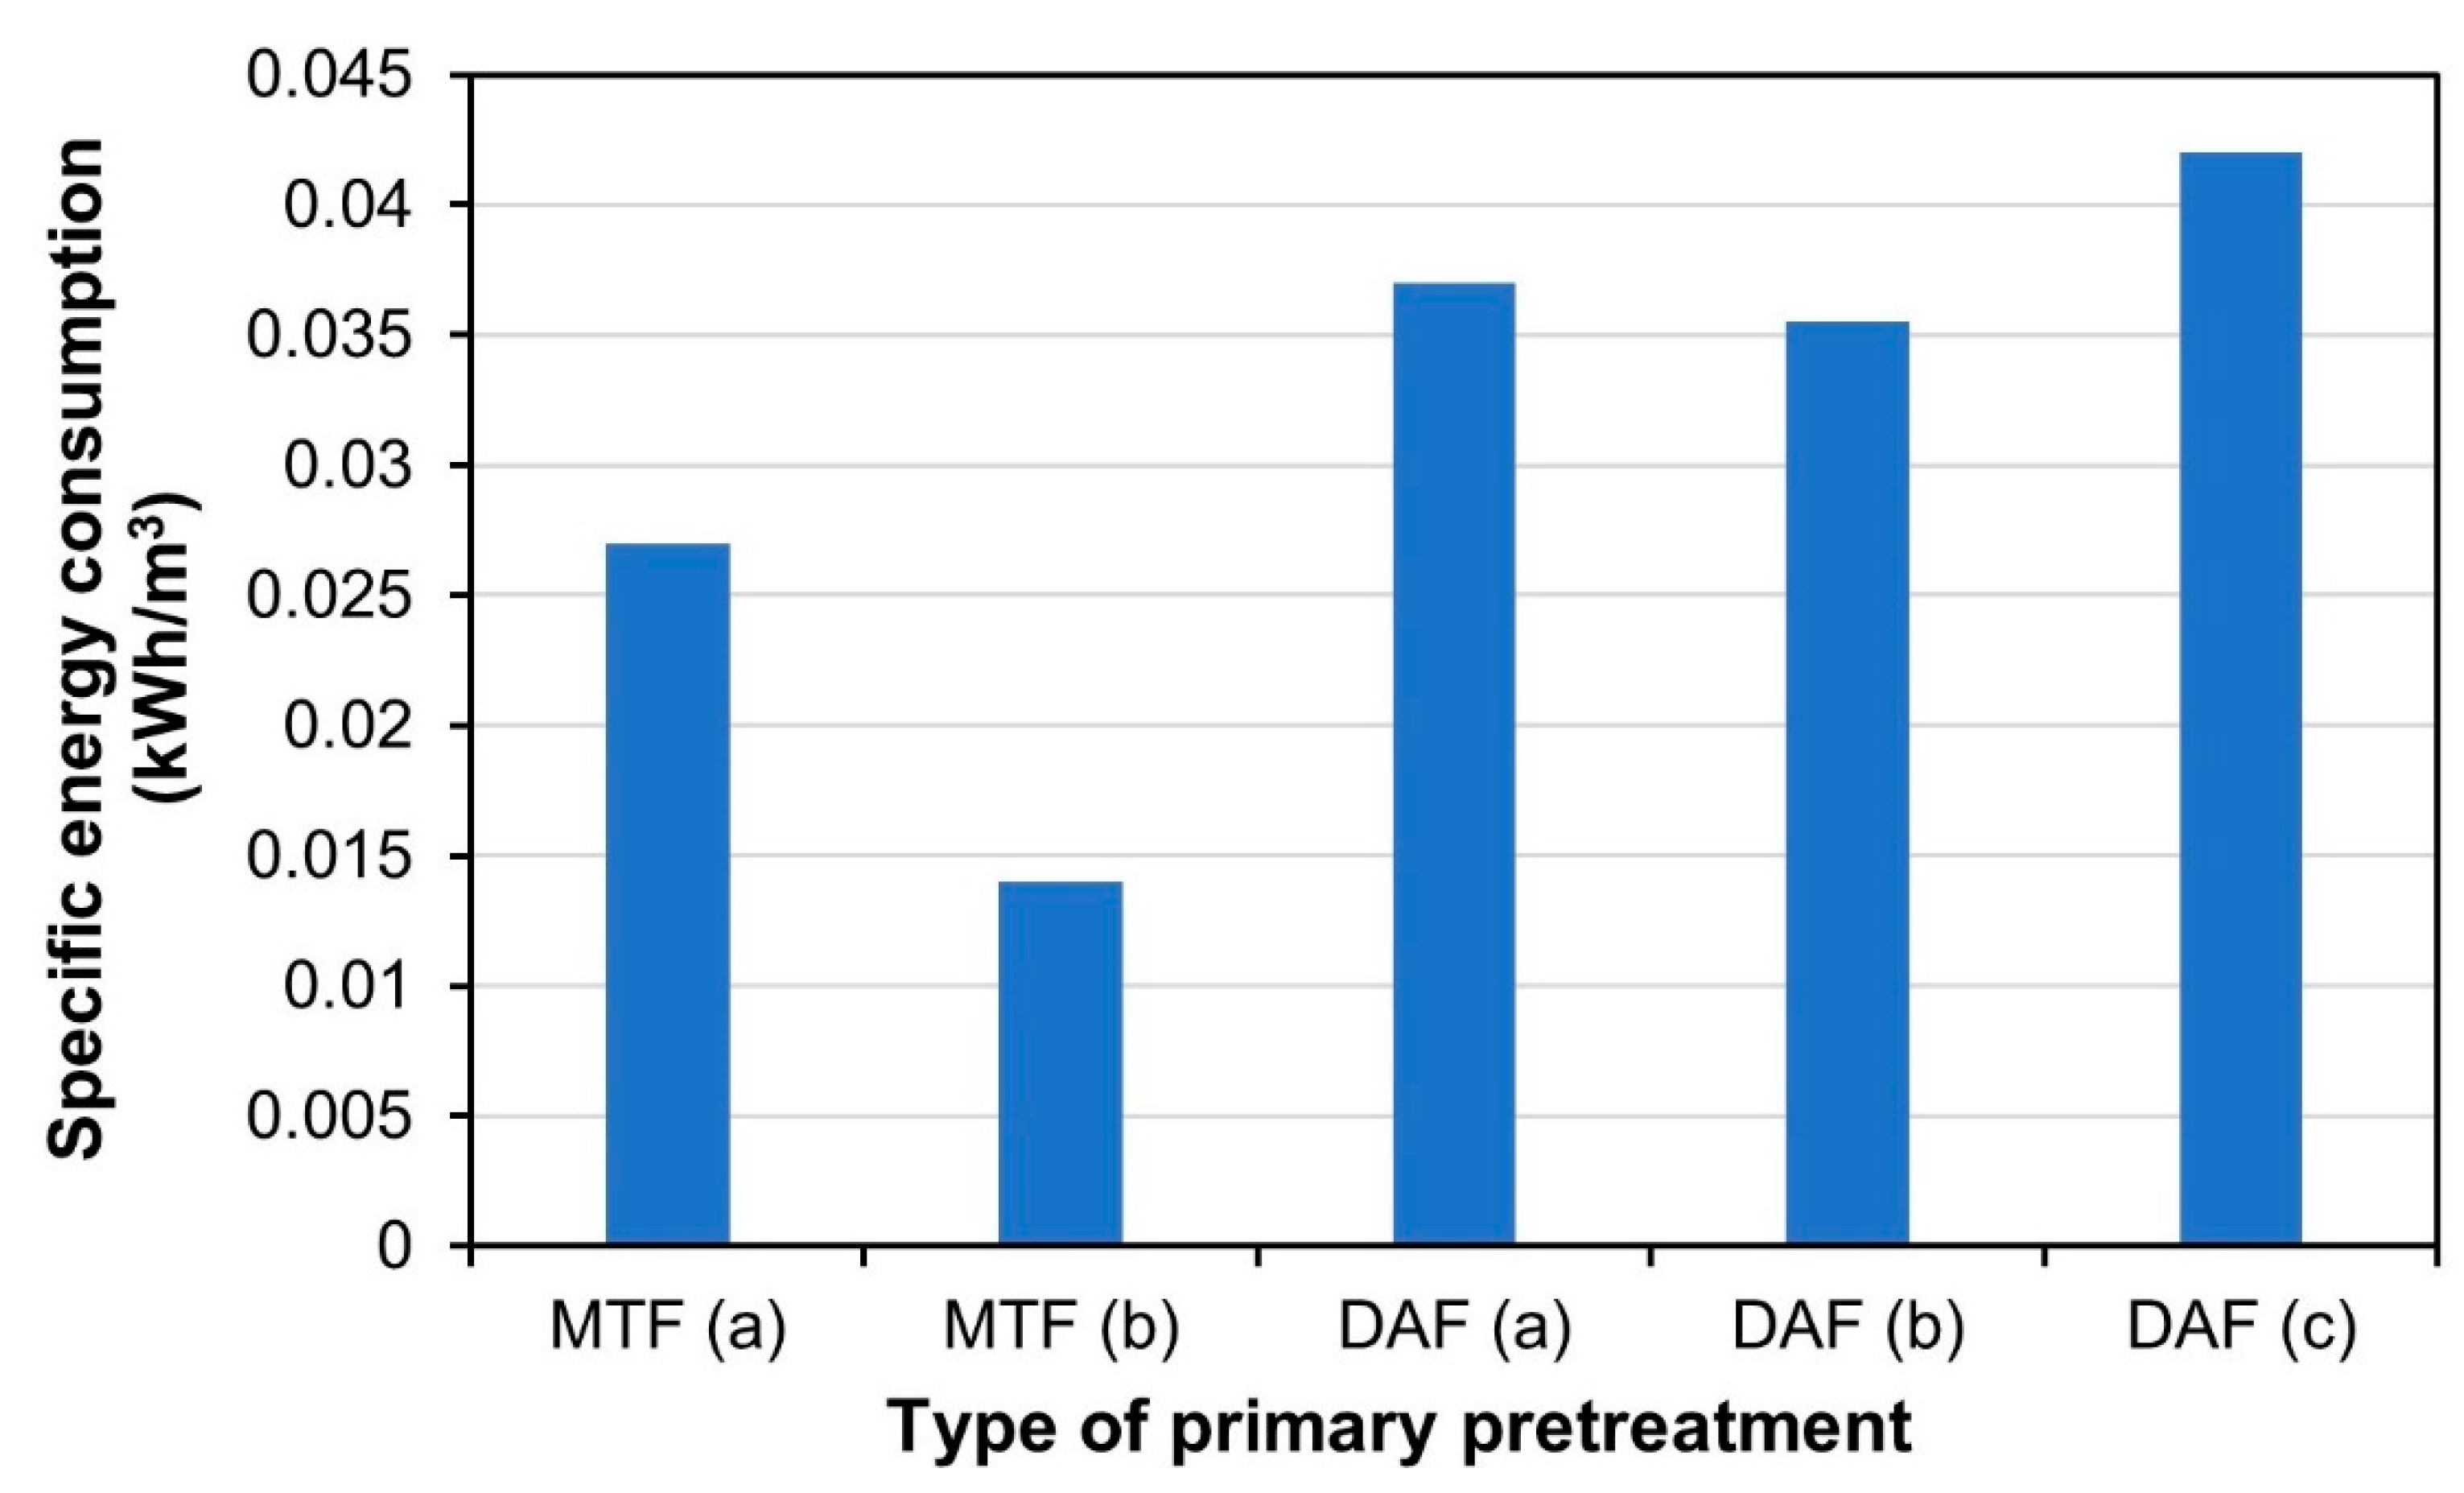
- The SEC of pilot-scale MTF and PFB experiments was 0.027 kWh/m3 and minimum energy for influent supply, respectively, and these values are lower than the known SEC range of the field DAF (0.050 to 0.075 kWh/m3). In the water treatment process using aeration, the proportion of energy consumed by the air blower is very large. As PFB omits aeration, the energy consumption was greatly reduced. These findings suggest that PFB is a valid alternative primary pretreatment process to DAF.
Author Contributions
Funding
Acknowledgments
Conflicts of Interest
References
- Voutchkov, N. Considerations for selection of seawater filtration pretreatment system. Desalination 2010, 261, 354–364. [Google Scholar] [CrossRef]
- Jeong, S.; Kim, S.J.; Kim, L.H.; Shin, M.S.; Vigneswaran, S.; Nguyen, T.V.; Kim, I.S. Foulant analysis of a reverse osmosis membrane used pretreated seawater. J. Membr. Sci. 2013, 428, 434–444. [Google Scholar] [CrossRef]
- Edzwald, J.K.; Haarhoff, J. Seawater pretreatment for reverse osmosis: Chemistry, contaminants, and coagulation. Water Res. 2011, 45, 5428–5440. [Google Scholar] [CrossRef]
- NKwonta, O. A comparison of horizontal roughing filters and vertical roughing filters in wastewater treatment using gravel as a filter media. Int. J. Phys. Sci. 2010, 5, 1240–1247. [Google Scholar]
- Wegelin, M. Surface Water Treatment by Roughing Filters; Swiss Centre for Development Cooperation in Technology and Management: Duebendorf, Switzerland, 1996. [Google Scholar]
- Marshall, H. Environmental Nanotechnology; ED-TECH: Essex, UK, 2018. [Google Scholar]
- Jayalath, J.; Padmasiri, J.; Kulasooriya, S.; Jayawardena, B.; Fonseka, W.; Wijesinghe, L. Algae removal by roughing filter. In Affordable Water Supply and Sanitation; Water, Engineering and Development Centre: London, UK, 1994. [Google Scholar]
- Kim, K.; Kim, I.T.; Ahn, K.H.; Park, J.H.; Lee, Y.J. Water Treatment Apparatus Having Meshed Tubes Provided with Cilia and Water Treatment Method Using the Same. U.S. Patent US8475653B2, 2 July 2013. [Google Scholar]
- Kim, D.H.; Lee, C.; Choi, C.; Ahn, S.J.; Kim, I. Transport analysis of particulate matter in media-saturated mesh tube filter for the desalination primary pretreatment process. Desalination 2020, 495, 114642. [Google Scholar] [CrossRef]
- Cha, G.; Choi, S.; Lee, H.; Kim, K.; Ahn, S.; Hong, S.K. Improving energy efficiency of pretreatment for seawater desalination during algal blooms using a novel meshed tube filtration process. Desalination 2020, 486, 114477. [Google Scholar] [CrossRef]
- Nkwonta, O.; Ochieng, G. Roughing filter for water pre-treatment technology in developing countries: A review. Int. J. Phys. Sci. 2009, 4, 455–463. [Google Scholar]
- Elimelech, M.; Gregory, J.; Jia, X. Particle Deposition and Aggregation: Measurement, Modelling and Simulation; Butterworth-Heinemann: Oxford, UK, 2013. [Google Scholar]
- Bennacer, L.; Ahfir, N.D.; Alem, A.; Wang, H. Coupled effects of ionic strength, particle size, and flow velocity on transport and deposition of suspended particles in saturated porous media. Transp. Porous Media 2017, 118, 251–269. [Google Scholar] [CrossRef]
- Redman, J.A.; Walker, S.L.; Elimelech, M. Bacterial adhesion and transport in porous media: Role of the secondary energy minimum. Environ. Sci. Technol. 2004, 38, 1777–1785. [Google Scholar] [CrossRef]
- Frey, J.M.; Schmitz, P.; Dufrêche, J.; Pinheiro, I.G. Particle deposition in porous Media: Analysis of hydrodynamic and weak inertial effects. Transp. Porous Media 1999, 37, 25–54. [Google Scholar] [CrossRef]
- Bhattacharjee, S.; Elimelech, M. Surface element integration: A novel technique for evaluation of DLVO interaction between a particle and a flat plate. J. Colloid Interface Sci. 1997, 193, 273–285. [Google Scholar] [CrossRef]
- Tufenkji, N.; Elimelech, M. Correlation equation for predicting single-collector efficiency in physicochemical filtration in saturated porous media. Environ. Sci. Technol. 2004, 38, 529–536. [Google Scholar] [CrossRef]
- Ruckenstein, E.; Prieve, D.C. Adsorption and desorption of particles and their chromatographic separation. AIChE J. 1976, 22, 276–283. [Google Scholar] [CrossRef]
- Khilar, K.C.; Vaidya, R.; Fogler, H. Colloidally-induced fines release in porous media. J. Pet. Sci. Eng. 1990, 4, 213–221. [Google Scholar] [CrossRef]
- Ryan, J.N.; Gschwend, P.M. Effects of ionic strength and flow rate on colloid release: Relating kinetics to intersurface potential energy. J. Colloid Interface Sci. 1994, 164, 21–34. [Google Scholar] [CrossRef]
- Choi, C.; Lee, C.; Park, N.S.; Kim, I.S. Numerical study of fluid behavior on protruding shapes within the inlet part of pressurized membrane module using computational fluid dynamics. Environ. Eng. Res. 2019, 25, 498–505. [Google Scholar] [CrossRef]
- Sharma, C.; Malhotra, D.; Rathore, A.S. Review of computational fluid dynamics applications in biotechnology processes. Biotechnol. Prog. 2012, 27, 1497–1510. [Google Scholar] [CrossRef] [PubMed]
- Kavianipour, O.; Ingram, G.D.; Vuthaluru, H.B. Investigation into the effectiveness of feed spacer configurations for reverse osmosis membrane modules using Computational Fluid Dynamics. J. Membr. Sci. 2017, 526, 156–171. [Google Scholar] [CrossRef]
- Versteeg, H.K.; Malalasekera, W. An Introduction to Computational Fluid Dynamics: The Finite Volume Method, 2nd ed.; Pearson Education: Essex, UK, 2007. [Google Scholar]
- Launder, B.E.; Spalding, D.B. The numerical computation of turbulent flows. In Numerical Prediction of Flow, Heat Transfer, Turbulence and Combustion; Pergamon Press: New York, NY, USA, 1983; pp. 96–116. [Google Scholar]
- Sun, F.; Xiao, K.; Zhu, W.; Withanageb, N.; Zhou, Y. Enhanced sludge solubilization and dewaterability by synergistic effects of nitrite and freezing. Water Res. 2018, 130, 208–214. [Google Scholar] [CrossRef]
- Mathur, S. Kaolin flotation. J. Colloid Interface Sci. 2002, 256, 153–158. [Google Scholar] [CrossRef]
- Chen, Y.; Liu, S.; Wang, G. A kinetic investigation of cationic starch adsorption and flocculation in kaolin suspension. Chem. Eng. J. 2007, 133, 325–333. [Google Scholar] [CrossRef]
- Ho, Y.; Ismail, N.; Alkarkhi, A.F.; Morad, N. Characterization of biopolymeric flocculant (pectin) and organic synthetic flocculant (PAM): A comparative study on treatment and optimization in kaolin suspension. Bioresour. Technol. 2010, 101, 1166–1174. [Google Scholar] [CrossRef] [PubMed]
- Voutchkov, N. Desalination Engineering: Planning and Design; McGraw Hill Professional: New York, NY, USA, 2012. [Google Scholar]
- Edzwald, J.K. Dissolved air flotation and me. Water Res. 2010, 44, 2077–2106. [Google Scholar] [CrossRef]
- Lakghomi, B.; Lawryshyn, Y.; Hofmann, R. A model of particle removal in a dissolved air flotation tank: Importance of stratified flow and bubble size. Water Res. 2015, 68, 262–272. [Google Scholar] [CrossRef]
- López-León, T.; Jodar-Reyes, A.B.; Bastos-González, D.; Ortega-Vinuesa, J.L. Hofmeister effects in the stability and electrophoretic mobility of polystyrene latex particles. J. Phys. Chem. B 2003, 107, 5696–5708. [Google Scholar] [CrossRef]
- Furlong, D.N.; Launikonis, A.; Sasse, W.H.F.; Sanders, J.V. Colloidal platinum sols. Preparation, characterization and stability towards salt. J. Chem. Soc. Faraday Trans. 1 Phys. Chem. Condens. Phases 1984, 80, 571–588. [Google Scholar] [CrossRef]
- Behrens, S.H.; Borkovec, M.; Schurtenberger, P. Aggregation in charge-stabilized colloidal suspensions revisited. Langmuir 1998, 14, 1951–1954. [Google Scholar] [CrossRef]
- Kobayashi, M.; Skarba, M.; Galletto, P.; Čakara, D.; Borkovec, M. Effects of heat treatment on the aggregation and charging of Stöber-type silica. J. Colloid Interface Sci. 2005, 292, 139–147. [Google Scholar] [CrossRef]
- Ryde, N.; Matijević, E. Kinetics of heterocoagulation. Part 4—Evaluation of absolute coagulation rate constants using a classical light scattering technique. J. Chem. Soc. Faraday Trans. 1994, 90, 167–171. [Google Scholar] [CrossRef]
- Ometto, F.; Pozza, C.; Whitton, R.; Smyth, B.; Torres, A.G.; Henderson, R.; Jarvis, P.; Jefferson, B.; Villa, R. The impacts of replacing air bubbles with microspheres for the clarification of algae from low cell-density culture. Water Res. 2014, 53, 168–179. [Google Scholar] [CrossRef]
- Twort, A.C.; Ratnayaka, D.D.; Brandt, M.J. Water Supply; Butterworth-Heinemann: Oxford, UK, 2000. [Google Scholar]
- Panepinto, D.; Fiore, S.; Zappone, M.; Genon, G.; Meucci, L. Evaluation of the energy efficiency of a large wastewater treatment plant in Italy. Appl. Energy 2016, 161, 404–411. [Google Scholar] [CrossRef]
- Tao, X.; Chengwen, W. Energy consumption in wastewater treatment plants in China. In Proceedings of the World Congress on Water, Climate and Energy 2012, Dublin, Ireland, 13–18 May 2012. [Google Scholar]
- Krzeminski, P.; Van Der Graaf, J.H.J.M.; Van Lier, J.B. Specific energy consumption of membrane bioreactor (MBR) for sewage treatment. Water Sci. Technol. 2012, 65, 380–392. [Google Scholar] [CrossRef] [PubMed]
- Wei, X.; Binger, Z.M.; Achilli, A.; Sanders, K.T.; Childress, A.E. A modeling framework to evaluate blending of seawater and treated wastewater streams for synergistic desalination and potable reuse. Water Res. 2020, 170, 115282. [Google Scholar] [CrossRef]
- Intelligence, G.W. IDA Desalination Yearbook 2016–2017; Media Analytics Ltd.: Oxford, UK, 2016. [Google Scholar]
- Simon, F.X.; Penru, Y.; Guastalli, A.R.; Esplugas, S.; Llorens, J.; Baig, S. NOM characterization by LC-OCD in a SWRO desalination line. Desalination Water Treat. 2013, 51, 1776–1780. [Google Scholar] [CrossRef]
- Katsoufidou, K.; Sioutopoulos, D.; Yiantsios, S.; Karabelas, A.J. UF membrane fouling by mixtures of humic acids and sodium alginate: Fouling mechanisms and reversibility. Desalination 2010, 264, 220–227. [Google Scholar] [CrossRef]
- Jermann, D.; Pronk, W.; Meylan, S.; Boller, M. Interplay of different NOM fouling mechanisms during ultrafiltration for drinking water production. Water Res. 2007, 41, 1713–1722. [Google Scholar] [CrossRef]
- Kimura, K.; Hane, Y.; Watanabe, Y.; Amy, G.; Ohkuma, N. Irreversible membrane fouling during ultrafiltration of surface water. Water Res. 2004, 38, 3431–3441. [Google Scholar] [CrossRef] [PubMed]
- Beyer, M.; Lohrengel, B.; Nghiem, L.D. Membrane fouling and chemical cleaning in water recycling applications. Desalination 2010, 250, 977–981. [Google Scholar] [CrossRef]
- Hong, S.; Elimelech, M. Chemical and physical aspects of natural organic matter (NOM) fouling of nanofiltration membranes. J. Membr. Sci. 1997, 132, 159–181. [Google Scholar] [CrossRef]


| Salt (g) | g/L |
|---|---|
| NaCl | 24.530 |
| MgCl2 | 5.200 |
| Na2SO4 | 4.090 |
| CaCl2 | 1.160 |
| KCl | 0.695 |
| NaHCO3 | 0.201 |
| KBr | 0.101 |
| H3BO3 | 0.027 |
| Total salt mass (g) | 36.004 |
| Solution density (g/L) |
| Item | Value |
|---|---|
| Software | Ansys 19.1 CFX |
| Filter bed (MTF) | Volume: 3.2 m3 (0.45 m (w) × 0.55 m (d) × 1.3 m (h) × 10ea) Porosity: 0.9 |
| Aeration rate: 50 L/min using 10 air diffusers | |
| Filter bed (PFB) | Volume: 3.3 m3 (0.6 m (w) × 1.4 m (d) × 2 m (h) × 2ea) Porosity: 0.9 |
| Inlet | Flow rate: 4.16 kg/s (≒ 360 m3/d, HRT: 30 min) SS: 1% BSA (density: 1.003 g/cm3, viscosity: 1000 Pa∙s) |
© 2020 by the authors. Licensee MDPI, Basel, Switzerland. This article is an open access article distributed under the terms and conditions of the Creative Commons Attribution (CC BY) license (http://creativecommons.org/licenses/by/4.0/).
Share and Cite
Kim, D.-H.; Choi, C.; Lee, C.; Adha, R.S.; Nguyen, T.-T.; Ahn, S.-J.; Son, H.-J.; Kim, I.S. An Improved Configuration of Vertical-Flow Mesh Tube Filters for Seawater Pretreatment: Performance, Cleaning, and Energy Consumption. Water 2020, 12, 2804. https://doi.org/10.3390/w12102804
Kim D-H, Choi C, Lee C, Adha RS, Nguyen T-T, Ahn S-J, Son H-J, Kim IS. An Improved Configuration of Vertical-Flow Mesh Tube Filters for Seawater Pretreatment: Performance, Cleaning, and Energy Consumption. Water. 2020; 12(10):2804. https://doi.org/10.3390/w12102804
Chicago/Turabian StyleKim, Dong-Ho, Changkyoo Choi, Chulmin Lee, Rusnang Syamsul Adha, Thanh-Tin Nguyen, Sang-Jun Ahn, Hee-Jong Son, and In S. Kim. 2020. "An Improved Configuration of Vertical-Flow Mesh Tube Filters for Seawater Pretreatment: Performance, Cleaning, and Energy Consumption" Water 12, no. 10: 2804. https://doi.org/10.3390/w12102804
APA StyleKim, D.-H., Choi, C., Lee, C., Adha, R. S., Nguyen, T.-T., Ahn, S.-J., Son, H.-J., & Kim, I. S. (2020). An Improved Configuration of Vertical-Flow Mesh Tube Filters for Seawater Pretreatment: Performance, Cleaning, and Energy Consumption. Water, 12(10), 2804. https://doi.org/10.3390/w12102804