1. Introduction
The safety assessment of a subsurface repository for high-level radioactive waste (HLW) is to estimate the dose rates of the nuclides reached to the biosphere from the repository. One of the major pathways of the nuclides from the repository to the biosphere is groundwater flow, and the reliability of the safety assessment is controlled by the uncertainty in hydrogeological characterization of the disposal site. Crystalline fractured rock is one of the preferred host rocks for HLW disposal repositories. In a fractured rock, groundwater flows predominantly through fractures rather than matrix, which makes crystalline rock very heterogeneous and discrete hydraulically. Hydraulic tests for hydrogeological characterization are generally analyzed with the semi-analytical solutions induced from the assumption of a homogeneous and continuous medium, thus the hydrogeological characterization of a fractured rock is more uncertain than a porous medium.
The semi-analytical solutions for the hydraulic test analyses also assume the linear relation between the pressure gradient and the flux. However, it was reported that fluid flow in a fracture deviates from the linear relation at sufficiently large Reynolds numbers (Re), e.g., [
1,
2,
3], and it was suggested that the nonlinear flow occurs due to the geometrical characteristics of a fracture and significant inertia of flowing fluid, e.g., [
4,
5,
6]. In the hydraulic tests, such as pumping and slug tests in fractured rocks, nonlinear flow was also observed. Using the results of constant rate injection tests with various rates in a fractured sedimentary rock, Quinn et al. [
7] analyzed the relation between the imposed injection rates and the resulting stabilized head changes and found that that relation deviated from linearity as the injection rate increased. From this result, they identified the nonlinear flow regime at the test zone. Quinn et al. [
8] determined the critical flow rate, where the groundwater flow began to depart from the linear flow regime, from the constant-head step tests in a fractured sedimentary rock. By comparing the determined critical flow rate to the measured flow rates during slug tests, they suggested the appropriate initial displacement, below which the linear flow regime was guaranteed during a slug test at the test zone. Ji and Koh [
9] conducted slug tests in fractured granite rock with various initial displacements. They found that a nonlinear flow arose during the slug test and influenced the test results when the initial displacement was large. They identified the nonlinear flow regimes during the slug tests by calculating a representative Re with the slug test and borehole logging results. Then, they suggested the way to estimate the hydraulic conductivity in a linear flow regime by using the Forchheimer equation and data from the slug tests in a nonlinear flow regime. Chen et al. [
10] introduced the relationship curves between flow rate and injection pressure from the constant head injection tests in fractured granite rock, and divided the flow regimes during the tests into a laminar, non-Darcian, and hydraulic fracturing phases based on the relation between the flow rate and pressure. Then, they estimated the hydraulic conductivities of the test zones in different flow regimes using an Izbash’s law based empirical model.
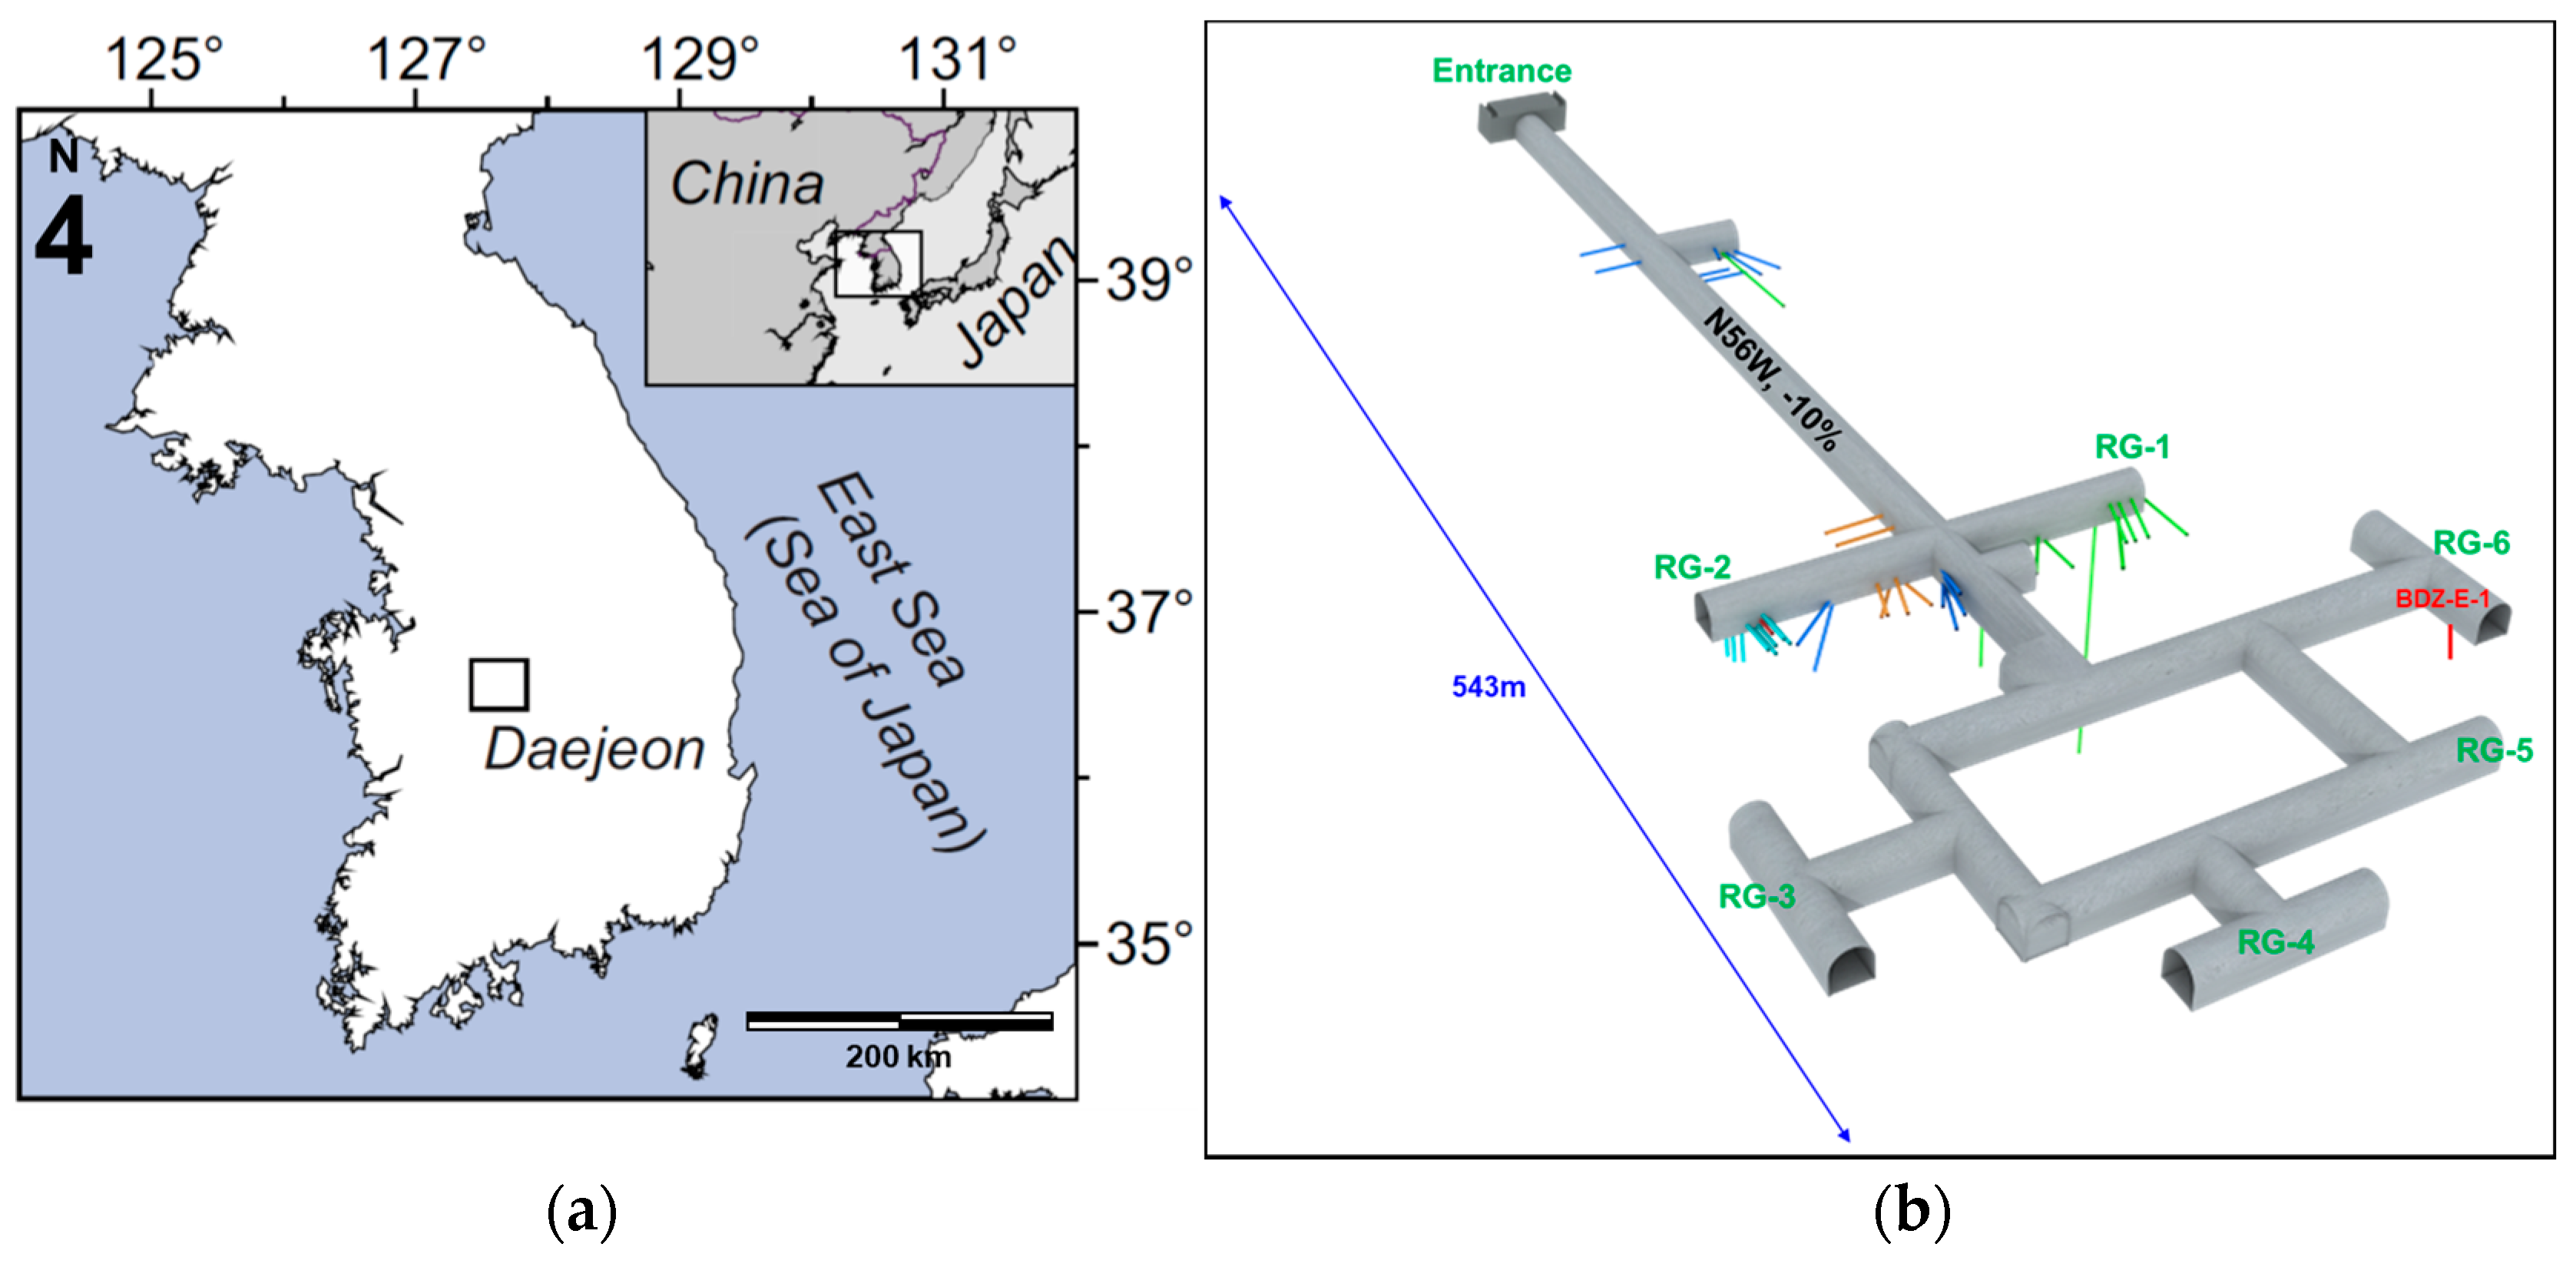
As reviewed in the previous researches, excessive injection or extraction of water may induce a nonlinear flow during a hydraulic test in fractured rock. In this study, we evaluated the possibility of distortion of the estimated hydraulic properties from a hydraulic test due to nonlinear flow. We conducted pulse, slug, and constant head withdrawal tests with various head displacements using a double packer system in a borehole at Korea Atomic Energy Research Institute (KAERI) Underground Research Tunnel (URT), hereafter KURT. With the geophysical logging data for the test borehole and the monitored hydraulic heads during the tests, changes of the representative Re were calculated for identifying the nonlinear flow regimes during the tests. Considering the influence of nonlinear flow, distortion of the estimated hydraulic conductivity from pulse, slug, and constant head withdrawal tests were discussed.
3. Results and Discussion
Pulse, slug, and constant head withdrawal tests were conducted in each test zone except several sections due to technical issues.
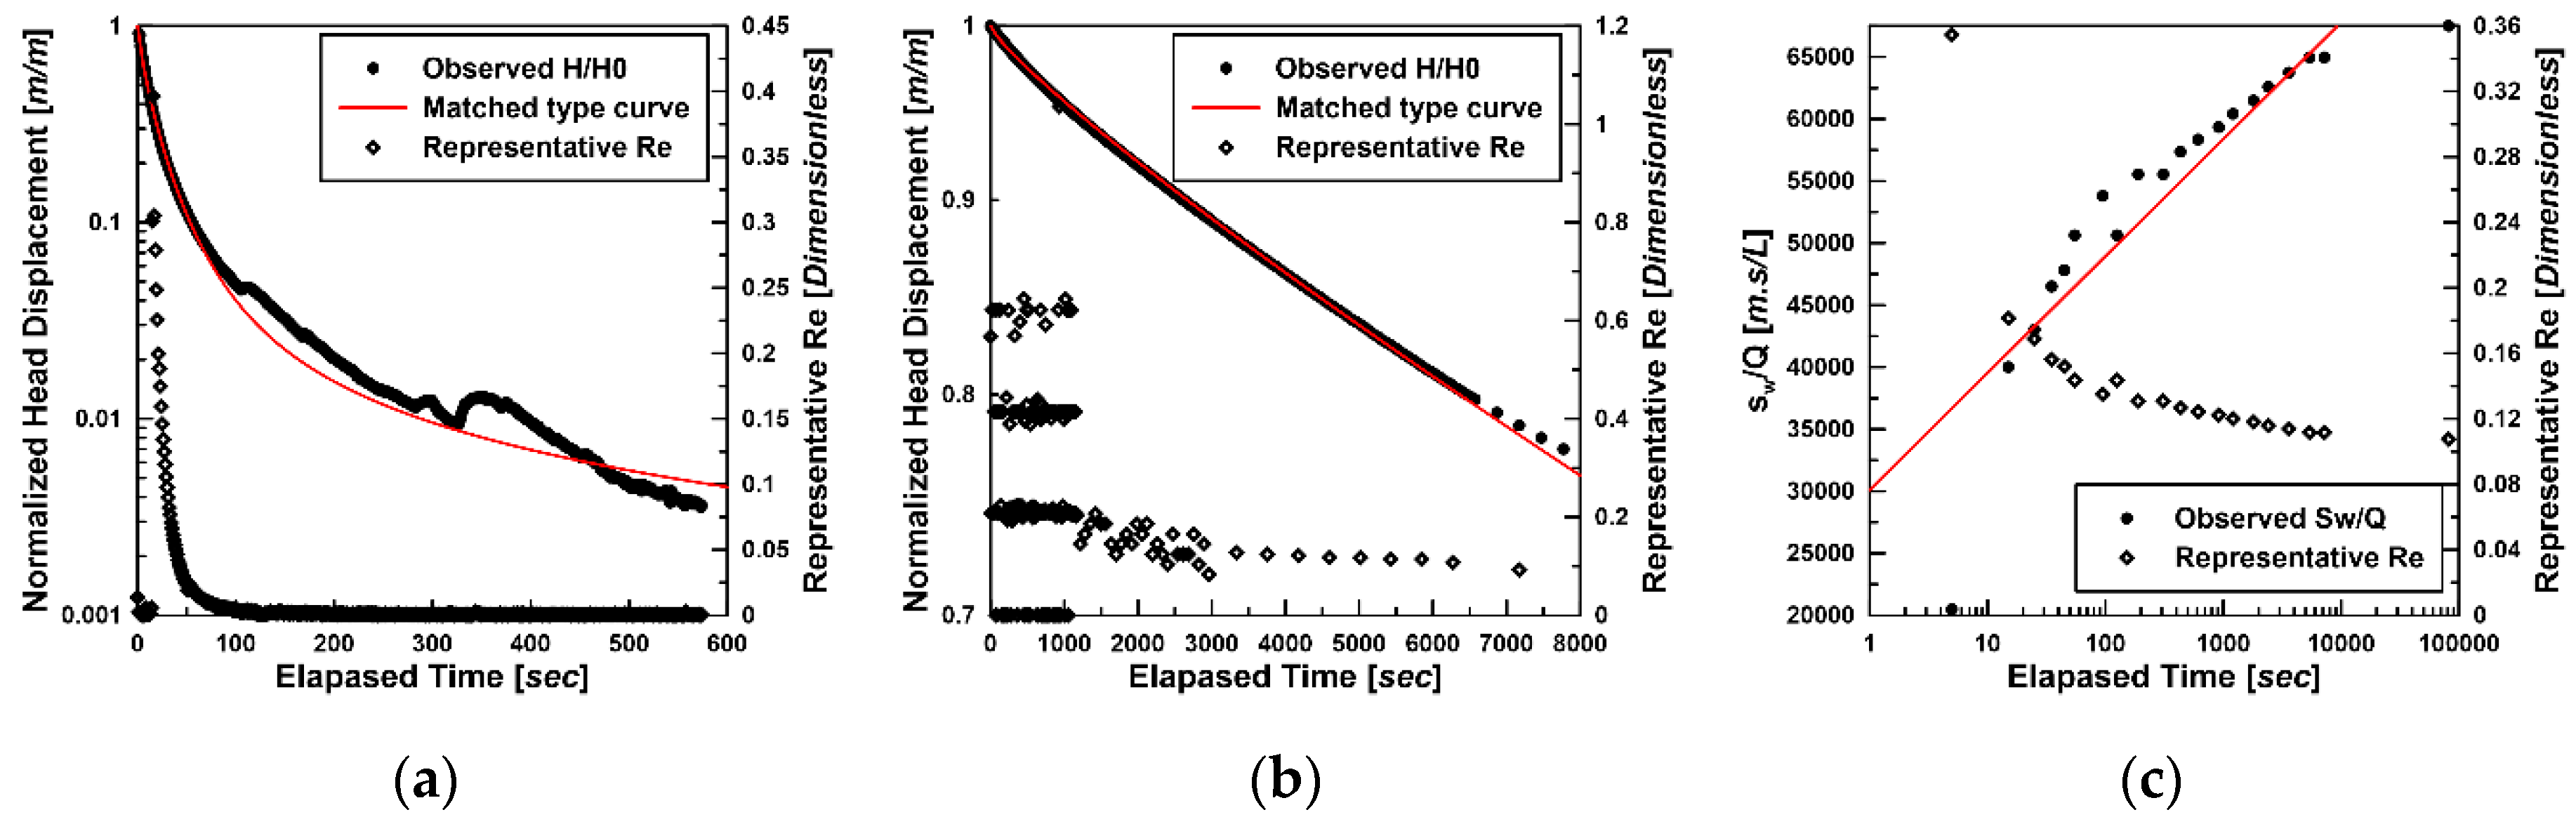
Figure 3 shows the results of pulse, slug, and constant head withdrawal tests conducted at section 3 as an example. Note that
and
in
Figure 3c are the specified head displacement for a constant head withdrawal test and measured outflow rate during the test, respectively. Using the logged data on open fractures, the monitored hydraulic heads and flow rates, and then the representative Re at a hydraulically conductive fracture in the test zone during the tests, were estimated using Equations (1)–(5) as shown in
Figure 3. Regardless of the type of test, the representative Re were initially maximum and then gradually decreased, as were the head displacements and flow rates. This pattern of change in the representative Re was the same for all test sections. This is because the representative Re is proportional to the flow rate as in Equation (1).
To estimate
of the test zones, the results of the conducted hydraulic tests were analyzed using the type curves from the semi-analytical solutions for pulse, slug, and constant head withdrawal tests.
Figure 3 indicates the optimal matched type curves for the results of pulse, slug, and constant head withdrawal tests at section 3 as an example. Most of pulse and slug tests were optimally matched with the Cooper–Bredehoeft–Papadopulos model except sections 4, 6, and 11. The Bouwer–Rice model for pulse and slug tests was developed from the Thiem equation which assumes the steady state groundwater flow [
12], but the Cooper–Bredehoeft–Papadopulos model was induced from the partial differential equation describing the transient groundwater flow in a confined aquifer [
14]. Thus, the optimization results of pulse and slug tests with the type curves show that the effect of storage was relatively large in the most test zones. Most of constant head withdrawal tests were matched well with the straight line model, which means that the storage coefficients of the test zones were enough small to approximate the well function,
, to
, where
(dimensionless) is a variable defined as
,
(L
2/T) is the transmissivity,
(T) is the elapsed time since the test began, and
(dimensionless) is the storage coefficient [
16].
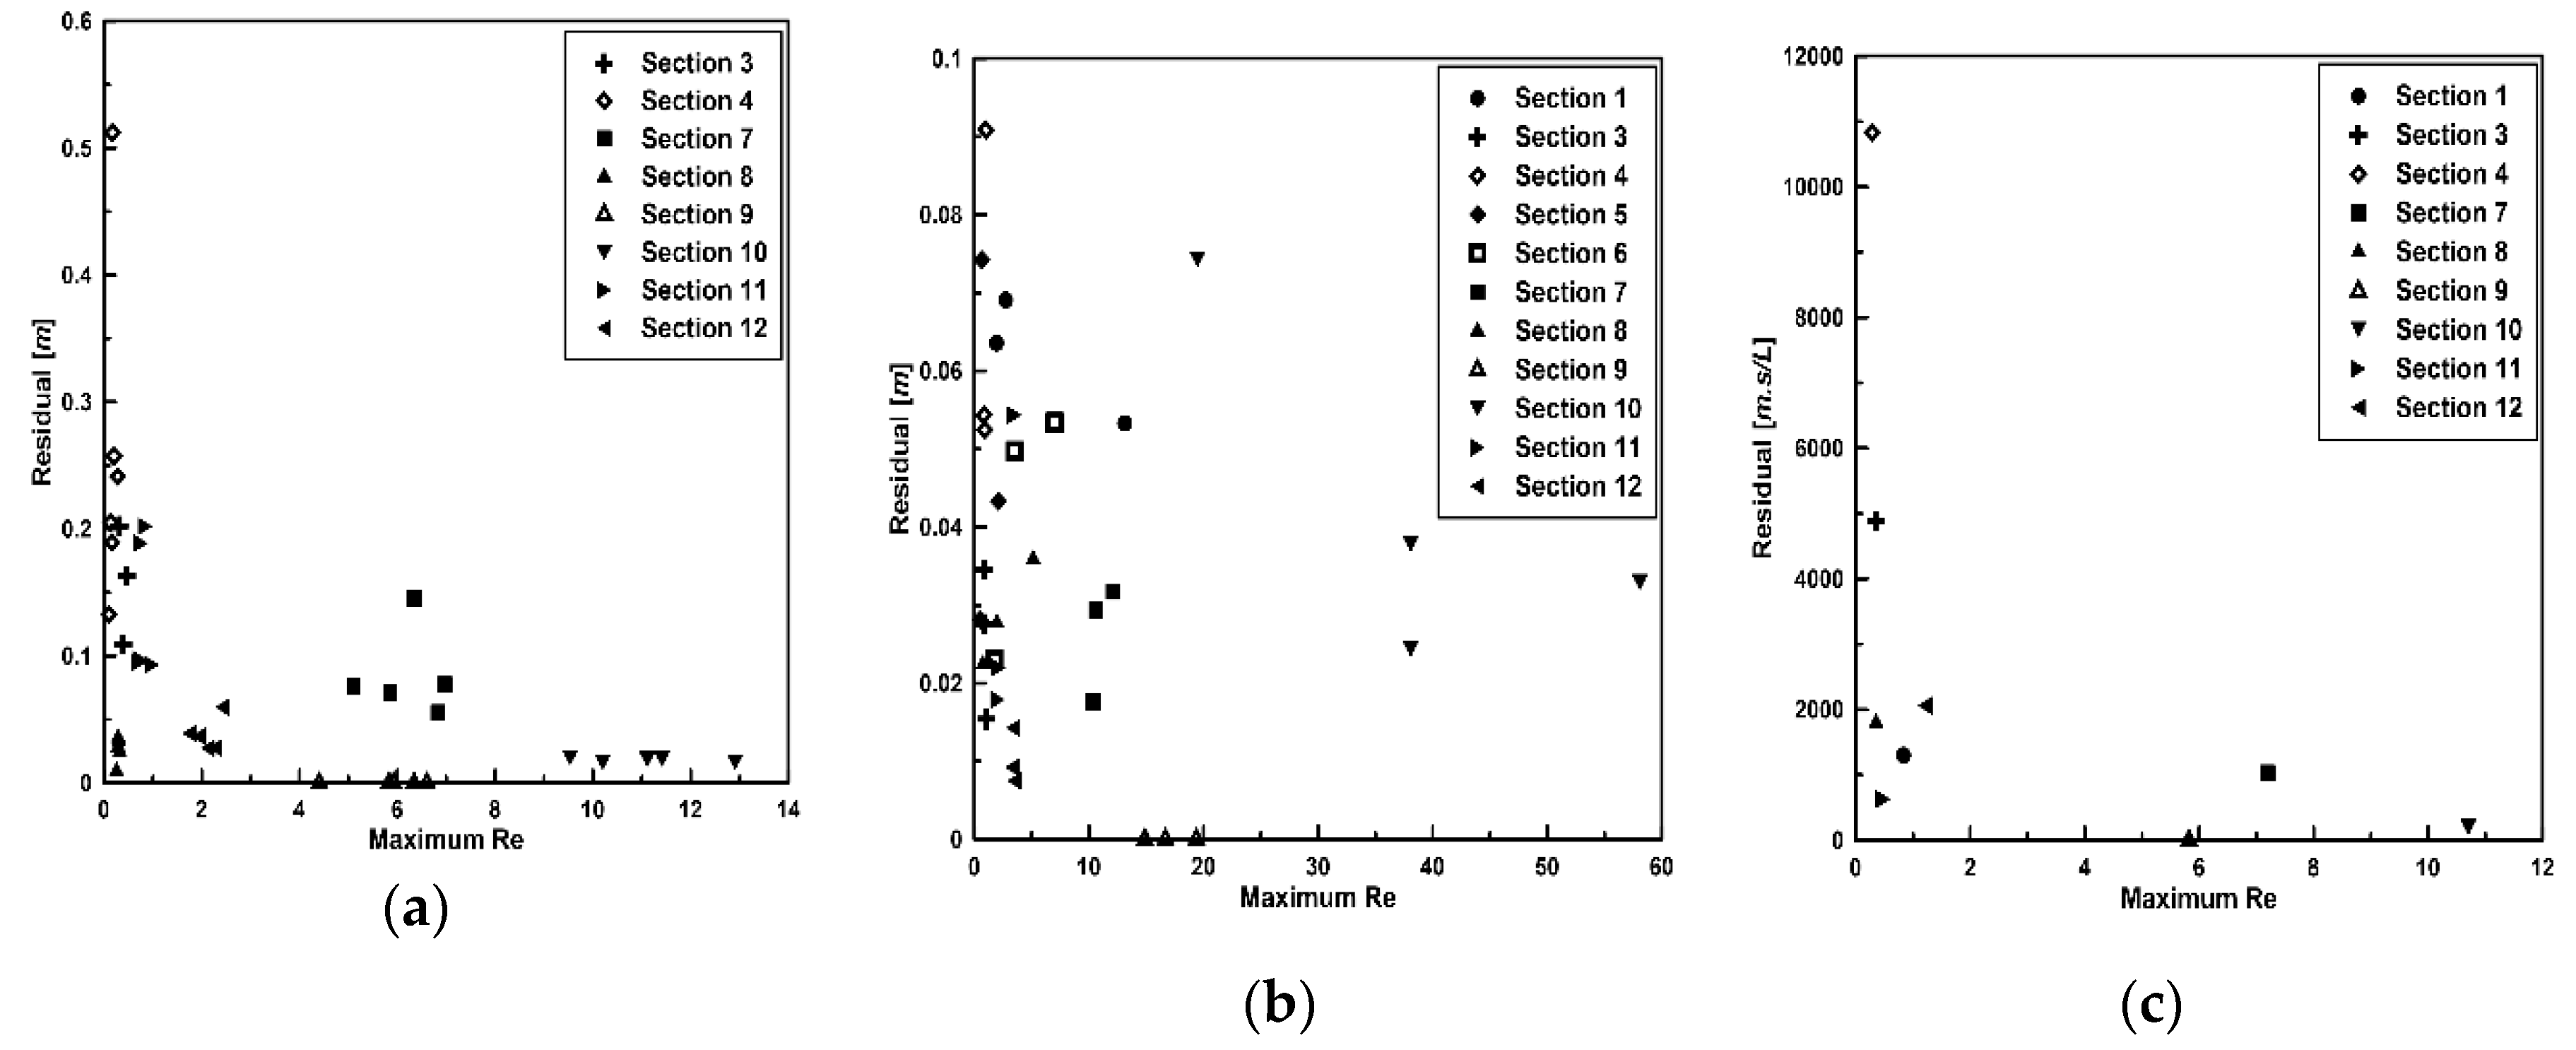
Figure 4 shows the residuals between the observed data and optimized type curves. Generally, the residuals of pulse tests were 2 to 9 times larger than those of slug tests, depending on the test zones. This result indicates that groundwater flow during a pulse test was more likely to deviate from the type curve than a slug test and the uncertainty in interpretation of the pulse test was greater than the slug test. Since each test zone has different hydraulic characteristics, it is meaningless to evaluate the relation between the residual and maximum Re during hydraulic tests without considering the test zone. In pulse tests, there was no clear correlation when the relation between the residual and maximum Re for each test zone was examined (
Figure 4a). In slug tests, however, the residual generally increased at a larger maximum Re for several test zones (
Figure 4b), which means that groundwater flow during a slug test deviated from the theoretical behavior expressed by the type curve with a linear groundwater flow assumption. From the results of the constant head withdrawal tests, the relation between the residual and the maximum Re could not be evaluated because the constant head withdrawal test was conducted only once for each test zone (
Figure 4c).
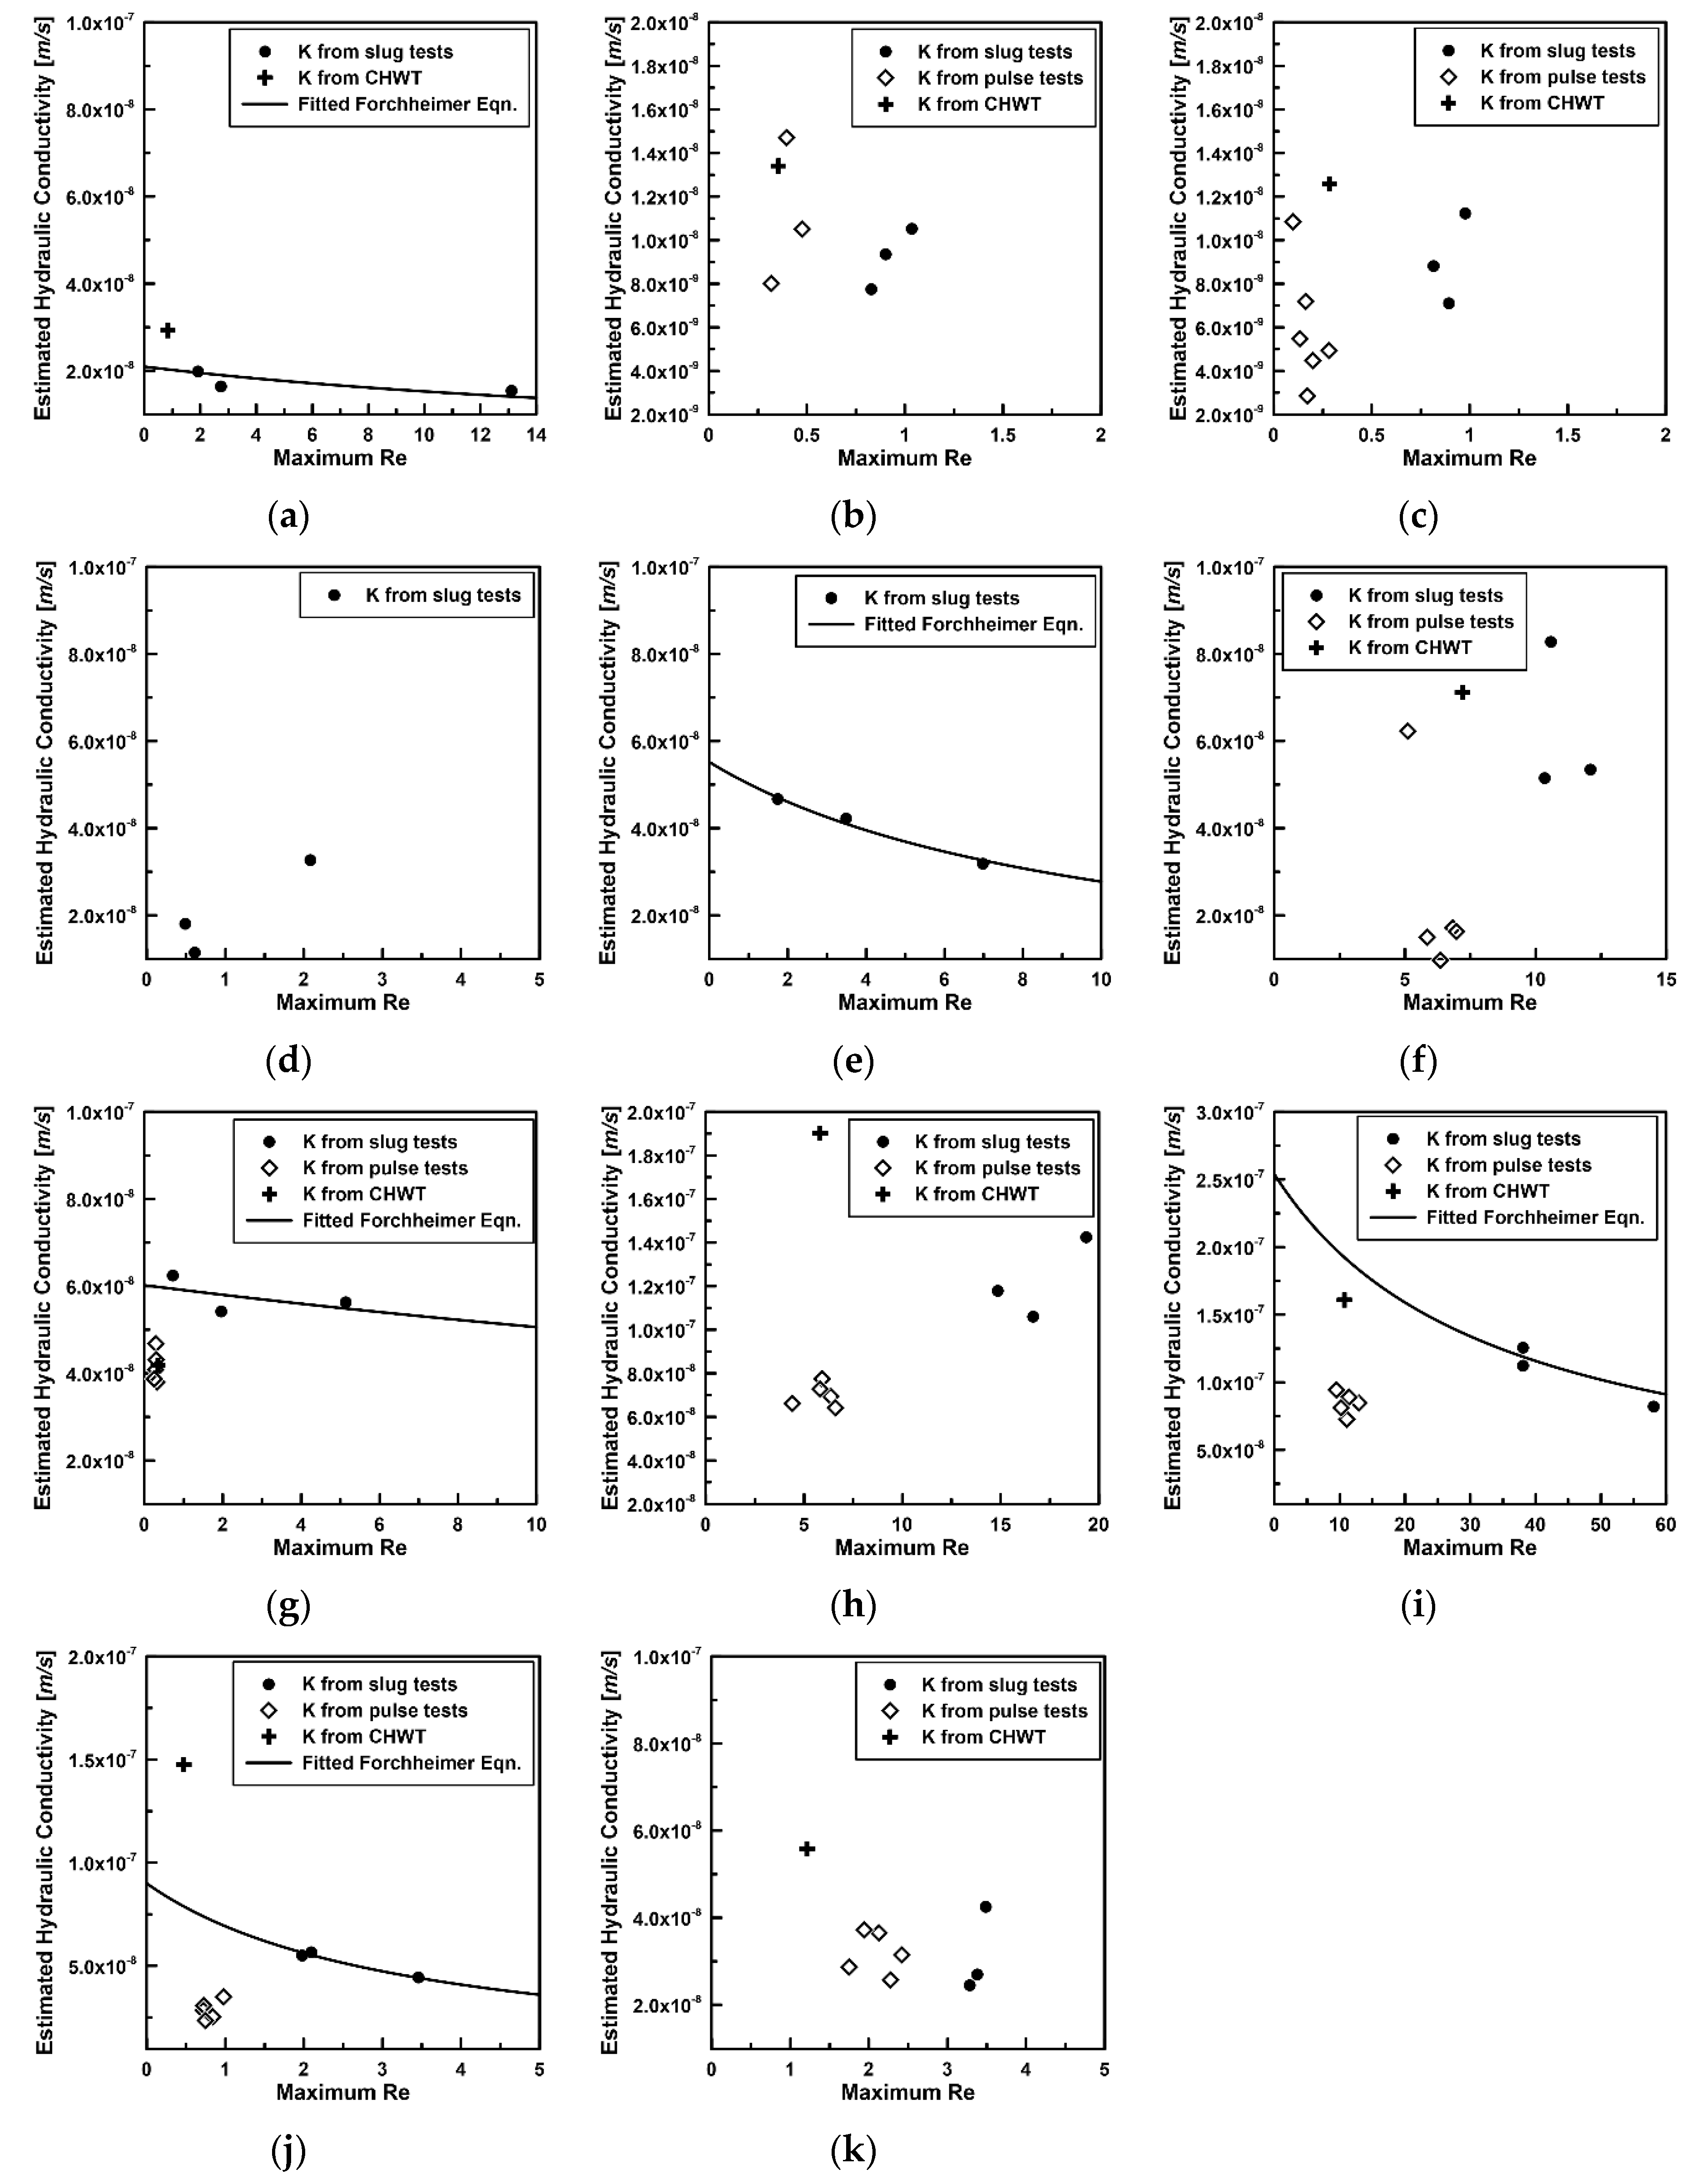
The relations between the maximum Re and estimated
from pulse, slug, and constant head withdrawal tests for each test zone were shown in
Figure 5. For pulse tests, the estimated
for each test zone showed similar values, and there was no clear correlation between the maximum Re and estimated
. In section 10, the estimated
seems to decrease as the maximum Re increases, but it is not clear because the range of maximum
is small (
Figure 5i). The maximum Re during pulse tests were less than ~7, except section 10. Accordingly, it seems that the nonlinear flow did not occur during the pulse tests. This is because a pulse test is a hydraulic test that utilize pressure changes rather than actual water movement and the flow rates were very small despite the large
.
For slug tests, it was difficult to see the correlation between the estimated
and maximum Re in sections 3–5, 7, 9, and 12 (
Figure 5b–d,f,h,k). The maximum Re of those test zones were below 5 except section 12. Considering the reported critical Re and the graphs showing the estimated
and maximum Re, the groundwater flow regimes during slug tests at those test zones were likely to be linear ones, and the probability that the estimated
were distorted by nonlinear flow was small. In sections 1, 6, 8, 10, and 11, however, the estimated
decreased with an increase in the maximum Re, and the relations between the estimated
and maximum Re were fitted to Equation (7) (
Figure 5a,e,g,i,j). This shows that nonlinear flows were likely to have effects on estimating
of sections 1, 6, 8, 10, and 11 from slug tests. From the fitted curves,
of sections 1, 6, 8, 10, and 11 were optimized to
m/s,
m/s,
m/s,
m/s, and
m/s, respectively. The critical Re for slug tests in those test zones were ranged from ~1.1 to ~5.9. Note that the reported critical Re varied in a range from 0.001 to 24.8, which was suggested through numerical, laboratory and field experimental analyses: 0.001–25 [
3], 1 [
5], 5 [
21], 3–12 [
9], and 3.5–24.8 [
22].
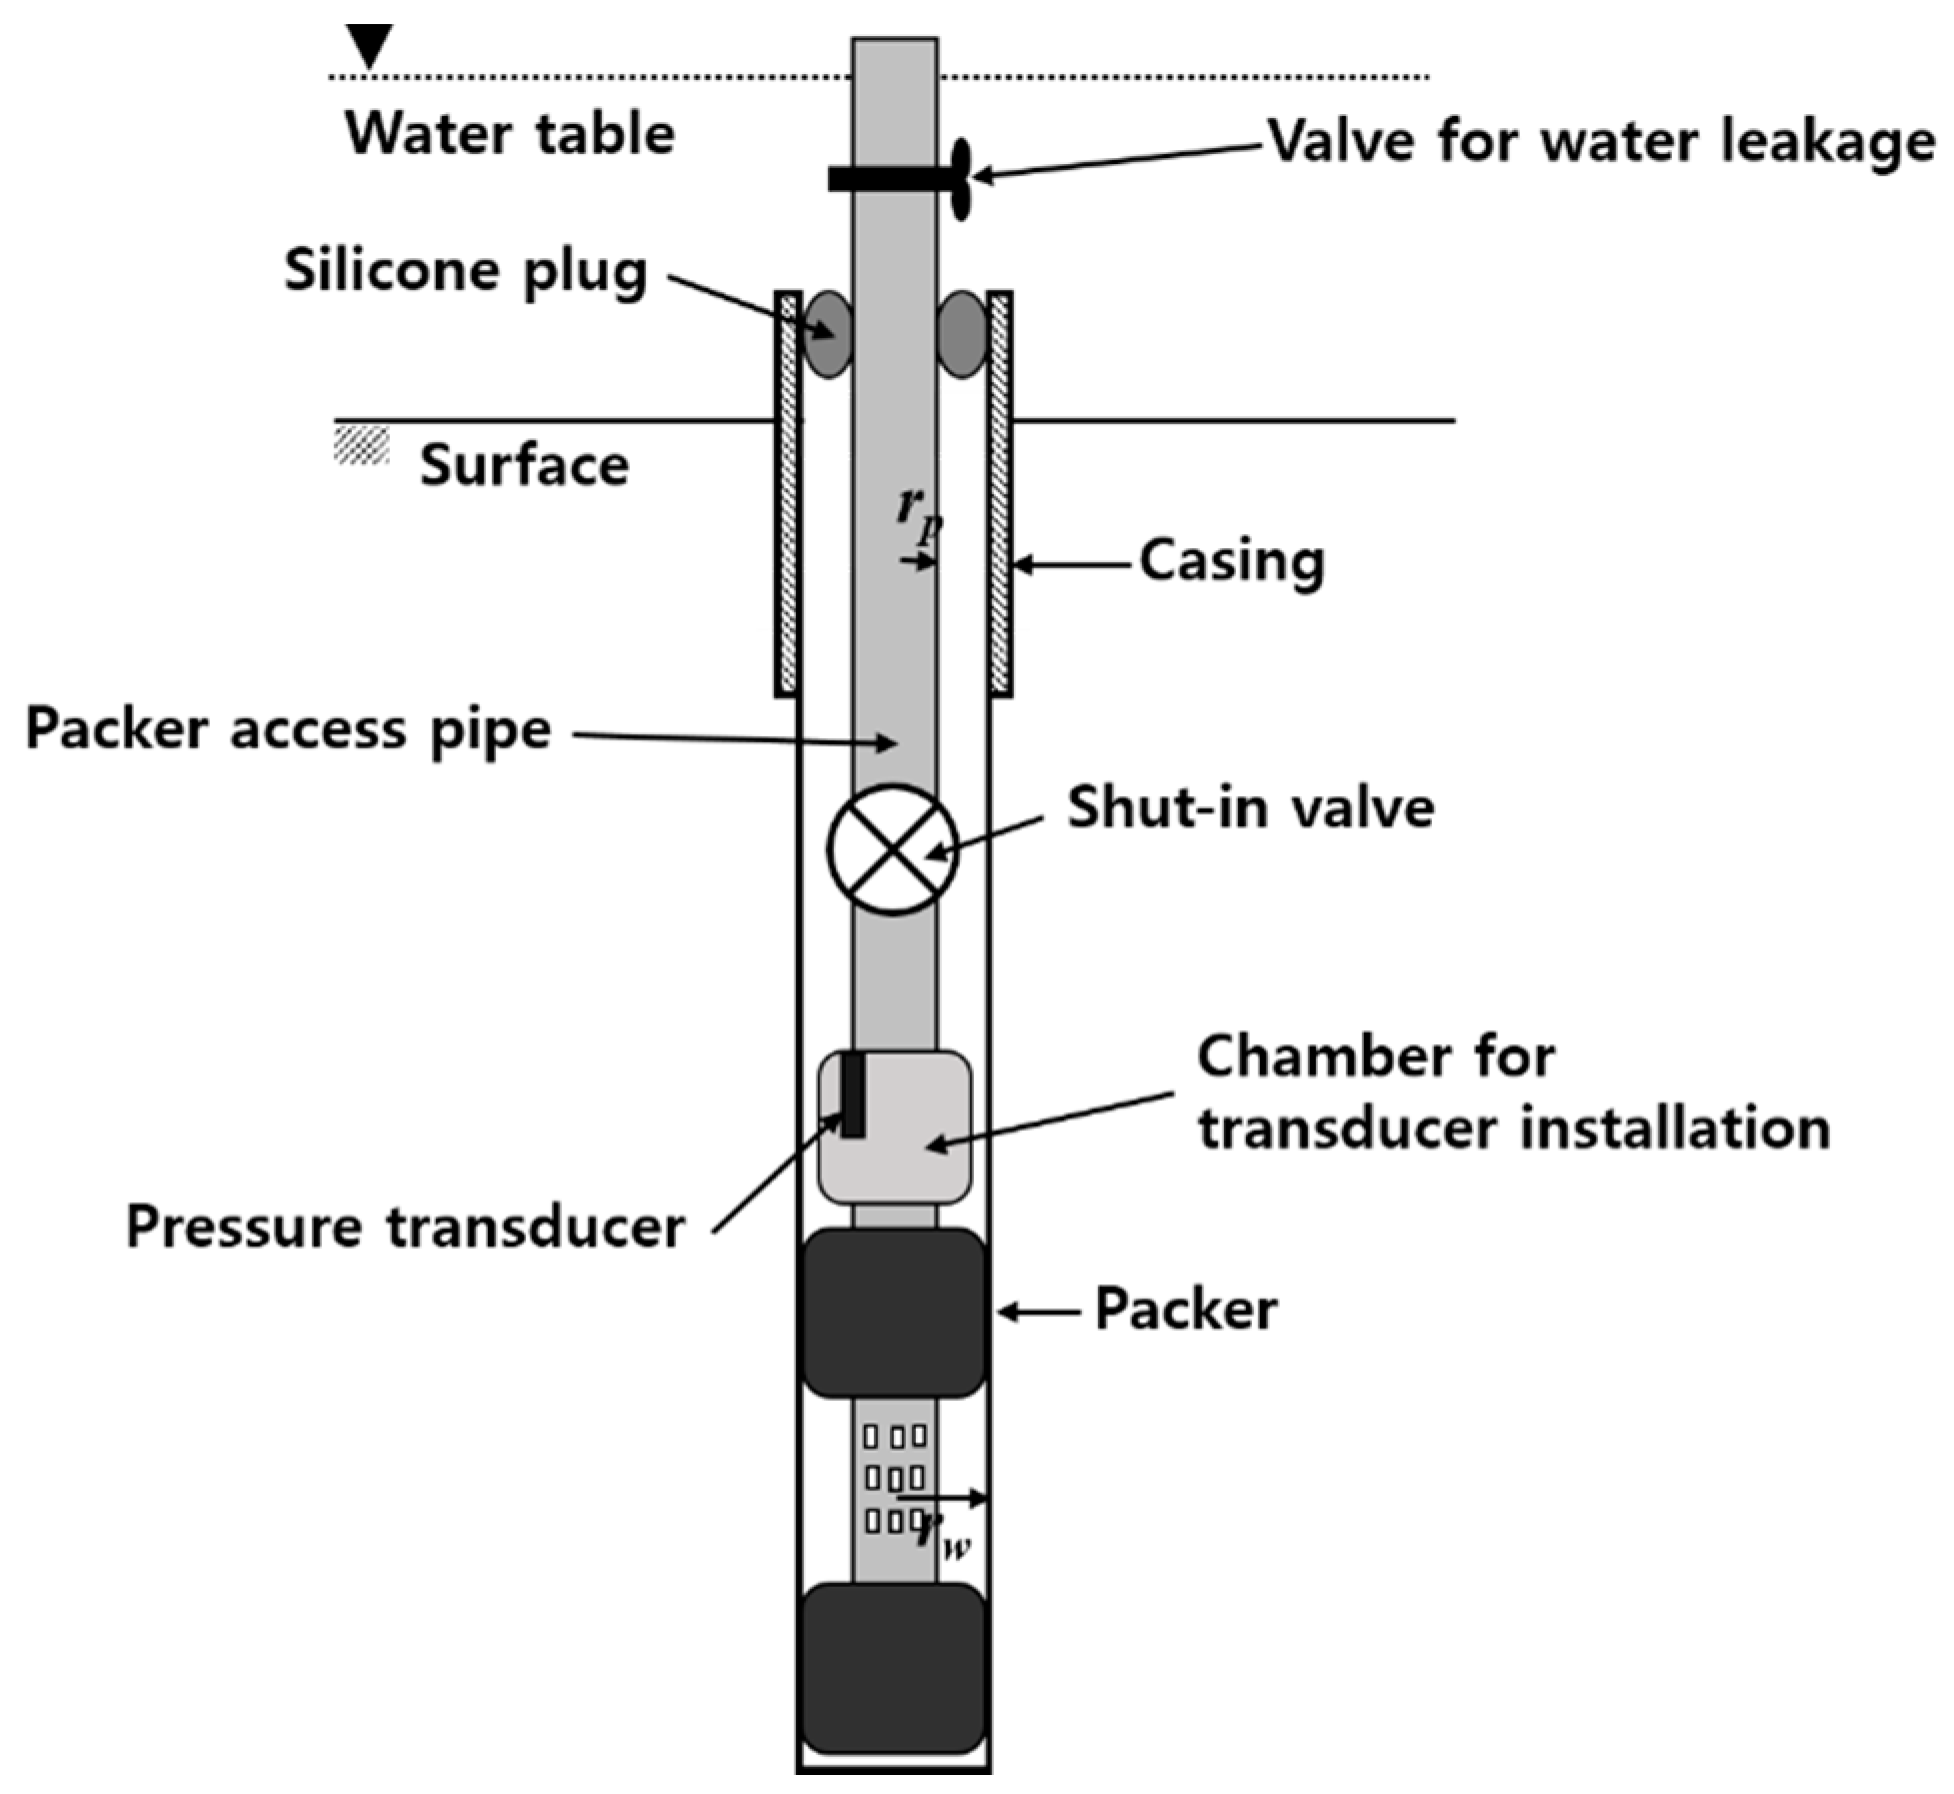
Because the water leakage valve for draining water is located on the ground as in
Figure 2, small
were applied to the constant head withdrawal tests. Thus, the maximum Re during the constant head withdrawal tests at all test zones except section 10 were smaller than the critical Re for slug tests, but it was difficult to discuss the effect of nonlinear flow on the constant head withdrawal tests in our test borehole because it was conducted only once at each test zone.
When the permeability of a test zone was low like sections 3 and 4 (
Figure 5b,c), the estimated
from pulse, slug, and constant head withdrawal tests were similar to each other. This may be because the radii of influence for pulse, slug, and constant head withdrawal tests were similar due to the low permeability. In other cases, the estimated
from constant head withdrawal tests generally tended to be the largest, those from slug tests were the next largest, and those from pulse tests were the smallest. This trend was evident in the test zones with high permeability such as sections 10 and 11 (
Figure 5i,j). For pulse, slug, and constant head withdrawal tests, the test durations were different as shown in
Figure 3. This difference in test duration may cause a difference in the radii of influence for pulse, slug, and constant head withdrawal tests, and thus the estimated
. These results were consistent with the reports that the hydraulic conductivity tends to increase with the involved rock volume, e.g., [
23,
24,
25].
4. Conclusions
Distortion of the estimated
by excessive injection or extraction of groundwater was discussed by evaluating the influence of nonlinear flow on hydraulic tests. Pulse, slug, and constant head withdrawal tests were conducted at an installed borehole in KURT, and the changes of representative Re at a hydraulically conductive fracture during the hydraulic tests were calculated. Then, the relations between the maximum Re during the tests and estimated
from the tests were matched to an equation introduced from the Forchheimer equation and cubic law, and the matching results were used to identify the effects of nonlinear flow on the tests and to evaluate the possibility of distortion of the estimated
. Our results showed that nonlinear flow was unlikely to occur during the pulse tests in our test zones and there was little possibility that the estimated
from pulse tests distorted from nonlinear flow. In slug tests, however, the relations between the maximum Re and estimated
indicated that estimation of hydraulic parameters for several test zones was likely to be distorted due to nonlinear flow during the tests, and the estimated
for those zones were corrected following Ji and Koh [
9]. Then, the estimated
from pulse, slug, and constant head withdrawal tests were compared with each other. The comparison results showed that the scale effect was generally invoked in estimation of
for our test zones and the estimated
increased as the test scale grew from pulse tests to constant head withdrawal tests. When the test zones had low permeability, however, the scale effect was reduced and the estimated
from the different types of hydraulic tests became similar.
The hydraulic properties obtained through site characterization are reflected in the safety assessment for a subsurface HLW repository, and the safety can be overestimated if the hydraulic conductivity of the disposal site is underestimated. Nonlinear flow from excessive injection or extraction can induce underestimation of the hydraulic conductivity. Our study indicated the way to evaluate the effects of nonlinear flow on a hydraulic test and distortion of the hydraulic conductivity estimated from the test. Considering the nonlinear flow and scale effect, our results showed that a pulse test is recommended for the zones with low permeability in our study site. In other cases, however, a constant head withdrawal test is proposed for the conservative safety assessment.


