A Practical Protocol for the Experimental Design of Comparative Studies on Water Treatment


Abstract

1. Introduction
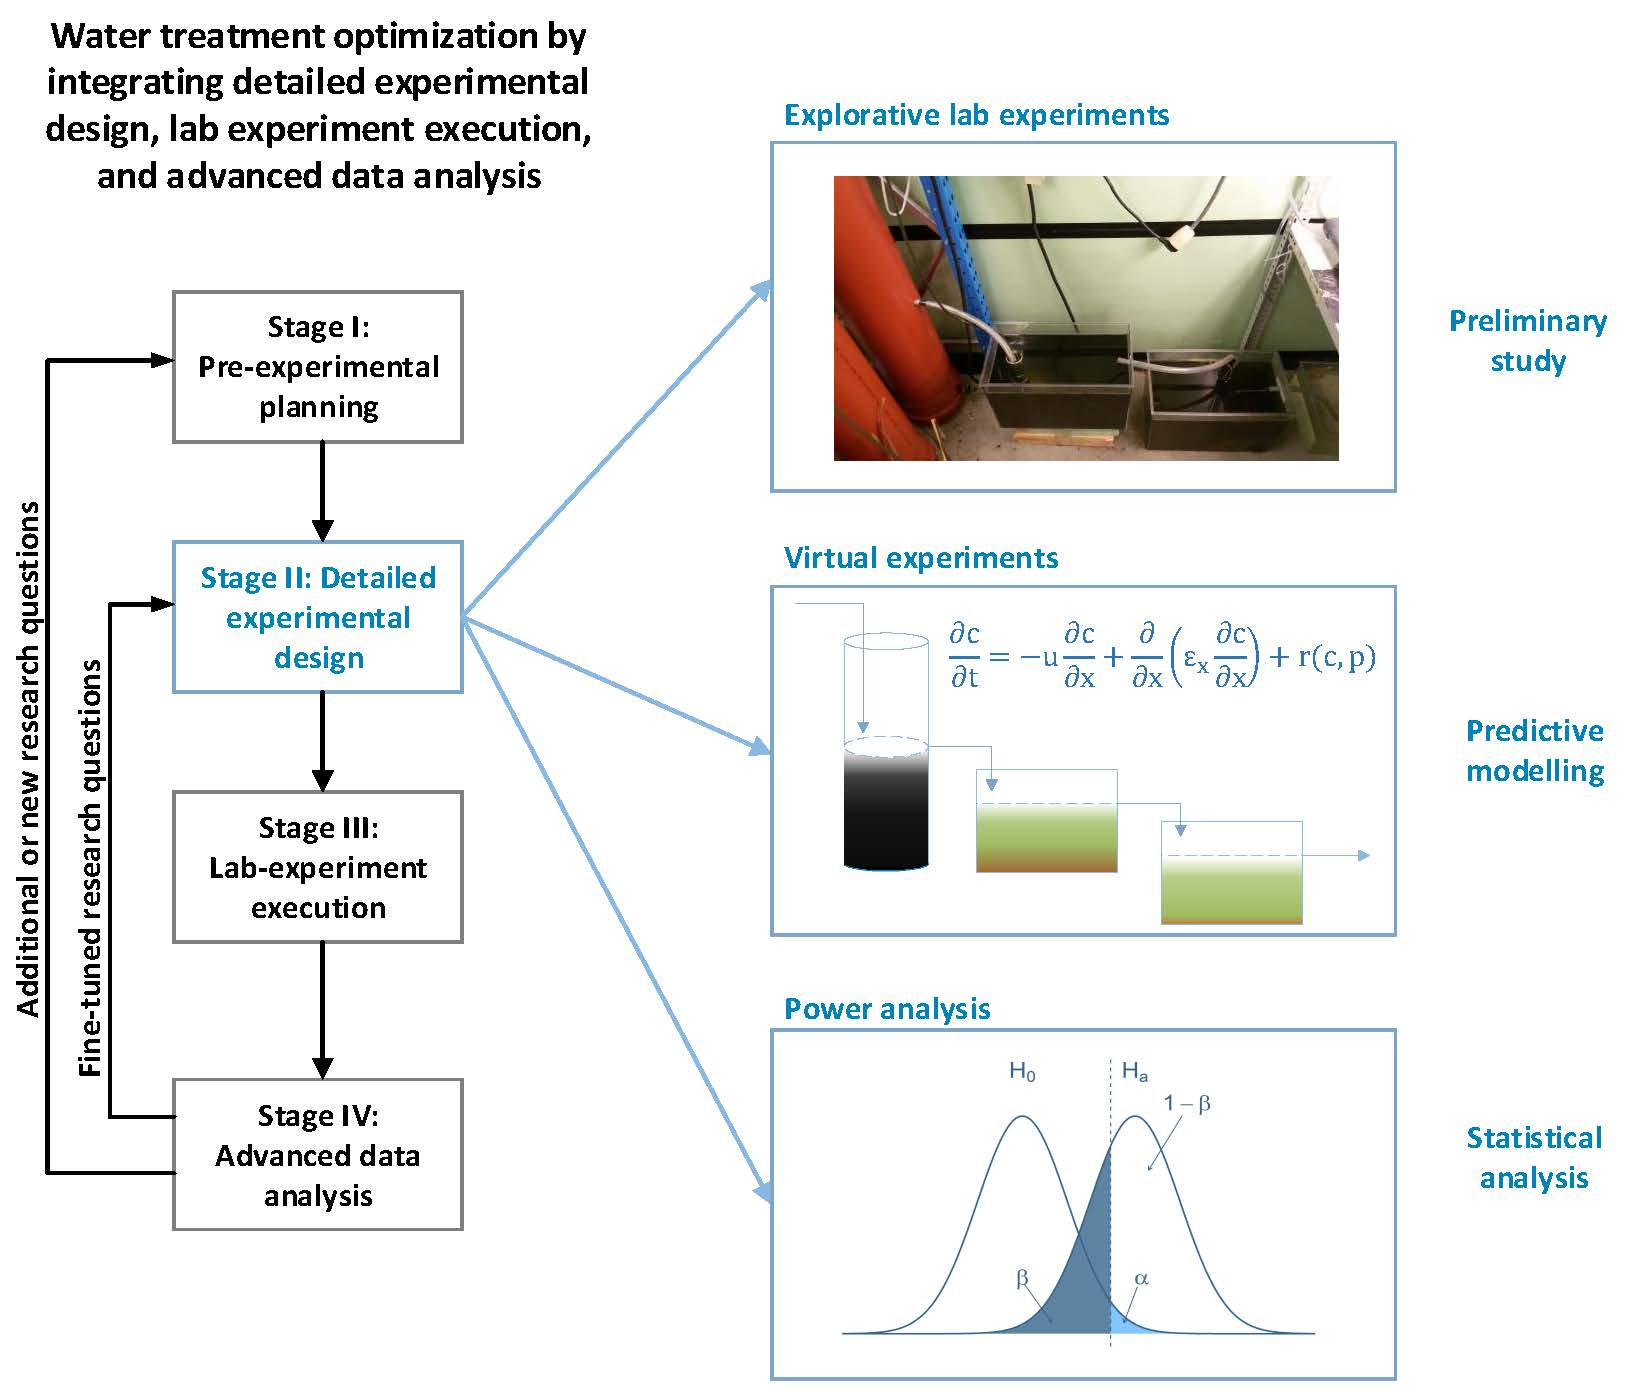
2. The Protocol
2.1. Stage I: Pre-Experimental Planning
2.1.1. Target Definition and a List of Variables of Interest
2.1.2. Preliminary Study
2.1.3. Selection of Design Factors
2.2. Stage II: Detailed Experimental Planning
2.2.1. Predictive Models
2.2.2. Hypothesis Testing
2.2.3. Power Analysis Tests
2.3. Stage III: Lab Experiment Execution
2.3.1. Sampling Plan
2.3.2. Experimental Implementation
2.4. Stage IV: Advanced Data Analysis
2.4.1. Results Analysis and Interpretation
2.4.2. Conclusions and Recommendations
2.5. The Loops
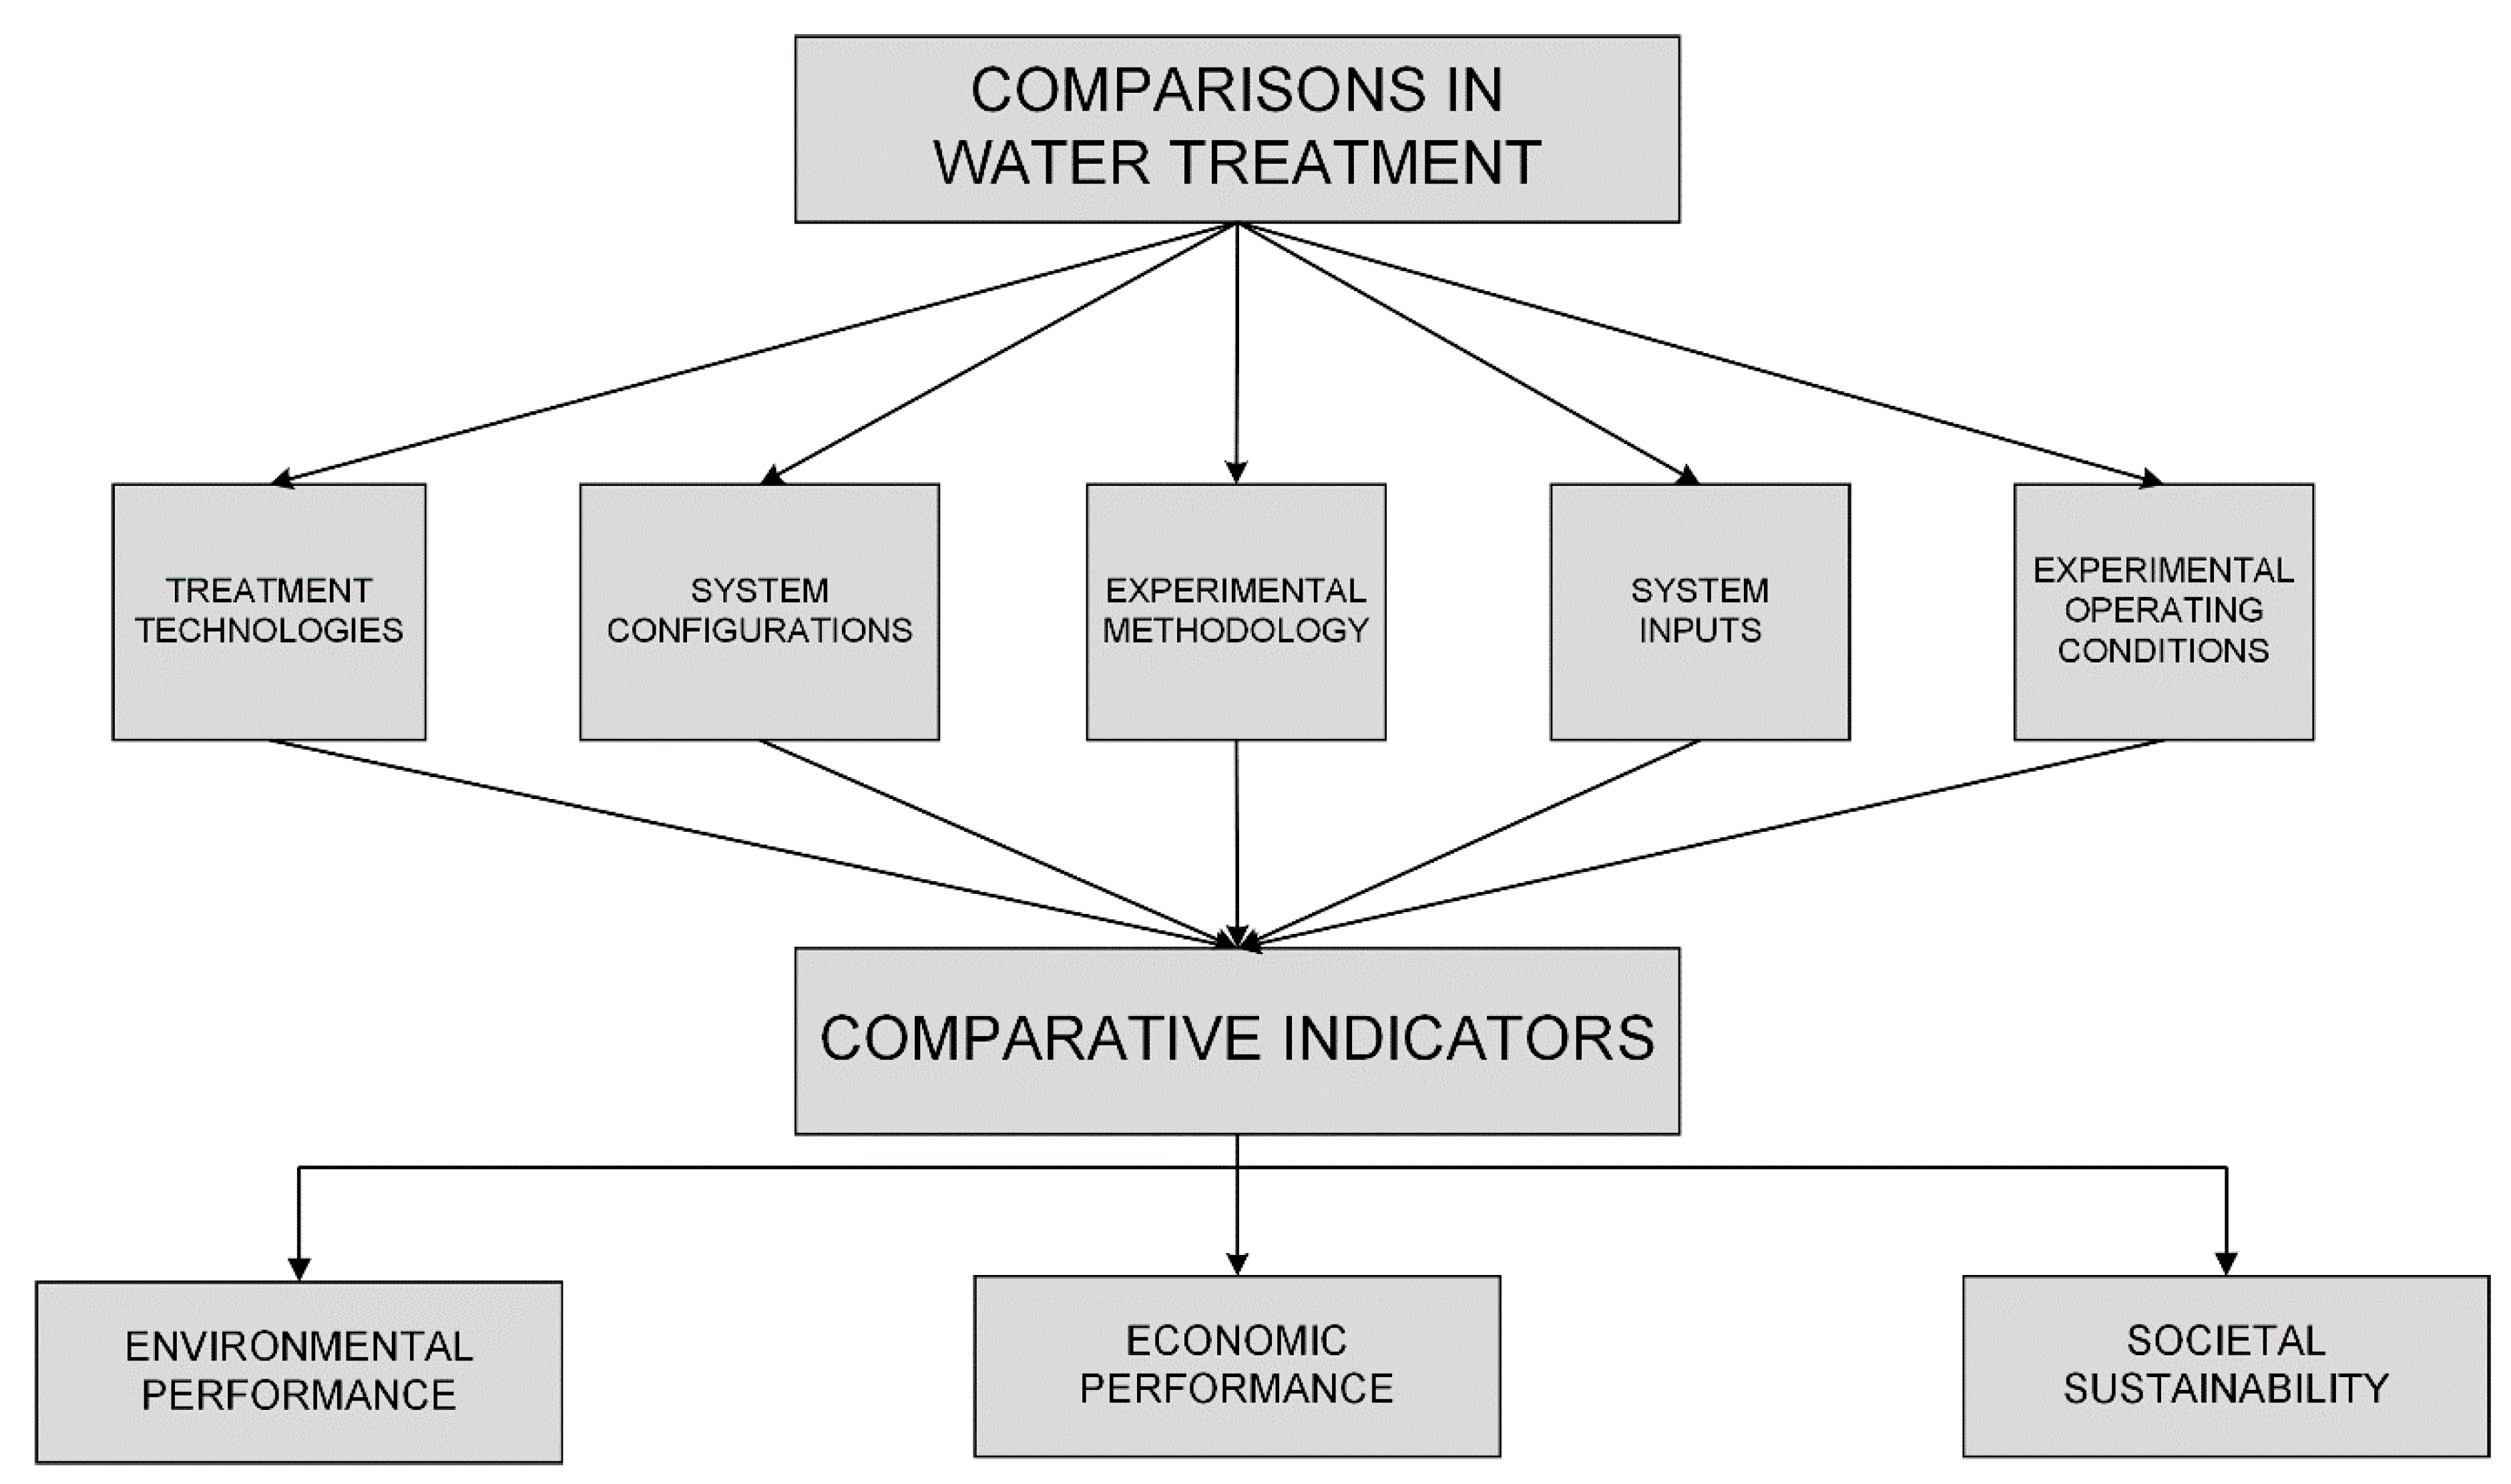
3. A Case Study: Performance Comparison of a Conventional Activated Sludge and a Waste Stabilization Pond in a Peak Load Scenario
3.1. Pre-Experiments
3.1.1. Step 1: Target Definition and a List of Variables of Interest
3.1.2. Step 2: Preliminary Study
3.1.3. Step 3: Selection of Design Factors
3.2. Experimental Planning
3.2.1. Step 4: Preliminary Models
3.2.2. Step 5: Hypothesis Testing
3.2.3. Step 6: Power Analysis Tests
3.3. Experimental Conducting
3.3.1. Step 7: Sampling Plan
3.3.2. Step 8: Experimental Implementation
3.4. Experimental Analysis
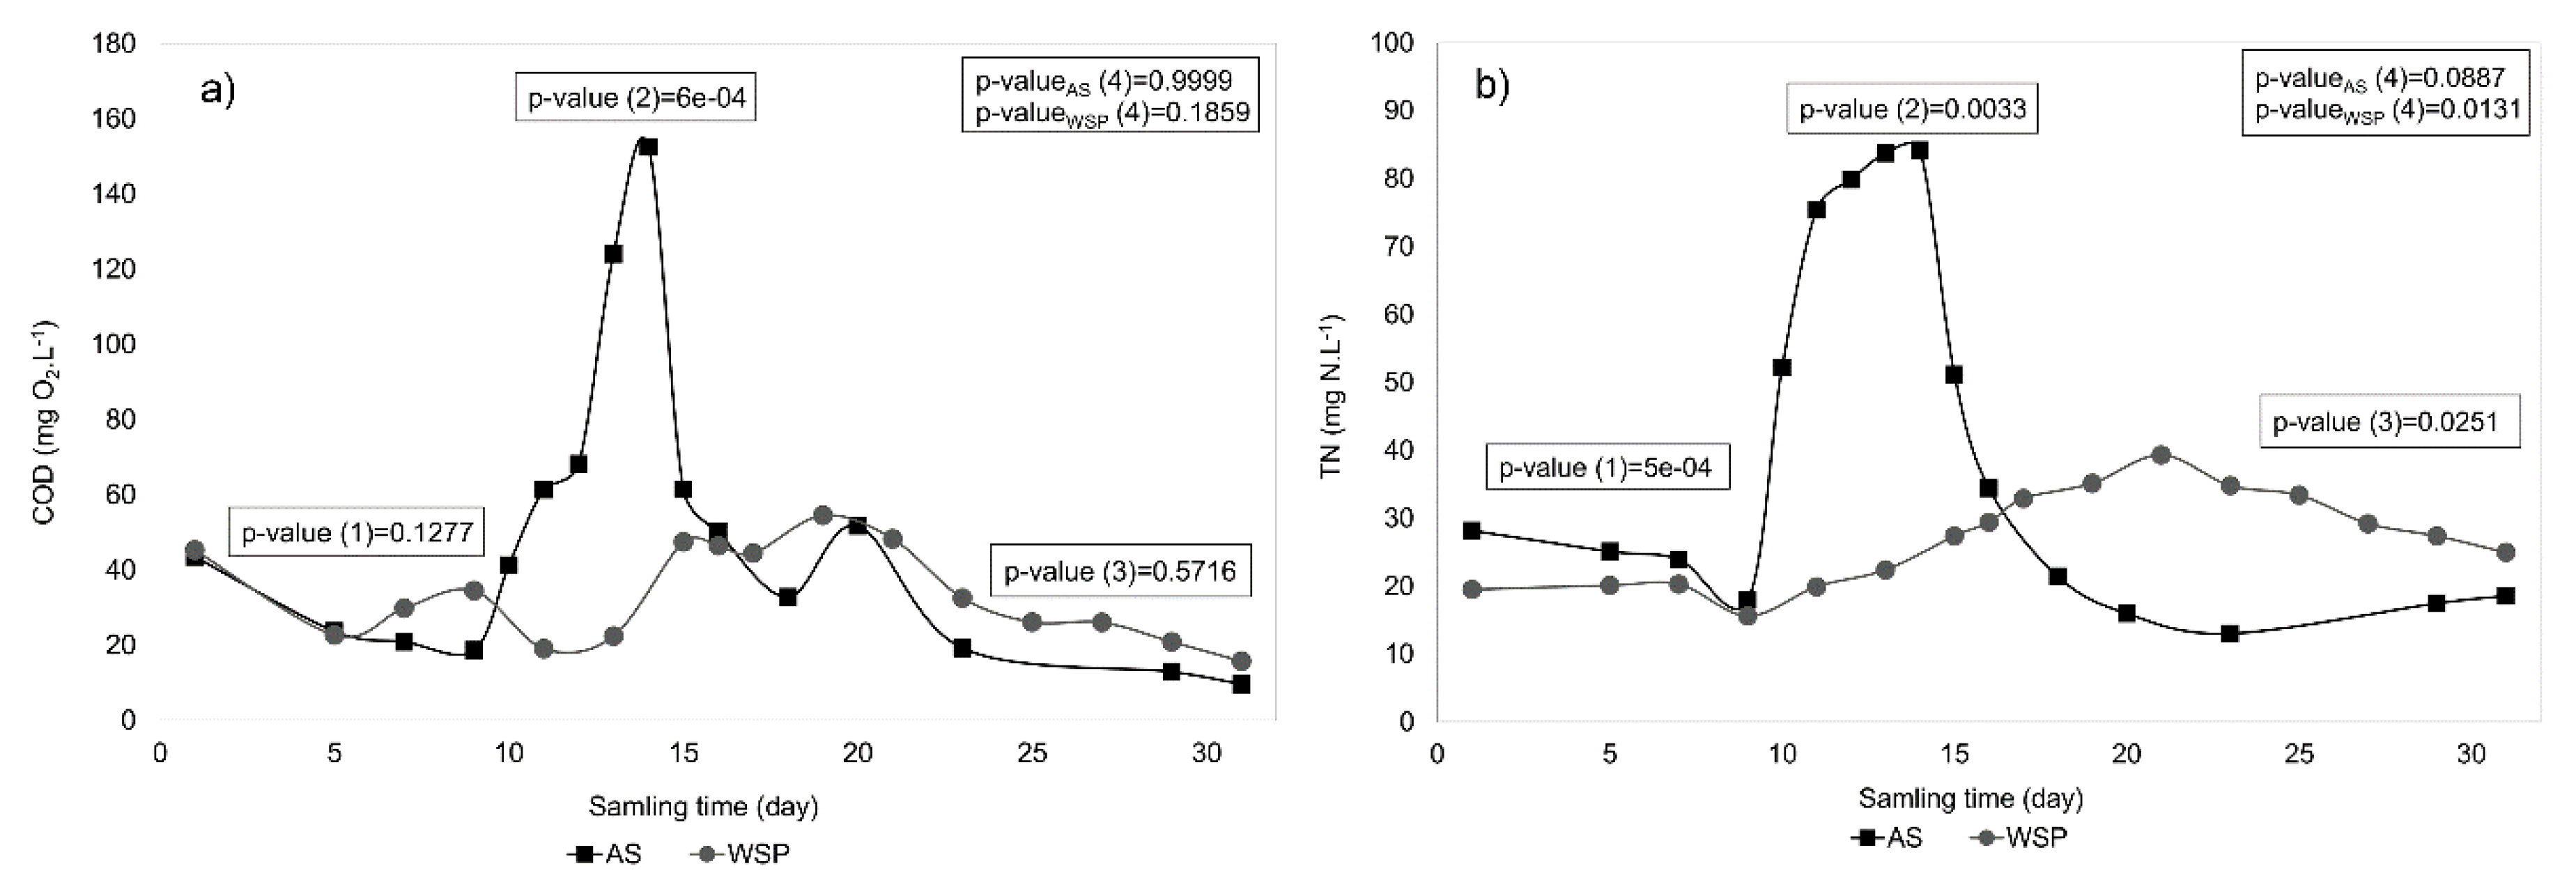
3.4.1. Step 9: Statistical Analysis and Results Interpretation
3.4.2. Step 10: Conclusions and Recommendations
- Two systems appeared with relatively high capacity for removing organic matter (>90%), while higher nitrogen removal was obtained in WSP systems compared to AS;
- Regarding resilient capacity, the WSP systems proved their ability of replacing CAS in dealing with the shock load, especially regarding nitrogen removal;
- First-order kinetic models showed higher accuracy for CAS systems compared to WSP systems. A more sophisticated model is suggested for further studies, such as system optimization and performance analysis.
- To investigate the tolerance threshold for shock load of both systems, scenarios with higher strength of wastewater can be implemented in future experiments;
- To assess the sustainability of the two systems, other indicators regarding economic performance and societal sustainability need to be concerned in subsequent studies.
4. Discussion
5. Conclusions
Supplementary Materials
Author Contributions
Funding
Acknowledgments
Conflicts of Interest
References
- Water, U. Tackling a Global Crisis: International Year of Sanitation 2008. Available online: http://www.wsscc.org/fileadmin/files/pdf/publication/IYS_2008_tackling_a_global_crisis.pdf (accessed on 23 April 2016).
- Muga, H.E.; Mihelcic, J.R. Sustainability of wastewater treatment technologies. J. Environ. Manag. 2008, 88, 437–447. [Google Scholar] [CrossRef] [PubMed]
- van Loosdrecht, M.C.; Nielsen, P.H.; Lopez-Vazquez, C.M.; Brdjanovic, D. Experimental Methods in Wastewater Treatment; IWA Publishing: London, UK, 2016. [Google Scholar]
- APHA (American Public Health Association). Standard Methods for the Examination of Water and Wastewater; American Public Health Association (APHA): Washington, DC, USA, 2005. [Google Scholar]
- Johnson, P.C.D.; Barry, S.J.E.; Ferguson, H.M.; Muller, P. Power analysis for generalized linear mixed models in ecology and evolution. Methods Ecol. Evol 2015, 6, 133–142. [Google Scholar] [CrossRef] [PubMed]
- Doran, G.T. There’s a S.M.A.R.T. Way to write management’s goals and objectives. Manag. Rev. 1981, 70, 35–36. [Google Scholar]
- Quinn, G.P.; Keough, M.J. Experimental Design and Data Analysis for Biologists; Cambridge University Press: Cambridge, UK, 2002. [Google Scholar]
- Montgomery, D.C. Design and Analysis of Experiments; Wiley: Hoboken, NJ, USA, 2013. [Google Scholar]
- Goos, P.; Jones, B. Optimal Design of Experiments: A Case Study Approach; Wiley: Hoboken, NJ, USA, 2011. [Google Scholar]
- Casler, M.D. Fundamentals of experimental design: Guidelines for designing successful experiments. Agron. J. 2015, 107, 692–705. [Google Scholar] [CrossRef]
- Claeys, F.; Chtepen, M.; Benedetti, L.; Dhoedt, B.; Vanrolleghem, P.A. Distributed virtual experiments in water quality management. Water Sci. Technol. 2006, 53, 297–305. [Google Scholar] [CrossRef] [PubMed]
- Refsgaard, J.C.; van der Sluijs, J.P.; Hojberg, A.L.; Vanrolleghem, P.A. Uncertainty in the environmental modelling process—A framework and guidance. Environ. Model. Softw. 2007, 22, 1543–1556. [Google Scholar] [CrossRef]
- Ho, L.T.; Van Echelpoel, W.; Goethals, P.L.M. Design of waste stabilization pond systems: A review. Water Res. 2017, 123, 236–248. [Google Scholar] [CrossRef]
- Popper, K. The Logic of Scientific Discovery; Routledge: Abingdon, UK, 2005. [Google Scholar]
- Keitt, T.H.; Bjornstad, O.N.; Dixon, P.M.; Citron-Pousty, S. Accounting for spatial pattern when modeling organism-environment interactions. Ecography 2002, 25, 616–625. [Google Scholar] [CrossRef]
- Zuur, A.F.; Leno, E.N.; Walker, N.J.; Saveliev, A.A.; Smith, G.M. Mixed Effects Models and Extensions in Ecology with R; Springer: New York, NY, USA, 2009. [Google Scholar]
- Dormann, C.F.; McPherson, J.M.; Araujo, M.B.; Bivand, R.; Bolliger, J.; Carl, G.; Davies, R.G.; Hirzel, A.; Jetz, W.; Kissling, W.D.; et al. Methods to account for spatial autocorrelation in the analysis of species distributional data: A review. Ecography 2007, 30, 609–628. [Google Scholar] [CrossRef]
- Cohen, J. Statistical Power Analysis for the Behavioral Sciences, 2nd ed.; Academic Press: Cambridge, MA, USA, 1988. [Google Scholar]
- Krzywinski, M.; Altman, N. Points of significance: Power and sample size. Nat. Meth. 2013, 10, 1139–1140. [Google Scholar] [CrossRef]
- Vanrolleghem, P.A.; Schilling, W.; Rauch, W.; Krebs, P.; Aalderink, H. Setting up measuring campaigns for integrated wastewater modelling. Water Sci. Technol. 1999, 39, 257–268. [Google Scholar] [CrossRef]
- Festing, M.F.W.; Altman, D.G. Guidelines for the design and statistical analysis of experiments using laboratory animals. ILAR J. 2002, 43, 244–258. [Google Scholar] [CrossRef] [PubMed]
- Cleveland, W.S. Visualizing Data; At&T Bell Laboratories: Murray Hill, NJ, USA, 1993. [Google Scholar]
- Dochain, D.; Gregoire, S.; Pauss, A.; Schaegger, M. Dynamical modelling of a waste stabilisation pond. Bioprocess Biosyst. Eng. 2003, 26, 19–26. [Google Scholar] [CrossRef]
- Verstraete, W.; Vlaeminck, S.E. Zerowastewater: Short-cycling of wastewater resources for sustainable cities of the future. Int. J. Sustain. Dev. World 2011, 18, 253–264. [Google Scholar] [CrossRef]
- Mara, D.D. Waste stabilization ponds: Past, present and future. Desalin. Water Treat. 2009, 4, 85–88. [Google Scholar] [CrossRef]
- Ho, L.; Van Echelpoel, W.; Charalambous, P.; Gordillo, A.; Thas, O.; Goethals, P. Statistically-based comparison of the removal efficiencies and resilience capacities between conventional and natural wastewater treatment systems: A peak load scenario. Water 2018, 10, 328. [Google Scholar] [CrossRef]
- Reichert, P. Aquasim—A tool for simulation and data analysis of aquatic systems. Water Sci. Technol. 1994, 30, 21–30. [Google Scholar] [CrossRef]
- Morrell, C.H. Likelihood ratio testing of variance components in the linear mixed-effects model using restricted maximum likelihood. Biometrics 1998, 54, 1560–1568. [Google Scholar] [CrossRef] [PubMed]
- R Core Team. R: A Language and Environment for Statistical Computing; R Core Team: Vienna, Austria, 2014; ISBN 3-900051-07-0. [Google Scholar]
- Pinheiro, J.; Bates, D.; DebRoy, S.; Sarkar, D. R Development Core Team (2012) Nlme: Linear and Nonlinear Mixed Effects Models; R Package Version 3.1-103; R Foundation for Statistical Computing: Vienna, Austria, 2013. [Google Scholar]
- Mitchell, C.; McNevin, D. Alternative analysis of bod removal in subsurface flow constructed wetlands employing monod kinetics. Water Res. 2001, 35, 1295–1303. [Google Scholar] [CrossRef]
- Vanrolleghem, P.A.; Gernaey, K.; Petersen, B.; De Clercq, B.; Coen, F.; Ottoy, J.P. Limitations of short-term experiments designed for identification of activated sludge biodegradation models by fast dynamic phenomena. Comput. Appl. Biotechnol. 1998, 31, 535–540. [Google Scholar] [CrossRef]
- Van der Star, W.R.; Abma, W.R.; Blommers, D.; Mulder, J.W.; Tokutomi, T.; Strous, M.; Picioreanu, C.; Van Loosdrecht, M.C. Startup of reactors for anoxic ammonium oxidation: Experiences from the first full-scale anammox reactor in rotterdam. Water Res. 2007, 41, 4149–4163. [Google Scholar] [CrossRef] [PubMed]
- Nakajima, J.; Sakka, M.; Kimura, T.; Furukawa, K.; Sakka, K. Enrichment of anammox bacteria from marine environment for the construction of a bioremediation reactor. Appl. Microbiol. Biotechnol. 2008, 77, 1159–1166. [Google Scholar] [CrossRef] [PubMed]
- Ho, L.; Pompeu, C.; Van Echelpoel, W.; Thas, O.; Goethals, P. Model-based analysis of increased loads on the performance of activated sludge and waste stabilization ponds. Water 2018, 10, 1410. [Google Scholar] [CrossRef]
- Ho, L.T.; Alvarado, A.; Larriva, J.; Pompeu, C.; Goethals, P. An integrated mechanistic modeling of a facultative pond: Parameter estimation and uncertainty analysis. Water Res. 2019, 151, 170–182. [Google Scholar] [CrossRef] [PubMed]
- Reichert, P.; Vanrolleghem, P. Identifiability and uncertainty analysis of the river water quality model no. 1 (rwqm1). Water Sci. Technol. 2001, 43, 329–338. [Google Scholar] [CrossRef]
- Spriet, J. Structure characterization-an overview. IFAC Proc. Volumes 1985, 18, 749–756. [Google Scholar] [CrossRef]
- Reichert, P.; Omlin, M. On the usefulness of overparameterized ecological models. Ecol. Model. 1997, 95, 289–299. [Google Scholar] [CrossRef]
- Henze, M.; van Loosdrecht, M.; Ekama, G.A.; Brdjanovic, D. Biological Wastewater Treatment: Priniciples, Modelling and Design; IWA Publishing: London, UK, 2008. [Google Scholar]
- Refsgaard, J.C.; Henriksen, H.J.; Harrar, W.G.; Scholten, H.; Kassahun, A. Quality assurance in model based water management—Review of existing practice and outline of new approaches. Environ. Model. Softw. 2005, 20, 1201–1215. [Google Scholar] [CrossRef]
- Jakeman, A.J.; Letcher, R.A.; Norton, J.P. Ten iterative steps in development and evaluation of environmental models. Environ. Model. Softw. 2006, 21, 602–614. [Google Scholar] [CrossRef]
- Aumann, C.A. A methodology for developing simulation models of complex systems. Ecol. Model. 2007, 202, 385–396. [Google Scholar] [CrossRef]
- Todo, K.; Sato, K. Directive 2000/60/ec of the european parliament and of the council of 23 october 2000 establishing a framework for community action in the field of water policy. Environ. Res. Q. 2002, 66–106. [Google Scholar]
- Walker, W.E.; Harremoës, P.; Rotmans, J.; van der Sluijs, J.P.; van Asselt, M.B.; Janssen, P.; Krayer von Krauss, M.P. Defining uncertainty: A conceptual basis for uncertainty management in model-based decision support. Integr. Assess. 2003, 4, 5–17. [Google Scholar] [CrossRef]
- Reichert, P. A standard interface between simulation programs and systems analysis software. Water Sci. Technol. 2006, 53, 267–275. [Google Scholar] [CrossRef]
- Matott, L.S.; Babendreier, J.E.; Purucker, S.T. Evaluating uncertainty in integrated environmental models: A review of concepts and tools. Water Resour. Res. 2009, 45. [Google Scholar] [CrossRef]
- Liptak, B.G. Analytical Instrumentation; Taylor & Francis: Abingdon, UK, 1994. [Google Scholar]
- Jennions, M.D.; Moller, A.P. A survey of the statistical power of research in behavioral ecology and animal behavior. Behav. Ecol. 2003, 14, 438–445. [Google Scholar] [CrossRef]
- Ioannidis, J.P.A. Why most published research findings are false. PLoS Med. 2005, 2, 696–701. [Google Scholar] [CrossRef]
- Murphy, K.R.; Myors, B.; Murphy, K.; Wolach, A. Statistical Power Analysis: A Simple and General Model for Traditional and Modern Hypothesis Tests; Taylor & Francis: Abingdon, UK, 2003. [Google Scholar]
- Faul, F.; Erdfelder, E.; Lang, A.G.; Buchner, A. G*power 3: A flexible statistical power analysis program for the social, behavioral, and biomedical sciences. Behav. Res. Methods 2007, 39, 175–191. [Google Scholar] [CrossRef]
- Muthen, L.K.; Muthen, B.O. How to use a monte carlo study to decide on sample size and determine power. Struct. Equ. Model. 2002, 9, 599–620. [Google Scholar] [CrossRef]
- Martin, J.G.A.; Nussey, D.H.; Wilson, A.J.; Reale, D. Measuring individual differences in reaction norms in field and experimental studies: A power analysis of random regression models. Methods Ecol. Evol. 2011, 2, 362–374. [Google Scholar] [CrossRef]
- Reich, N.G.; Myers, J.A.; Obeng, D.; Milstone, A.M.; Perl, T.M. Empirical power and sample size calculations for cluster-randomized and cluster-randomized crossover studies. PLoS ONE 2012, 7, e35564. [Google Scholar] [CrossRef]
- Donohue, M.; Edland, S. Longpower: Power and Sample Size Calculators for Longitudinal Data; R Package Version 1.0-11; R Core Team: Vienna, Austria, 2013. [Google Scholar]
- Green, P.; MacLeod, C.J. Simr: An R package for power analysis of generalized linear mixed models by simulation. Methods Ecol. Evol. 2016, 7, 493–498. [Google Scholar] [CrossRef]
- Bas, D.; Boyaci, I.H. Modeling and optimization i: Usability of response surface methodology. J. Food Eng. 2007, 78, 836–845. [Google Scholar] [CrossRef]
- Myers, R.H.; Montgomery, D.C.; Vining, G.G.; Borror, C.M.; Kowalski, S.M. Response surface methodology: A retrospective and literature survey. J. Qual. Technol. 2004, 36, 53–77. [Google Scholar] [CrossRef]
- Box, G.E.P.; Draper, N.R. Response Surfaces, Mixtures, and Ridge Analyses; Wiley: Hoboken, NJ, USA, 2007. [Google Scholar]
- Jones, B.; Nachtsheim, C.J. Split-plot designs: What, why, and how. J. Qual. Technol. 2009, 41, 340–361. [Google Scholar] [CrossRef]


| Null Hypotheses | Performance Comparison |
|---|---|
| H0-1: The mean pollutant levels in the effluent of the two systems are equal during the beginning period. | Removal efficiency |
| H0-2: The mean pollutant levels in the effluent of the two systems are equal during the shock load. | Resilience capacity |
| H0-3: The mean pollutant levels in the effluent of the two systems are equal during the recovering phase. | Removal efficiency |
| H0-4: The mean pollutant levels in the effluent are equal before and after the peak load. | Recoverability |
© 2019 by the authors. Licensee MDPI, Basel, Switzerland. This article is an open access article distributed under the terms and conditions of the Creative Commons Attribution (CC BY) license (http://creativecommons.org/licenses/by/4.0/).
Share and Cite
Ho, L.; Thas, O.; Van Echelpoel, W.; Goethals, P. A Practical Protocol for the Experimental Design of Comparative Studies on Water Treatment. Water 2019, 11, 162. https://doi.org/10.3390/w11010162
Ho L, Thas O, Van Echelpoel W, Goethals P. A Practical Protocol for the Experimental Design of Comparative Studies on Water Treatment. Water. 2019; 11(1):162. https://doi.org/10.3390/w11010162
Chicago/Turabian StyleHo, Long, Olivier Thas, Wout Van Echelpoel, and Peter Goethals. 2019. "A Practical Protocol for the Experimental Design of Comparative Studies on Water Treatment" Water 11, no. 1: 162. https://doi.org/10.3390/w11010162
APA StyleHo, L., Thas, O., Van Echelpoel, W., & Goethals, P. (2019). A Practical Protocol for the Experimental Design of Comparative Studies on Water Treatment. Water, 11(1), 162. https://doi.org/10.3390/w11010162