Hydrology of the Sirba River: Updating and Analysis of Discharge Time Series


Abstract
1. Introduction
2. Materials and Methods
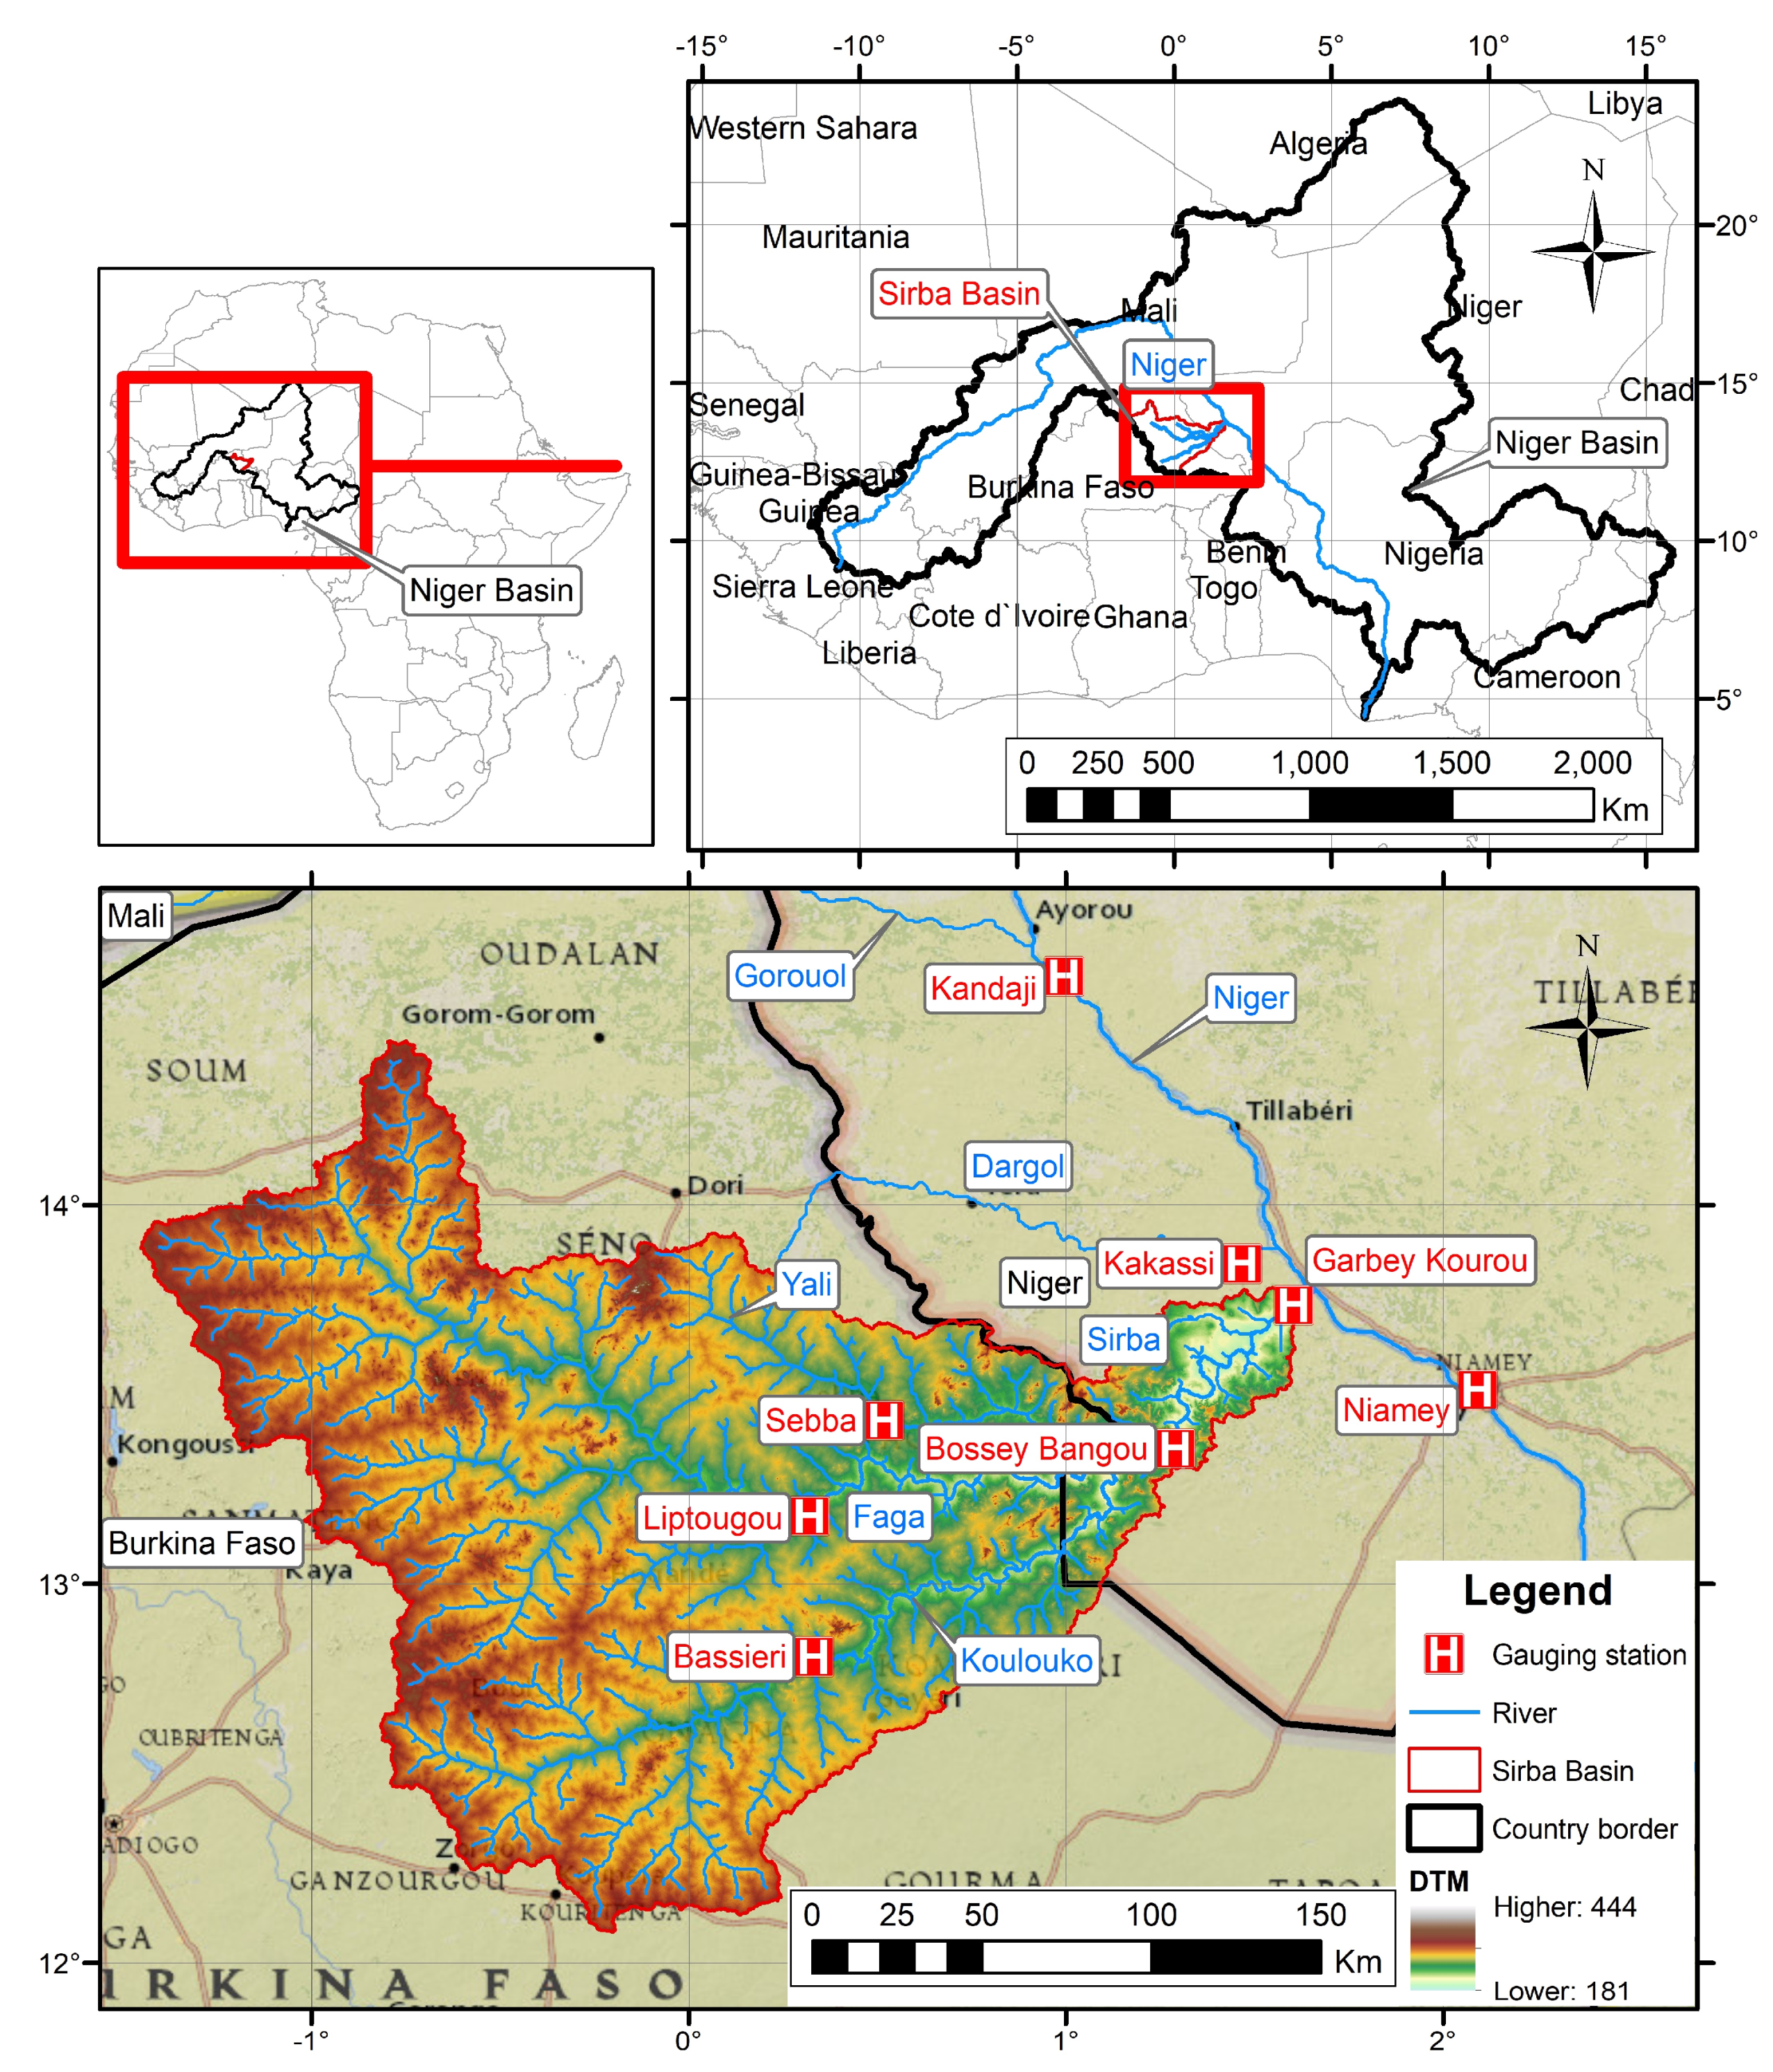
2.1. Study Area
2.2. Dataset
2.3. Methods
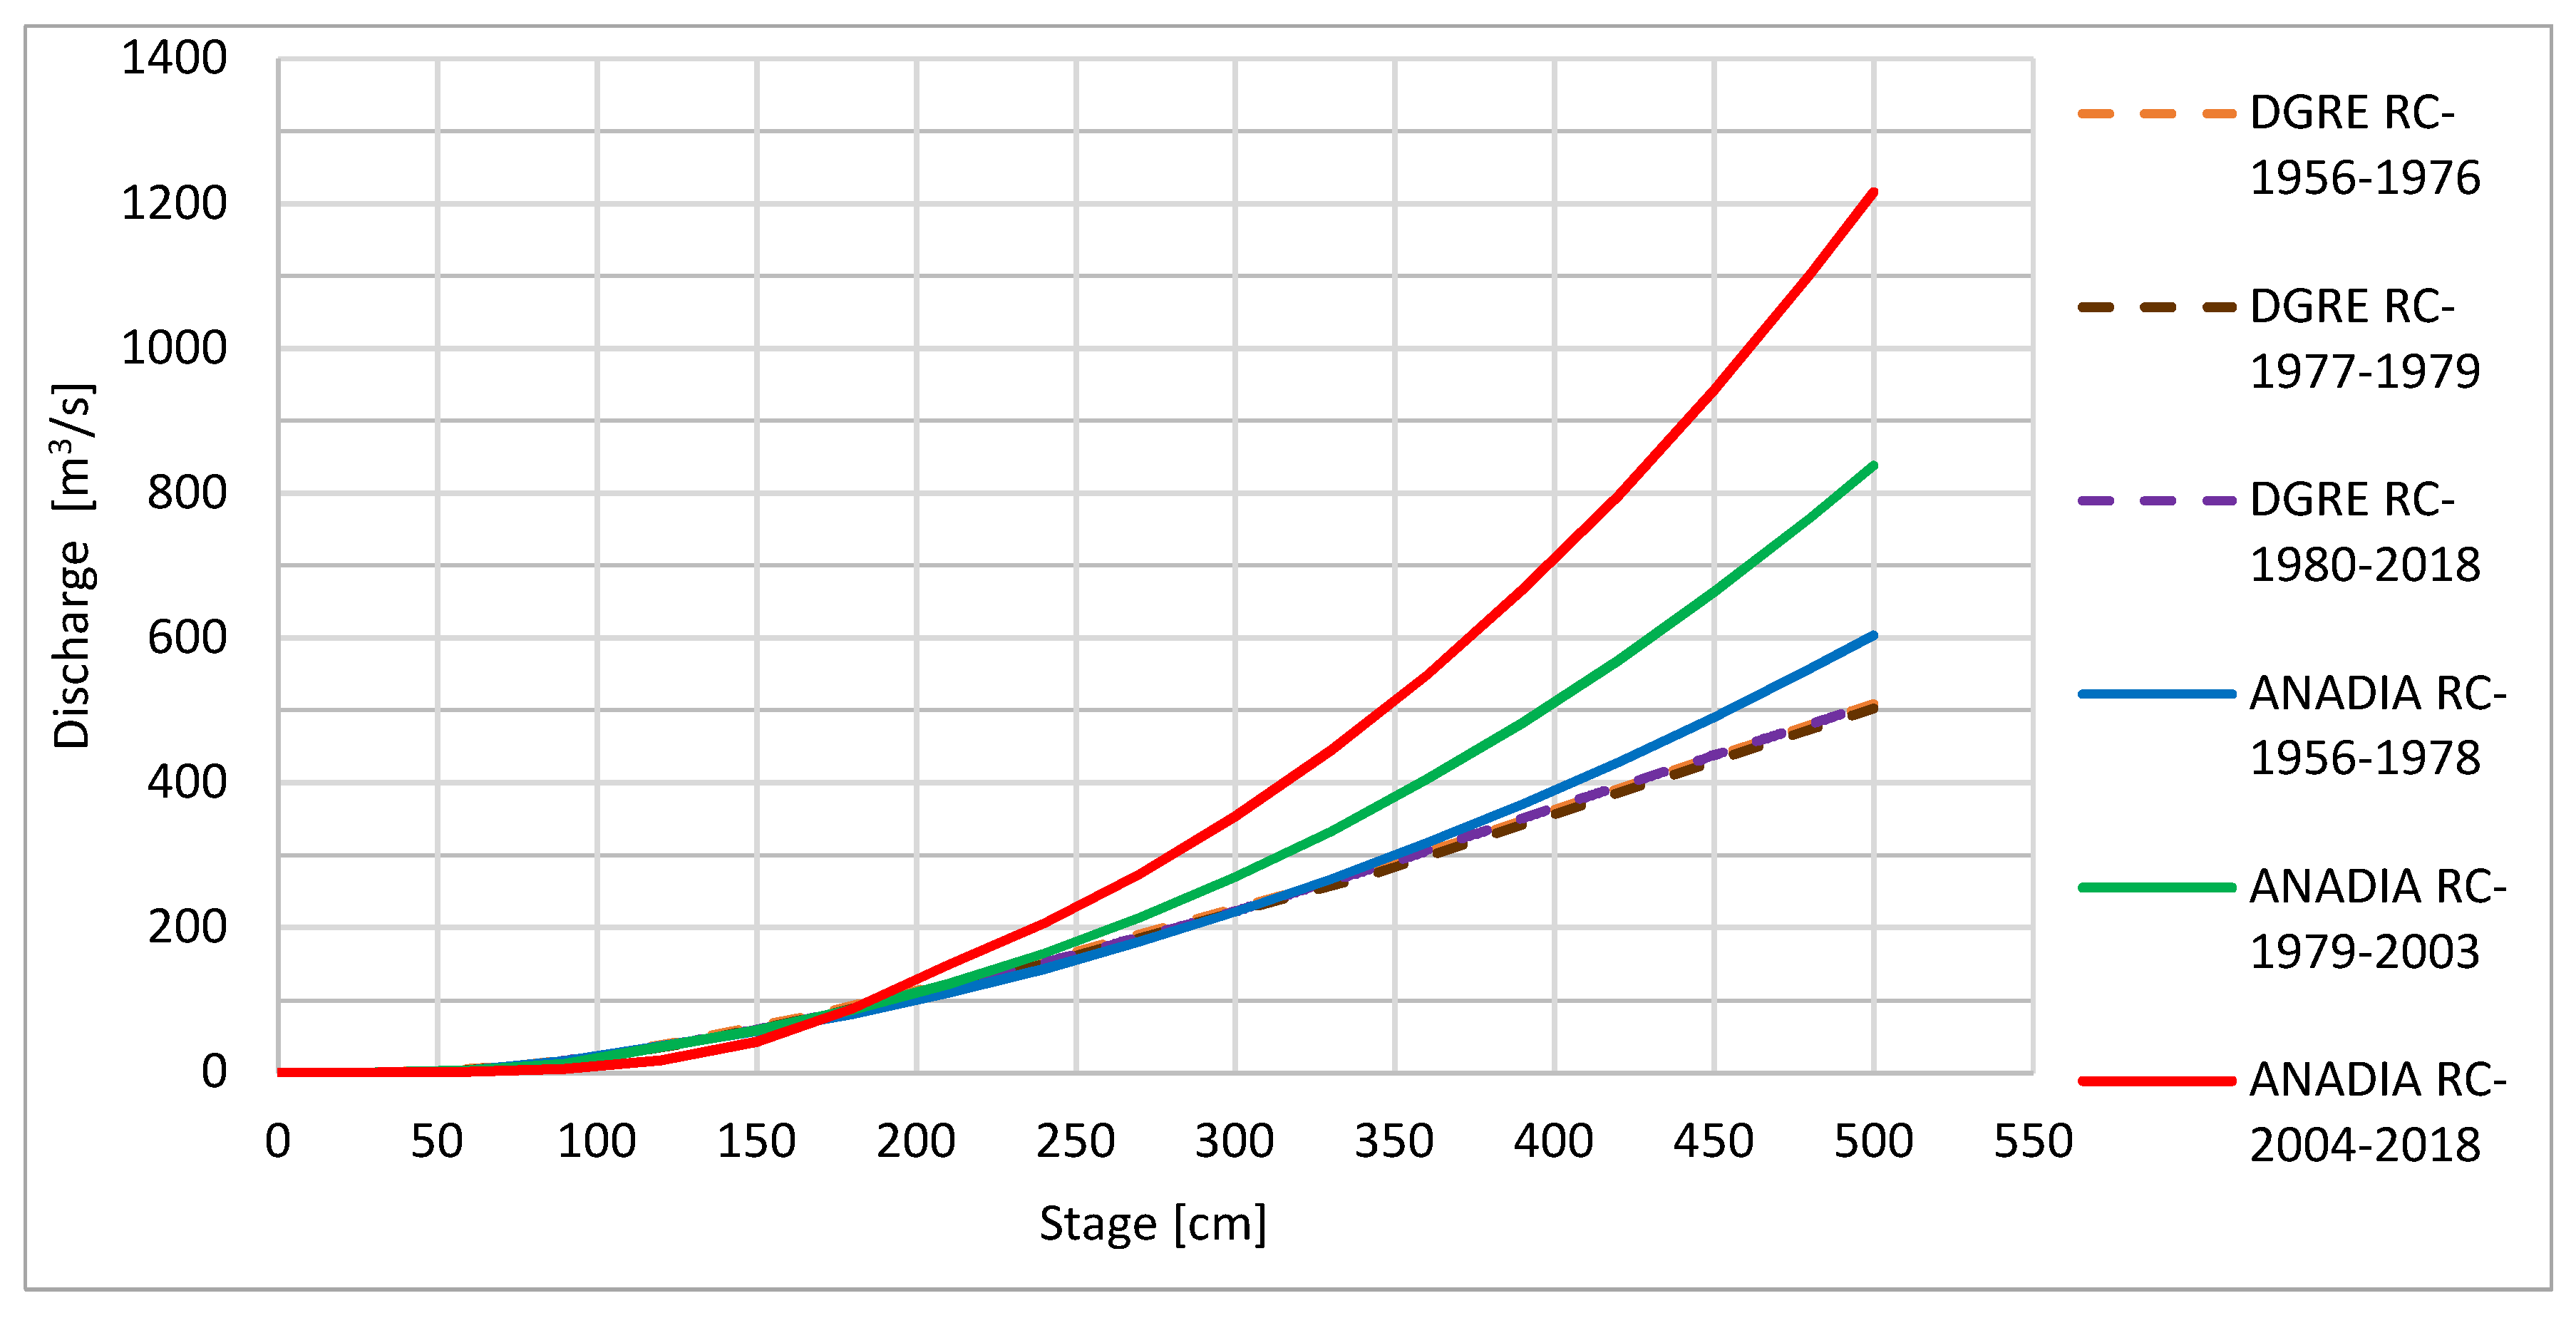
2.3.1. Power-Law Stage/Discharge Rating Curve
2.3.2. Flow-Duration Curves
2.3.3. Statistics
3. Results and Discussion
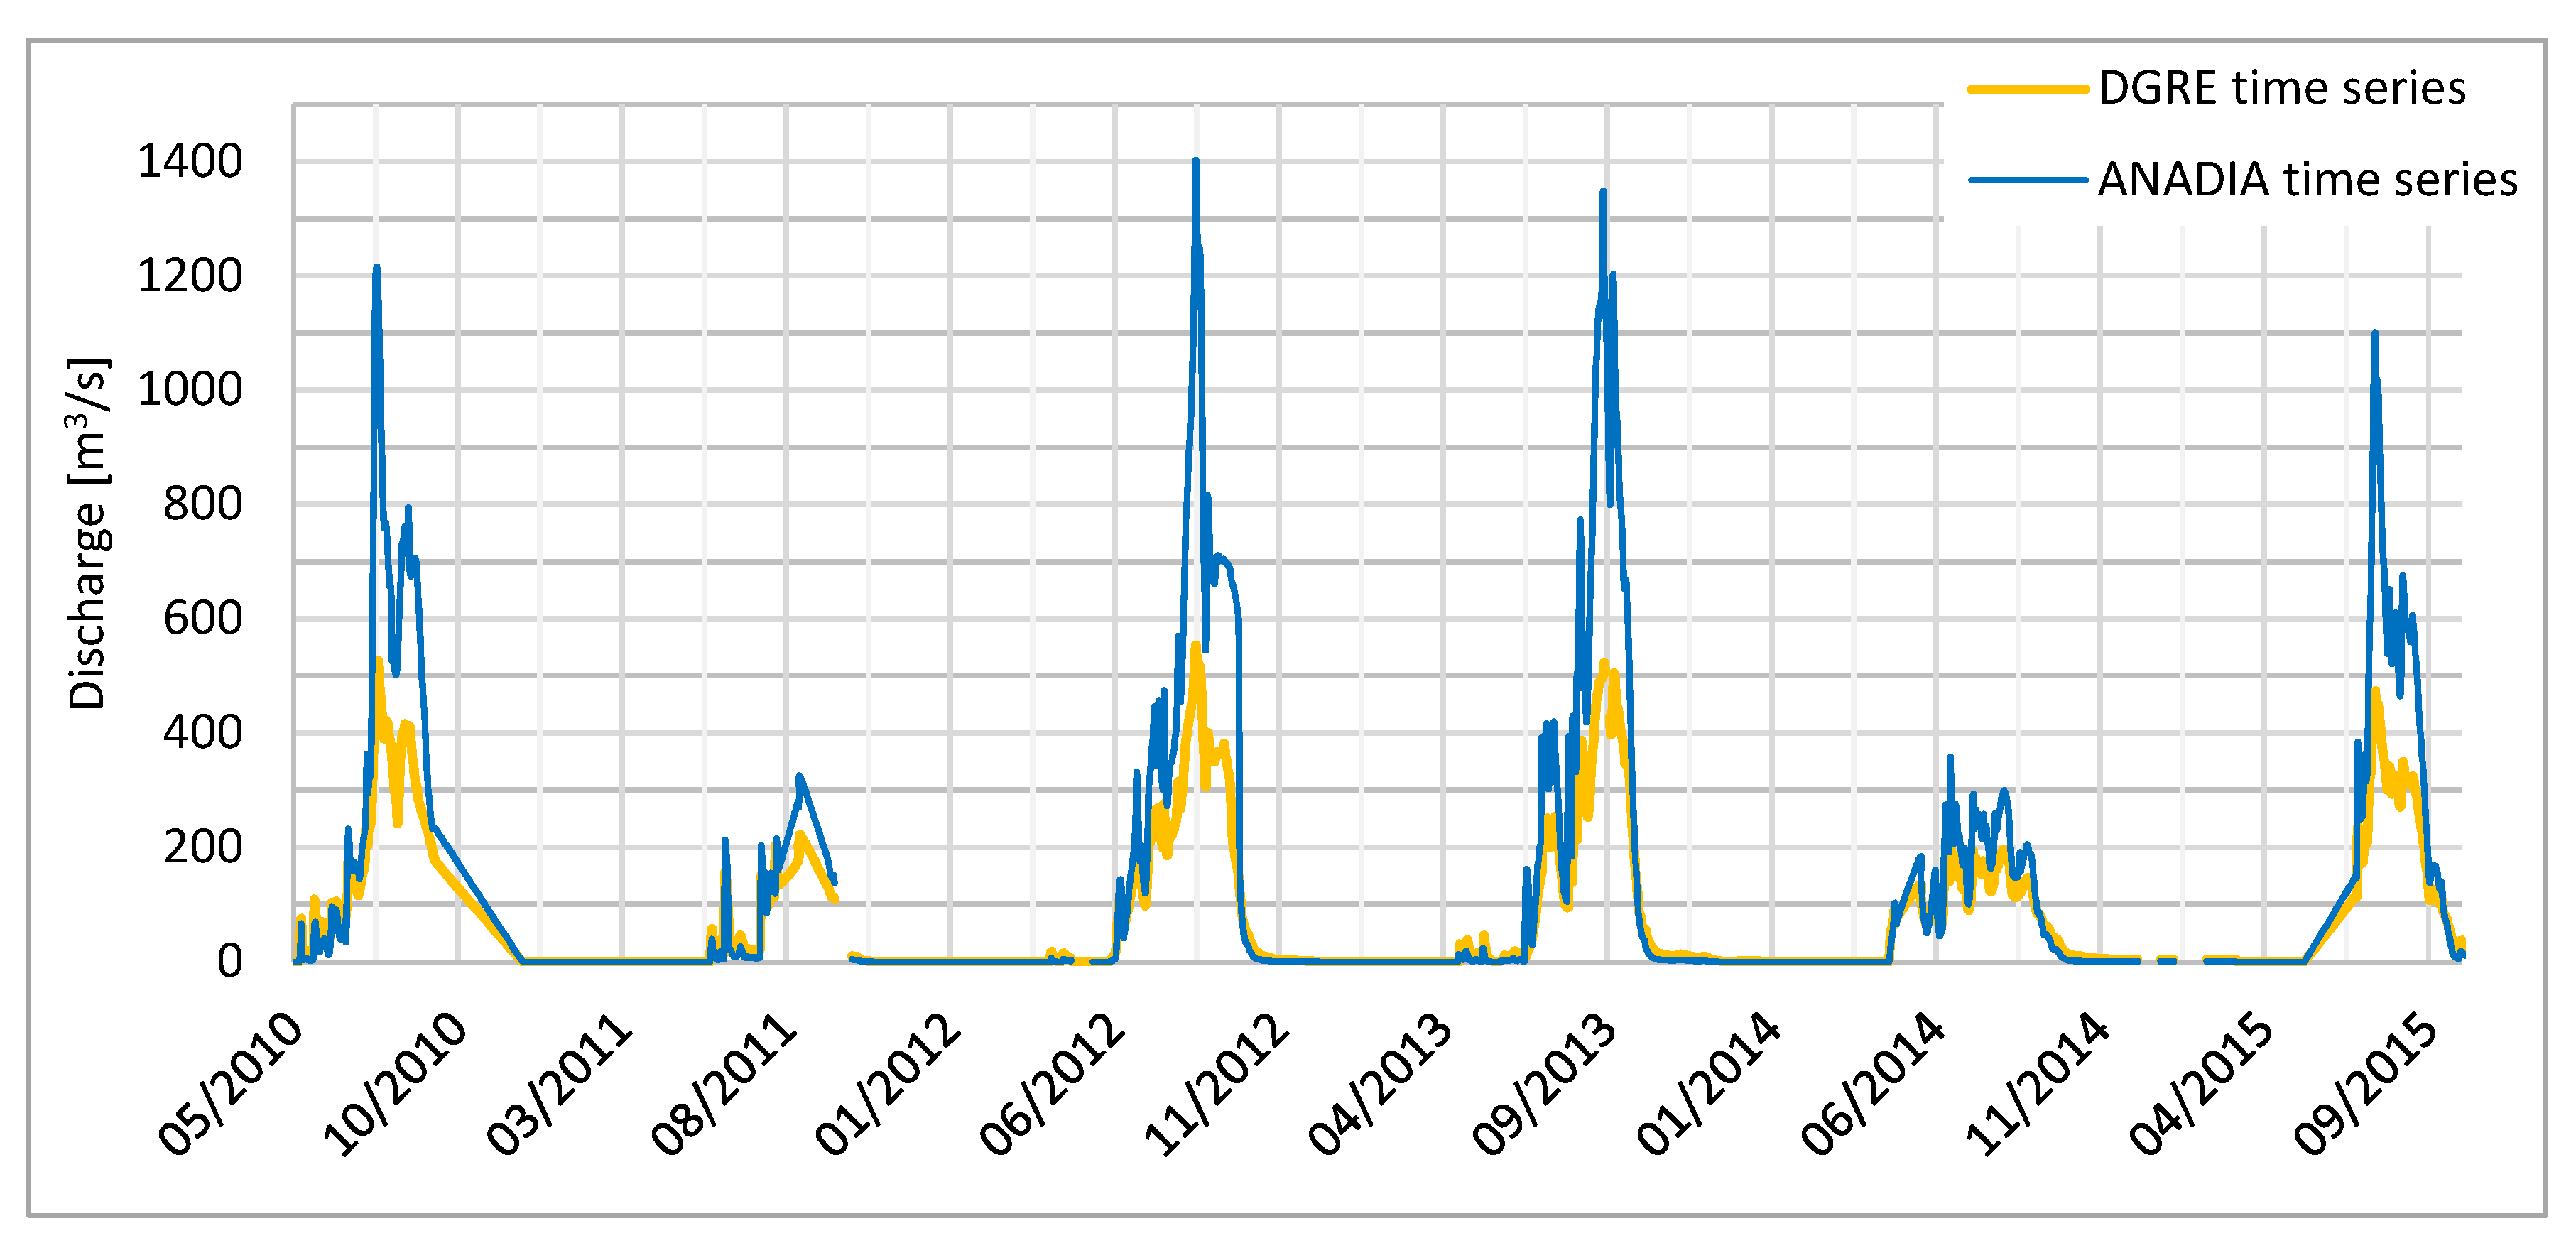
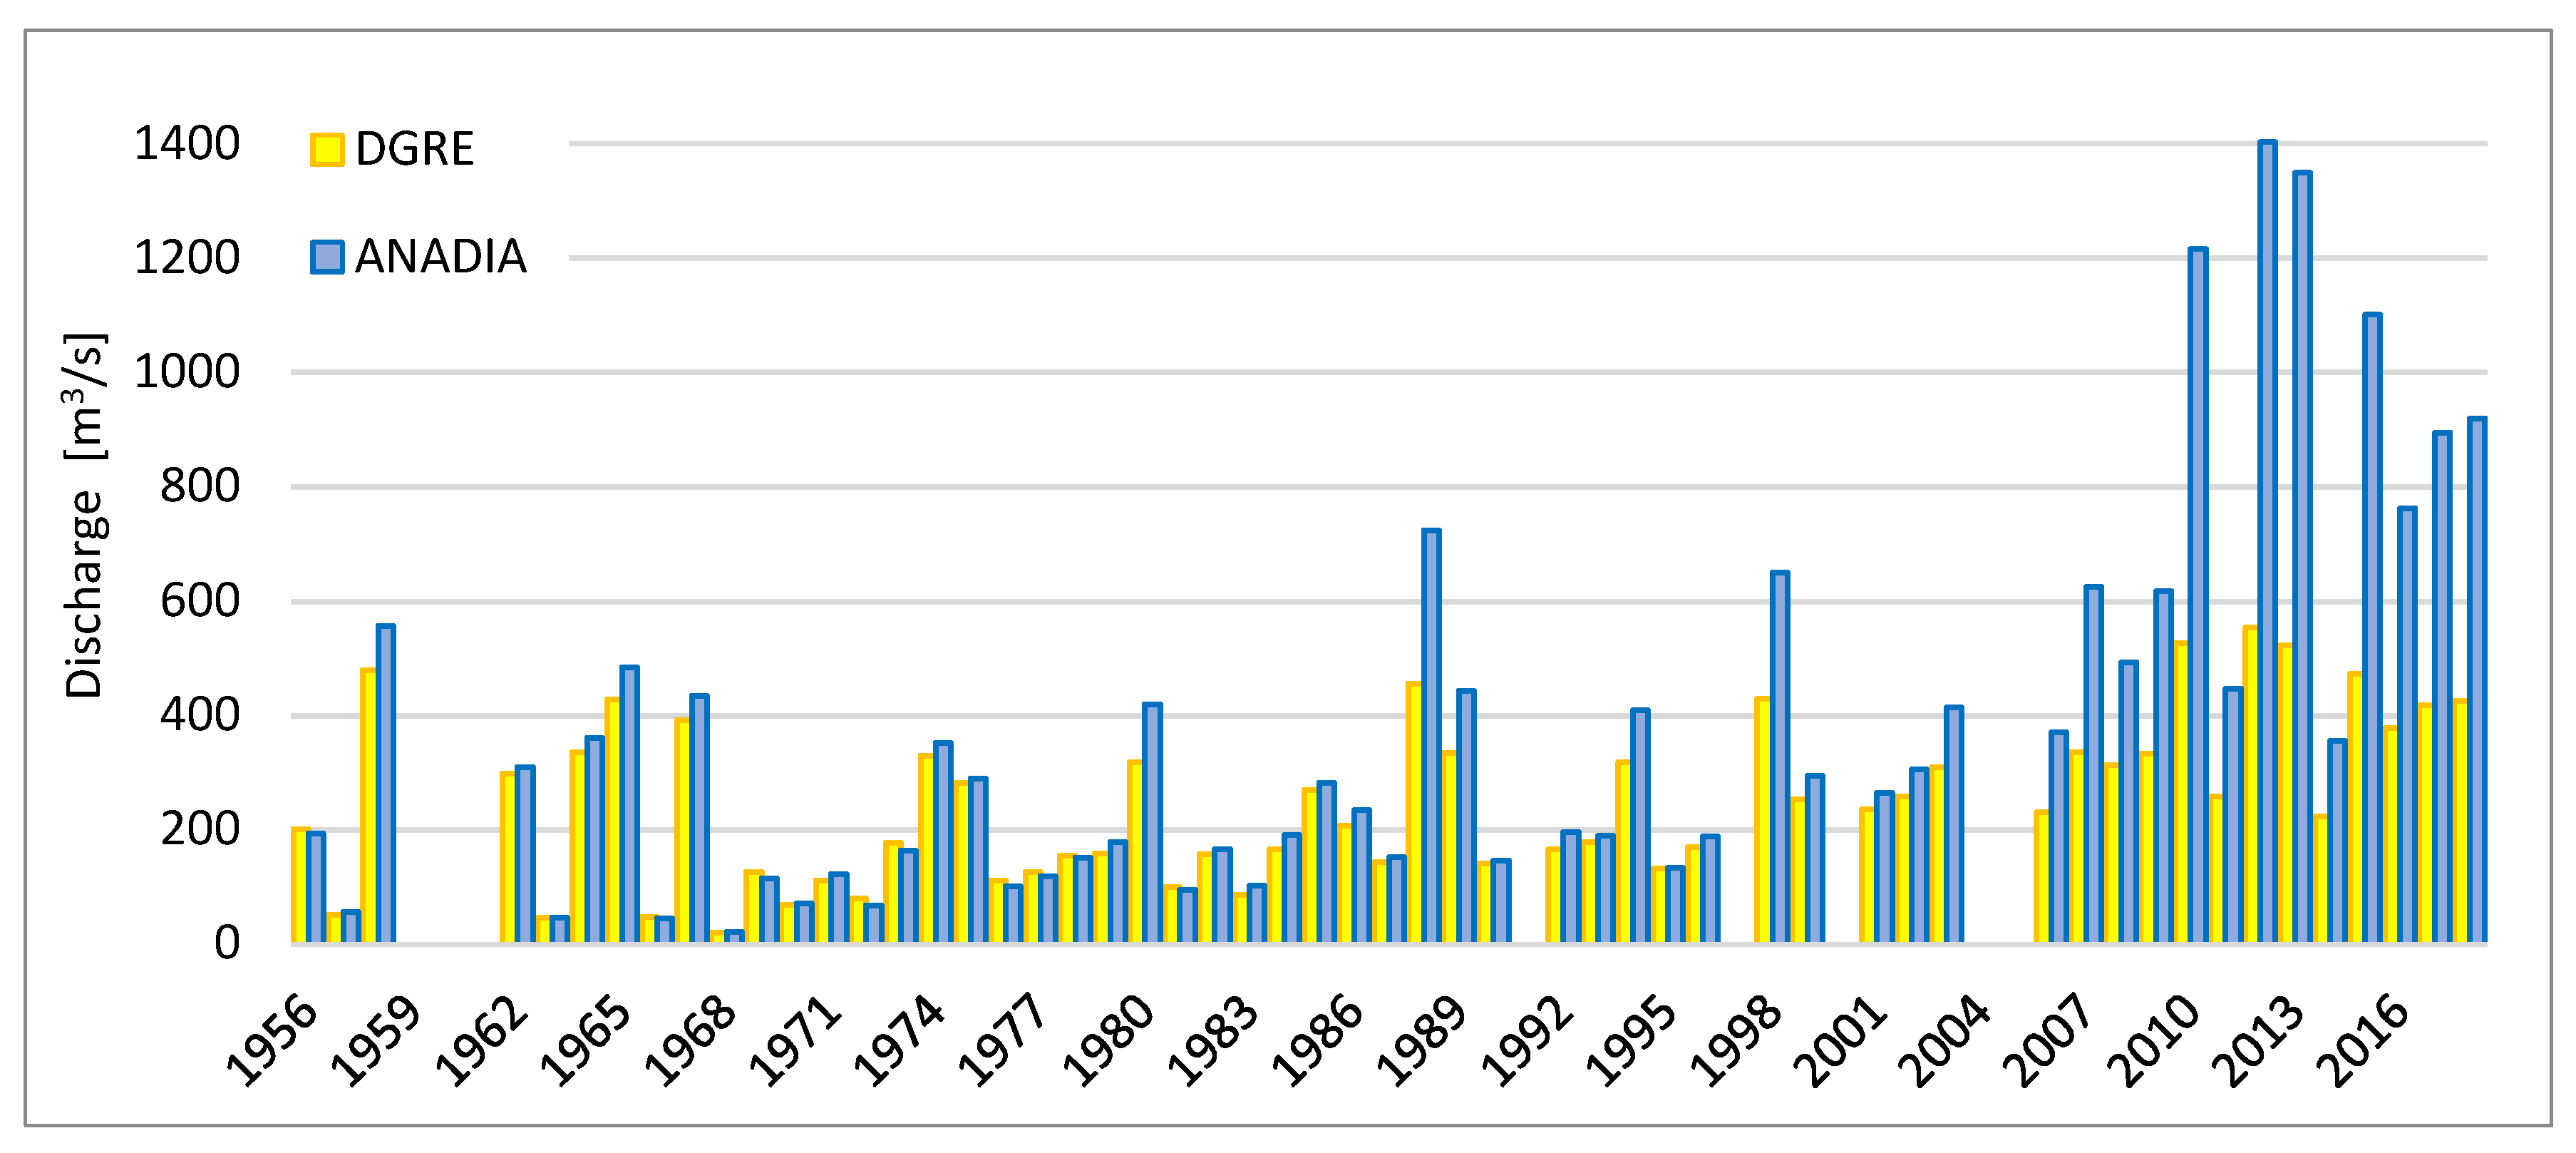
3.1. The Updated Time Series of Discharge
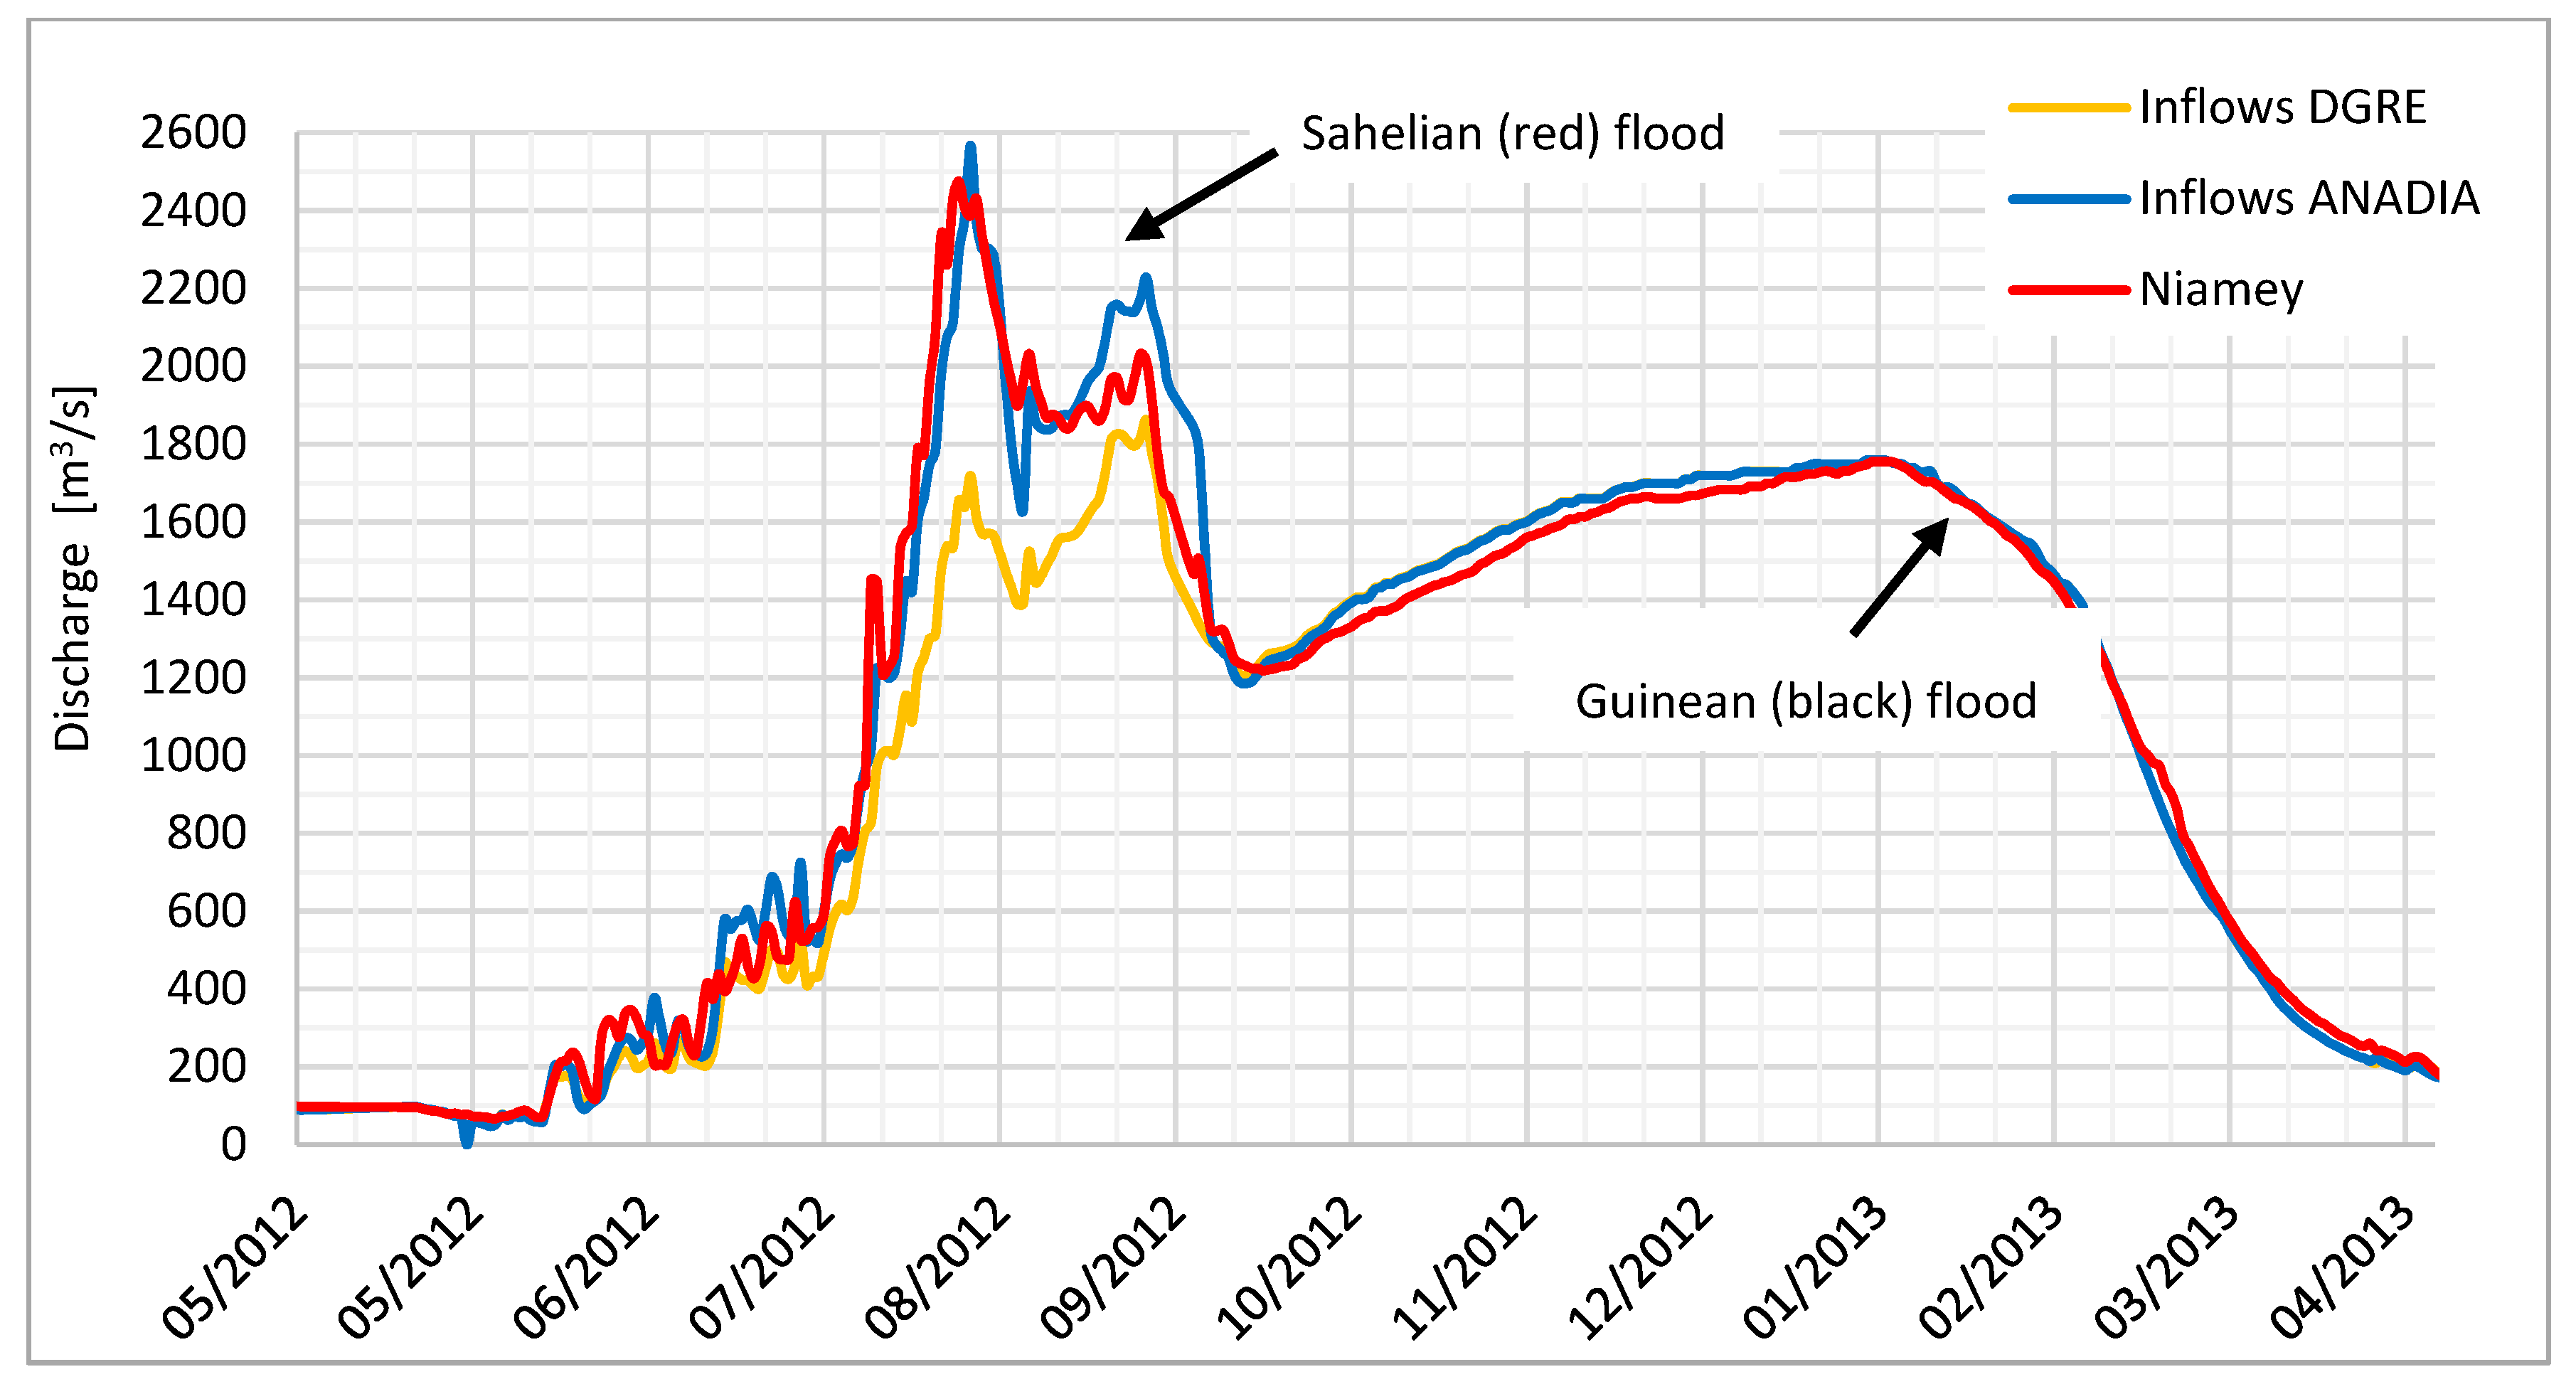
3.2. Discharge Verification: The Niger River Hydrograph
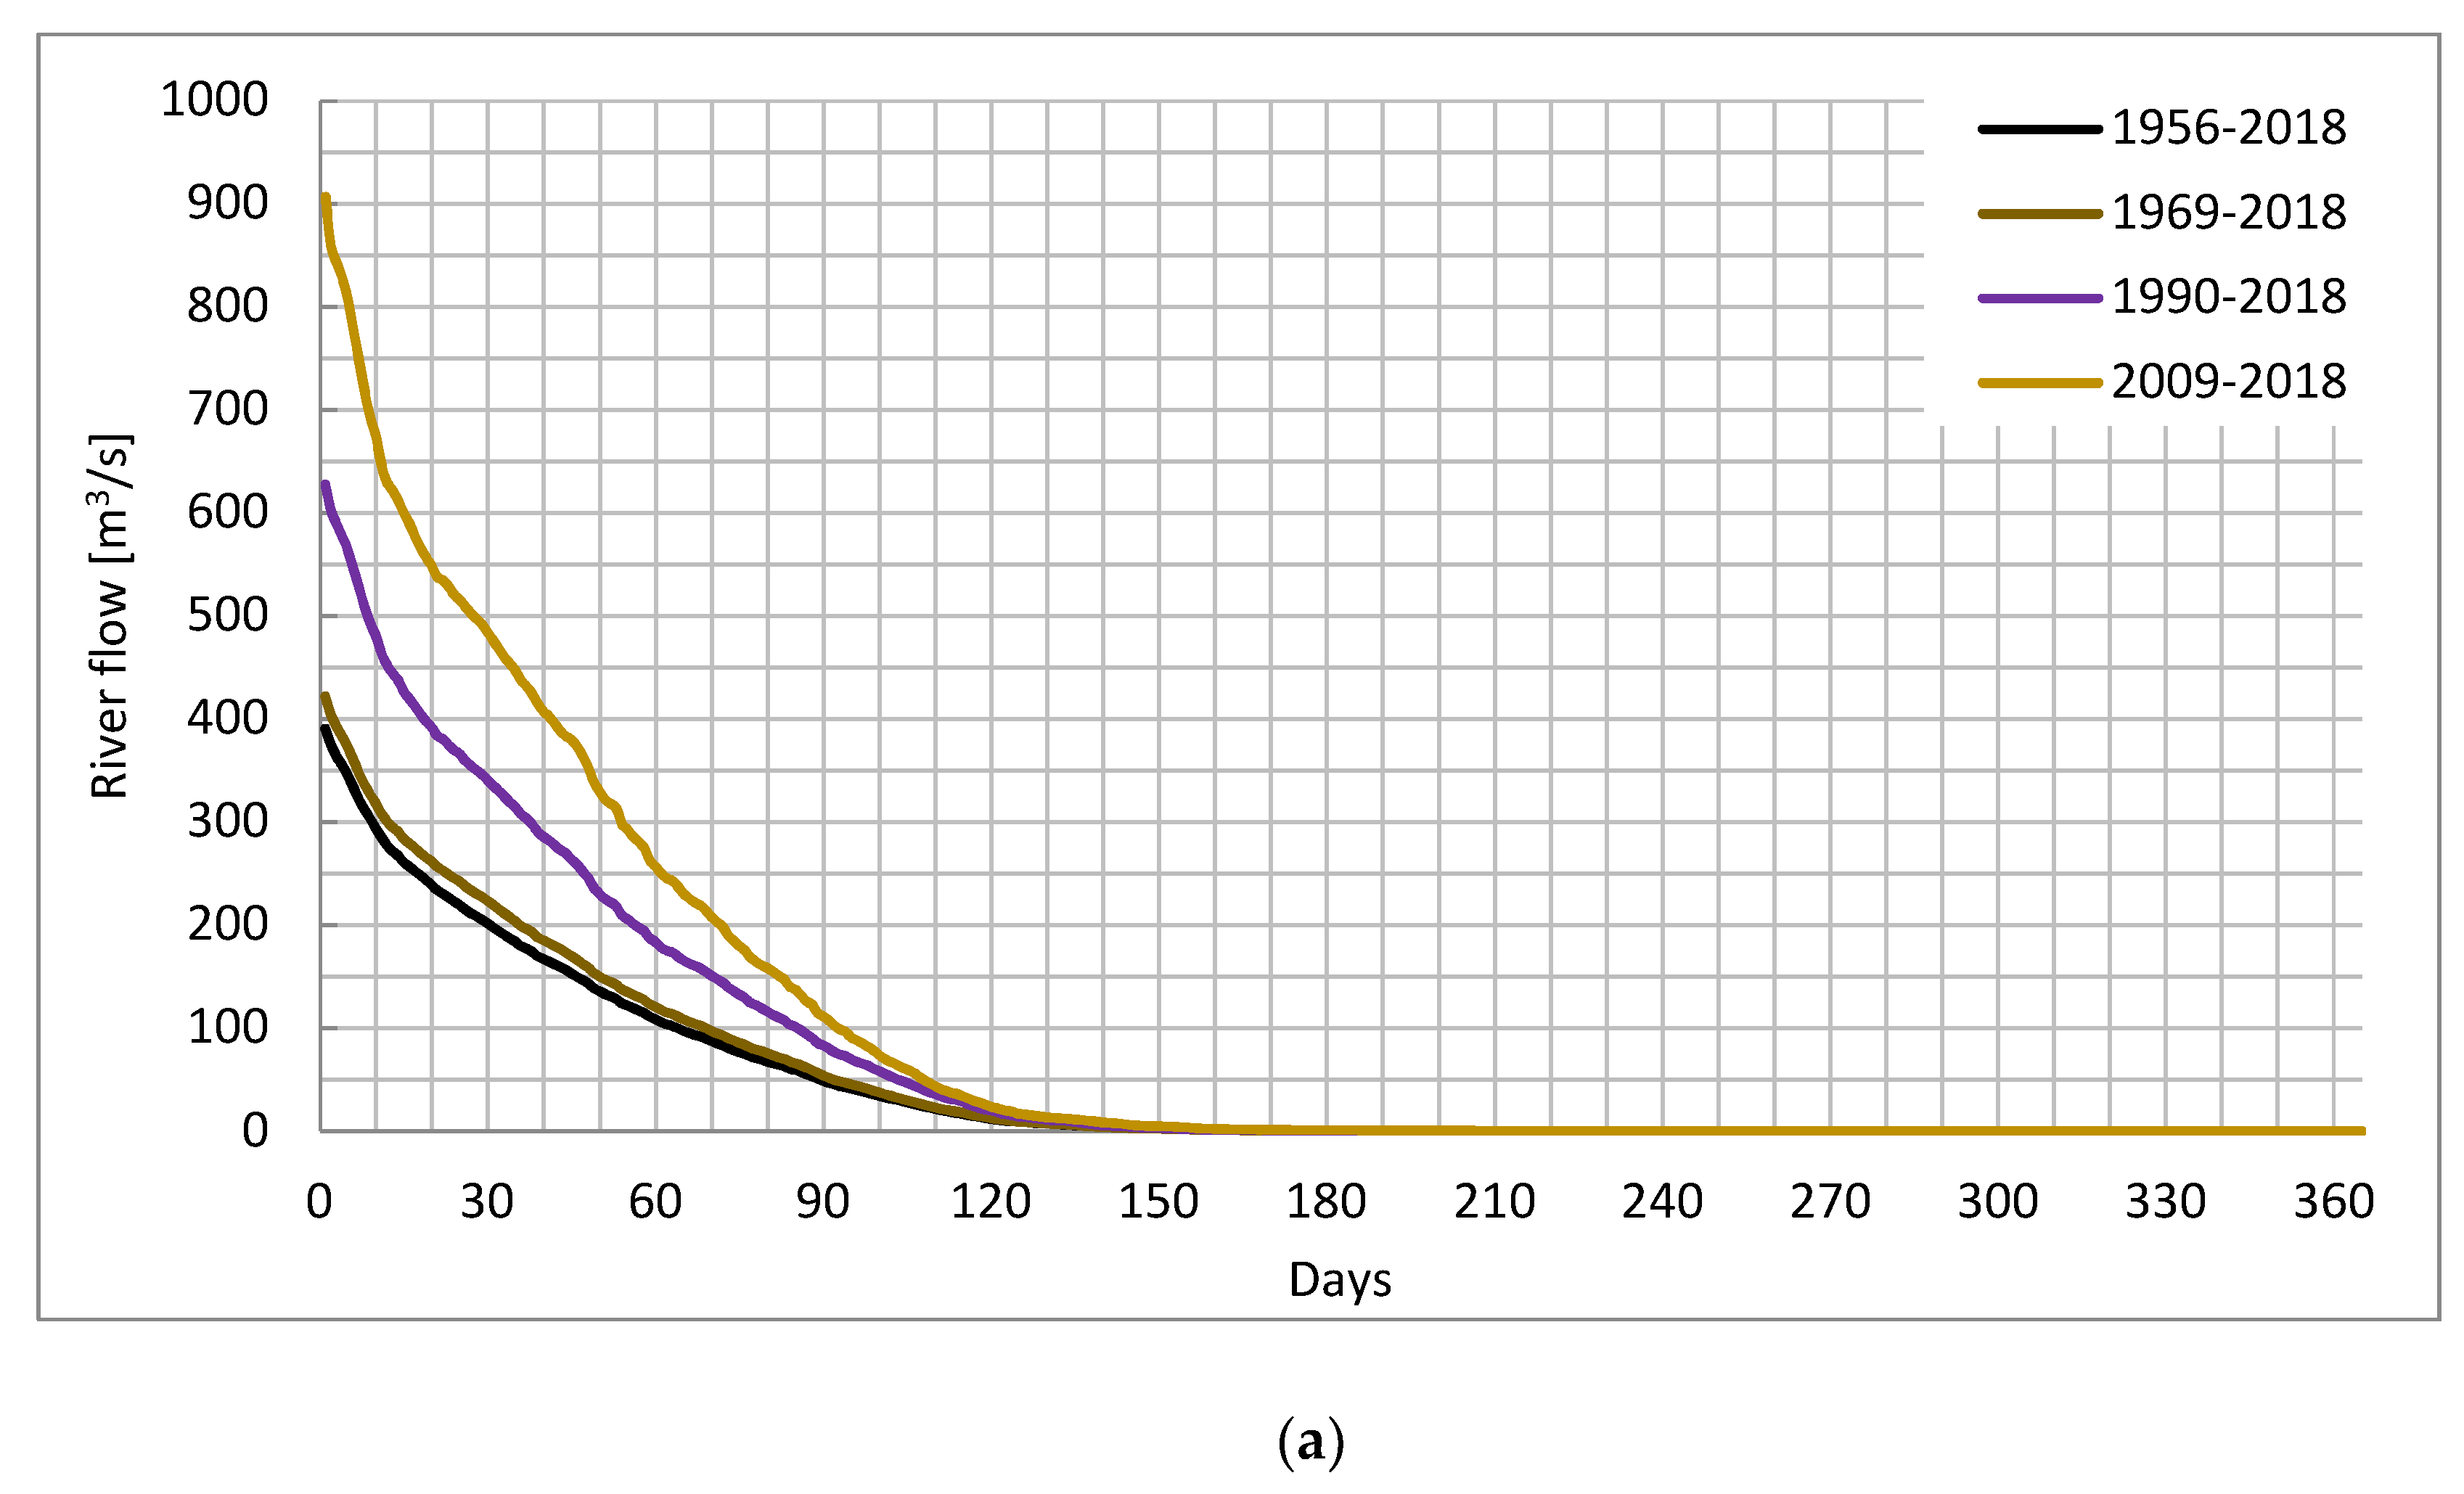
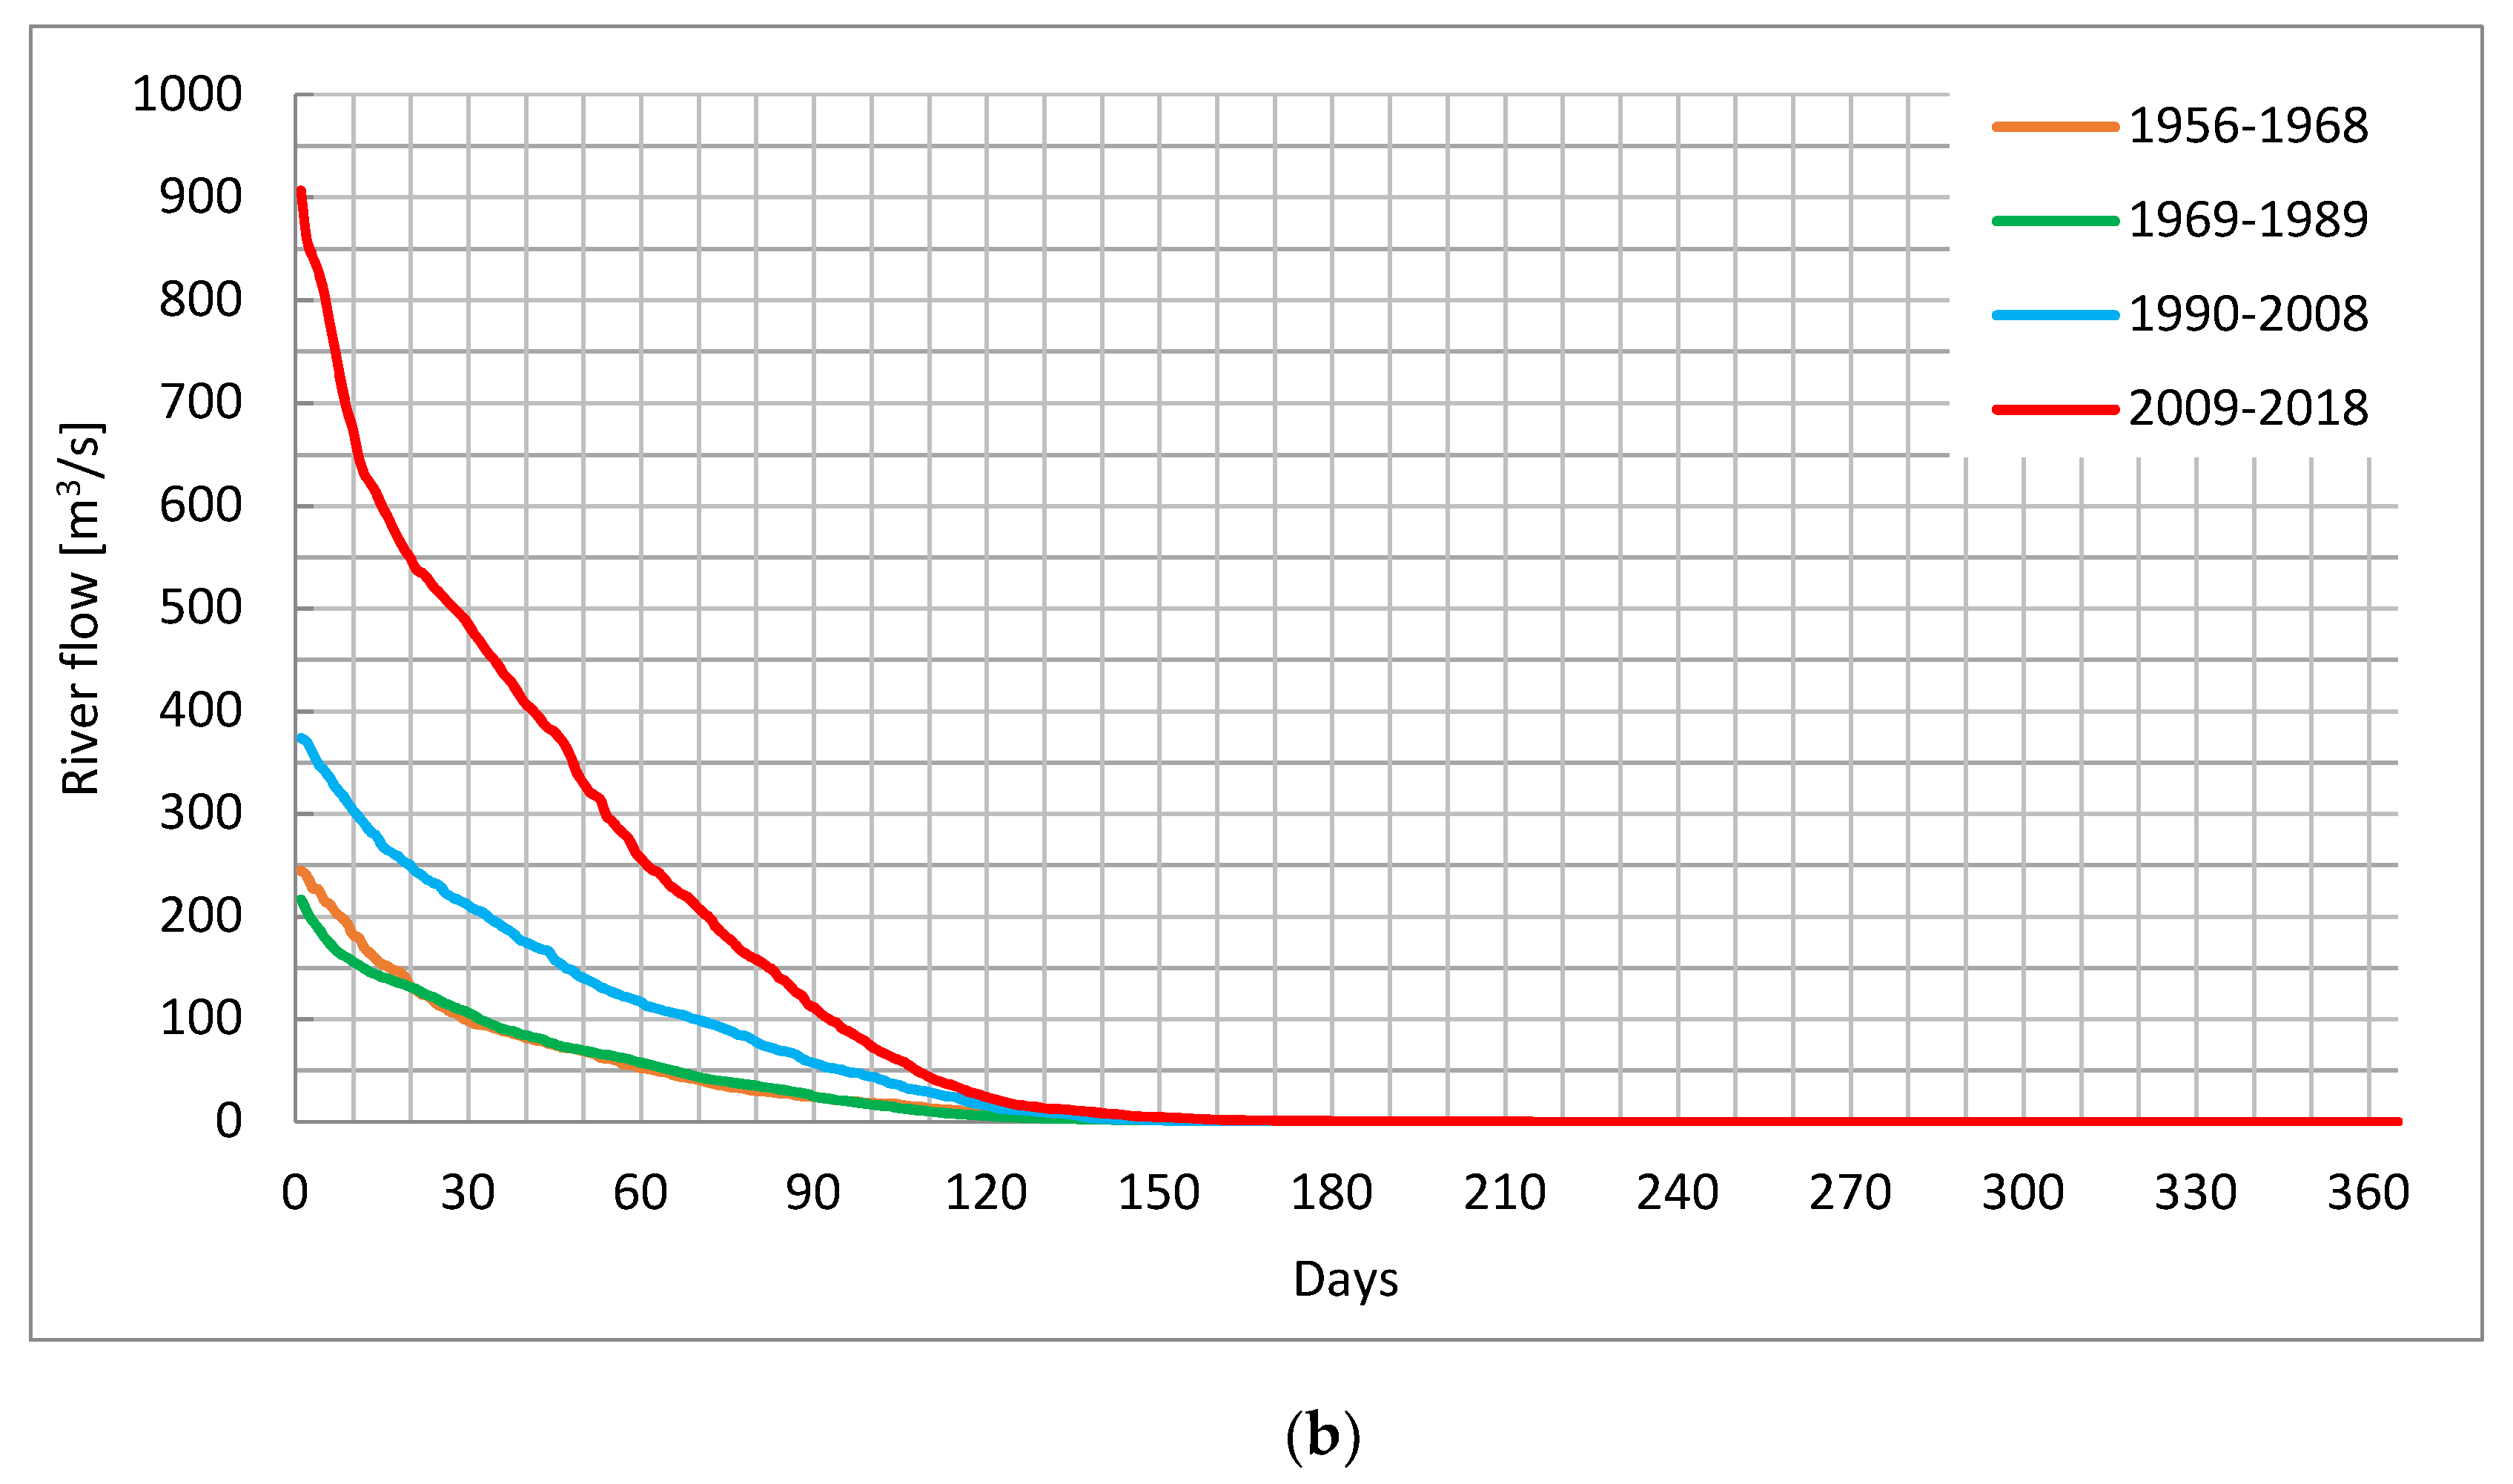
3.3. River Flow Regime
- To assess the evolution over time—the first FDC was calculated for the entire period of analysis while other curves cover different periods in accordance with the detected changepoints;
- To assess the river behavior during each period.
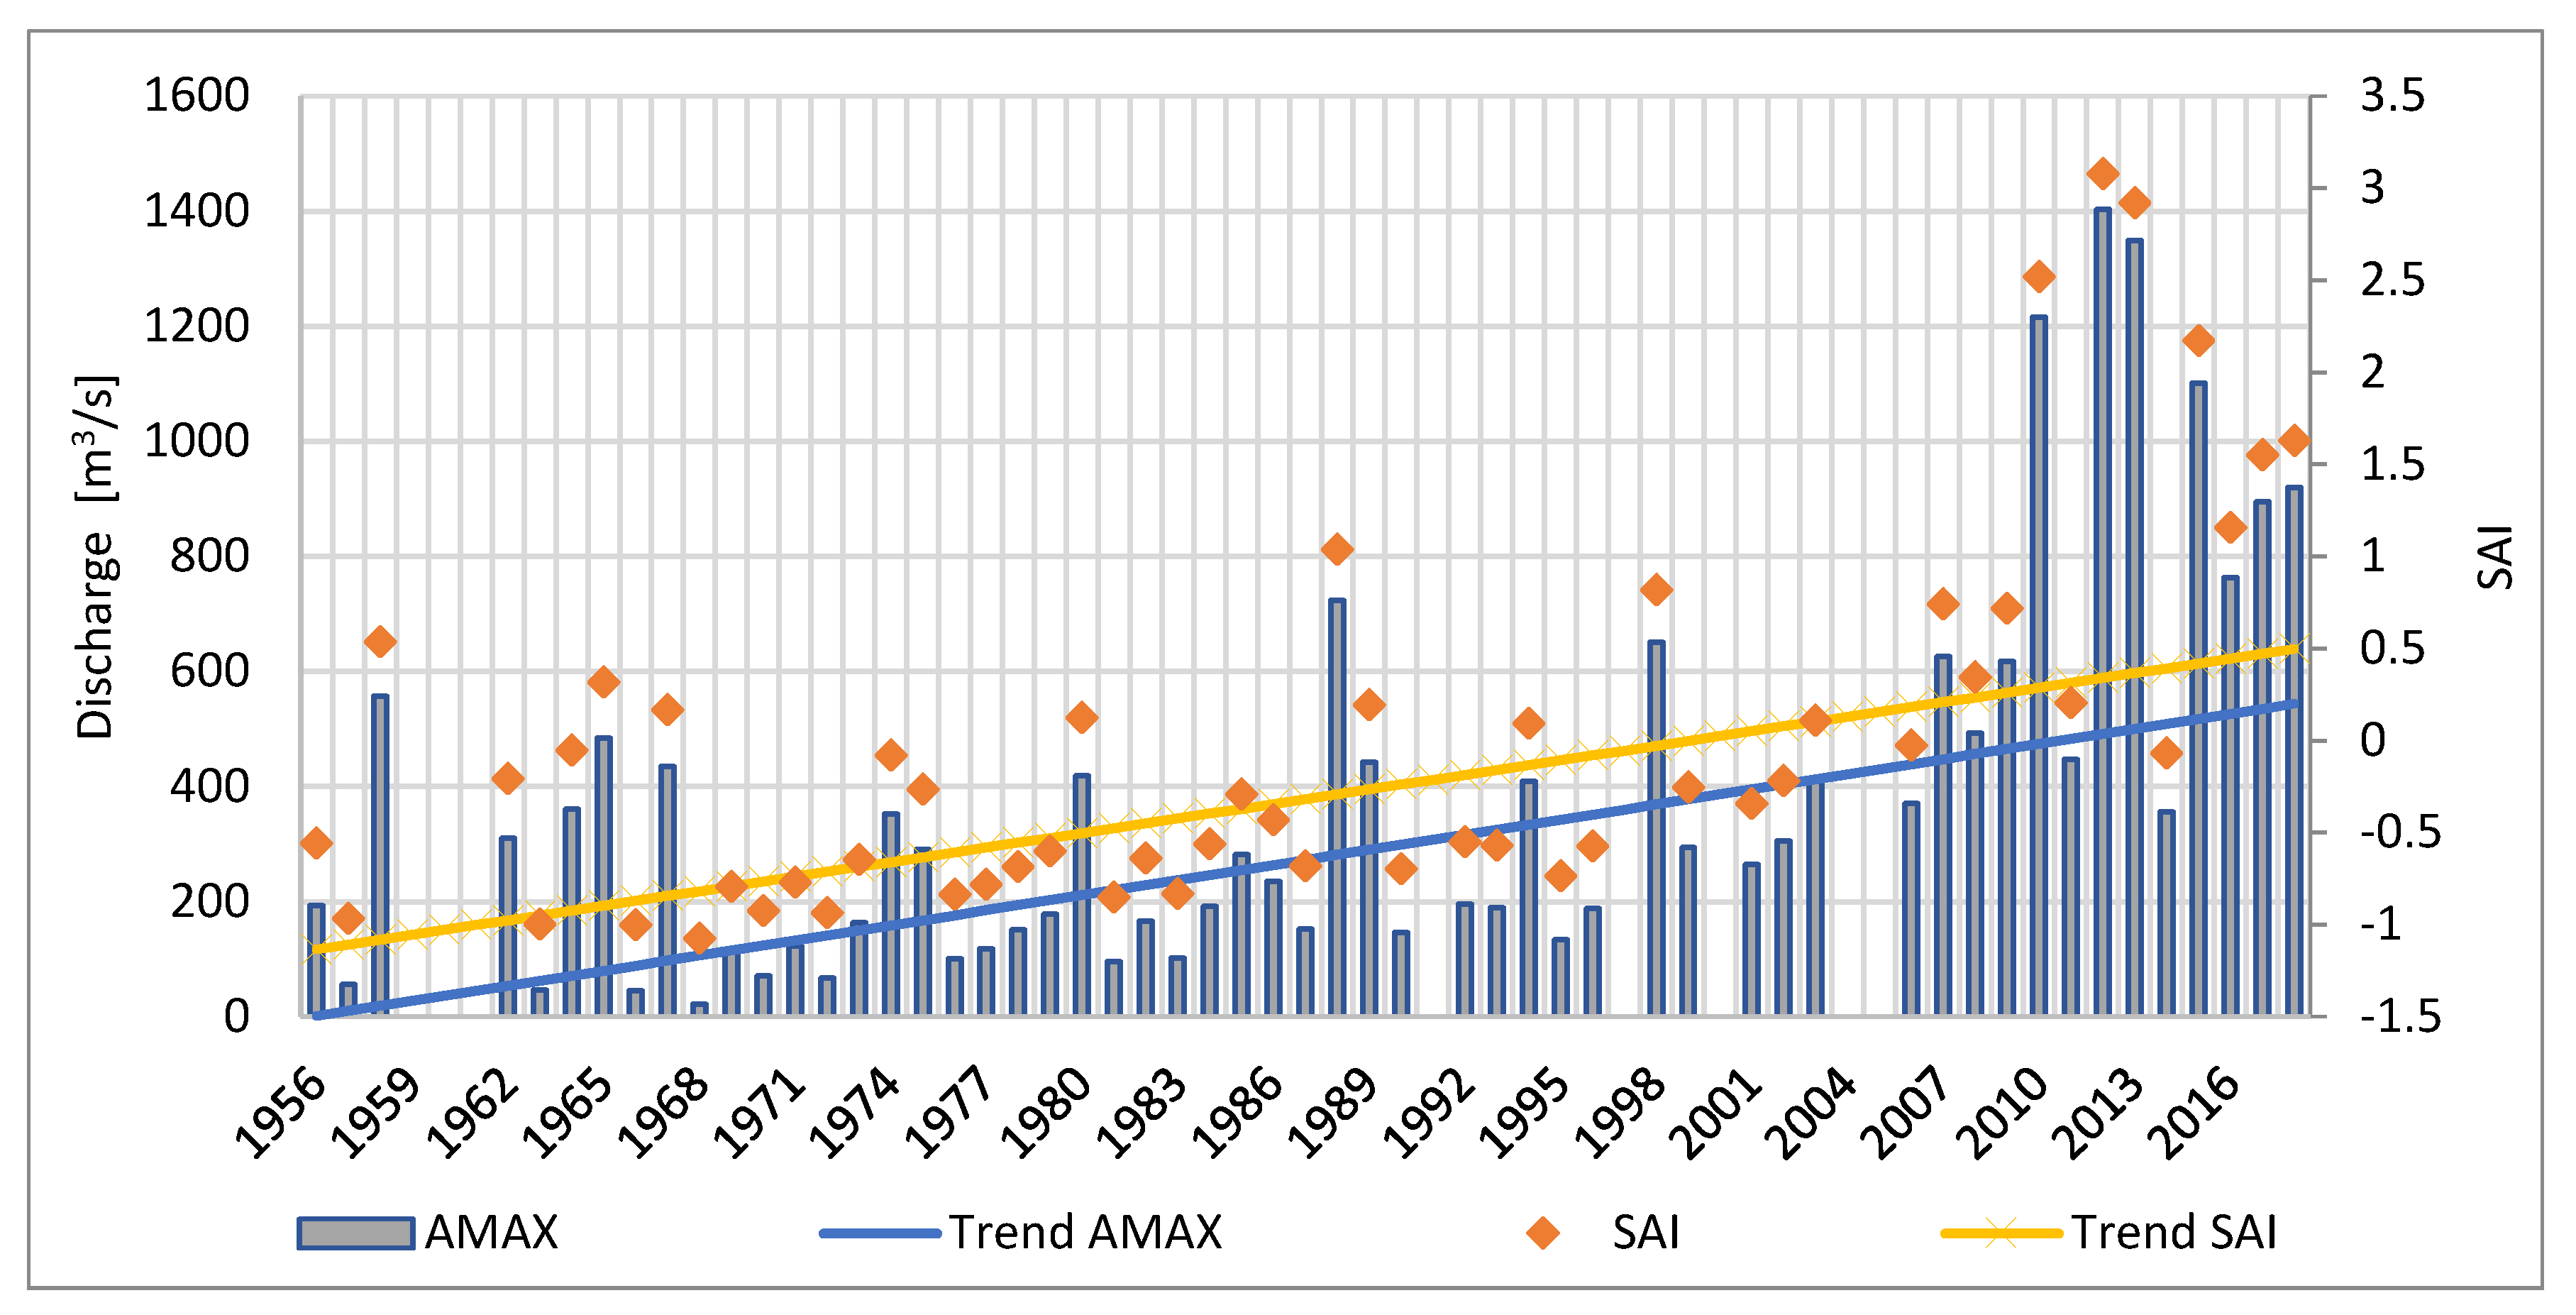
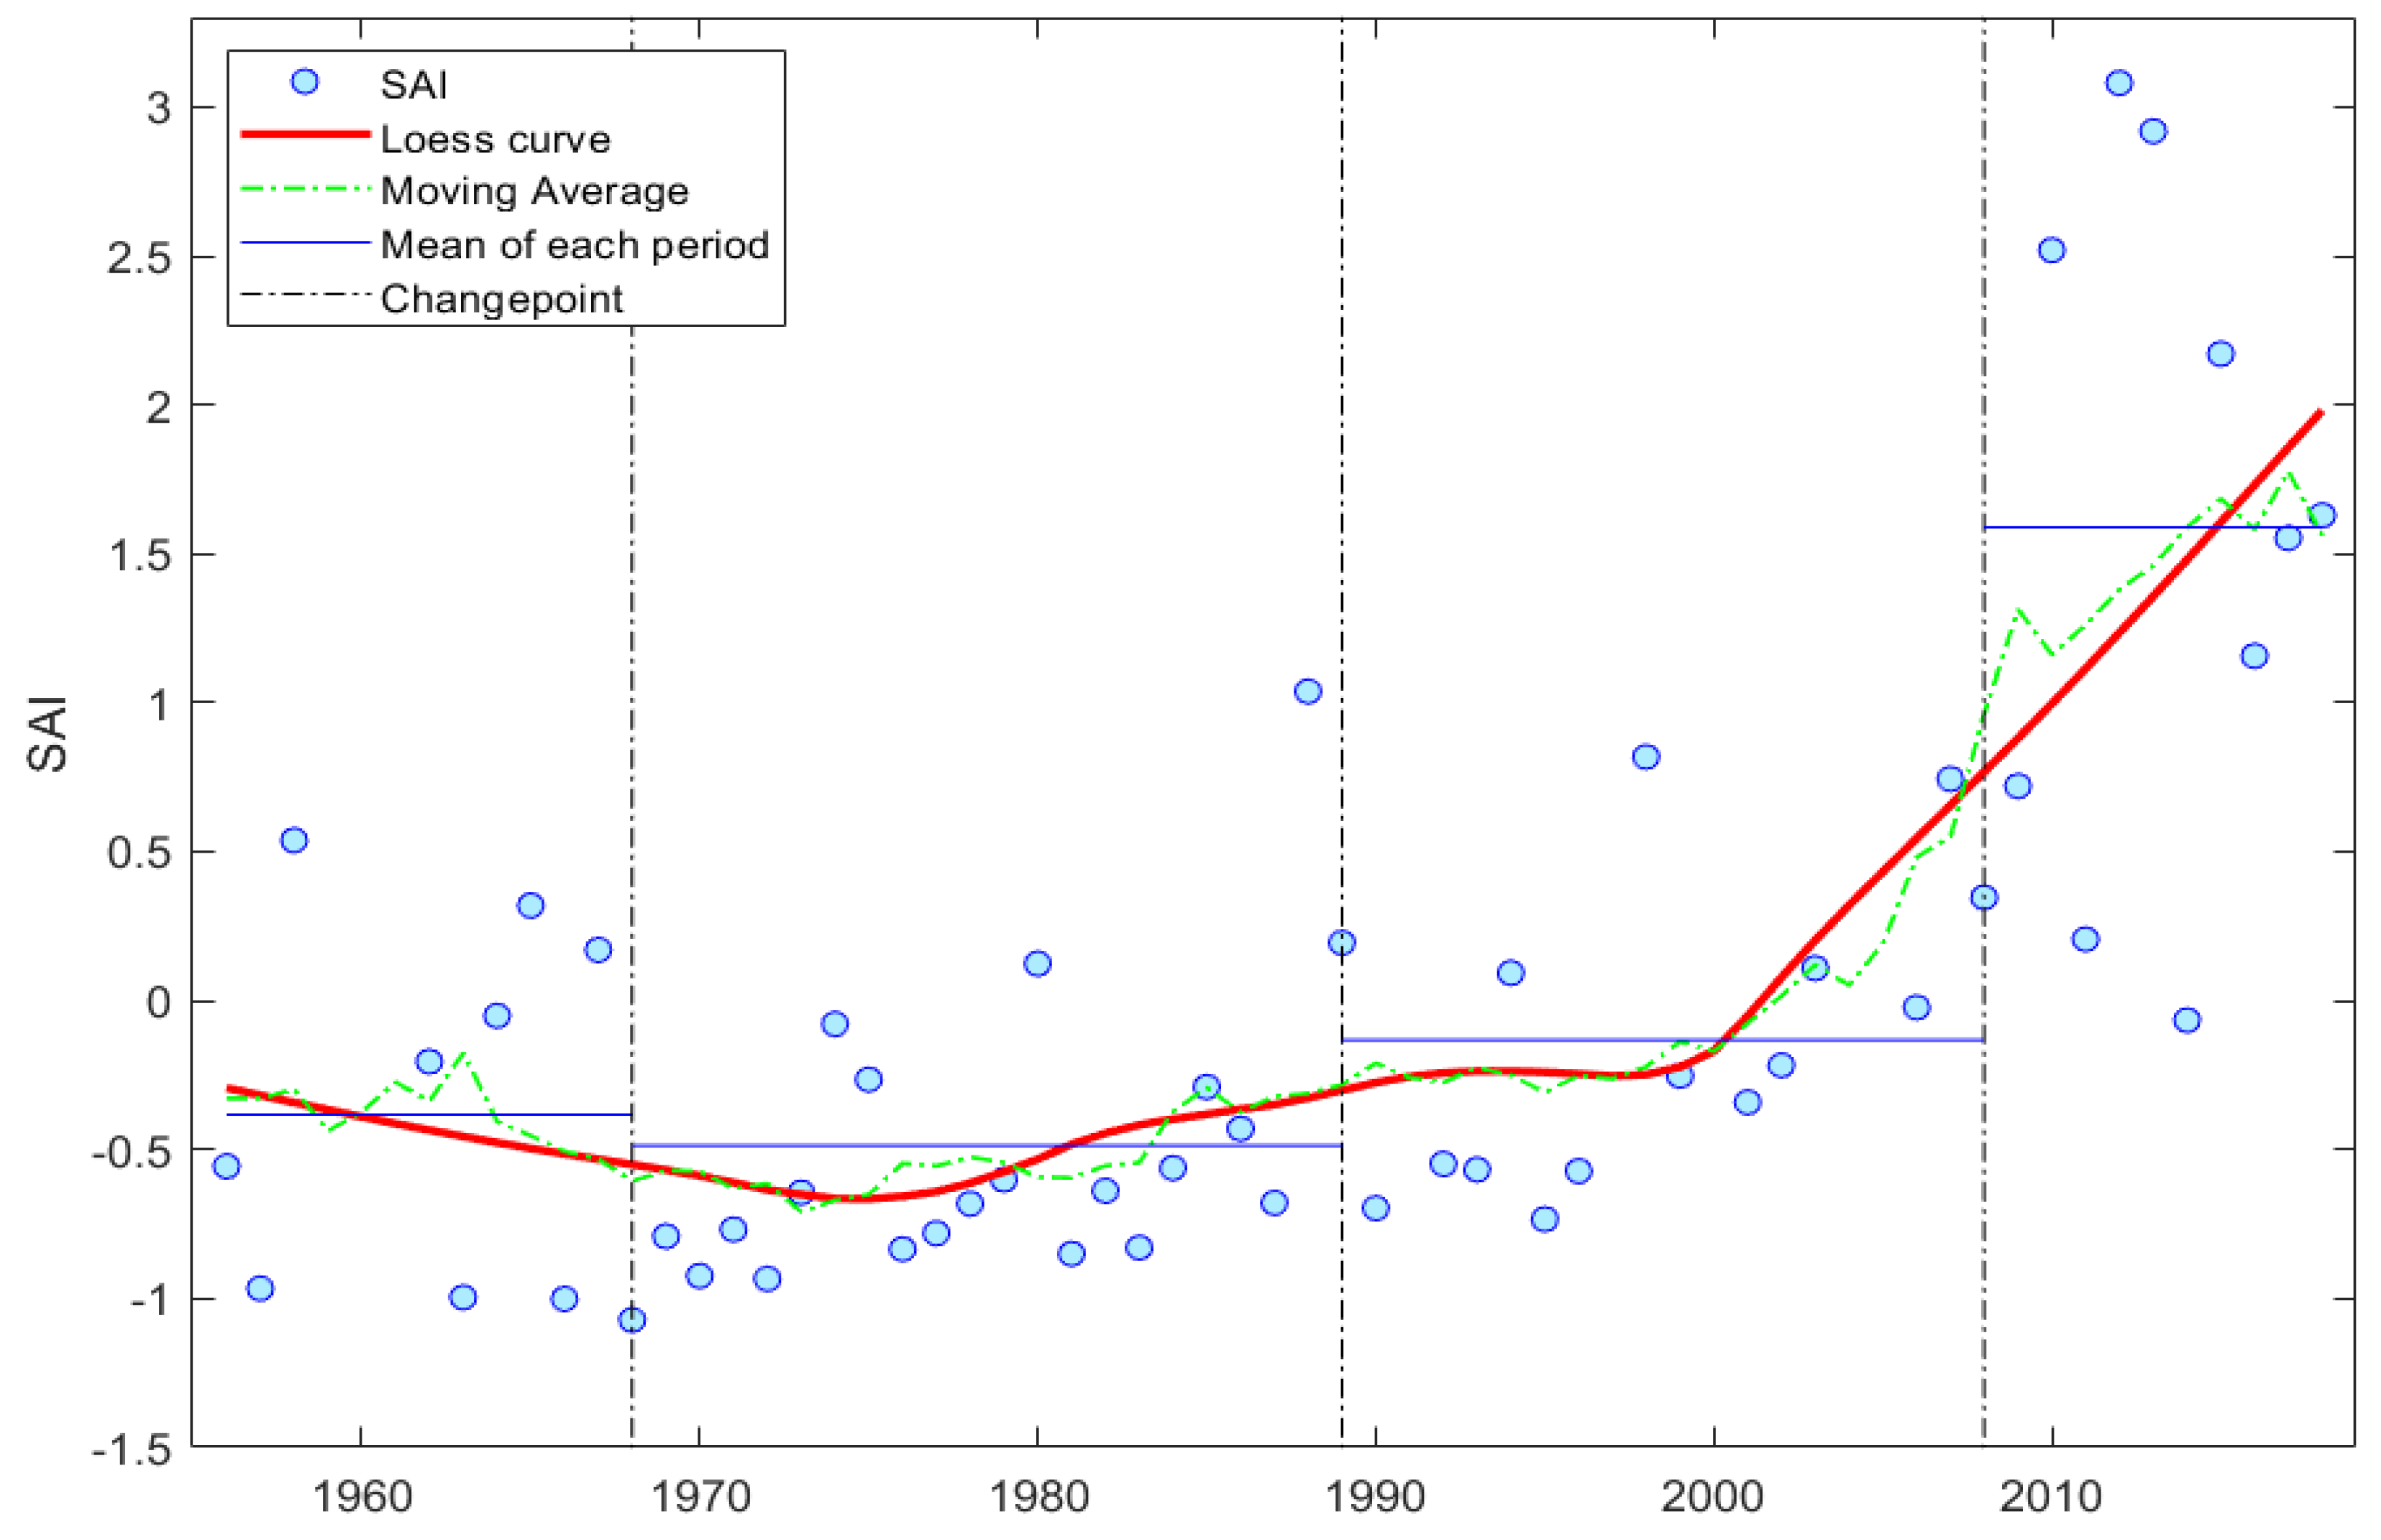
3.4. Trend Analysis
4. Conclusions
Author Contributions
Funding
Acknowledgments
Conflicts of Interest
References
- Aich, V.; Koné, B.; Hattermann, F.F.; Paton, E.N. Time series analysis of floods across the Niger River Basin. Water Switz. 2016, 8, 165. [Google Scholar] [CrossRef]
- Panthou, G.; Vischel, T.; Lebel, T. Recent trends in the regime of extreme rainfall in the Central Sahel. Int. J. Climatol. 2014, 34, 3998–4006. [Google Scholar] [CrossRef]
- Amogu, O.; Descroix, L.; Yéro, K.S.; Le Breton, E.; Mamadou, I.; Ali, A.; Vischel, T.; Bader, J.-C.; Moussa, I.B.; Gautier, E.; et al. Increasing River Flows in the Sahel? Water 2010, 2, 170–199. [Google Scholar] [CrossRef]
- Descroix, L.; Genthon, P.; Amogu, O.; Rajot, J.L.; Sighomnou, D.; Vauclin, M. Change in Sahelian Rivers hydrograph: The case of recent red floods of the Niger River in the Niamey region. Glob. Planet. Chang. 2012, 98–99, 18–30. [Google Scholar] [CrossRef]
- Aich, V.; Liersch, S.; Vetter, T.; Andersson, J.C.M.; Müller, E.N.; Hattermann, F.F. Climate or land use?—Attribution of changes in river flooding in the Sahel zone. Water Switz. 2015, 7, 2796–2820. [Google Scholar] [CrossRef]
- Fiorillo, E.; Crisci, A.; Issa, H.; Maracchi, G.; Morabito, M.; Tarchiani, V. Recent Changes of Floods and Related Impacts in Niger Based on the ANADIA Niger Flood Database. Climate 2018, 6, 59. [Google Scholar] [CrossRef]
- Tarhule, A. Damaging Rainfall and Flooding: The Other Sahel Hazards. Clim. Chang. 2005, 72, 355–377. [Google Scholar] [CrossRef]
- Lebel, T.; Ali, A. Recent trends in the Central and Western Sahel rainfall regime (1990–2007). J. Hydrol. 2009, 375, 52–64. [Google Scholar] [CrossRef]
- Le Barbé, L.; Lebel, T. Rainfall climatology of the HAPEX-Sahel region during the years 1950–1990. J. Hydrol. 1997, 188–189, 43–73. [Google Scholar]
- Nicholson, S. On the question of the “recovery” of the rains in the West African Sahel. J. Arid Environ. 2005, 63, 615–641. [Google Scholar] [CrossRef]
- Descroix, L.; Bouzou, I.; Genthon, P.; Sighomnou, D.; Mahe, G.; Mamadou, I.; Vandervaere, J.-P.; Gautier, E.; Faran, O.; Rajot, J.-L.; et al. Impact of Drought and Land–Use Changes on Surface–Water Quality and Quantity: The Sahelian Paradox. Curr. Perspect. Contam. Hydrol. Water Resour. Sustain. 2013. [Google Scholar] [CrossRef]
- Descroix, L. Processus et Enjeux d’eau en Afrique de l’Ouest Soudano-Sahélienne; Editions des archives contemporaines: Paris, France, 2018; ISBN 978-2-8130-0314-0. [Google Scholar]
- Aich, V.; Koné, B.; Hattermann, F.F.; Müller, E.N. Floods in the Niger basin — analysis and attribution. Nat. Hazards Earth Syst. Sci. Discuss. 2014, 2, 5171–5212. [Google Scholar] [CrossRef]
- Casse, C.; Gosset, M.; Vischel, T.; Quantin, G.; Tanimoun, B.A. Model-based study of the role of rainfall and land use-land cover in the changes in the occurrence and intensity of Niger red floods in Niamey between 1953 and 2012. Hydrol. Earth Syst. Sci. 2016, 20, 2841–2859. [Google Scholar] [CrossRef]
- Leblanc, M.J.; Favreau, G.; Massuel, S.; Tweed, S.O.; Loireau, M.; Cappelaere, B. Land clearance and hydrological change in the Sahel: SW Niger. Glob. Planet. Chang. 2008, 61, 135–150. [Google Scholar] [CrossRef]
- Séguis, L.; Cappelaere, B.; Milési, G.; Peugeot, C.; Massuel, S.; Favreau, G. Simulated impacts of climate change and land-clearing on runoff from a small Sahelian catchment. Hydrol. Process. 2004, 18, 3401–3413. [Google Scholar] [CrossRef]
- Sighomnou, D.; Descroix, L.; Genthon, P.; Mahé, G.; Moussa, I.B.; Gautier, E.; Mamadou, I.; Vandervaere, J.P.; Bachir, T.; Coulibaly, B.; et al. La crue de 2012 à Niamey: Un paroxysme du paradoxe du Sahel? Sci. Chang. Planetaires-Secheresse 2013, 24, 3–13. [Google Scholar]
- Descroix, L.; Guichard, F.; Grippa, M.; Lambert, L.; Panthou, G.; Mahé, G.; Gal, L.; Dardel, C.; Quantin, G.; Kergoat, L.; et al. Evolution of Surface Hydrology in the Sahelo-Sudanian Strip: An Updated Review. Water 2018, 10, 748. [Google Scholar] [CrossRef]
- Mamadou, I.; Gautier, E.; Descroix, L.; Noma, I.; Bouzou Moussa, I.; Faran Maiga, O.; Genthon, P.; Amogu, O.; Malam Abdou, M.; Vandervaere, J.P. Exorheism growth as an explanation of increasing flooding in the Sahel. Catena 2015, 131, 130–139. [Google Scholar] [CrossRef]
- Nka, B.N.; Oudin, L.; Karambiri, H.; Paturel, J.E.; Ribstein, P. Trends in floods in West Africa: Analysis based on 11 catchments in the region. Hydrol. Earth Syst. Sci. 2015, 19, 4707–4719. [Google Scholar] [CrossRef]
- Bigi, V.; Pezzoli, A.; Rosso, M. Past and Future Precipitation Trend Analysis for the City of Niamey (Niger): An Overview. Climate 2018, 6, 73. [Google Scholar] [CrossRef]
- Tiepolo, M.; Tarchiani, V. Risque et Adaptation Climatique Dans la Région Tillabéri, Niger; L’Harmattan: Paris, France, 2016; ISBN 978-2-343-08493-0. [Google Scholar]
- Brunet-More, Y.; Chaperon, P.; Lamagat, J.P.; Molinier, M. Monographie Hydrologique Du Fleuve Niger; Food and Agriculture Organization: Rome, Italy, 1986; ISBN 2709907909. [Google Scholar]
- Herschy, R.W. Streamflow Measurement; Chapman & Hall: London, UK, 1995. [Google Scholar]
- Leboutillier, D.W.; Waylen, P. Regional variations in flow-duration curves for rivers in British Columbia, Canada. Phys. Geogr. 1993, 14, 359–378. [Google Scholar] [CrossRef]
- Wang, X.L.; Wen, Q.H.; Wu, Y. Penalized Maximal t Test for Detecting Undocumented Mean Change in Climate Data Series. J. Appl. Meteorol. Climatol. 2007, 46, 916–931. [Google Scholar] [CrossRef]
- Wang, X.L. Accounting for Autocorrelation in Detecting Mean Shifts in Climate Data Series Using the Penalized Maximal t or F Test. J. Appl. Meteorol. Climatol. 2008, 47, 2423–2444. [Google Scholar] [CrossRef]
- Kraus, E.B. Subtropical Droughts and Cross-Equatorial Energy Transports. Mon. Weather Rev. 1977, 105, 1009–1018. [Google Scholar] [CrossRef]
- Katz, R.W.; Glantz, M.H. Anatomy of a Rainfall Index. Mon. Weather Rev. 1986, 114, 764–771. [Google Scholar] [CrossRef]
- Jaranilla-Sanchez, P.A.; Wang, L.; Koike, T. Modeling the hydrologic responses of the Pampanga River basin, Philippines: A quantitative approach for identifying droughts. Water Resour. Res. 2011, 47. [Google Scholar] [CrossRef]
- Babatolu, J.S.; Akinnubi, R.T. Surface Temperature Anomalies in the River Niger Basin Development Authority Areas, Nigeria. Atmos. Clin. Sci. 2013, 3, 532–537. [Google Scholar] [CrossRef]
- Cleveland, W.S.; Devlin, S.J. Locally Weighted Regression: An Approach to Regression Analysis by Local Fitting. J. Am. Stat. Assoc. 1988, 83, 596–610. [Google Scholar] [CrossRef]
- Salmi, T.; Määttä, A.; Anttila, P.; Ruoho-Airola, T.; Amnell, T. Detecting trends of annual values of atmospheric pollutants by the Mann-Kendall test and Sen’s slope estimates—The Excel template application MAKESENS. Air Qual. 2002, 31. [Google Scholar]
- Wilcox, C.; Vischel, T.; Panthou, G.; Bodian, A.; Blanchet, J.; Descroix, L.; Quantin, G.; Cassé, C.; Tanimoun, B.; Kone, S. Trends in hydrological extremes in the Senegal and Niger Rivers. J. Hydrol. 2018, 566, 531–545. [Google Scholar] [CrossRef]


| Acronyms | Full Names |
|---|---|
| MNRB | Middle Niger River Basin |
| NBA | Niger Basin Authority |
| DGRE | General Water Resources Management |
| FDC | flow-duration curve |
| AMAX | annual maximum discharge |
| SAI | Standardized Anomaly Index |
| DGRE RC | rating curves used by DGRE |
| ANADIA RC | updated rating curves of this study |
| ANADIA time series | updated time series of discharge of this study |
| Name | Coordinates | River | Country | Basin Area (km2) | Installation Date | |
|---|---|---|---|---|---|---|
| Latitude (°) | Longitude (°) | |||||
| Kandaji | 14.6103 | 0.9906 | Niger | Niger | 633,000 | 1975 |
| Niamey | 13.5106 | 2.1069 | Niger | Niger | 700,000 | 1929 |
| Kakassi | 13.85 | 1.4667 | Dargol | Niger | 6940 | 1957 |
| Sebba | 13.4333 | 0.5167 | Yali | Burkina Faso | 2280 | 1981 |
| Liptougou | 13.1840 | 0.3256 | Faga | Burkina Faso | 15,700 | 1973 |
| Bassieri | 12.8 | 0.33 | Koulouko | Burkina Faso | 8000 | 2010 |
| Bossey Bangou | 13.3538 | 1.2874 | Sirba | Niger | 37,000 | 2018 |
| Garbey Kourou | 13.7319 | 1.5984 | Sirba | Niger | 38,750 | 1956 |
| Rating Curves | Validity | Ranges (m) | a | b | R2 |
|---|---|---|---|---|---|
| 1 | 1956–1978 | [0–1) | 23.769 | 3.684 | 0.958 |
| [1–5] | 25.684 | 1.962 | 0.973 | ||
| 2 | 1979–2003 | [0–1.2) | 17.94 | 3.6 | 0.911 |
| [1.2–3.5] | 23.602 | 2.218 | 0.985 | ||
| 3 | 2004–2018 | [0–1.9) | 8.238 | 4.025 | 0.972 |
| [1.9–4] | 24.769 | 2.419 | 0.986 |
| Gauging Station | River | Qmean (m3/s) | Vannual (km3) | ||
|---|---|---|---|---|---|
| DGRE | ANADIA | DGRE | ANADIA | ||
| Niamey | Niger | 970 | 30.58 | ||
| Kandaji | Niger | 794 | 25.04 | ||
| Kakassi | Dargol | 15 | 0.46 | ||
| Garbey Kourou | Sirba | 65 | 102 | 2.04 | 3.22 |
| Upstream sum (Kandaji + Kakassi + Garbey Kourou) | 27.54 | 28.72 | |||
| Difference (Niamey – upstream sum) | 3.04 | 1.86 | |||
| FDC | Period-Evolution | Period-Behavior |
|---|---|---|
| 1 | 1956–2018 | 1956–1968 |
| 2 | 1969–2018 | 1969–1989 |
| 3 | 1990–2018 | 1990–2008 |
| 4 | 2009–2018 | 2009–2018 |
| Qn | 1956–1968 | 1969–1989 | 1990–2008 | 2009–2018 |
|---|---|---|---|---|
| Q1 | 244.8 | 216.4 | 373.7 | 906.9 |
| Q5 | 215.9 | 180.5 | 342.3 | 807.9 |
| Q10 | 182.3 | 155.9 | 304.0 | 674.4 |
| Q30 | 98.6 | 106.5 | 210.9 | 484.2 |
| Q60 | 52.4 | 57.6 | 116.8 | 256.7 |
| Q91 | 23.9 | 23.7 | 55.5 | 107.2 |
| Q135 | 4.9 | 2.9 | 6.7 | 11.2 |
| Q182 | 0.6 | 0.2 | 0.1 | 1.0 |
| Q274 | 0.0 | 0.0 | 0.0 | 0.1 |
| Q355 | 0.0 | 0.0 | 0.0 | 0.0 |
© 2019 by the authors. Licensee MDPI, Basel, Switzerland. This article is an open access article distributed under the terms and conditions of the Creative Commons Attribution (CC BY) license (http://creativecommons.org/licenses/by/4.0/).
Share and Cite
Tamagnone, P.; Massazza, G.; Pezzoli, A.; Rosso, M. Hydrology of the Sirba River: Updating and Analysis of Discharge Time Series. Water 2019, 11, 156. https://doi.org/10.3390/w11010156
Tamagnone P, Massazza G, Pezzoli A, Rosso M. Hydrology of the Sirba River: Updating and Analysis of Discharge Time Series. Water. 2019; 11(1):156. https://doi.org/10.3390/w11010156
Chicago/Turabian StyleTamagnone, Paolo, Giovanni Massazza, Alessandro Pezzoli, and Maurizio Rosso. 2019. "Hydrology of the Sirba River: Updating and Analysis of Discharge Time Series" Water 11, no. 1: 156. https://doi.org/10.3390/w11010156
APA StyleTamagnone, P., Massazza, G., Pezzoli, A., & Rosso, M. (2019). Hydrology of the Sirba River: Updating and Analysis of Discharge Time Series. Water, 11(1), 156. https://doi.org/10.3390/w11010156