Article

Inter-Sectoral Linkage and External Trade Analysis for Virtual Water and Embodied Carbon Emissions in China

1
College of Surveying and Geo-Informatics, North China University of Water Resources and Electric Power, Zhengzhou 450045, China
2
Collaborative Innovation Center of Water Resources Efficient Utilization and Support Engineering, Zhengzhou 450046, China
3
School of Conservancy, North China University of Water Resources and Electric Power, Zhengzhou 450045, China
4
College of Geography and Environment, Shandong Normal University, Jinan 250358, China
5
Henan Key Laboratory of Water Environment Simulation and Treatment, Zhengzhou 450046, China
*
Authors to whom correspondence should be addressed.
Water 2018, 10(11), 1664; https://doi.org/10.3390/w10111664
Submission received: 10 September 2018 / Revised: 8 November 2018 / Accepted: 10 November 2018 / Published: 15 November 2018
(This article belongs to the Special Issue Energy and Water Nexus)

Abstract

:
In the globalized world, water utilization and carbon emissions are two important indicators for water and energy resources evaluation. This paper investigates the inter-sectoral linkage and external trade of virtual water (water embodied in products) and embodied carbon emissions in China based on input–output tables during 1997–2015. Results indicate that: inside China, agriculture, the electric and water industry are major virtual water suppliers, while heavy industrial sectors including the metal products industry, the petrochemical industry, other nonmetallic mineral products industry, and the mining industry are major embodied carbon emissions suppliers. China is the net exporter of virtual water (137.15 × 10⁹ m3) and embodied carbon emissions (16.05 × 10⁸ t). From the perspective of industrial chain, about 81% of virtual water export come from agriculture, the electric and water industry ultimately, and about 85% of embodied carbon emissions export come from the mining industry, the petrochemical industry, other nonmetallic mineral products industry, the metal products industry, and the electric and water industry ultimately.

1. Introduction

Problems of resource depletion and global warming caused by natural resource over exploitation and environmental deterioration have aroused global concern in recent years [1]. Among the problems, water scarcity and greenhouse gas (GHG) emissions are global challenges and severe threats to the sustainability of social development. It shows that 43 countries and 700 million people suffer water shortage problems [2]; accordingly, the water crisis has become a global environmental issue in the 21st century. Besides, GHG, especially carbon dioxide (CO2) emissions, are considered to be the main causes of the global warming [3]. Trade in both goods and services have a rapid growth as globalization of the world economy since the 1980s. Globalization is increasing the separation of production and consumption locations of goods and services, and the effect of trade on water resources shortage and carbon emissions in different areas should to be taken into account [4].
Water embodied in products is defined as “virtual water” [5]. According to trade theory, regions or countries can import goods or services from the regions specialized in the production. Therefore, imports of water-intensive commodities from water-abundant to water-scarce areas can solve the water resources shortage. Zeitoun et al. [6] estimated that through crop and livestock trade during 1998–2014, annual net imports of virtual water in Nile Basin states occupied one third of the Nile River and were considered to play a key role in filling the freshwater deficits of the region. However, various studies have shown that the existing trade in virtual water is not consistent with the trade theory. Severely water-scarce developing countries such as Tunisia, Egypt, and India exported large amounts of virtual water embodied in crops and aggravated the regional water stress [7,8,9]. Meanwhile, some developed countries or regions such as Spain, European Union (EU) are net importers of virtual water [10,11].
To produce near-zero net pollutant emissions, nearly 200 countries adopted The Paris Agreement of 2015 and determined the shared emissions reduction targets in the second half of this century [12]. However, countries with GHG emissions reduction tasks may fulfill their emissions reduction targets by increasing commodity imports from countries with non-emission reduction obligations [13,14,15]. Andrew et al. [16] reported the dependence on either exports or imports of carbon emissions for most major economies is rising. Additionally, several studies depicted the transfer of carbon emissions from developed to developing countries, and attempted to put forward some alternative solutions to reduce carbon emissions transfer. Zhong et al. [12] analyzed global embodied emissions trade for 39 countries from 1995 to 2011, and explored the determinants of the trade change from a spatial perspective. Antimiani et al. [17] developed a modified version of the computable general equilibrium model to evaluate the effect of alternative trade policy on carbon emissions. Furthermore, Eichner and Pethig [18], and Böhringer et al. [19] investigated the performance of a consumption-based carbon tax in the carbon emission trade.
In China, resource consumption, energy consumption, and the resulting carbon emissions have all risen sharply with the rapid development of the economy in recent years. China is one of the most water scarce countries, in which available water resource per capita is less than one quarter of the global average. Furthermore, the distribution and demand of water resources in China is uneven. Chen et al. [20] pointed out that there is only 19% of water resources but 64.15% cultivated land in north of the Yangtze River Basin in China. In addition, China’s economic growth pattern is characterized by being significantly outwardly-oriented and has been recognized as the world factory. Since China joined the World Trade Organization (WTO) in 2001, great amounts of virtual water have been imported and exported, accompanied by massive commodities trade [21,22,23]. Not only large amounts of virtual water, but also massive embodied carbon emissions, are exported outside accompanied by the output of products. Yan and Yang [24] estimated that about 10–27% of China’s annual carbon emissions are produced inside China and consumed by foreign consumers from 1997 to 2007. Andersson [25] found that the embodied carbon emissions exported by China to developed countries increased rapidly from 1995 to 2008. Moreover, Yuan and Zhao [26] employed an input–output method combined with a sensitivity analysis to explore the impact of technological changes on embodied carbon emissions in high energy-consuming industries.
The transfer of virtual water and carbon emissions takes place not only among different regions but also among different sectors within one region. Determining the role of each sector in the supply chain of water consumption and carbon emissions can provide clarity for the task of water conservation and carbon emissions reduction. In order to grasp the correlation of water consumption and carbon emissions among different sectors, the internal linkage analysis should be considered. Duarte et al. [27] adopted a vertically integrated sectors approach to disaggregate pollution into its most significant components. Wen and Wang [28] developed an inter-sector linkage analyses based on a multi-regional input–output model to identify key sectors and provinces on the issue of carbon emissions in China. Fang and Chen [29,30] detected the water and energy consumption coactions among different economic sectors in Bejing city, China, and characterized the role of each sector along the entire supply chain. Furthermore, Yang et al. [31] investigated the energy-water-carbon nexus from a sectoral perspective by utilizing an environmental input–output table.
Currently, research conducted on water–carbon internal linkage among different sectors and on water–carbon trade mainly focuses on specific productions, economic effects and the corresponding measures separately, while the exploration on combining external trade with internal circulation, further tracking back to the ultimate source of virtual water and embodied carbon emissions exports from the perspective of supply chain have not been identified. Therefore, the specific objectives of this study are: (1) to explore the production structure and detect the inter-sectoral flow among different sectors of water and energy resources using inter-sectoral linkage analysis; (2) to illustrate the import and export of virtual water and embodied carbon emissions in international trade; (3) to identify ultimate sources of virtual water and carbon emissions and depict key sectors in the whole economic system.

2. Materials and Methods

2.1. Data

Water consumption data of agriculture and industry were obtained from the China Water Resources Bulletin, which is released by the Ministry of Water Resources of the People’s Republic of China. Water consumption data of architecture and service industry was obtained from the Statistical Yearbook and Economic Yearbook. Standard coal quantity consumed by every sector was obtained from the China Energy Statistics Yearbook. Energy consumption was multiplied by standard coal consumed by every sector and carbon emission coefficient per ton of standard coal (a value of 0.7559 recommended by the IPCC). Input–output tables of eight years from 1997 to 2015 (1997, 2000, 2002, 2005, 2007, 2010, 2012, and 2015) were obtained from the China Statistical Yearbook. In order to cover all sectors in the Statistics Yearbook and Environmental Yearbook and ensure the reliability of the results, this paper merged sectors in the input–output tables into 14 sectors. The merging method and result is exhibited in Table 1.

2.2. Methodologies

2.2.1. Input–Output Analysis

Input–output table describes the flow of goods and services from producing sectors to consuming sectors. The input–output analysis based on the input-output table can depict virtual water and embodied carbon emissions flow within an economic system. The equation of the input-output model structure can be described as [32]:
j = 1 n x i j + y i =   x i    ( i = 1 , 2 , 3 n )  
where xij is the intermediate input of sector i to sector j, yi is the total output of sector i; xi represents the final demand of sector i, and n is sector number.
The direct consumption coefficient aij indicates the direct input from sector i needed to increase output per monetary unit in sector j. aij can be calculated by the following equation:
a i j = x i j / x j  
And the Equation (1) can be rearranged as:
j = 1 n a i j x j + y i = x i  
In matrix notation and for the economy as a whole, this becomes:
X = A X + Y = ( I A ) 1 Y = B Y = [ b i j ] Y   
where X is the total output matrix, A is the direct consumption coefficient matrix, (IA)−1 and B are both Leontief inverse matrices, B is also called as total consumption coefficient matrix, Y means final demand matrix and bij denotes the whole (indirect and direct) demand of the output of sector i for unit final products of sector j.

2.2.2. Environmental Input–Output Analysis

When the water (energy) consumption of every sector is added into a monetary input–output table, the environmental input–output table is constructed [33]. The table structure is shown in Table 2.
In accordance with the definition of the direct consumption coefficient aij, the direct water (energy) consumption coefficient is defined as:
q j   =   W j / X j  
where qj is the amount of water (energy) consumed directly by the sector j.
The Equation (5) can be rewritten as:
W j = q j   X j   = q j   ( I A ) 1 Y = [ δ i j ] Y  
where [δij] is the total (energy) consumption coefficient matrix.

2.2.3. Inter-Sectoral Linkage Analysis of Virtual Water and Embodied Carbon Emissions

Inter-sectoral linkage analysis, derived from input–output analysis, can distinguish the direct and indirect consumption of resources as well as the role of each sector in the economic system [34]. This method has been modified as the Hypothesis Extraction Method, which assumes that Bs is an industrial group consisting of one or several sectors in the economic system, Bs is an industrial group of the remaining sectors, and the economic system can be described as:
( x s x s ) = ( A s , s A s , s A s , s A s , s ) ( x s x s ) + ( y s y s ) =   ( Δ s , s Δ s , s Δ s , s Δ s , s ) ( y s y s )  
where X = ( x s x s ) is the total output vectors, A = ( A s , s A s , s A s , s A s , s ) is the direct consumption coefficient matrix, ( I A ) 1 = ( Δ s , s Δ s , s Δ s , s Δ s , s ) is the inverse matrix of A, and Y = ( y s y s ) is the final demand vector.
Linkage analysis includes four elements ([30]): the internal effect (IE), mixed effect (ME), net backward linkage (NBL), and net forward linkage (NFL). These parameters can be expressed as:
I E = q s ( I A ) 1 y s M E = q s ( Δ s , s ( I A ) 1 ) y s N B L = q s Δ s , s y s N F L = q s Δ s , s y s
The relationship of the parameters listed above is described in Figure 1.
As shown in Figure 1, regional economic systems are divided into sector groups Bs and B–s. IE is the water resources consumed or carbon emissions caused by sector Bs when the production and transaction of Bs products are completed without connection with B–s. ME concerns the water resources consumed or carbon emissions caused which are purchased by B–s from Bs as the intermediate input products; then these products return to Bs via trade. NFL is the net exported water resources or carbon emissions of Bs to B–s. NBL considers the net import of water resources or carbon emissions of Bs from B–s as the final demand.
Direct consumption (DC) refers to the direct utilization of resources to meet the final demand of one sector. The vertically integrated consumption (VIC) is the total consumption of resources to fulfill the final demand of one sector, including domestic consumption and the resource imports from outside.
The correlations of the above listed elements are as:
DC =   IE + ME + NFL VIC = IE + ME + NBL
If DC < VIC for one sector, it indicates that this sector obtains resources or emissions from other sectors, or this sector provides resources or emissions for other sectors.
Introduce NT to represent the input and output of the resources and emissions of sectors. If NT is less than 0, it indicates that Bs obtains resources and carbon emissions from B–s, and conversely Bs export resources and carbon emissions to B–s.
NT = NFL NBL  

2.2.4. Virtual Water or Carbon Emissions Trade between China and Other Regions

According to the description of linkage analysis, commodity production of one sector will obtain water (energy) resources from other sectors. NFLij represents the virtual water or carbon emissions transferred from sector i to sector j. Therefore, the virtual water or carbon emissions exported can be calculated in two methods: one is virtual water or carbon emissions export not considering the internal linkage of different sectors (Wnet); the other is virtual water or carbon emissions export considering the internal linkage of different sectors (Wlinkage).
Virtual water or embodied carbon emissions not considering the internal linkage of different sectors can be calculated by multiplying the total consumption coefficient matrix by the export of import matrix. The formula of the trade can be expressed [35]:
W n e t   j = W E j W M j =   q j E j q j M j  
where WEj is water or carbon emissions export of sector j, WMj is virtual water or carbon emissions import of sector j, Wnetj is net export of virtual water or carbon emissions of sector j, and Ej and Mj are output and input values in the column vectors of input–output table.
W l i n k a g e   i = i = 1 n N F L i j j = 1 n N F L i j W n e t   i  
Equations (11) and (12) suppose that the total consumption coefficients of imported and exported products are the same, and it is obviously different from the actual situation. However, it is reasonable if the environmental impact of the import can be considered as saving the country’s resource consumption and reducing its carbon emissions.

3. Results

3.1. Linkage Analysis

3.1.1. Linkage Analysis of Water Consumption

In the whole economic system, the VIC of water resources is combined with the final demand of sectors (same as DC). The average water consumption during 1997–2015 is 553.21 × 10⁹ m3 in China. Figure 2 shows the DC of S1 is 375.87 × 10⁹ m3, which accounts for 67.9% of annual water consumption. However, the VIC is 0.39 times of DC, which indicates that about 60% of the water consumption of S1 is transferred to other sectors. The DC of S13 is 79.15 × 10⁹ m3, shows that 14.3% water is transferred to other sectors. Sectors transferring water to other sectors also include S6, S7, S8 and S9.
The IE of S1 is 132.12 × 10⁹ m3, accounting for 91.0% of VIC, which describes that 91.0% of the water resources that consumed by S1 come from the internal exchange of products. The NFL of S1 is 220.71 × 10⁹ m3, accounting for 58.72% of DC, while the ratios of IE, and ME to DC are 35.1% and 2.3%. It indicates that large amounts of water are transferred to other sectors; therefore, whether the demand of water resources in other sectors can be satisfied depends largely on the virtual water output of S1. The NBL of S1 is 5.73 × 10⁹ m3 which represents 3.95% of VIC; The NT of S1 is 220.71 × 10⁹ m3. The data above illustrate that S1 exports large amounts of water to other sectors but imports little from outside and has high independence. The water consumption characteristic of S13 is similar to S1.
The ratios of IE to VIC of S6, S7, S8, S9 and S2 are 0.28, 0.16, 0.15, 0.23 and 0.12, respectively, which describes that 28%, 16%, 15%, 23% and 12% of the water resources that these sectors consume come from the product internal exchange. The ratios of NFL to NBL of S6, S7, S8, S9 and S2 are 1.16, 1.91, 1.96, 2.05 and 1.38, respectively, which demonstrates that although these five sectors totally exported water, they also imported a great deal of water from other sectors.
VIC is larger than DC for S3, S4, S5, S10, S11, S12 and S14, which indicates that these seven sectors need to obtain water from other sectors; the import percent is more than 90% for S3, S4, S5, S10, S11, and S12.
DC of S14 is 47.49 × 10⁹ m3 which makes up 8.58% of the annual water consumption in China. NBL of S14 is 137.53 × 10⁹ m3, amounting to 78.0% of VIC which indicates that 78.0% of the water resources consumed by S14 are obtained from other sectors. ME of S14 is ranks the second among the 14 sectors, accounting for 10.04% and, 2.03% of DC and VIC. It demonstrates that large amounts of virtual water embodied in products are sold to other sectors as intermediate processing, and then S14 repurchases products from other sectors which lead to the return of virtual water.
Overall, NT of S3, S4, S5, S10, S11, S12 and S14 are less than 0, which indicates that these sectors obtain water resources from other sectors. NT of all of other sectors are greater than 0.

3.1.2. Linkage Analysis of Carbon Emissions

Figure 3 shows the internal linkage of different sectors for carbon emissions in China during 1997–2015. It can be seen that DC is larger than VIC in S2, S7, S8, S9, S12 and S13, and it indicates that these sectors output carbon emissions to other sectors. DC is smaller than VIC in S3, S4, S5, S10, S11, and S14 which indicates that these sectors import carbon emissions from other sectors. There is little difference between DC and VIC in S1 and S6.
The carbon emissions characteristics of S2, S7, S8, S9, S12 and S13 are similar. The ratios of IE to VIC of these six sectors are about 0.5, which indicates that approximately 50% of the energy these sectors consumed comes from the internal exchange of products. The ratio of NFL to DC is about 0.9, which illustrates that about 90% of the energy consumption of these sectors is transferred into other sectors. NFL is more than 10 times NBL in S7, S8, S9 and S13 sectors, about five times NBL in S2 and S12, which illustrates that these sectors output more energy than that they obtain from other sectors.
IE of S3, S4, and S5 account for more than 50% of DC and are less than 30% of VIC, which indicates that the energy consumption of these sectors has not only certain independence but also certain dependence on other sectors. The NBL of S10, S11, and S14 are 9.44, 5.39 and 2.22 times DC, and 93.83%, 89.47%, and 73.19% of VIC, which describes that these sectors largely rely on energy from other sectors to meet their final demand. The IE and ME of S14 are the largest of all sectors, which shows that S14 has a noticeable reliance on internal energy circulation, and it has the largest amount of embodied carbon emissions exchange with other sectors to satisfy its own final demand.
The DC of S1 and S6 is almost the same as their VIC, and NBL are 0.72 and 0.62 times DC which account for 68.36% and 72.42% of their VIC. NFL of S1 and S6 are 0.68, 0.72 times their VIC. This indicates that these two sectors not only export a certain amount of energy to other sectors but also import nearly the same amount of energy from outside to meet their final demands.
The NT of S2, S6, S7, S8, S9, S12 and S13 are less than 0, which indicates that these sectors obtain carbon emissions from other sectors inside China. The NT of the other sectors are greater than 0.

3.2. Trade between China and Other Regions

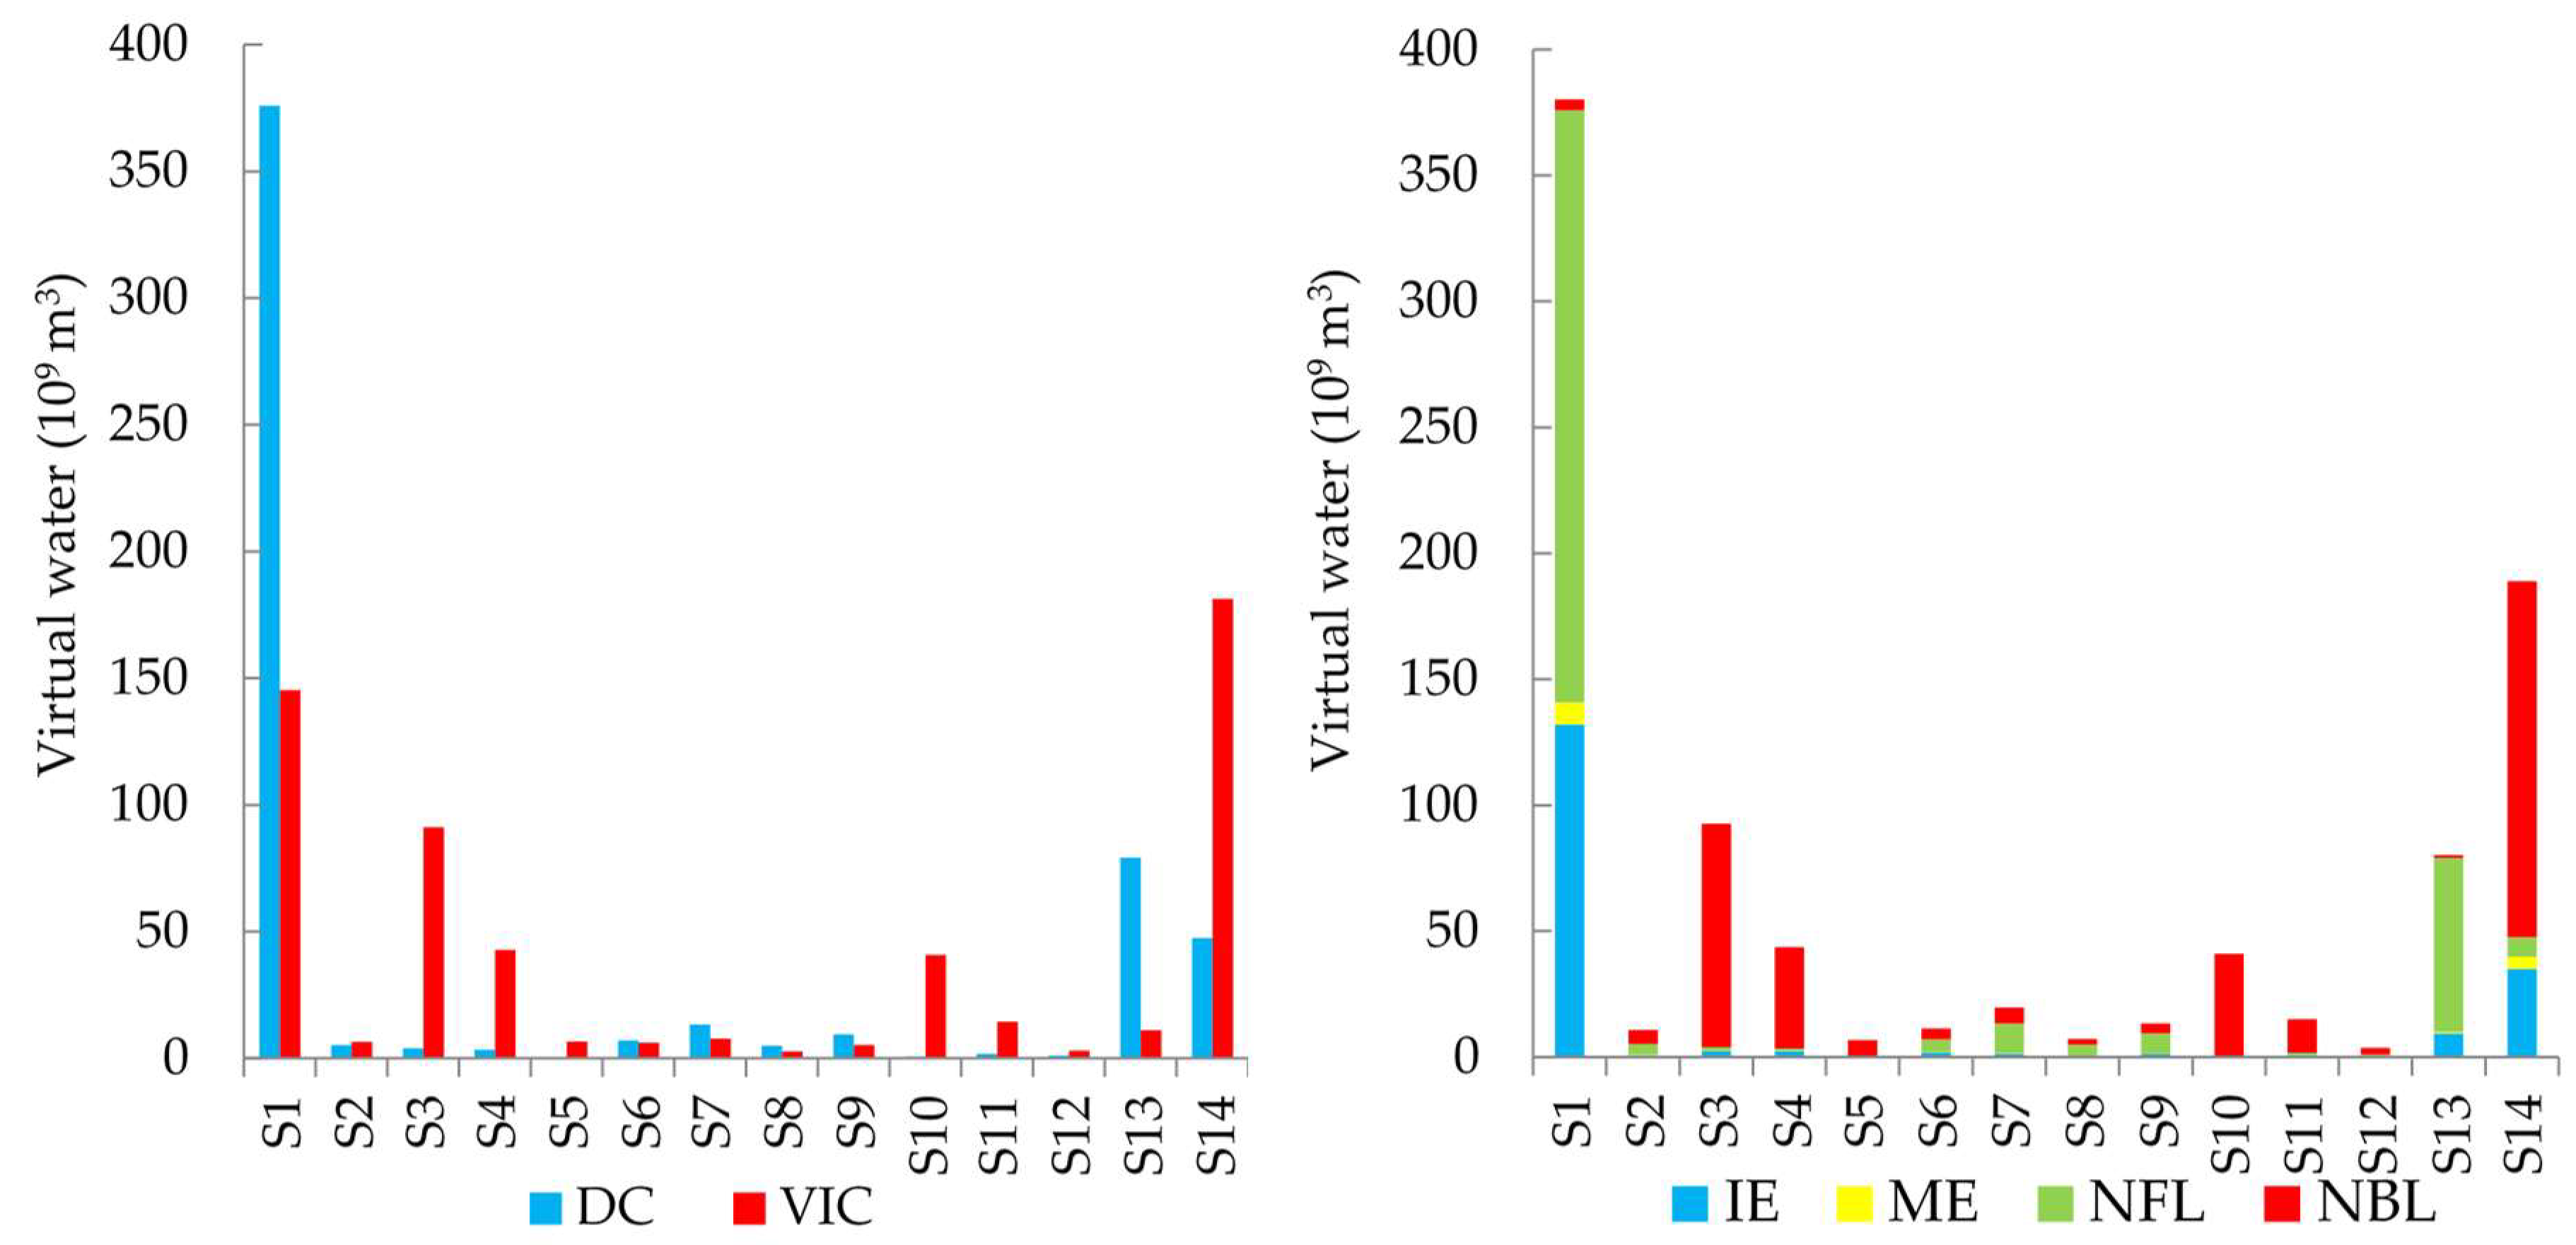
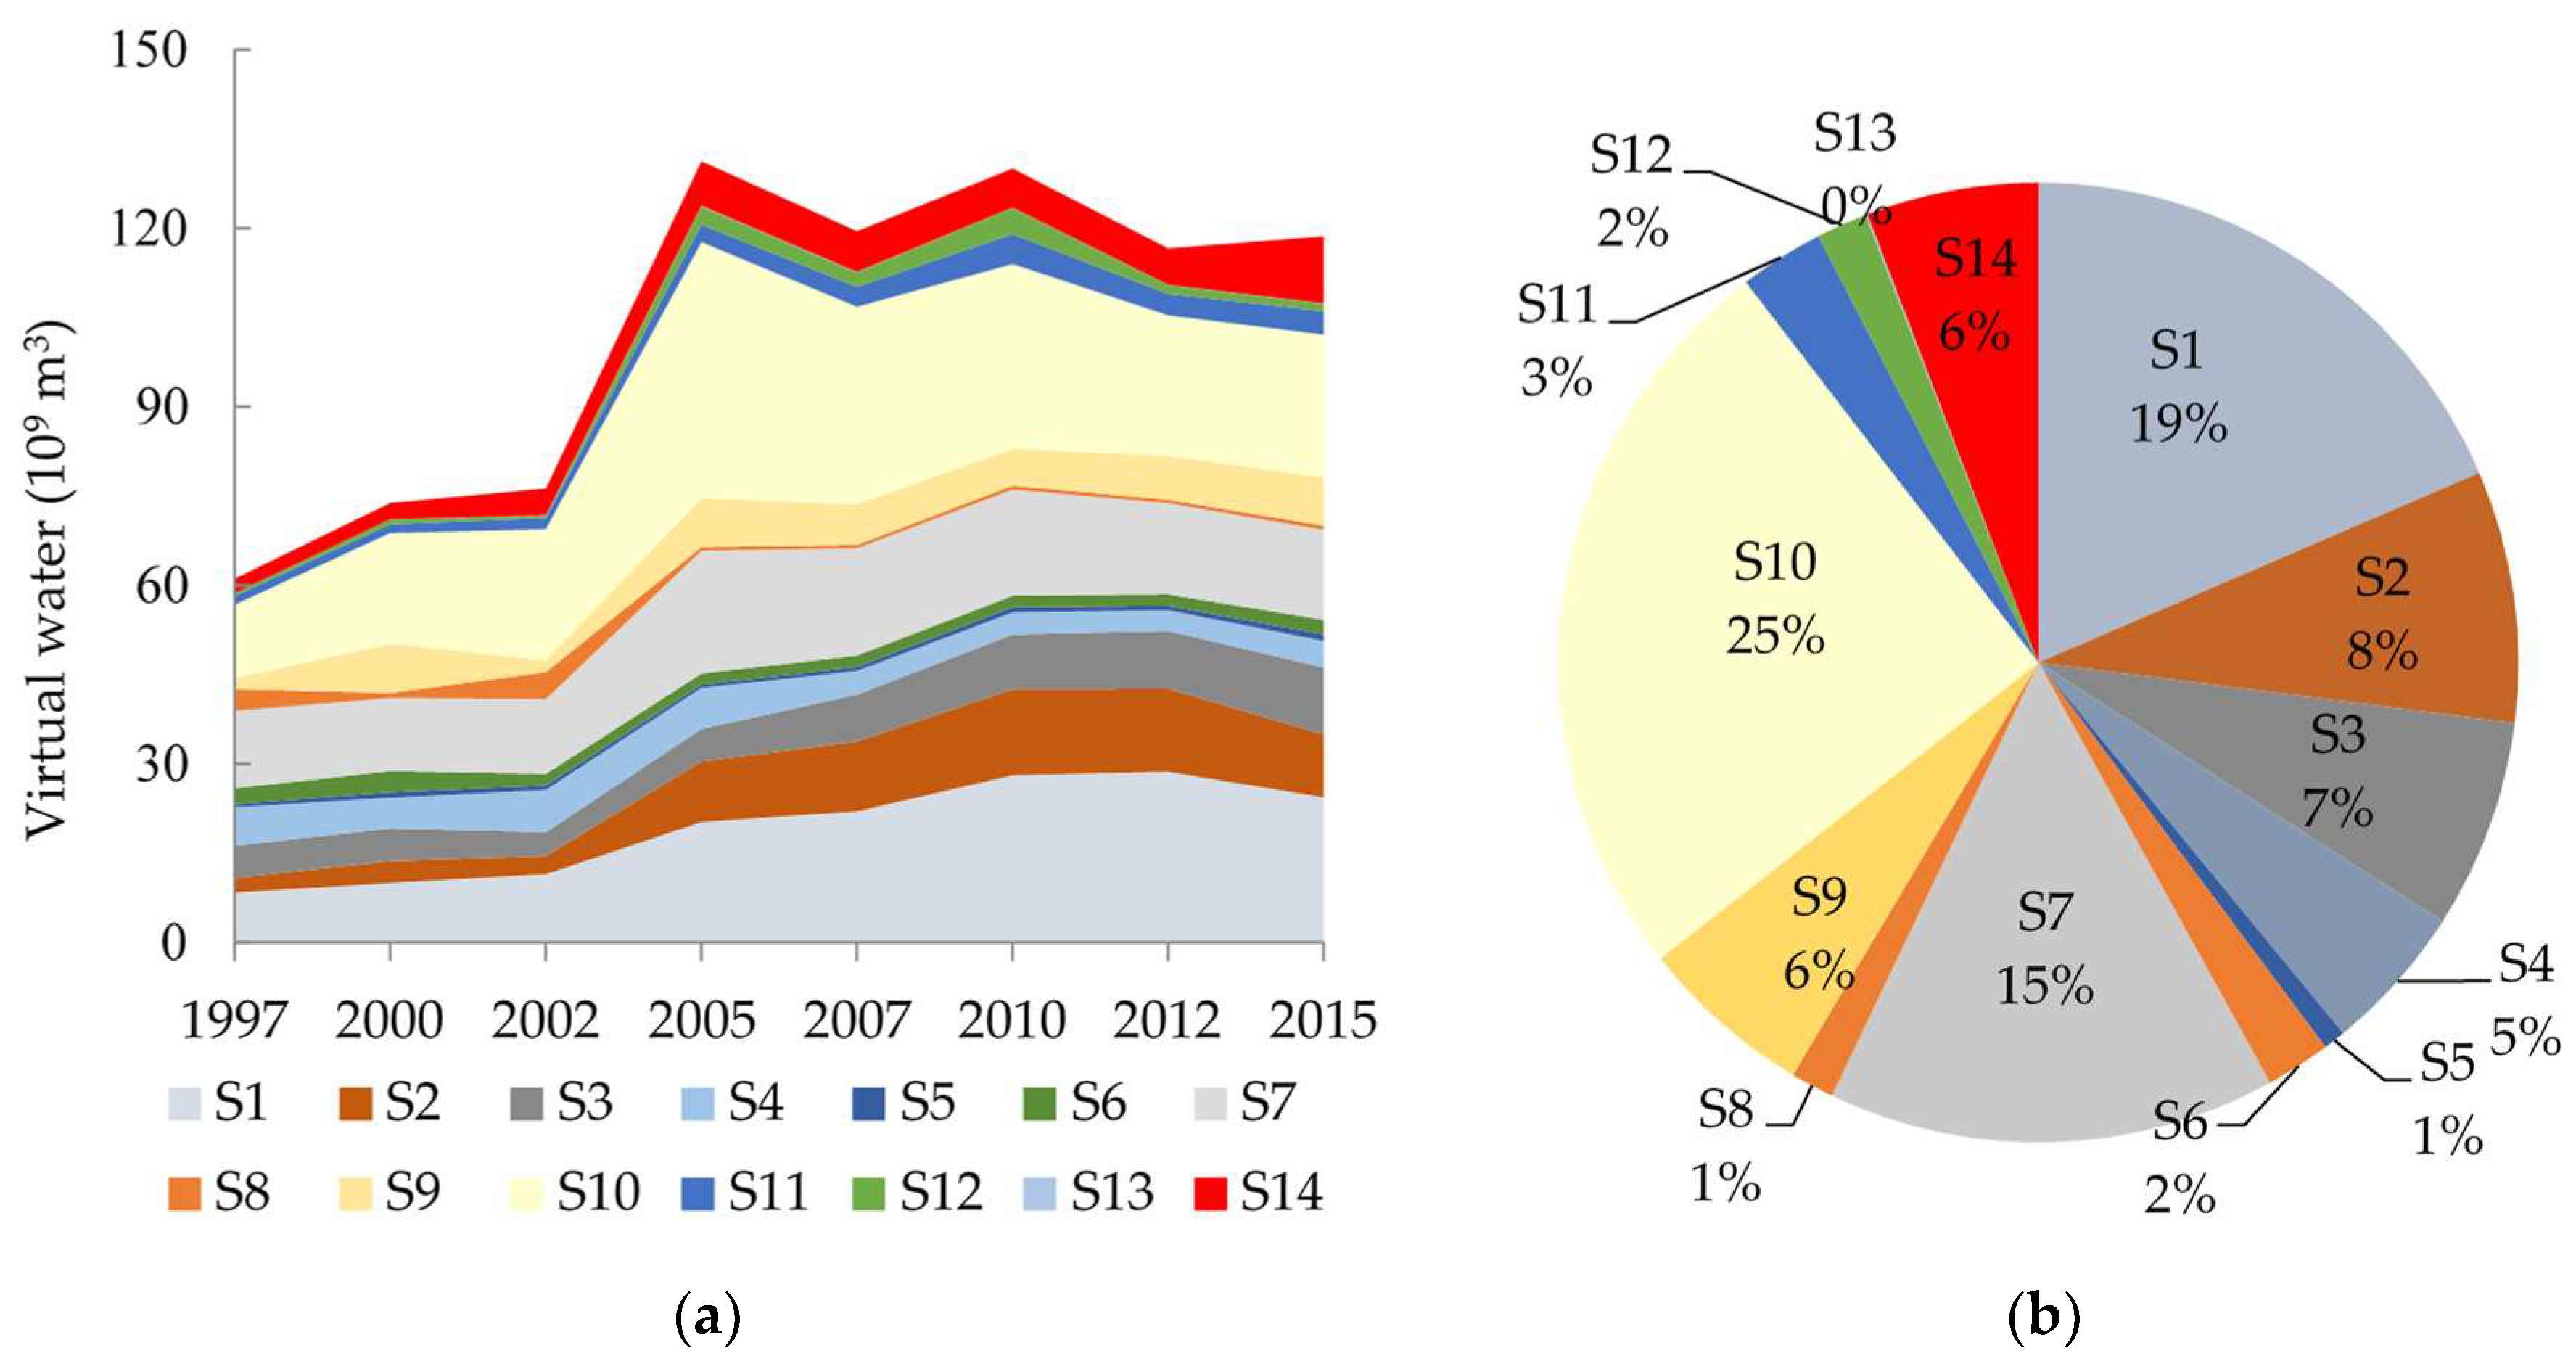
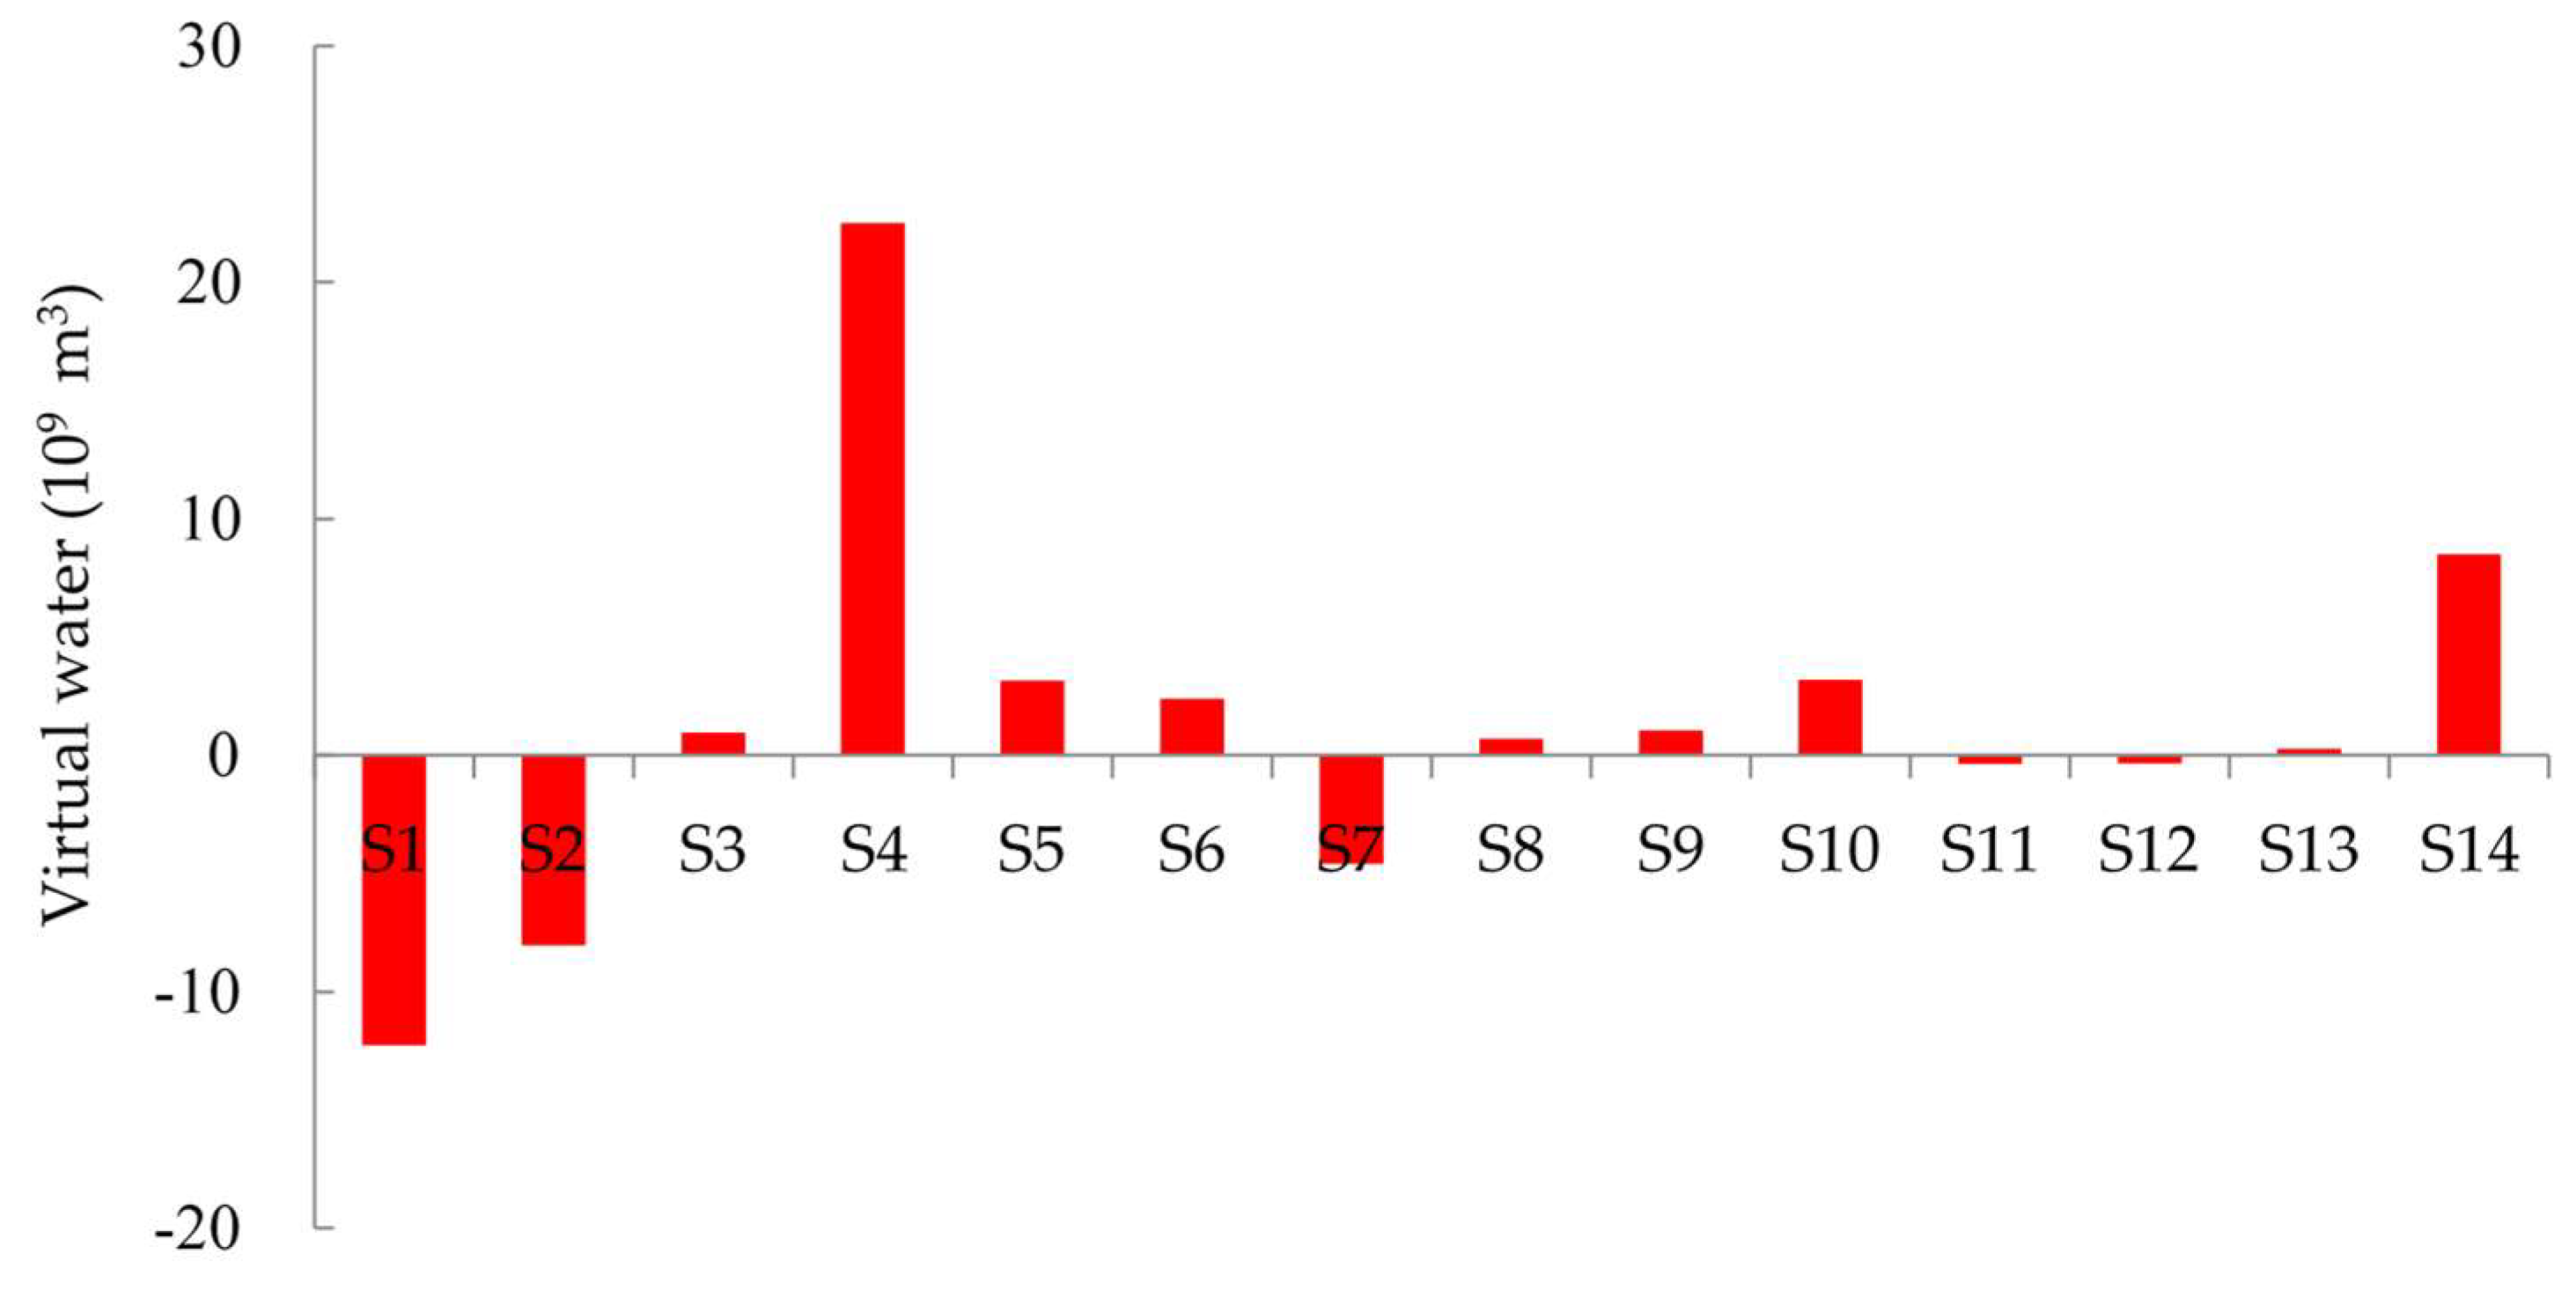
3.2.1. Virtual Water Trade

(1) The variation of China’s virtual water import and export
Since China joined the WTO in 2001, there has been substantial growth in both its export and import. The virtual water trade (not considering internal linkage) is illustrated in Figure 4. During 1997–2015, the export and import quota increased from 182.7 × 10⁹ and 142.36 × 10⁹ dollars to 2342.3 × 109 and 2298.02 × 109 dollars, representing an enhancement of 12.82 and 16.14 times, respectively. Due to the rapid increase of China’s international trade, virtual water export peaked at 156.08 × 10⁹ m3 in 2007, up from 83.22 × 10⁹ m3 in 1997, representing an increase of 87.55%; virtual water import peaked at 131.26 × 10⁹ m3 in 2005, up from 61.2 × 10⁹ m3 in 1997, representing an increase of 130.26% (Figure 4a). China was a net exporter of virtual water from 1997 to 2015, and the total amount of virtual water exported was 137.15 × 10⁹ m3, which exacerbated its water scarcity. Fortunately, the net export of virtual water significantly declined after 2007.
According to the virtual water trade calculation formula, the amount of virtual water import and export are determined by two factors: the trade volume and the total water consumption coefficients. The import, export and net export volume of commodities show a rapid rise during 1997–2015, while the direct water consumption coefficients decrease rapidly from 704.8 m3/104 CNY to 89.03 m3/104 CNY (Figure 4b). Virtual water import, export and net export show a slow increase during 1997–2007 and a total decrease in 2007–2015, which is attributing to the enhancement of water utilization efficiency.
(2) Virtual water trade from perspective of sectors
As illustrated in Figure 5, S10, S4, S14, S7, and S3 are main virtual water export sectors in China. Figure 5a shows that the average virtual water exported by the five sectors was 29.19 × 10⁹ m3, 27.66 × 10⁹ m3, 14.49 × 10⁹ m3, 11.03 × 10⁹ m3 and 8.25 × 10⁹ m3, respectively, and the export proportion sums up to 75.2% (Figure 5b). The export proportions sum of S4 and S10 amount to 47.2%, which is almost half of the total export. Other than S14, the five sectors listed all belong to manufacturing industries, and it indicates that manufacturing industries are the major pulling force on virtual water exports in China. S1 plays an insignificant role in China’s virtual water export. On the one hand, China’s government emphasized the development of manufacturing sectors since the reform and open policy, and China has become the number one manufacturing country in the world; on the other hand, China has the largest population in the world and the limited cultivated land also restricts the export of agricultural products.
Figure 6 demonstrates the virtual water imported by every sector. The average volume of virtual water imported in S10, S1, S7 and S2 is 25.99 × 10⁹ m3, 19.16 × 10⁹ m3, 15.61 × 10⁹ m3, and 8.77 × 10⁹ m3 (Figure 6a), and the total import of these four sectors represents 67.23% of the whole virtual water import in China during 1997–2015 (Figure 6b). Virtual water imports in S1 and S2 show significant increases, while import in S10 and S7 show a significantly declining trend. It can be analyzed that China has optimized its import structure, that is, the proportion of the primary products ascending and that of the industrial products declined. This indicates China has begun to attach importance to the protection of resource-intensive products and to strengthen its import.
Figure 7 shows that S1, S2, S7, S11, and S12 are net importing sectors of virtual water; the import sum of S1, S2 and S7 is 20.30 × 10⁹ m3, which accounts for 79.33% of the whole net import; S3, S4, S5, S6, S8, S9, S10, S13, and S14 are net exporters of virtual water; the export sum of S4 and S14 is 31.0 × 10⁹ m3, which accounts for 72.55% of the whole net export. Overall, the main net import sectors are S1, S2, and S7, while the main net export sectors are S14, and especially S4, whose net export accounted for 52.68% of the whole net export of China. S1 is the most water-consuming sector in China at present; the net import of virtual water S1 has saved its water resources to some degree.

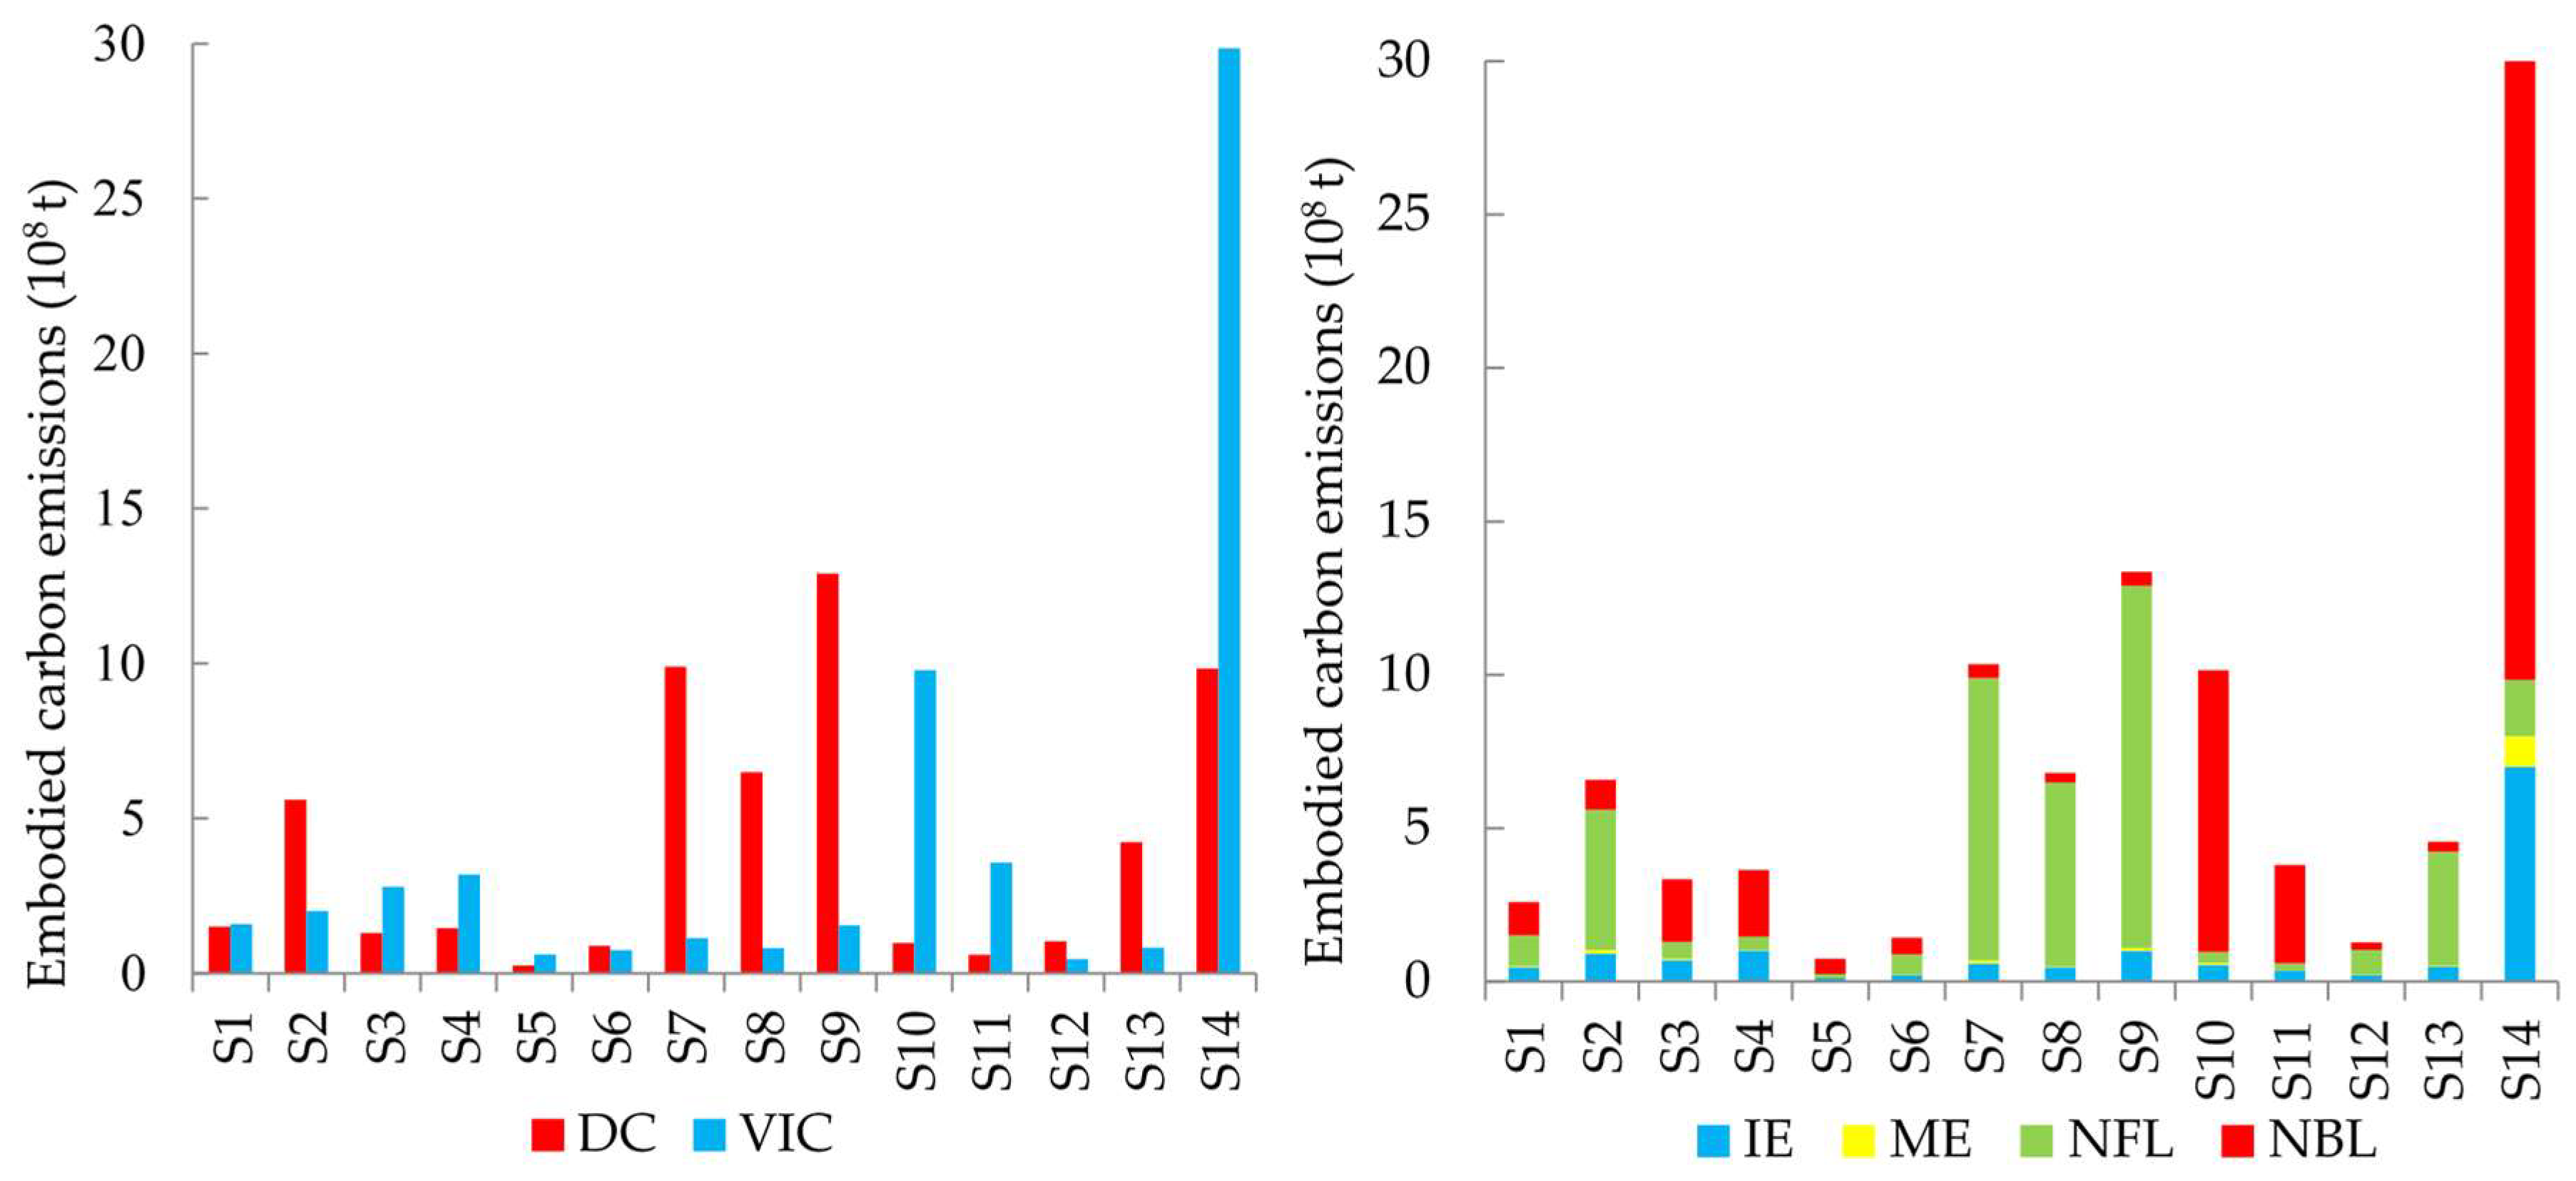
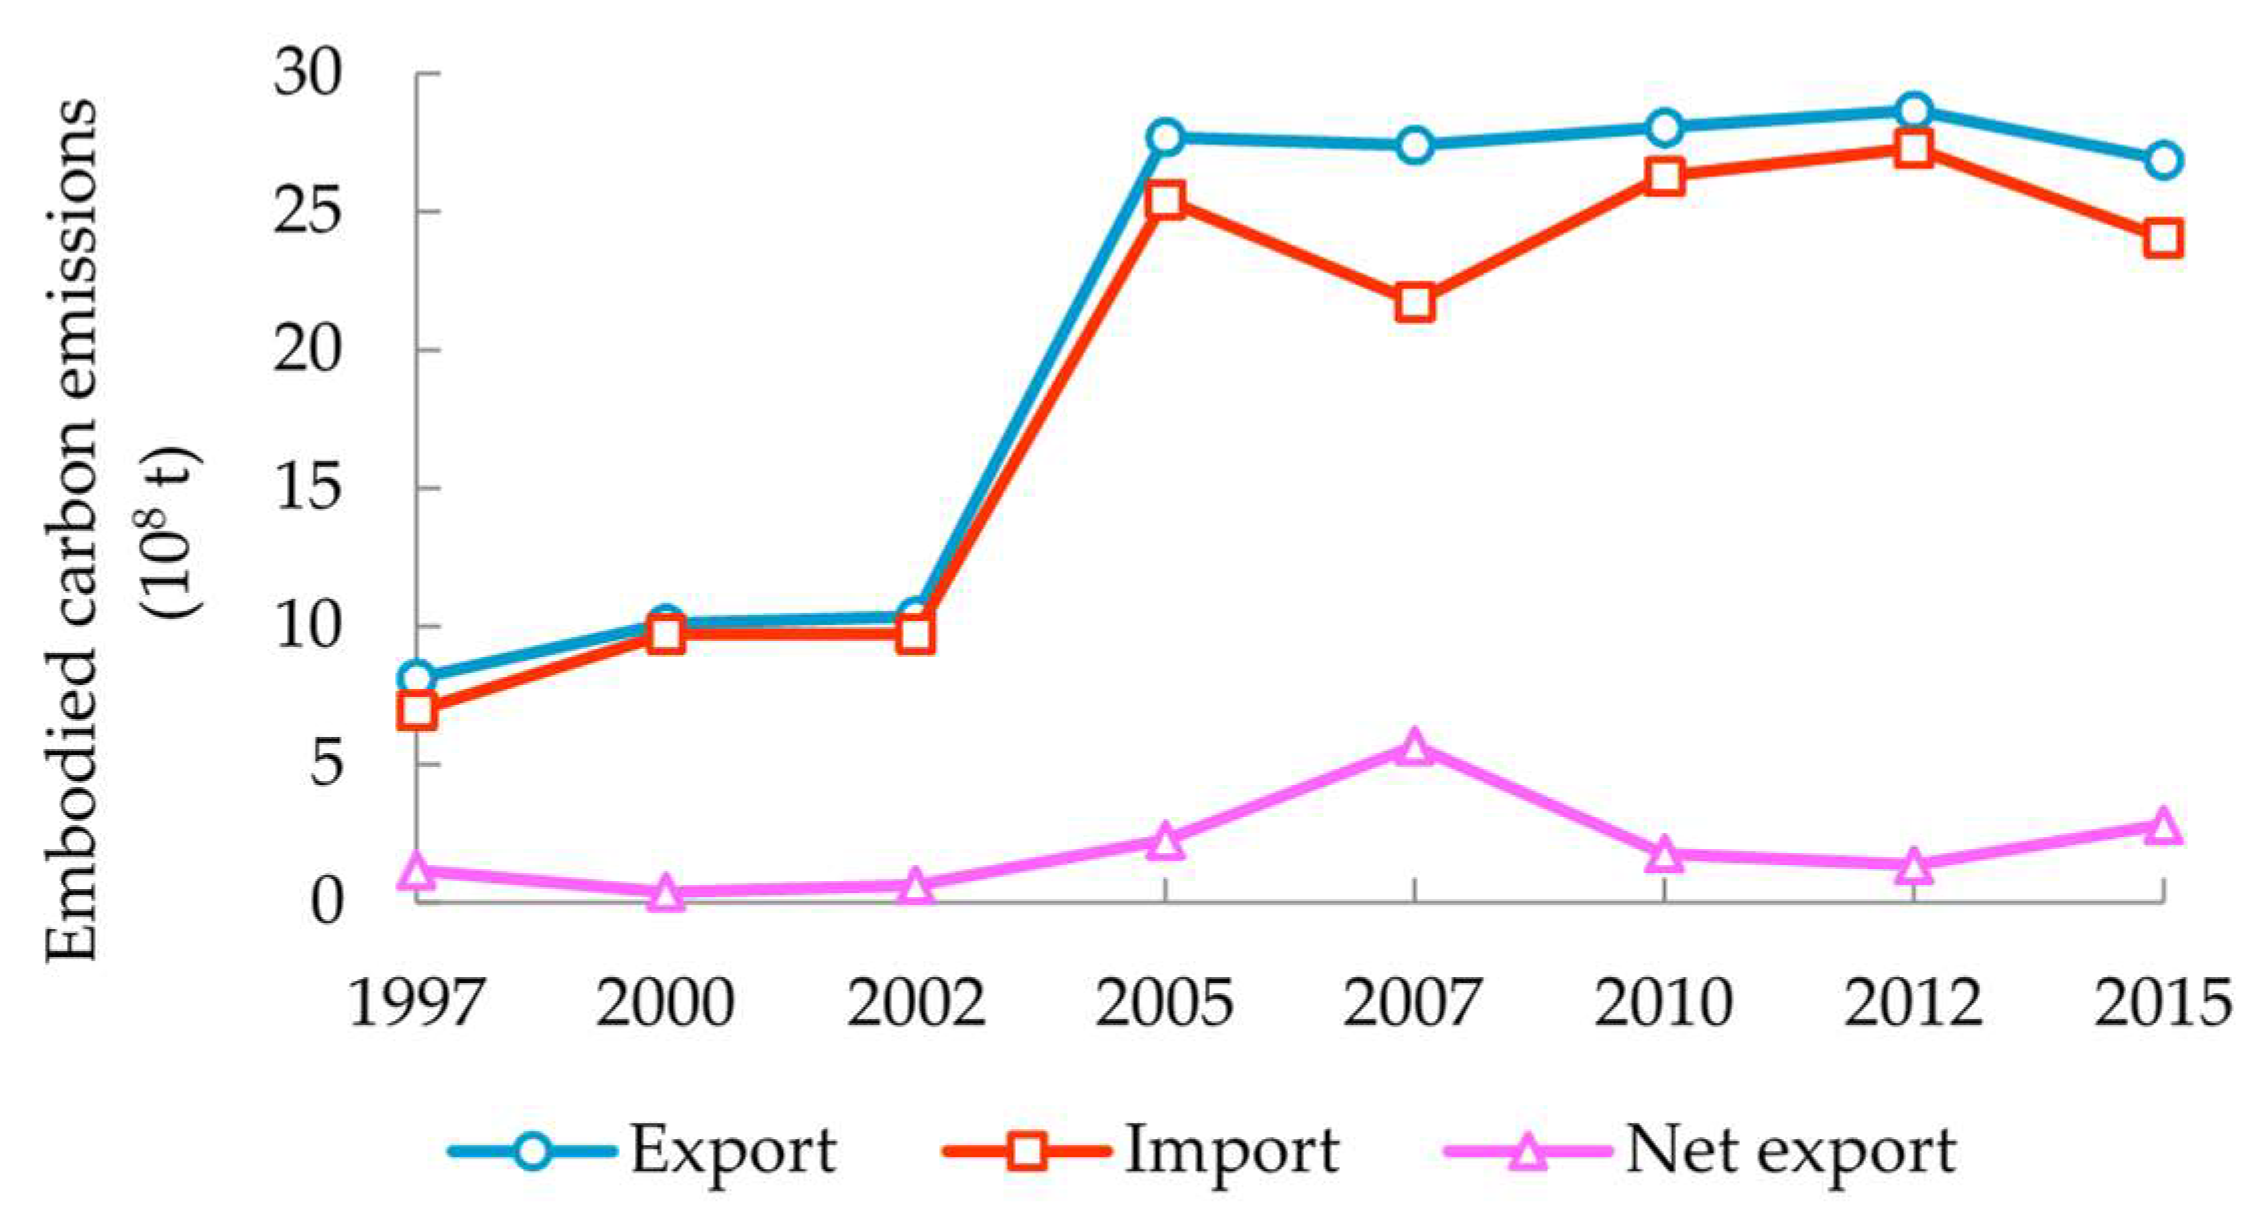
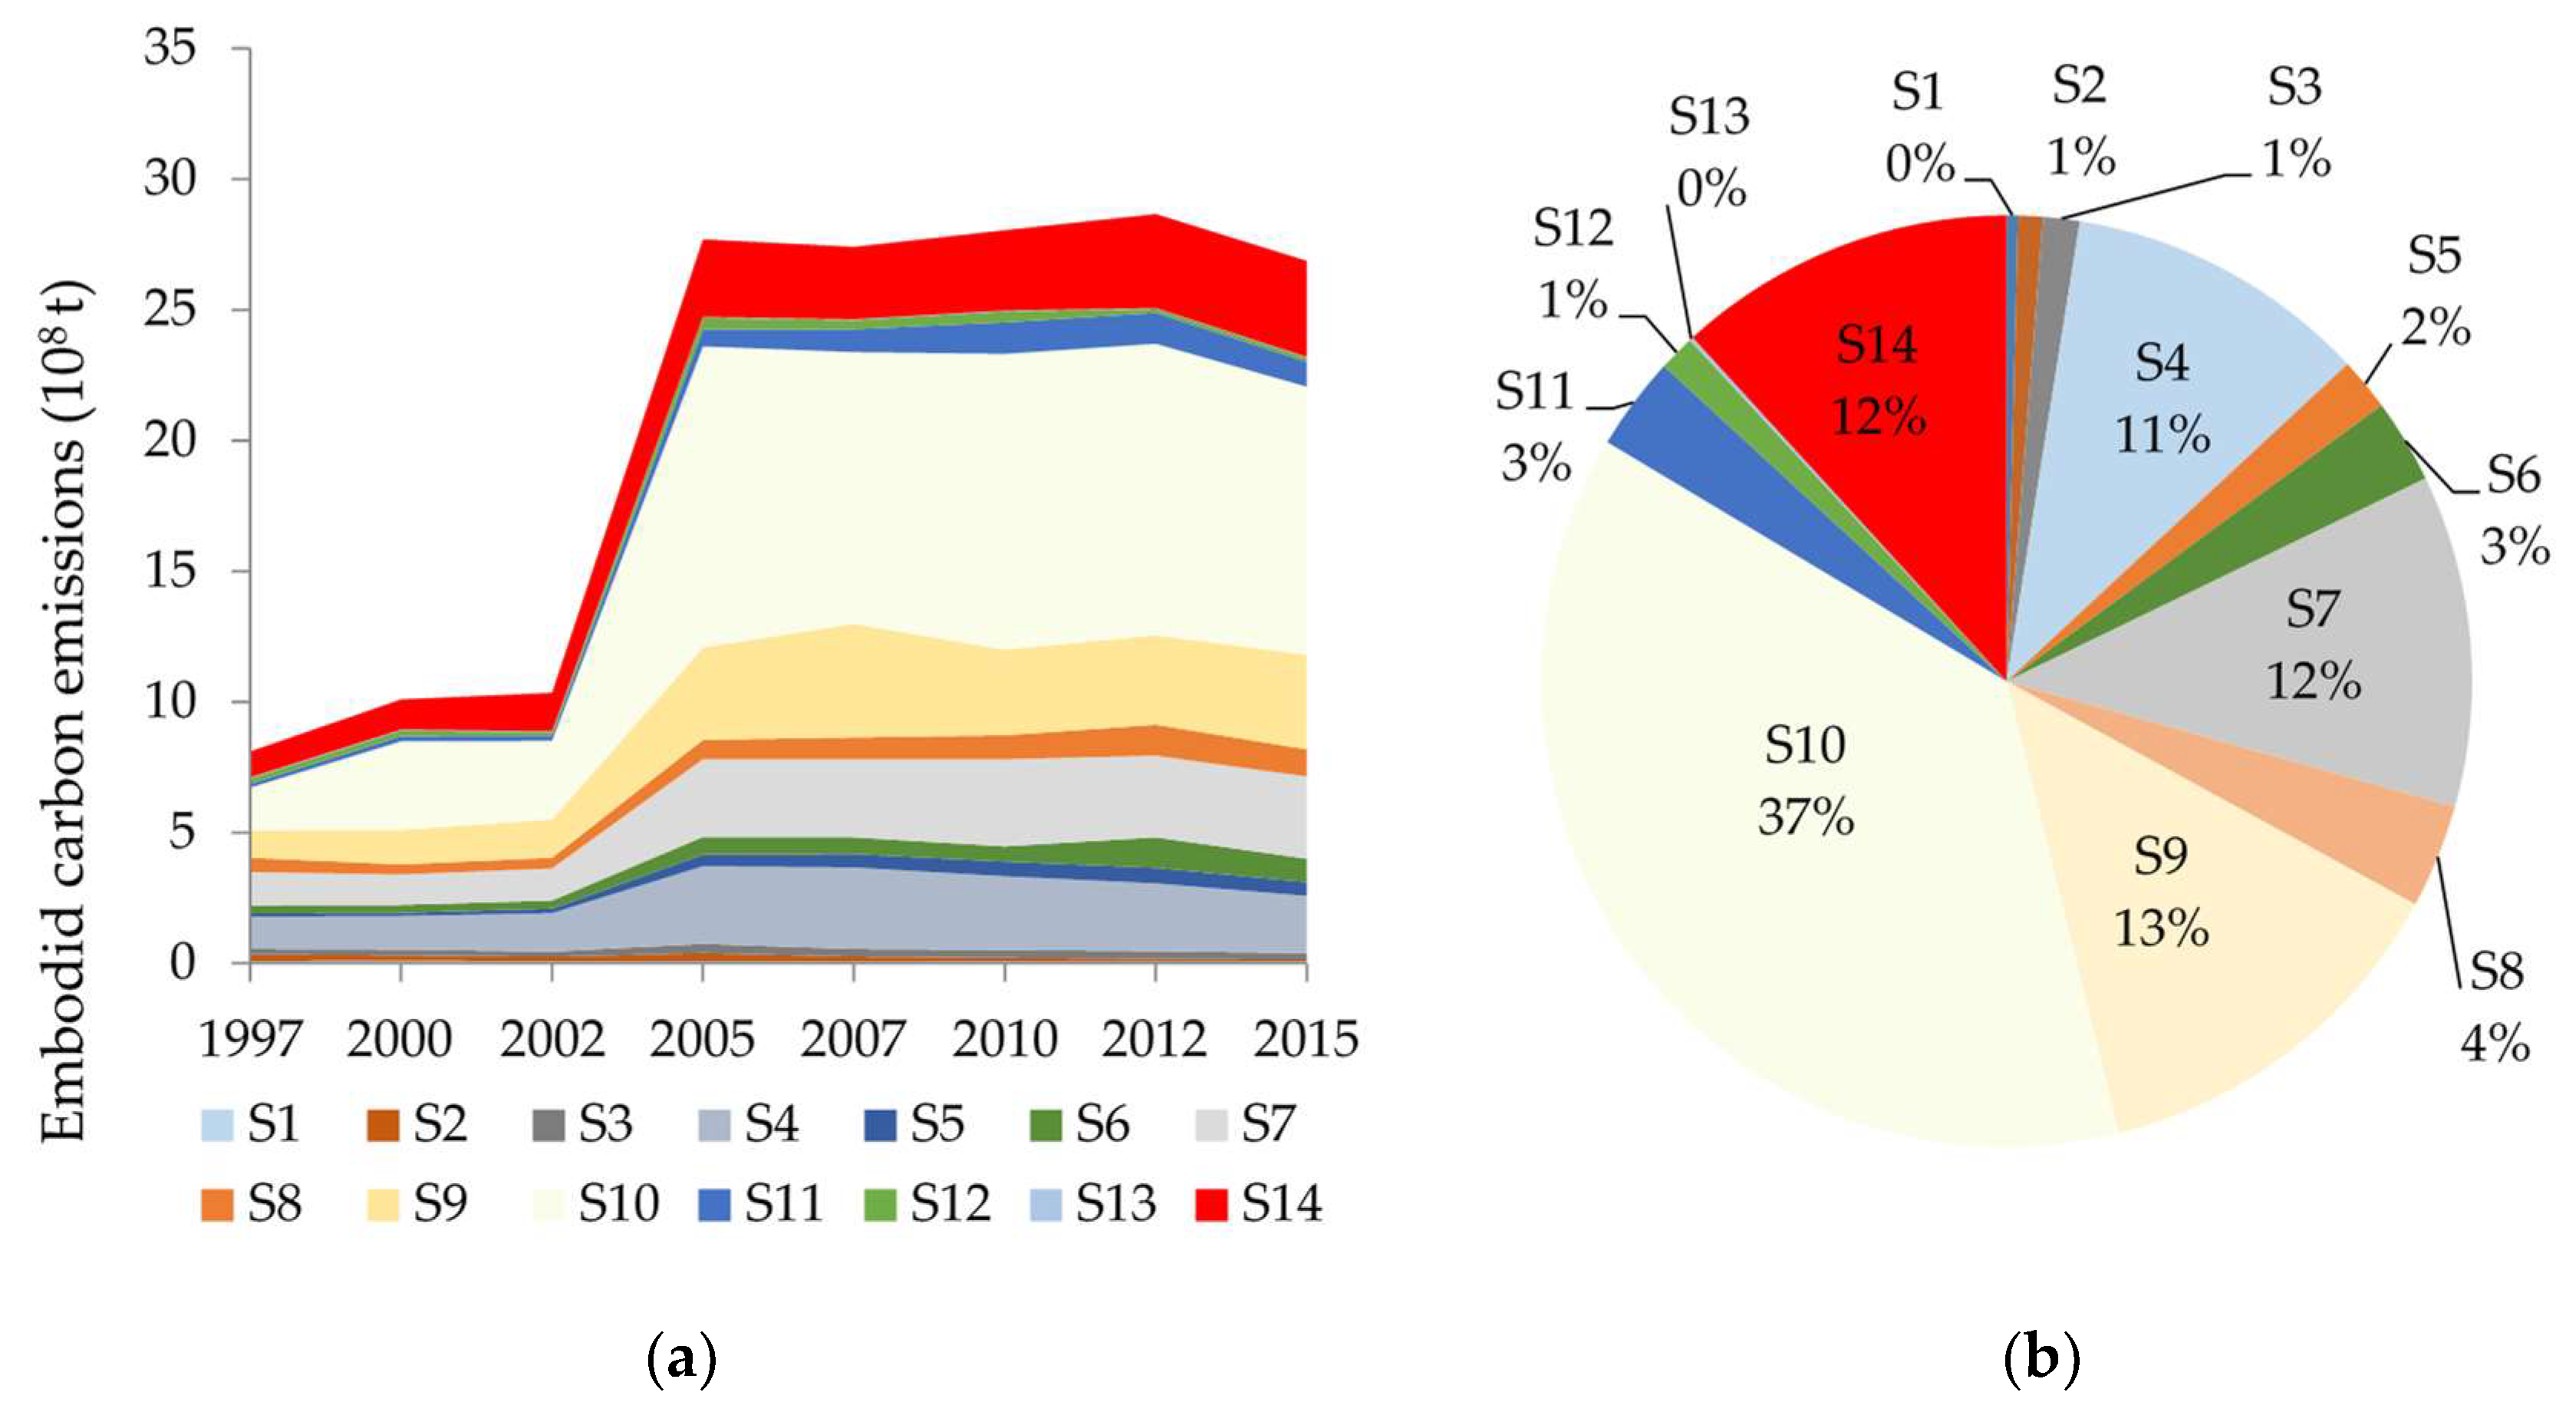
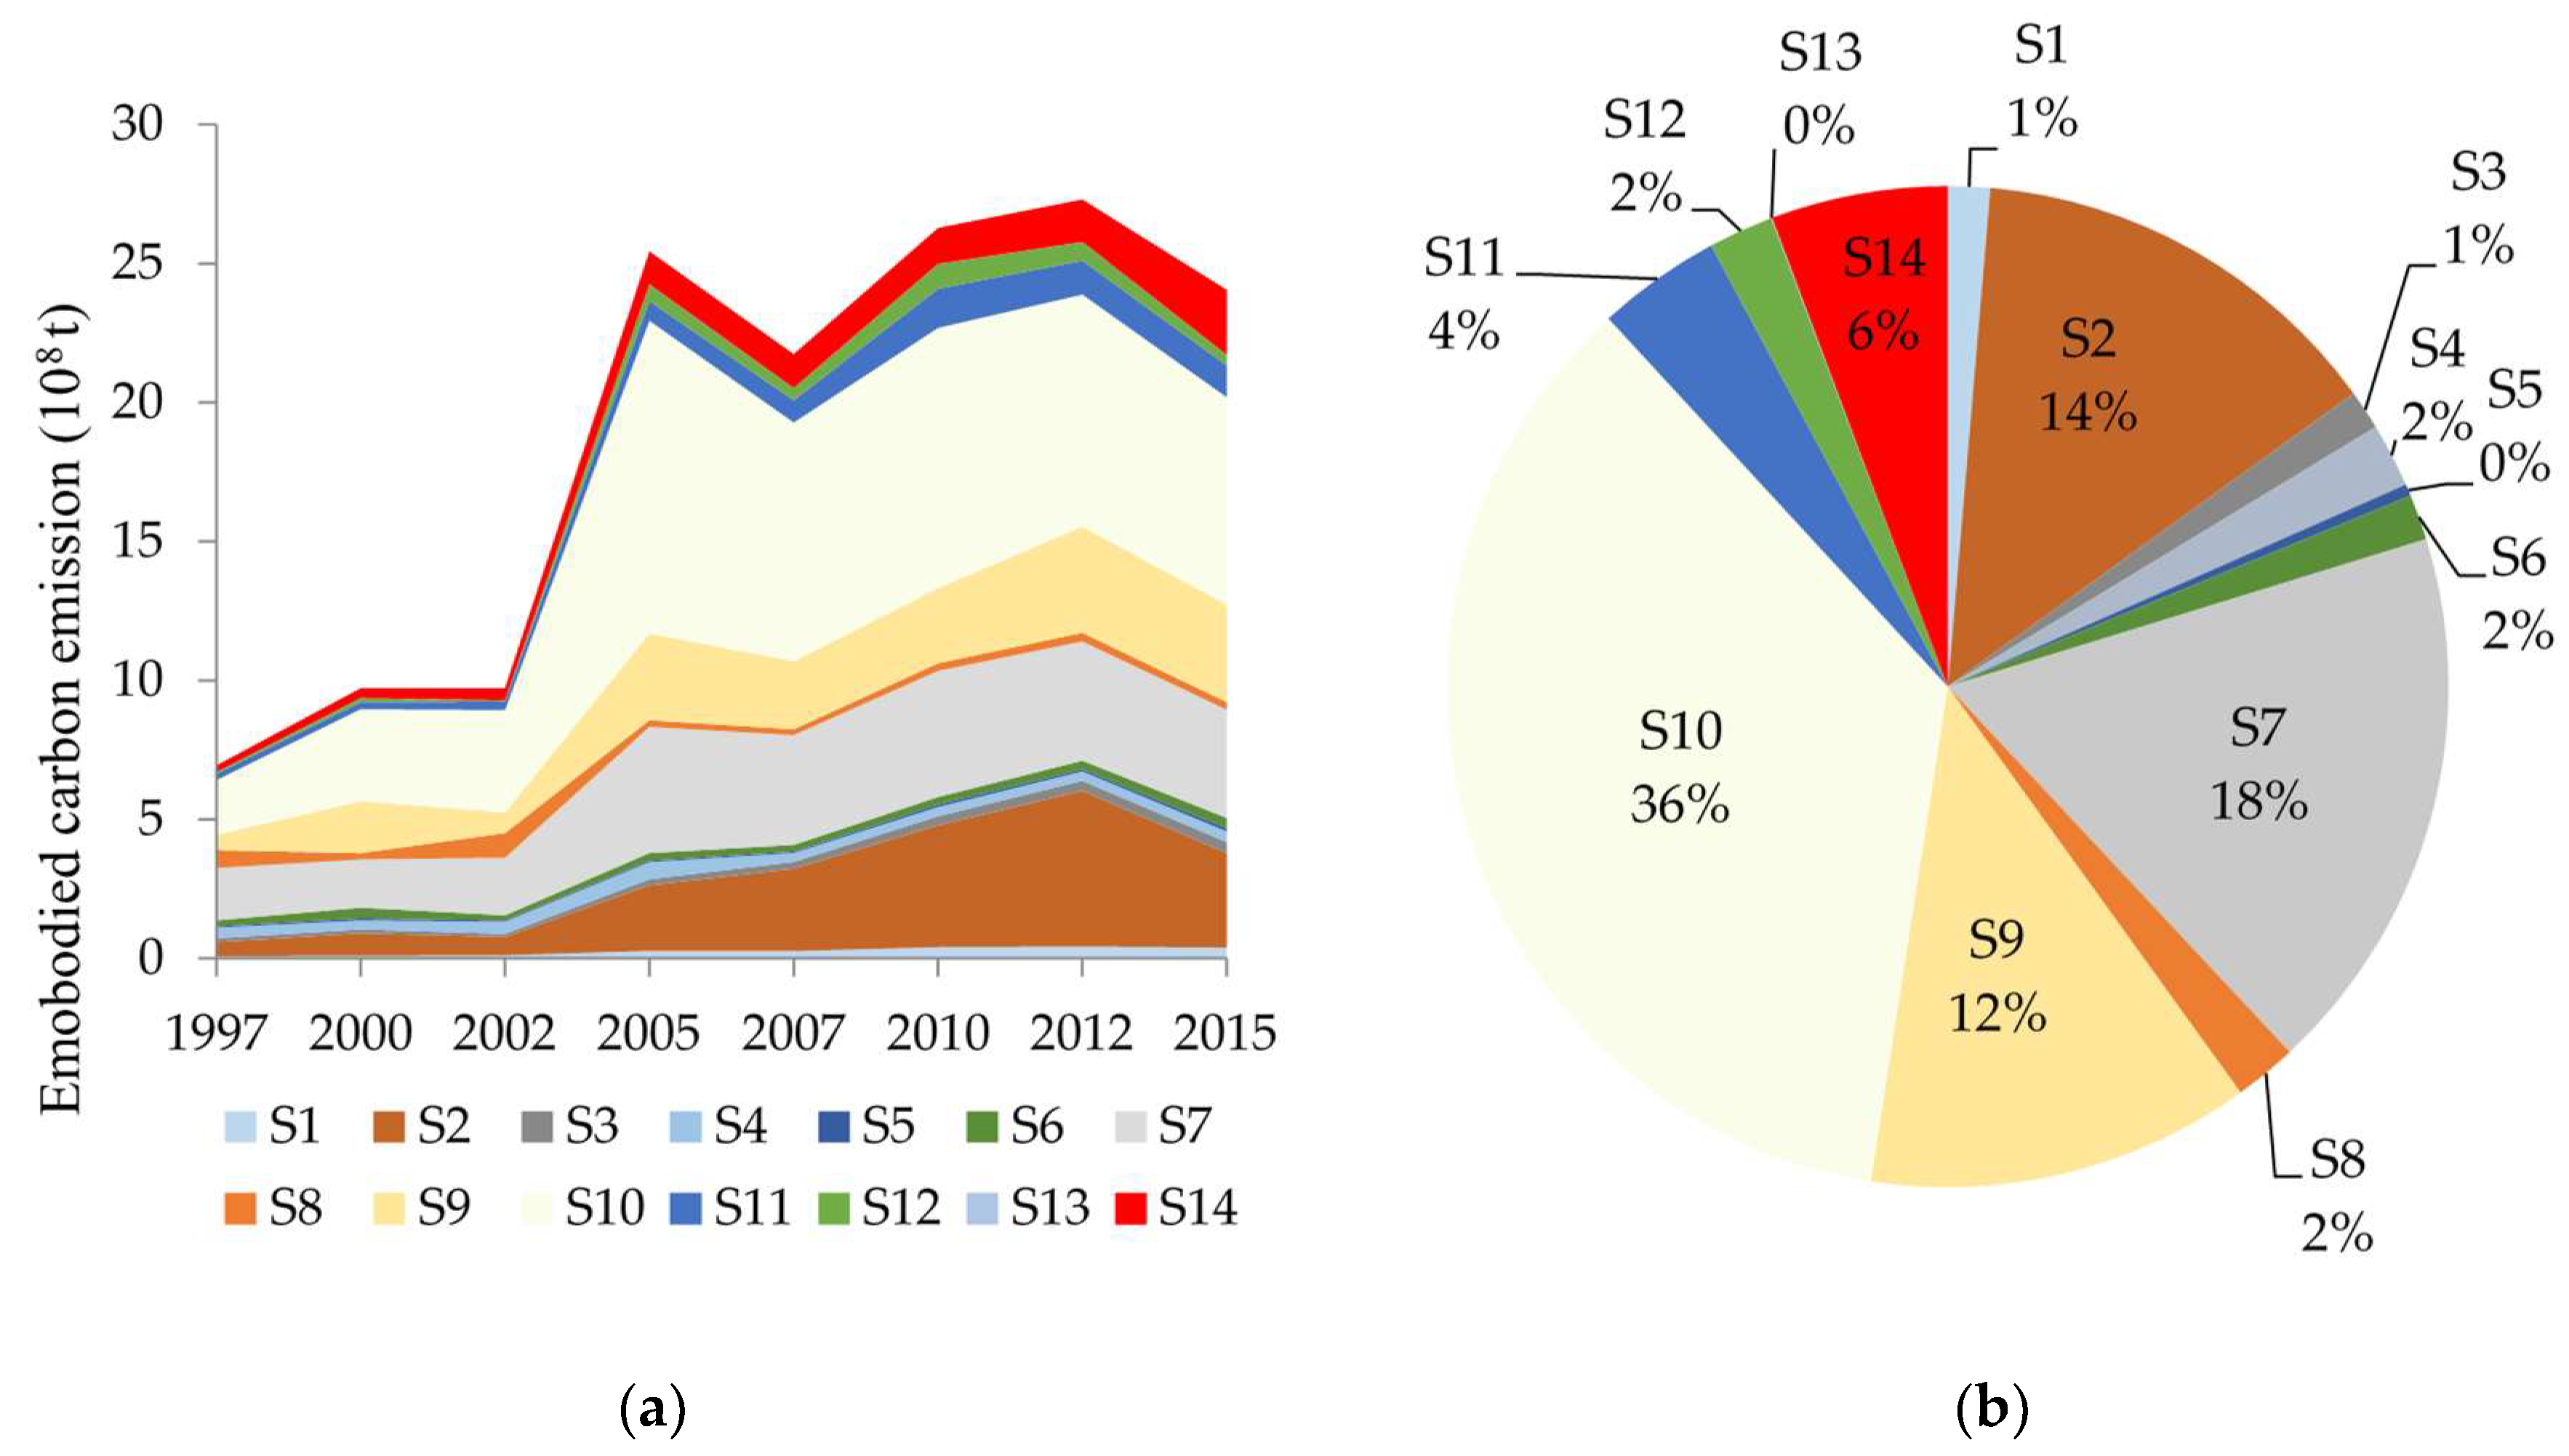
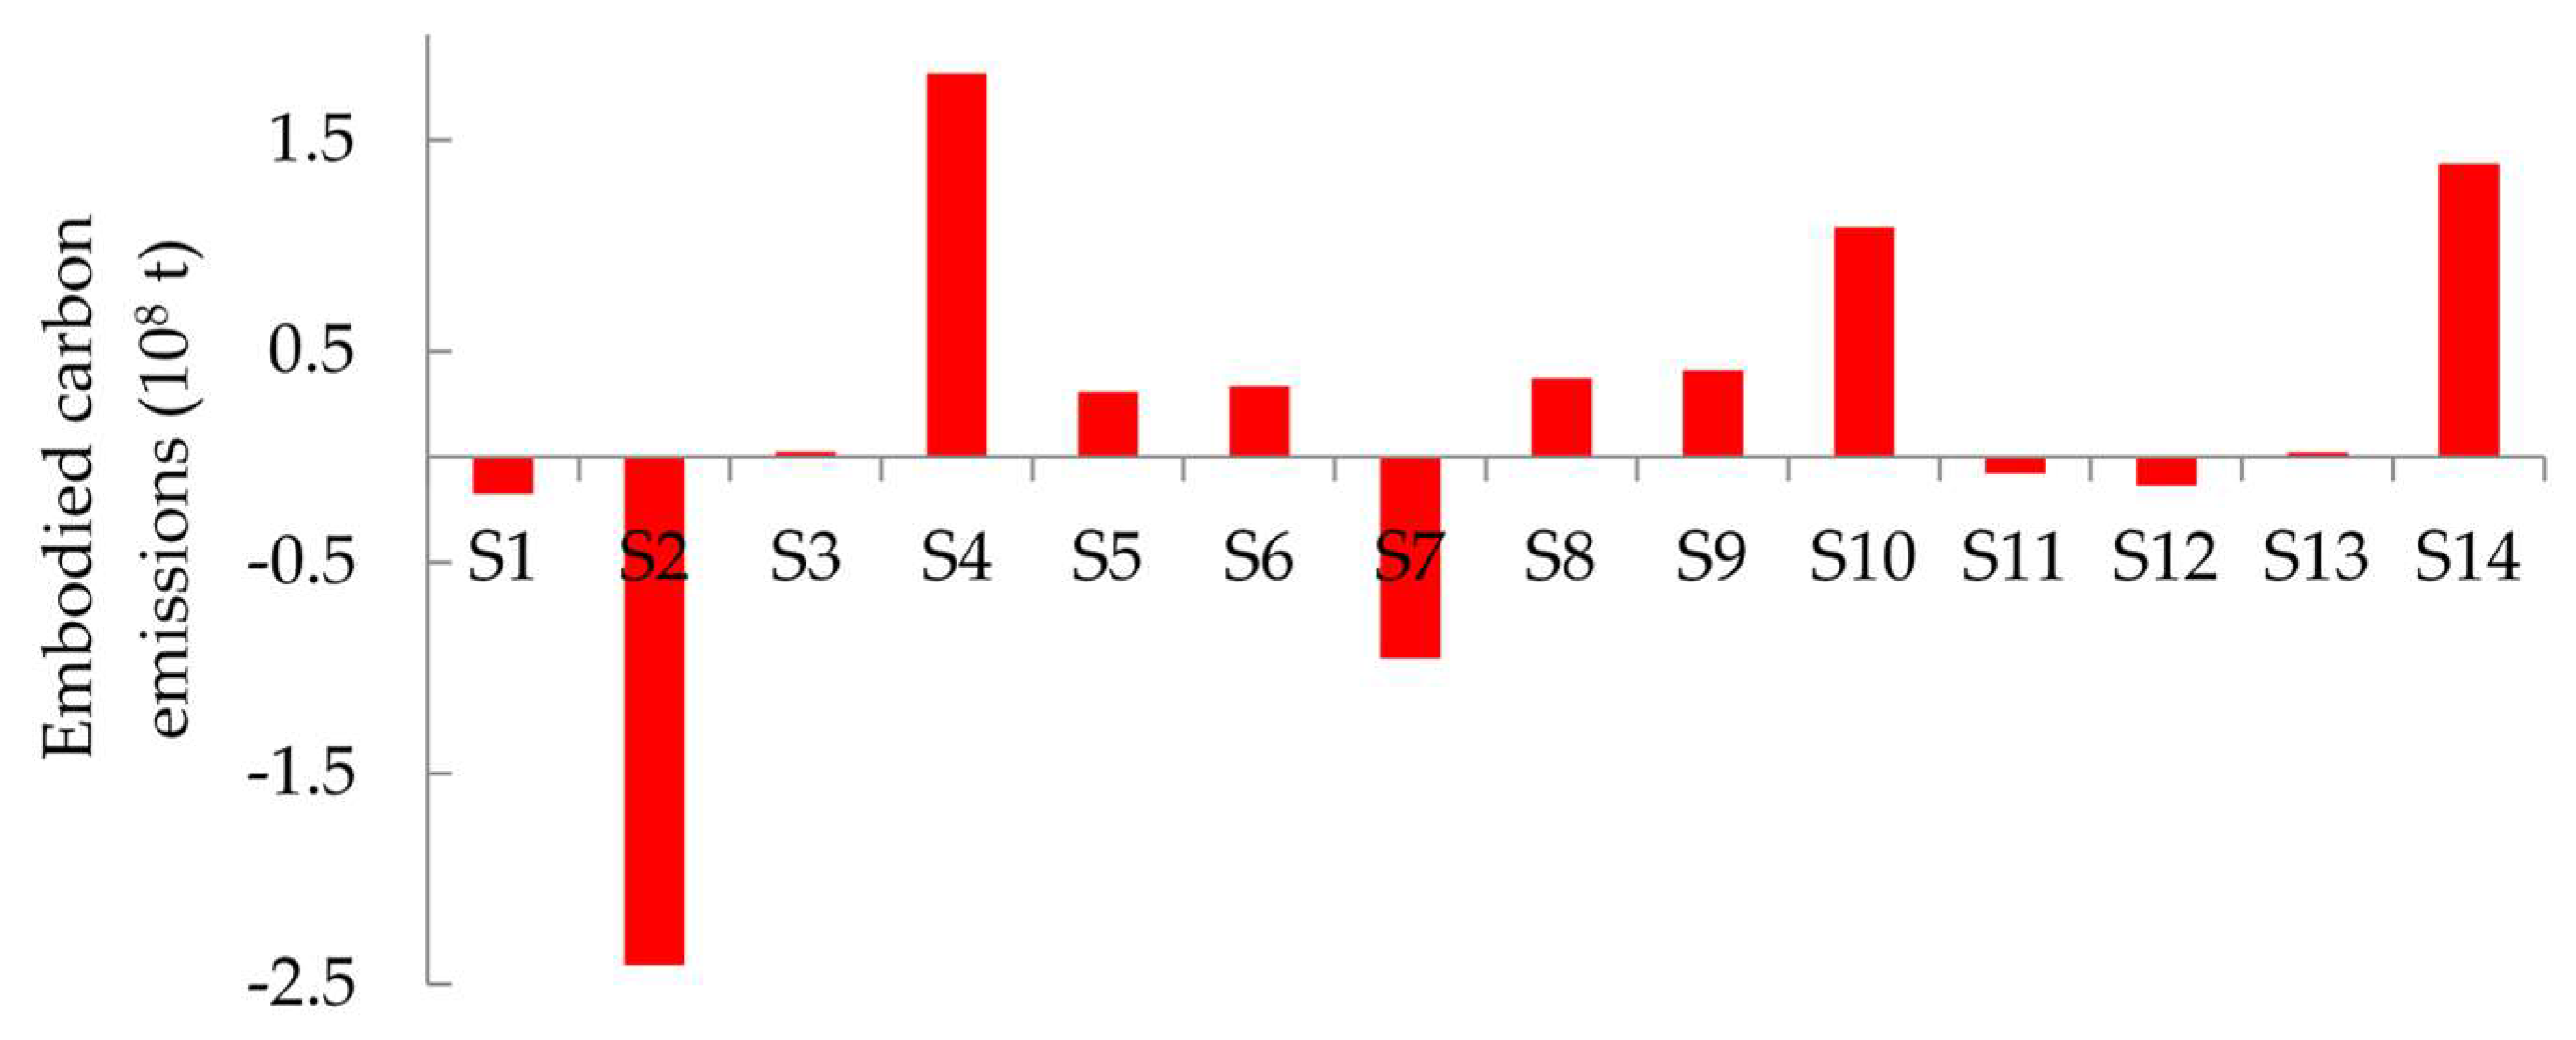
3.2.2. Embodied Carbon Emissions Trade

(1) The variation of China’s carbon emissions import and export
Figure 8 shows that there is an abrupt increase of both carbon emissions import and export during the period of 2002–2005, and slight fluctuations after 2005. After 2002, both the export and import of embodied carbon emissions are greater than 20 × 108 t. The maximum and minimum net export occurred in 2007 and 2000, with the values 5.67 × 10⁸ t and 0.38 × 10⁸ t. Overall, China is a typical net exporter of carbon emissions, and the average annual net export is 2.0 × 10⁸ t in the period of 1997–2015.
(2) Embodied carbon emissions trade from perspective of sectors
Figure 9 indicates that carbon emissions export mainly occurs in S10, S9, S14, S7, and S4 during 1997–2015. The average export of embodied carbon emissions of these five sectors is 7.83 × 10⁸ t, 2.76 × 10⁸ t, 2.47 × 10⁸ t, 2.41 × 10⁸ t and 2.21 × 10⁸ t (Figure 9a) and the export proportion sums up to 85.0% (Figure 9b). S10 is the most important sector concerning carbon emissions, and the export volume increases rapidly from 1.62 × 10⁸ t in 1997 to 10.26 × 10⁸ t in 2015; the proportion export of S10 has been also rising. The export proportion of S9, S7 and S14 changes slightly though there are increases in export volumes of these three sectors. The export proportion of S4 shows a declining trend, and there are perhaps two reasons for it: one is the reduction of the total carbon emission intensity and the other is the decline of trade volume in S4. Exports of all sectors show sharp rises after 2002 and then keep relatively stable. The manufacturing industries are a major pulling force on the exports of embodied carbon emissions in China.
Embodied carbon emissions of all sectors show a significant increase during 1997–2005 and 2007–2012, while showing a decrease during the period of 2012–2015, and the annual average embodied carbon emissions imports of these four sectors reached 13.59 × 10⁸ t (Figure 10a). China imports more embodied carbon emissions in such sectors as S10, S7, S2 and S9, and the import proportions of the four sectors are 36%, 18%, 14% and 12%, respectively (Figure 10b).
Figure 11 shows that S1, S2, S7, S11 and S12 are net embodied carbon emissions import sectors. The annual average net exports of embodied carbon emissions in S4, S10 and S14 are all more than 1.0 × 10⁸ t, while net imports of S2 and S7 are 2.41 × 10⁸ t and 0.96 × 10⁸ t, respectively.
S10, S7 and S9, which are manufacturing sectors, play important roles in both exports and imports in China’s embodied carbon emissions trade. S2 and S7 dominate in the net imports, while S4, S10 and S14 dominate in net exports of China’s embodied carbon emissions trade.

4. Discussion

4.1. Virtual Water Flow Chains

Overall, domestic virtual water flows among different sectors were much larger than trade between China and other regions except in S2. Table 3 demonstrates the inter-sectoral virtual water flow during 1997–2015; the row data represents the water that the row sector flows to the column sectors and the column data represent the water that the row sector acquires from the column sectors. It indicates that the products of S1 and S13 are major virtual water suppliers for other sectors. The annual average virtual water flowing from sector S1 to sectors S3, S14, S4 and S10 are 82.74 × 10⁹ m3, 73.71 × 10⁹ m3, 32.1 × 10⁹ m3 and 12.56 × 10⁹ m3; there is little difference among the annual average water flowing from S13 to other sectors except to S14 and S10. S14, S3 and S10 obtain large amounts of virtual water from other sectors, with the values of 137.54 × 10⁹ m3, 90.24 × 10⁹ m3 and 41.88 × 10⁹ m3, respectively.
Based on Equation (12), the virtual water export considering internal linkage is calculated (Figure 12). It is greatly different from that without considering internal linkage. The sectors that mainly pull China’s virtual water export are S1 and S13. The summation proportion of virtual water export from these two sectors is up to 81%. There are two reasons for this virtual water structure: one is that products of the major sectors’ virtual water export not considering internal linkage (S10, S4, S14) obtained raw material from these two sectors; the other is that the total water consumption coefficients of these two sectors are far greater than that of other sectors. The total water consumption coefficient of S1 in 2007 was 6 913.4.8 m3/104 $, which is 6.9 and 3.87 times greater than that of California and Illinois, USA, in 2008 ([34]). Improving water use efficiency plays an important role in lowering virtual water export in China.

4.2. Embodied Carbon Emissions Flow Chain

Table 4 shows the inter-sectoral flow of embodied carbon emissions. It shows that S9, S7, S8, S2 and S13 are major sources of carbon emissions for other sectors. The annual average carbon emissions flowing from S9 to S14, S10 and S11 is 638.7 × 10⁶ t, 418.52 × 10⁶ t and 132.72 × 10⁶ t; the annual average carbon emissions flowing from S7 to S14, S10 and S4 is 540.64 × 10⁶ t, 184.18 × 10⁶ t and 82.46 × 10⁶ t, respectively; the annual average carbon emissions flowing from sector S8 to sectors S14 and S10 is 448.23 × 10⁶ t, 98.02 × 10⁶ t; and the annual average carbon emissions flowing from S2 to S14 and S10 is 253.93 × 10⁶ t, 104.82 × 10⁶ t. S14, S4 and S10, which export embodied carbon emissions, gain large amounts of carbon emissions from other sectors inside China.
The embodied carbon emissions considering internal linkage are calculated according to Equation (13) and the results are shown in Figure 13. The sectors that mainly pull China’s embodied carbon emissions export are S9, S7, S2, S13 and S8. The summation proportion of embodied carbon emissions export by these five sectors reaches 85%. The export proportion of S4 drops from 36% to 1% when considering the internal linkage among different sectors. The export proportion of the three heavy sectors of S2, S7 and S9 all play important roles in the two analytical approaches. The reasons for the characteristics of the embodied carbon emissions trade are: firstly, S4 and S10 need to obtain large amounts of energy resources from S9, S7, S8, S2 and S13, while S9, S7, S8 and S2 gain much energy from themselves; and secondly, the total carbon emission intensity of heavy industrial sectors in China is high compared to other sectors.
Carbon emission intensity (CO2 emissions divided by gross domestic product (GDP)) is an important indicator to reflect regional carbon emission performance. Figure 14 depicts the change trend of the CO2 emission intensity in some countries. The GDP value of each country is calculated based on the market exchange rates (IEA 2017). As the figure shows, carbon emission intensity in developed countries such as the USA, Norway, Australia, Canada and Japan is below 0.5 kg/$, and carbon emission intensity in Japan, Norway and Brazil is less than 0.3 kg/$. Carbon emissions in developing countries such as China and India in 2015 are more than 1.5 kg/$. Although there was a drastic decline in carbon emission intensity in developing countries with technological developments during 1990–2015, a huge gap still exists between the developing and developed countries. The decline in carbon emission intensity kept the export of carbon emissions stable rather than increasing with a sharp increase in trade after 2002 in China. At the same export rate, the products from China embodied much more carbon emissions than other countries. It is important for China to reduce the carbon emission intensity, especially for such sectors as S2, S7, S8 and S9, which are the main sources of carbon emissions in both inter-sectoral linkage and external trade.

4.3. Policy Implications

China is a net exporter of virtual water and embodied carbon emissions; therefore, the government should pay more attention to the production than the consumption on the issue of resources conservation and carbon emissions reduction. To alleviate resource pressure and environmental problems, China has paid much attention to the sustainable use of water and CO2 emissions in the last 10 years. Overall, three reasons contribute to virtual water flows: water utilization efficiency, commodity trade structure and trade volume. It is basically impossible to control trade volume solely for environmental purposes, though it has dramatic effects on virtual water trade. It is more feasible to discuss policies for improving water utilization efficiency and adjusting export composition. Net virtual water exports mainly embodied in products of S4, S14 and S10 when not considering the flow of raw materials in the industrial chain; more than 80% of virtual water export is ultimately from S1 and S13 in the supply chain. S1 currently consumes about 68.16% of total water resources and has a much higher water coefficient compared with other sectors. The average national irrigation water use coefficient was 0.50 in 2012, which is far below those of developed countries or regions (0.7–0.8). Therefore, to improve agricultural water use efficiency, efforts such as recycling irrigation and choosing suitable areas for agricultural production should be taken. Moreover, China must industrialize high-tech equipment to realize new types of industrialization, and adjust industrial structure instead of developing industrial sectors dependent on agricultural products. Additionally, optimizing the production structure is a vital approach to curb indirect water consumption; the export ratio of commodities with lower total water consumption coefficients should be expanded, especially for service industries. Last but not least, China should make full use of the water saving effect from importing water-intensive products to relieve water scarcity.
To achieve the country’s energy consumption and emissions reduction commitments, China has launched plenty of energy conservation policies. Most of the policies place emphasis on typical heavy industries such as iron and steel, building materials, petrochemical, chemical, nonferrous metals and power industries. For instance, to target a 17% reduction in CO2 emissions per unit of GDP, China has closed many backward production facilities. In the meantime, environmental policies should not ignore the supply chain of the carbon emissions. For sectors with high total carbon emission intensity, raising the utilization and conservation efficiency of intermediate material input or reducing intermediate material input are valuable measures. Otherwise, the total industrial production and emissions from these sectors may still increase due to the high demand for their products though there are significant emission intensity reduction efforts. Thus, reducing the carbon emission intensity of different sectors is more significant than reducing or even closing the high carbon consumption sectors.
Overall, China has achieved the transformation of export commodity structure from primary product to industrial product. In the future, it should pay more attention to improving resource use efficiency, optimizing industrial structure and eliminating high resource and energy consuming industrial sectors to realize sustainable economic development.
However, this paper only considers CO2 emissions in the GHG and does not involve other GHG gases such as CH4, NOx, and O3 and so on. On the one hand, the national energy consumption data of every sector are published annually by National Bureau of Statistics of China; on the other hand, the classification of energy consumption data is consistent with that of the industrial sectors in the input-output table, which increases the reliability of the analysis. Inter-sectoral linkage and external trade analysis for other GHG gases in China can be further jobs for authors to launch in the future.

5. Conclusions

Water scarcity and carbon emissions are two important issues threating the sustainable and healthy development in China. The objectives of this study are to investigate the inter-sectoral linkage of water and energy resources among different sectors inside China and internal trade with other countries, and to identify the ultimate source of virtual water and carbon emissions and to grasp key sectors in the economic system applying input–output analysis. The main conclusions are as follows.
As far as water resources are concerned, linkage analysis show that agriculture, and the electric and water industry have high independence because they output much but input little virtual water from other sectors. Sectors such as the paper and printing industry, the petrochemical industry, other nonmetallic mineral products industry, and the metal products industry output virtual water to other sectors and input virtual water meanwhile from other sectors. Sectors which have a high dependence on other sectors include the textile garment leather products industry, and the general machinery and equipment manufacturing industry, and the architecture and service industry. About 78% of virtual water consumption in the architecture and service industry is obtained from other sectors to meet the final demands. China was the net exporter of virtual water during 1997–2015, which aggravated its water scarcity. The annual average net export was 13.72 × 10⁹ m3, with the largest value of 36.58 × 10⁹ m3 in 2007. From the perspective of the industrial chain, the virtual water export from agriculture, and the electric and water industry account for more than 80% of China’s output. It indicates that the ultimate source of virtual water in China’s output are from these two sectors. The water use coefficient of agriculture, and the electric and water industry are much higher than those of other sectors in China. The water use coefficients of all sectors in China are greater than those of other developed countries. It is extremely urgent for China to lower its total water consumption coefficient, especially for agriculture, and the electric and water industry to relieve water resource stress.
As far as embodied carbon emissions are concerned, for heavy industries including the metal products industry, the petrochemical industry, other nonmetallic mineral products industry, the electric and water industry, and the mining industry, approximately 50% of their energy consumed come from the internal exchange and 90% of their energy consumption is transferred into other sectors. Sectors including the food beverage and tobacco products industry, the architecture and service industry, the general machinery and equipment manufacturing industry, the transportation equipment manufacturing industry, and the textile garment leather products industry output more carbon emissions than they obtain from other sectors. China’s net exports of embodied carbon emissions reached 2.0 × 10⁸ t, which may further deteriorate its environment. Manufacturing industries play an important role in China’s international embodied carbon emissions trade. From the perspective of the industrial chain, heavy industrial sectors including the metal products industry, the petrochemical industry, other nonmetallic mineral products industry, and the mining industry are the ultimate energy source for both internal linkage and external trade of carbon emissions. China’s carbon emission intensity is not only higher than that of developed countries or regions such as the USA, Japan, and Canada and so on, but also is higher than that of developing countries such as India and Brazil. Therefore, more efforts should be implemented to reduce carbon emission intensity.

Author Contributions

H.H. conceived, designed and revised the manuscript; Y.H. revised the manuscript and supervised the whole process; X.L. revised the manuscript; L.C. revised the manuscript and supervised the whole process; D.J. designed the methodology modification. J.Z. and C.W. polish the language. All authors read and approved the final manuscript.

Funding

This research received no external funding.

Acknowledgments

This study was supported by the National Natural Science Foundation of China (Grants Nos. 51709107; 51679089; 51609082); and the National Key Research and Development Program of China (Grant No. 2016YFC0401402).

Conflicts of Interest

The authors declare no conflict of interest.

References

  1. Ercin, A.E.; Hoekstra, A.Y. Carbon and Water Footprints Concepts, Methodologies and Policy Responses; United Nations World Water Assessment Programme; UNESCO: London, UK, 2012. [Google Scholar]
  2. FAO (Food and Agriculture Organization of the United Nations). Climate Change, Water and Food Security; FAO: Rome, Italy, 2011. [Google Scholar]
  3. Soytas, U.; Sari, R.; Ewing, B.T. Energy consumption, income, and carbon emissions in the United States. Ecol. Econ. 2007, 62, 482–489. [Google Scholar] [CrossRef]
  4. Herrmann, I.T.; Hauschild, M.Z. Effects of globalization on carbon footprints of products. CIRP Ann.-Manuf. Technol. 2009, 58, 6–13. [Google Scholar] [CrossRef]
  5. Allan, J.A. Virtual water—The water, food, and trade nexus: Useful concept or misleading metaphor? Water Int. 2003, 28, 106–113. [Google Scholar] [CrossRef]
  6. Zeitoun, M.; Allan, J.A.; Mohieldeen, Y. Virtual water “flows” of the Nile Basin, 1998–2004: A first approximation and implications for water security. Glob. Environ. Chang. 2010, 20, 229–242. [Google Scholar] [CrossRef]
  7. Chouchane, H.; Krol, M.S.; Hoekstra, A.Y. Virtual water trade patterns in relation to environmental and socioeconomic factors: A case study for Tunisia. Sci. Total Environ. 2018, 613–614, 287–297. [Google Scholar] [CrossRef] [PubMed]
  8. Wahba, S.M.; Scott, K.; Steinberger, J.K. Analyzing Egypt’s water footprint based on trade balance and expenditure inequality. J. Clean. Prod. 2018, 198, 1526–1535. [Google Scholar] [CrossRef]
  9. Brindha, K. International virtual water flows from agricultural and livestock products of India. J. Clean. Prod. 2017, 161, 922–930. [Google Scholar] [CrossRef]
  10. Novo, P.; Garrido, A.; Varela-Ortega, C. Are virtual water “flows” in Spanish grain trade consistent with relative water scarcity? Ecol. Econ. 2009, 68, 1454–1464. [Google Scholar] [CrossRef] [Green Version]
  11. Antonelli, M.; Tamea, S.; Yang, H. Intra-EU agricultural trade, virtual water flows and policy implications. Sci. Total Environ. 2017, 587–588, 439–448. [Google Scholar] [CrossRef] [PubMed]
  12. Zhong, Z.Q.; Jiang, L.; Zhou, P. Transnational transfer of carbon emissions embodied in trade: Characteristics and determinants from a spatial perspective. Energy 2018, 147, 858–875. [Google Scholar] [CrossRef]
  13. Peters, G.P.; Minx, J.C.; Weber, C.L.; Edenhofer, O. Growth in emission transfers via international trade from 1990 to 2008. Proc. Natl. Acad. Sci. USA 2011, 108, 8903–8908. [Google Scholar] [CrossRef] [PubMed] [Green Version]
  14. Davis, S.J.; Caldeira, K. Consumption-based accounting of CO2 emissions. Proc. Natl. Acad. Sci. USA 2010, 107, 5687–5692. [Google Scholar] [CrossRef] [PubMed]
  15. Jiang, X.M.; Guan, D.B. The global CO2 emissions growth after international crisis and the role of international trade. Energy Policy 2017, 109, 734–746. [Google Scholar] [CrossRef]
  16. Andrew, R.M.; Davis, S.J.; Peters, G.P. Climate policy and dependence on traded carbon. Environ. Res. Lett. 2013, 8, 034011. [Google Scholar] [CrossRef] [Green Version]
  17. Antimiani, A.; Costantini, V.; Martini, C.; Salvatici, L.; Tommasino, M.C.; Chiara, M.; Salvatici, L.; Tommasino, M.C. Assessing alternative solutions to carbon leakage. Energy Econ. 2013, 36, 299–311. [Google Scholar] [CrossRef]
  18. Eichner, T.; Pethig, R. Unilateral consumption-based carbon taxes and negative leakage. Resour. Energy Econ. 2015, 40, 127–142. [Google Scholar] [CrossRef]
  19. Böhringer, C.; Bye, B.; Fæhnb, T.; Rosendahl, K.E. Targeted carbon tariffs: Export response, leakage and welfare. Resour. Energy Econ. 2017, 50, 51–73. [Google Scholar] [CrossRef]
  20. Chen, W.M.; Wu, S.M.; Lei, Y.L.; Li, S.T. Virtual water export and import in China’s foreign trade: A quantification using input-output tables of China from 2000 to 2012. Resour. Conserv. Recycl. 2017. [Google Scholar] [CrossRef]
  21. Tian, X.; Sarkis, J.; Genga, Y.; Qian, Y.Y.; Gao, C.X.; Bleischwitz, R.; Xu, Y. Evolution of China’s water footprint and virtual water trade: A global trade assessment. Environ. Int. 2018, 121, 178–188. [Google Scholar] [CrossRef] [PubMed]
  22. Wang, Y.B.; Liu, D.; Cao, X.C.; Yang, Z.Y.; Song, J.F.; Chen, D.Y.; Sun, S.K. Agricultural water rights trading and virtual water export compensation coupling model: A case study of an irrigation district in China. Agric. Water Manag. 2017, 180, 99–106. [Google Scholar] [CrossRef]
  23. Cai, B.M.; Wang, C.C.; Zhang, B. Worse than imagined: Unidentified virtual water flows in China. J. Environ. Manag. 2017, 196, 681–691. [Google Scholar] [CrossRef] [PubMed]
  24. Yan, Y.F.; Yang, L.K. China’s foreign trade and climate change: A case study of CO2 emissions. Energy Policy 2010, 38, 350–356. [Google Scholar]
  25. Andersson, F.N.G. International trade and carbon emissions: The role of Chinese institutional and policy reforms. J. Environ. Manag. 2018, 205, 29–39. [Google Scholar] [CrossRef] [PubMed]
  26. Yuan, R.; Zhao, T. A combined input-output and sensitivity analysis of CO2 emissions in the high energy-consuming industries: A case study of China. Atmos. Pollut. Res. 2016, 7, 315–325. [Google Scholar] [CrossRef]
  27. Duarte, R.; Sanchez, C.J.; Bielsa, J. Water use in the Spanish economy: An input–output approach. Ecol. Econ. 2002, 43, 71–85. [Google Scholar] [CrossRef]
  28. Wen, W.; Wang, Q. Identification of key sectors and key provinces at the view of CO2 reduction and economic growth in China: Linkage analyses based on the MRIO model. Ecol. Indic. 2019, 96, 1–15. [Google Scholar] [CrossRef]
  29. Fang, D.L.; Chen, B. Linkage analysis for water-carbon nexus in China. Appl. Energy 2018, 225, 682–695. [Google Scholar] [CrossRef]
  30. Fang, D.L.; Chen, B. Linkage analysis for the water-energy nexus of city. Appl. Energy 2017, 189, 770–779. [Google Scholar] [CrossRef]
  31. Yang, X.C.; Wang, Y.T.; Sun, M.X.; Wang, R.Q.; Zheng, P.M. Exploring the environmental pressures in urban sectors: An energy-water-carbon nexus perspective. Appl. Energy 2018, 228, 2298–2307. [Google Scholar] [CrossRef]
  32. Velázquez, E. An input–output model of water consumption: Analyzing intersectoral water relationships in Andalusia. Ecol. Econ. 2006, 56, 226–240. [Google Scholar] [CrossRef]
  33. Deng, G.Y.; Wang, L.; Xu, X.Y. Linkage effect of virtual water trade in China’s industrial products-based on generalized hypothetical extraction method. Ecol. Indic. 2018, 93, 1302–1320. [Google Scholar] [CrossRef]
  34. Mubako, S.; Lahiri, S.; Lant, C. Input–output analysis of virtual water transfers: Case study of California and Illinois. Ecol. Econ. 2013, 93, 230–238. [Google Scholar] [CrossRef]
  35. Sánchez, C.J.; Duarte, R. Analyzing Pollution by way of vertically integrated coefficients with an application to the water sector in Aragon. Camb. J. Econ. 2003, 27, 433–488. [Google Scholar] [CrossRef]
Figure 1. The relationship of different parameters.
Water 10 01664 g001
Figure 2. Virtual water flows among different sectors in China.
Water 10 01664 g002
Figure 3. Carbon emissions flows among different sectors in China.
Water 10 01664 g003
Figure 4. (a) Virtual water trade in China. (b) Trade volume and direct water consumption coefficient.
Water 10 01664 g004
Figure 5. (a) Virtual water export of every sector. (b) Export proportion of every sector.
Water 10 01664 g005
Figure 6. (a) Virtual water import of every sector. (b) Export proportion of every sector.
Water 10 01664 g006
Figure 7. Net virtual water exports by every sector.
Water 10 01664 g007
Figure 8. Embodied carbon emissions trade in China.
Water 10 01664 g008
Figure 9. (a) Carbon emissions export of every sector. (b) Export proportion of every sector.
Water 10 01664 g009
Figure 10. (a) Carbon emissions import of every sector. (b) Import proportion of every sector.
Water 10 01664 g010
Figure 11. Net embodied carbon emissions exports by every sector.
Water 10 01664 g011
Figure 12. Virtual water export considering internal linkage.
Water 10 01664 g012
Figure 13. Embodied carbon emissions export considering internal linkage.
Water 10 01664 g013
Figure 14. CO2 emission intensity, 1990–2015 (IEA).
Water 10 01664 g014
Table 1. Sectors aggregation.
CodeMerged SectorsOriginal Sectors in THE Input–Output Table
S1AgricultureAgriculture
S2Mining industryCoal mining and washing industry; oil and gas mining industry; metal mining industry; non-metallic mineral and other mining industry
S3Food, beverage and tobacco productsFood, beverage and tobacco products
S4Textile garment leather productsTextile industry; textile clothing footwear leather down and its products industry
S5Wood and furniture manufacturing industryWood and furniture manufacturing
S6Paper and printing industryPaper and printing industry
S7Petrochemical industryOil Processing, coking and nuclear fuel processing industry; chemical industry
S8Other nonmetallic mineral products industryOther nonmetallic mineral products industry
S9Metal products industryMetal smelting and rolling processing industry; metal products industry
S10General machinery and equipment manufacturing industryGeneral equipment manufacturing industry; special equipment manufacturing industry; electrical, mechanical equipment manufacturing; communications, computers and other electronic equipment manufacturing industry; instrumentation and cultural machinery manufacturing industry
S11Transportation equipment manufacturing industryTransportation equipment manufacturing industry
S12Other manufacturing industryWaste scrap industry; gas production and supply industry; other manufacturing products
S13Electric and water industryElectricity, heat production and supply industry; water production and supply industry
S14Architecture and service industryconstruction industry; transportation and warehousing; postal industry; information transmission, computer services and software industry; wholesale and retail trade; accommodation and catering; financial industry; real estate leasing and business services; research and experimental development; integrated technical services; water, environment and public facilities management; resident services and other services; education; health, social security and social welfare; culture, sports and entertainment; public administration and social organization
Table 2. Environmental input–output table.
Input/Output Intermediate UseTotal UseImportGross Output
12nExpertSum
Intermediate use1X11X12X1nEX1Y1IM1X1
2X21X22X2nEX2Y2IM2X2
nXn1Xn2XnnEXnYnIMnXn
Gross input X1X2Xn
Water (energy)consumption Wd1Wd2Wdn
Note. EXj is the export of sector j, IMj is the import of sector j, and Wdn is the direct water (carbon) consumption by the nth sector.
Table 3. Inter-sector virtual water flow in China (109 m3).
S1S2S3S4S5S6S7S8S9S10S11S12S13S14Sum
S100.9682.7432.14.532.293.330.71.212.564.171.880.5473.71220.7
S20.1800.230.290.060.060.270.090.171.060.310.050.102.435.29
S30.230.0100.140.010.010.020.010.010.110.040.010.010.751.34
S40.030.010.0400.030.030.040.010.020.150.060.030.010.530.99
S50000000000.010.01000.060.1
S60.140.040.480.340.0600.090.070.080.830.200.050.033.495.89
S70.860.210.851.270.190.2100.150.242.740.790.110.117.0814.8
S80.10.050.160.150.040.030.0600.110.860.230.030.023.35.14
S90.190.130.290.30.10.090.130.0903.250.830.080.064.5710.11
S100.010.010.010.02000.0100.0100.04000.20.31
S110.020.010.020.020.010.010.010.010.020.11000.010.420.66
S120.020.010.040.050.010.060.020.020.040.250.0600.010.461.04
S133.282.164.315.221.071.143.151.342.7117.014.730.66040.5387.31
S140.670.241.061.150.190.190.370.180.292.940.910.120.1408.44
Sum5.733.8490.2341.056.34.127.52.674.941.8812.383.021.04137.53
Table 4. Inter-sector embodied carbon emissions flow in China (106 t).
S1S2S3S4S5S6S7S8S9S10S11S12S13S14Sum
S100.7534.4513.452.051.141.210.270.395.412.090.660.2433.2495.35
S215.26021.6275.876.6322.688.0213.49104.8234.664.3110.18253.93528.47
S36.640.604.750.520.430.650.180.264.061.560.220.1927.4947.54
S40.950.731.701.241.481.180.370.496.183.300.970.2424.9843.81
S50.260.380.460.4900.30.170.10.191.91.060.110.079.3714.86
S61.420.825.463.940.7700.840.720.749.812.70.470.3244.9372.94
S747.422.8458.1482.4614.411709.0812.29184.1864.576.447.65540.641067.11
S89.499.0619.7417.494.423.95.6409.5298.0230.442.702.85448.23661.5
S917.2930.0733.4234.112.8613.2811.088.860418.52132.728.007.74638.71366.65
S101.081.51.662.050.430.510.770.440.6606.150.250.6729.7545.9
S110.530.260.690.680.140.170.290.130.363.2500.110.1513.7720.52
S121.861.9844.611.244.871.391.272.9224.476.8700.6350.48106.59
S1313.917.7521.4525.75.836.3112.916.0310.9186.9528.053.000222.89461.7
S1410.478.7621.7922.034.254.475.262.774.4863.7124.091.963.150177.19
Sum126.5595.5224.56238.7554.0360.4964.0738.2456.71011.28338.2629.234.082338.4

