Water Supply Basins of São Paulo Metropolitan Region: Hydro-Climatic Characteristics of the 2013–2015 Water Crisis


Abstract
1. Introduction
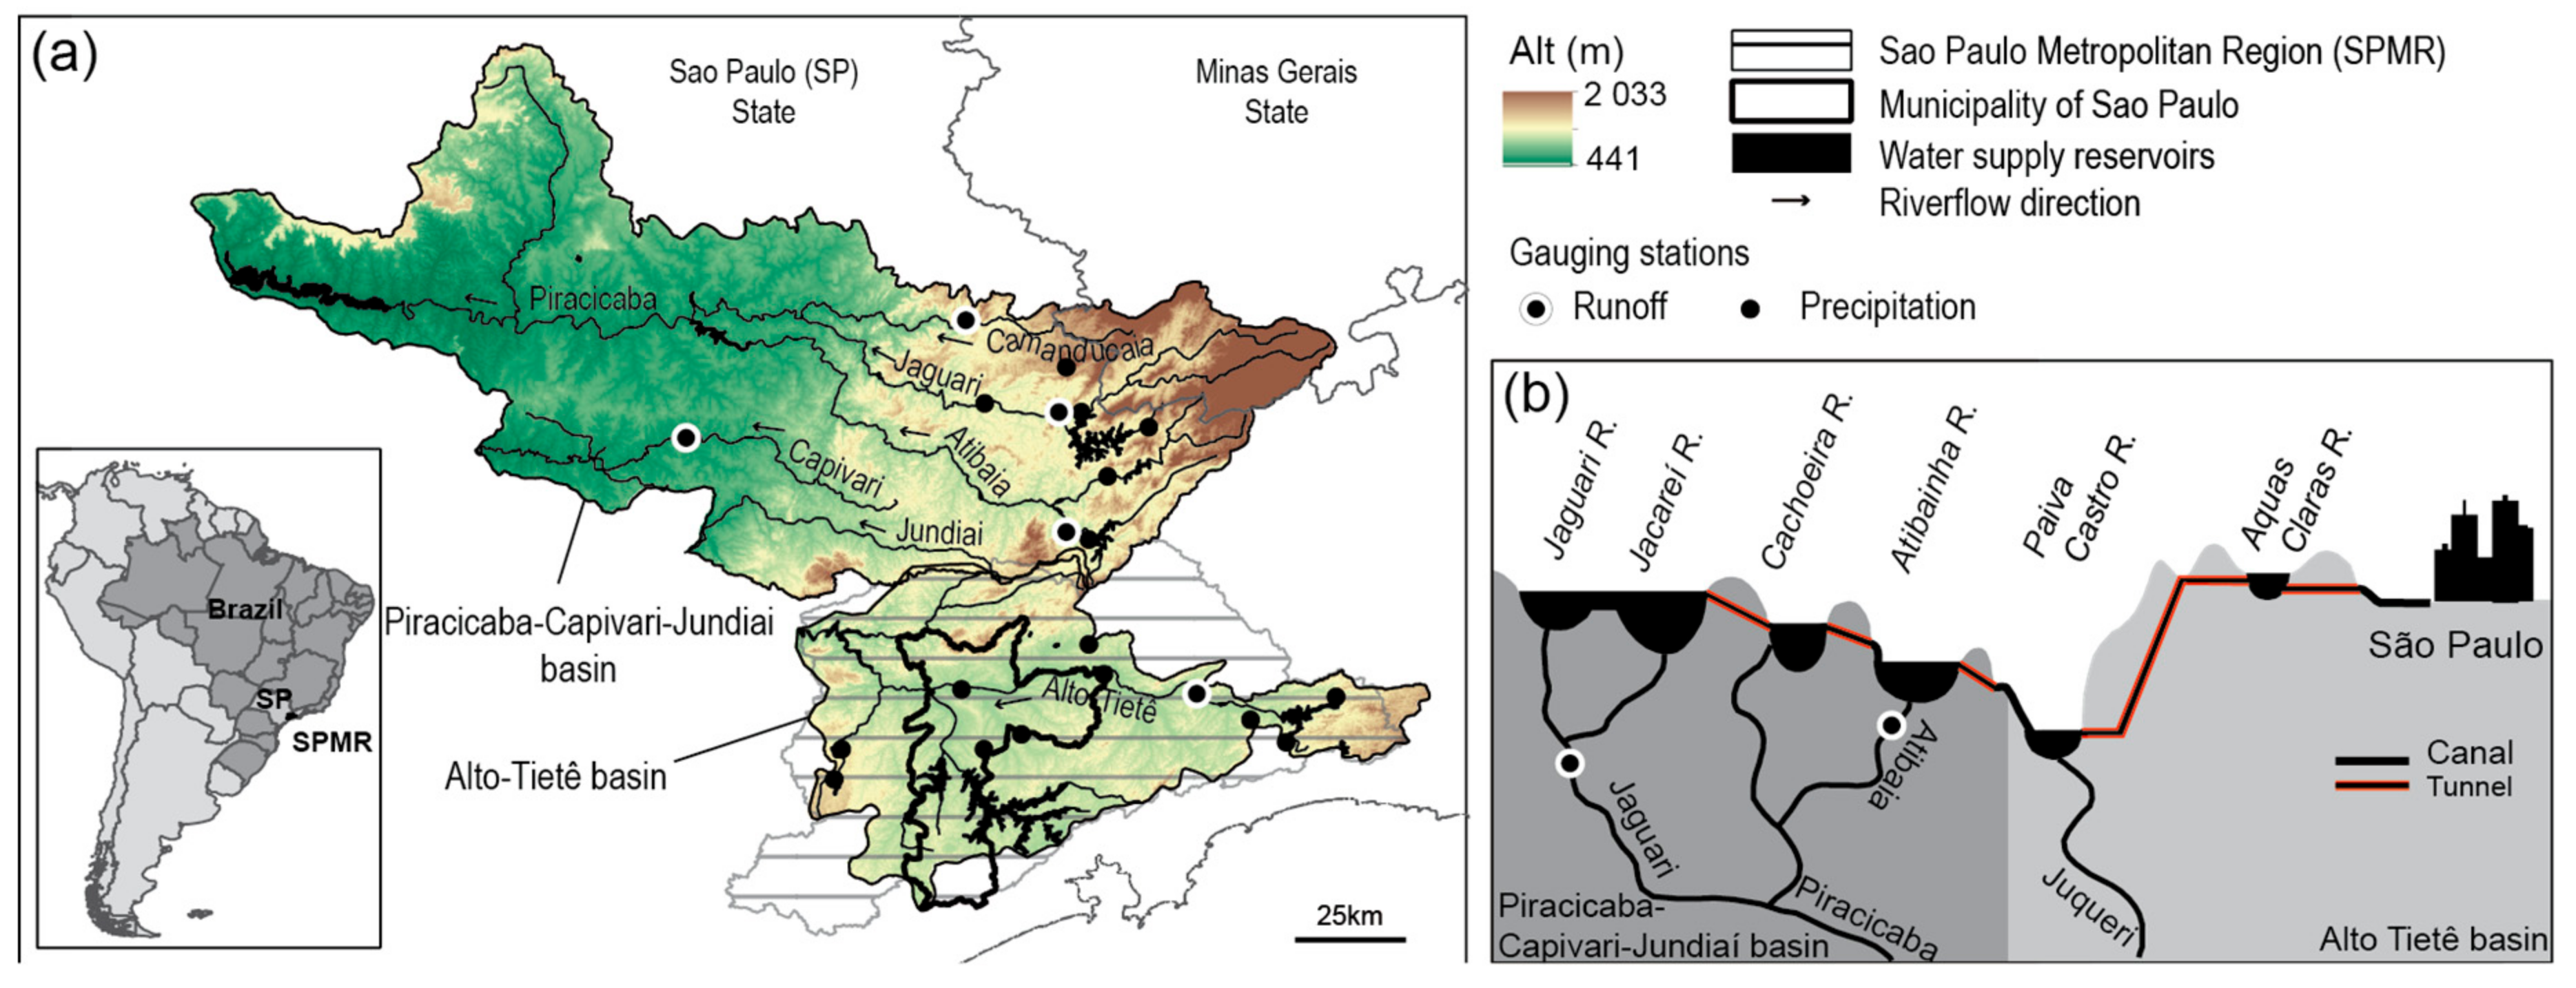
2. Study Area
3. Material and Methods
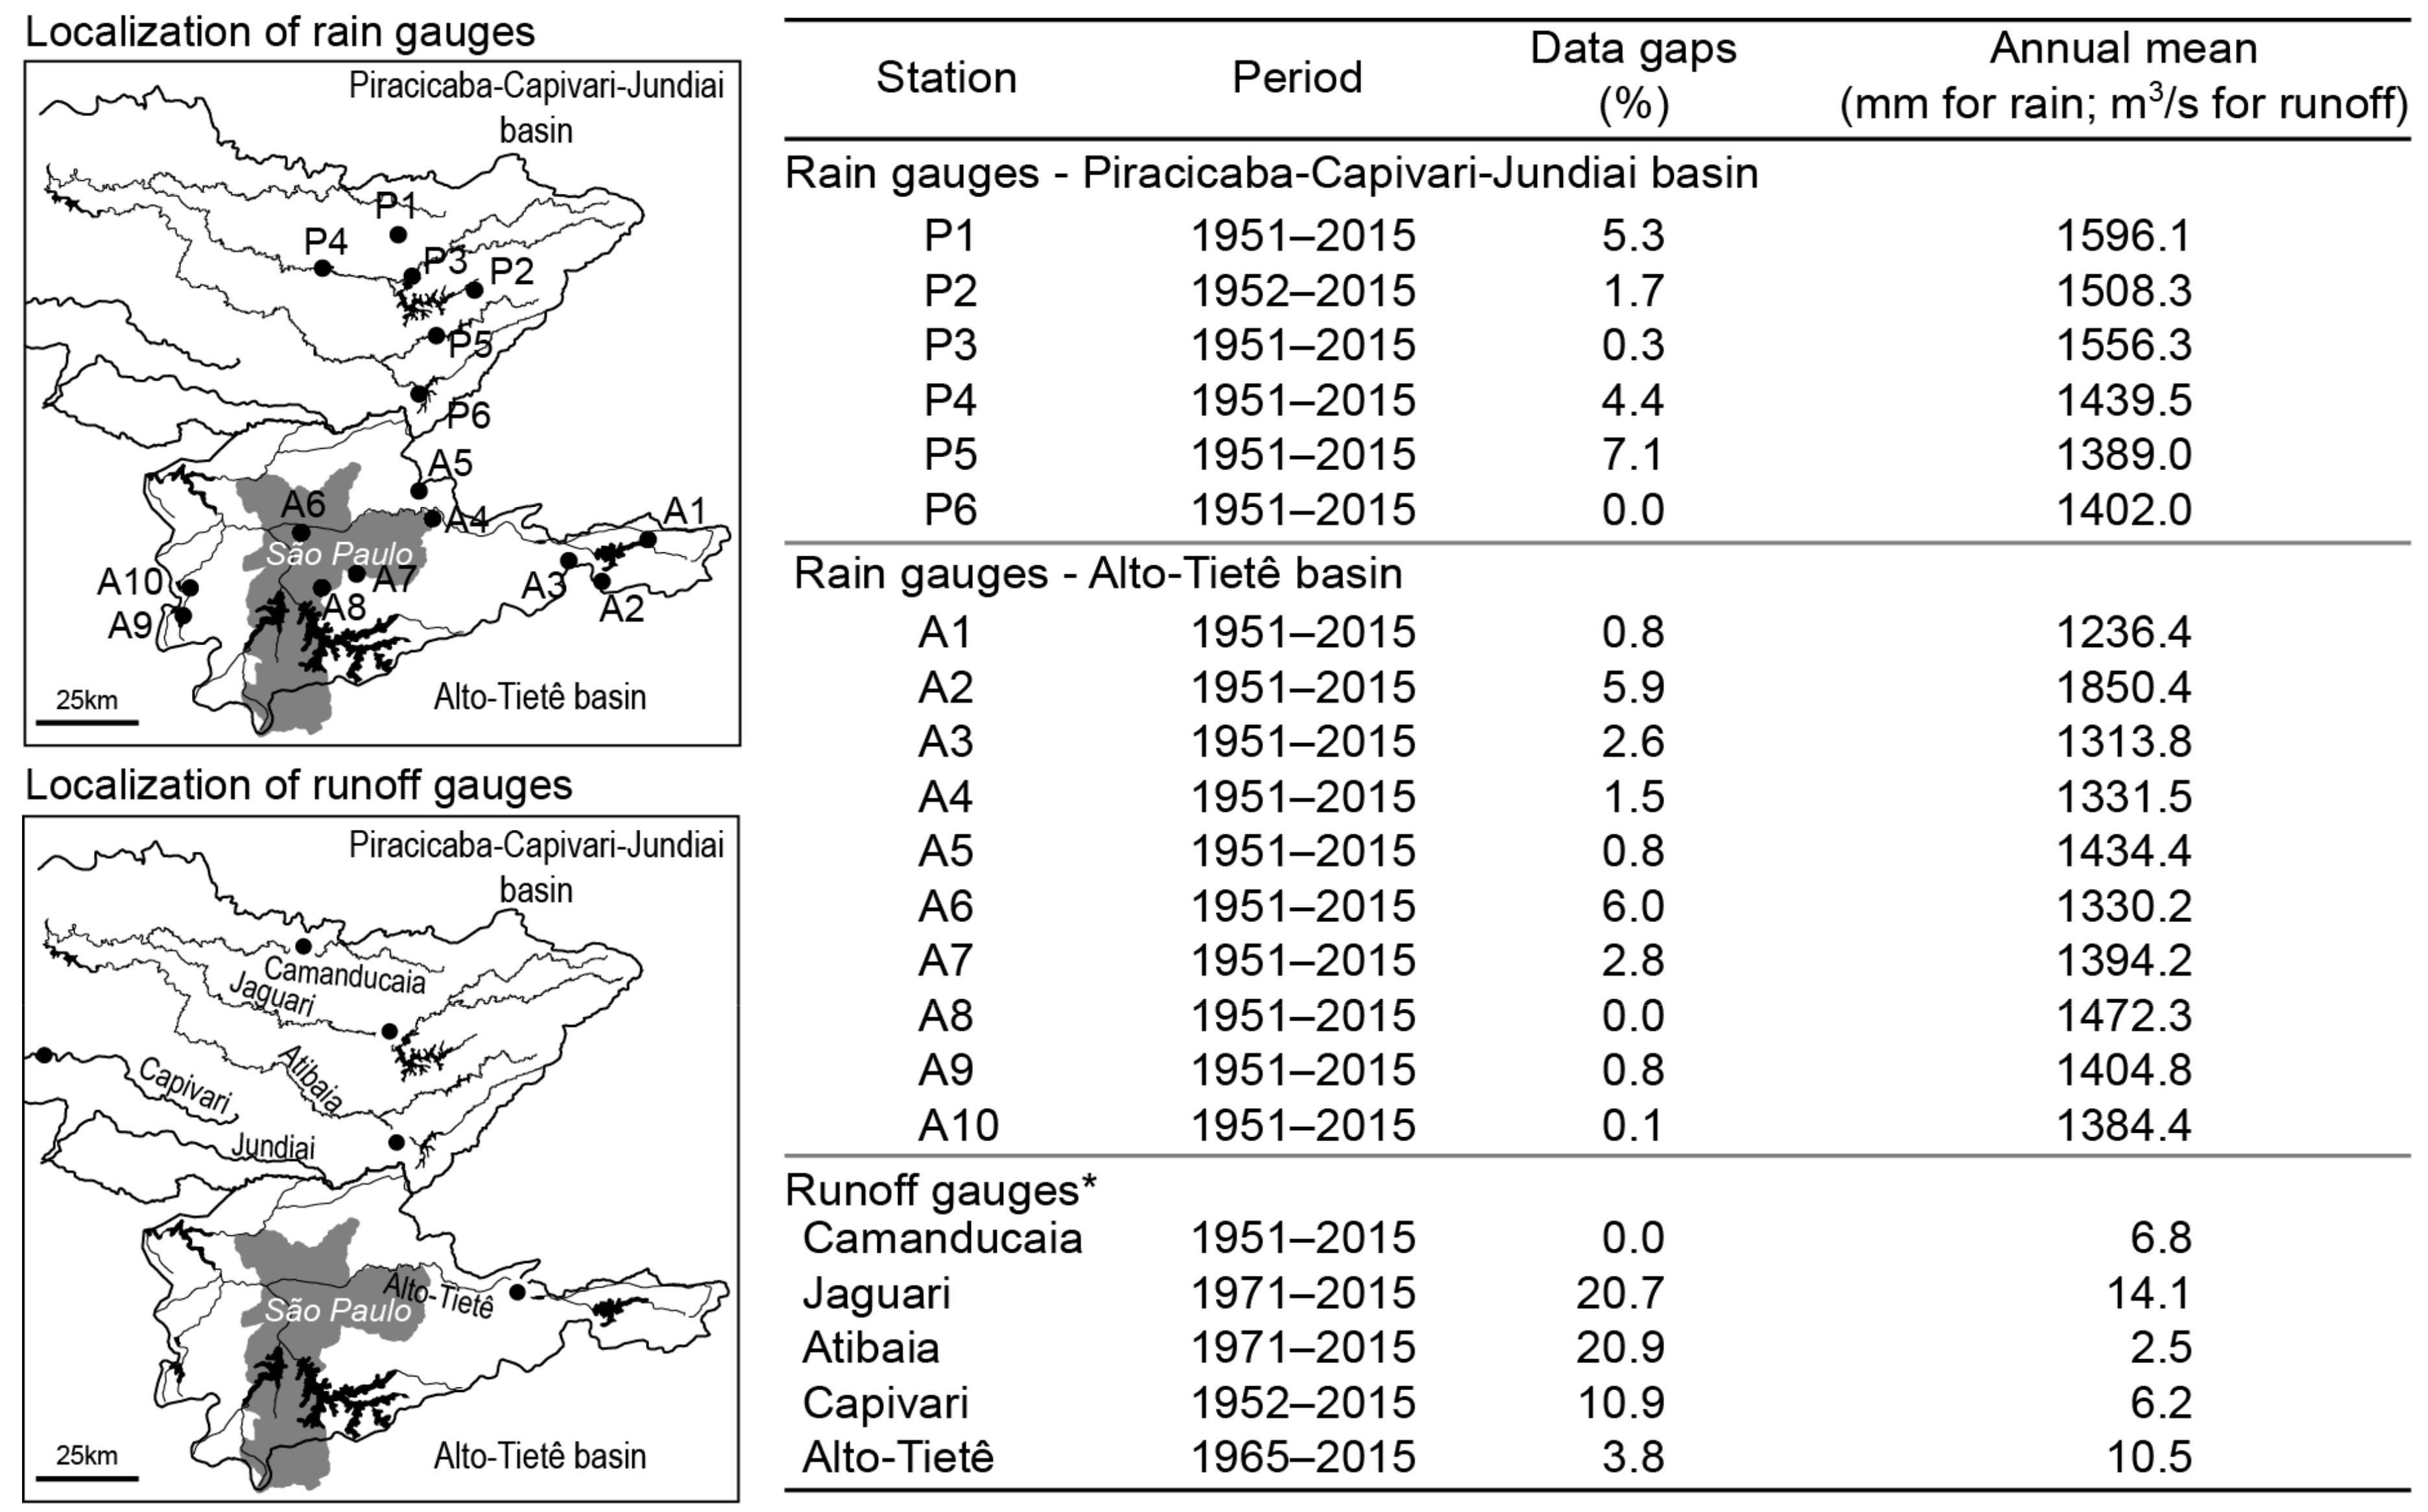
3.1. Data
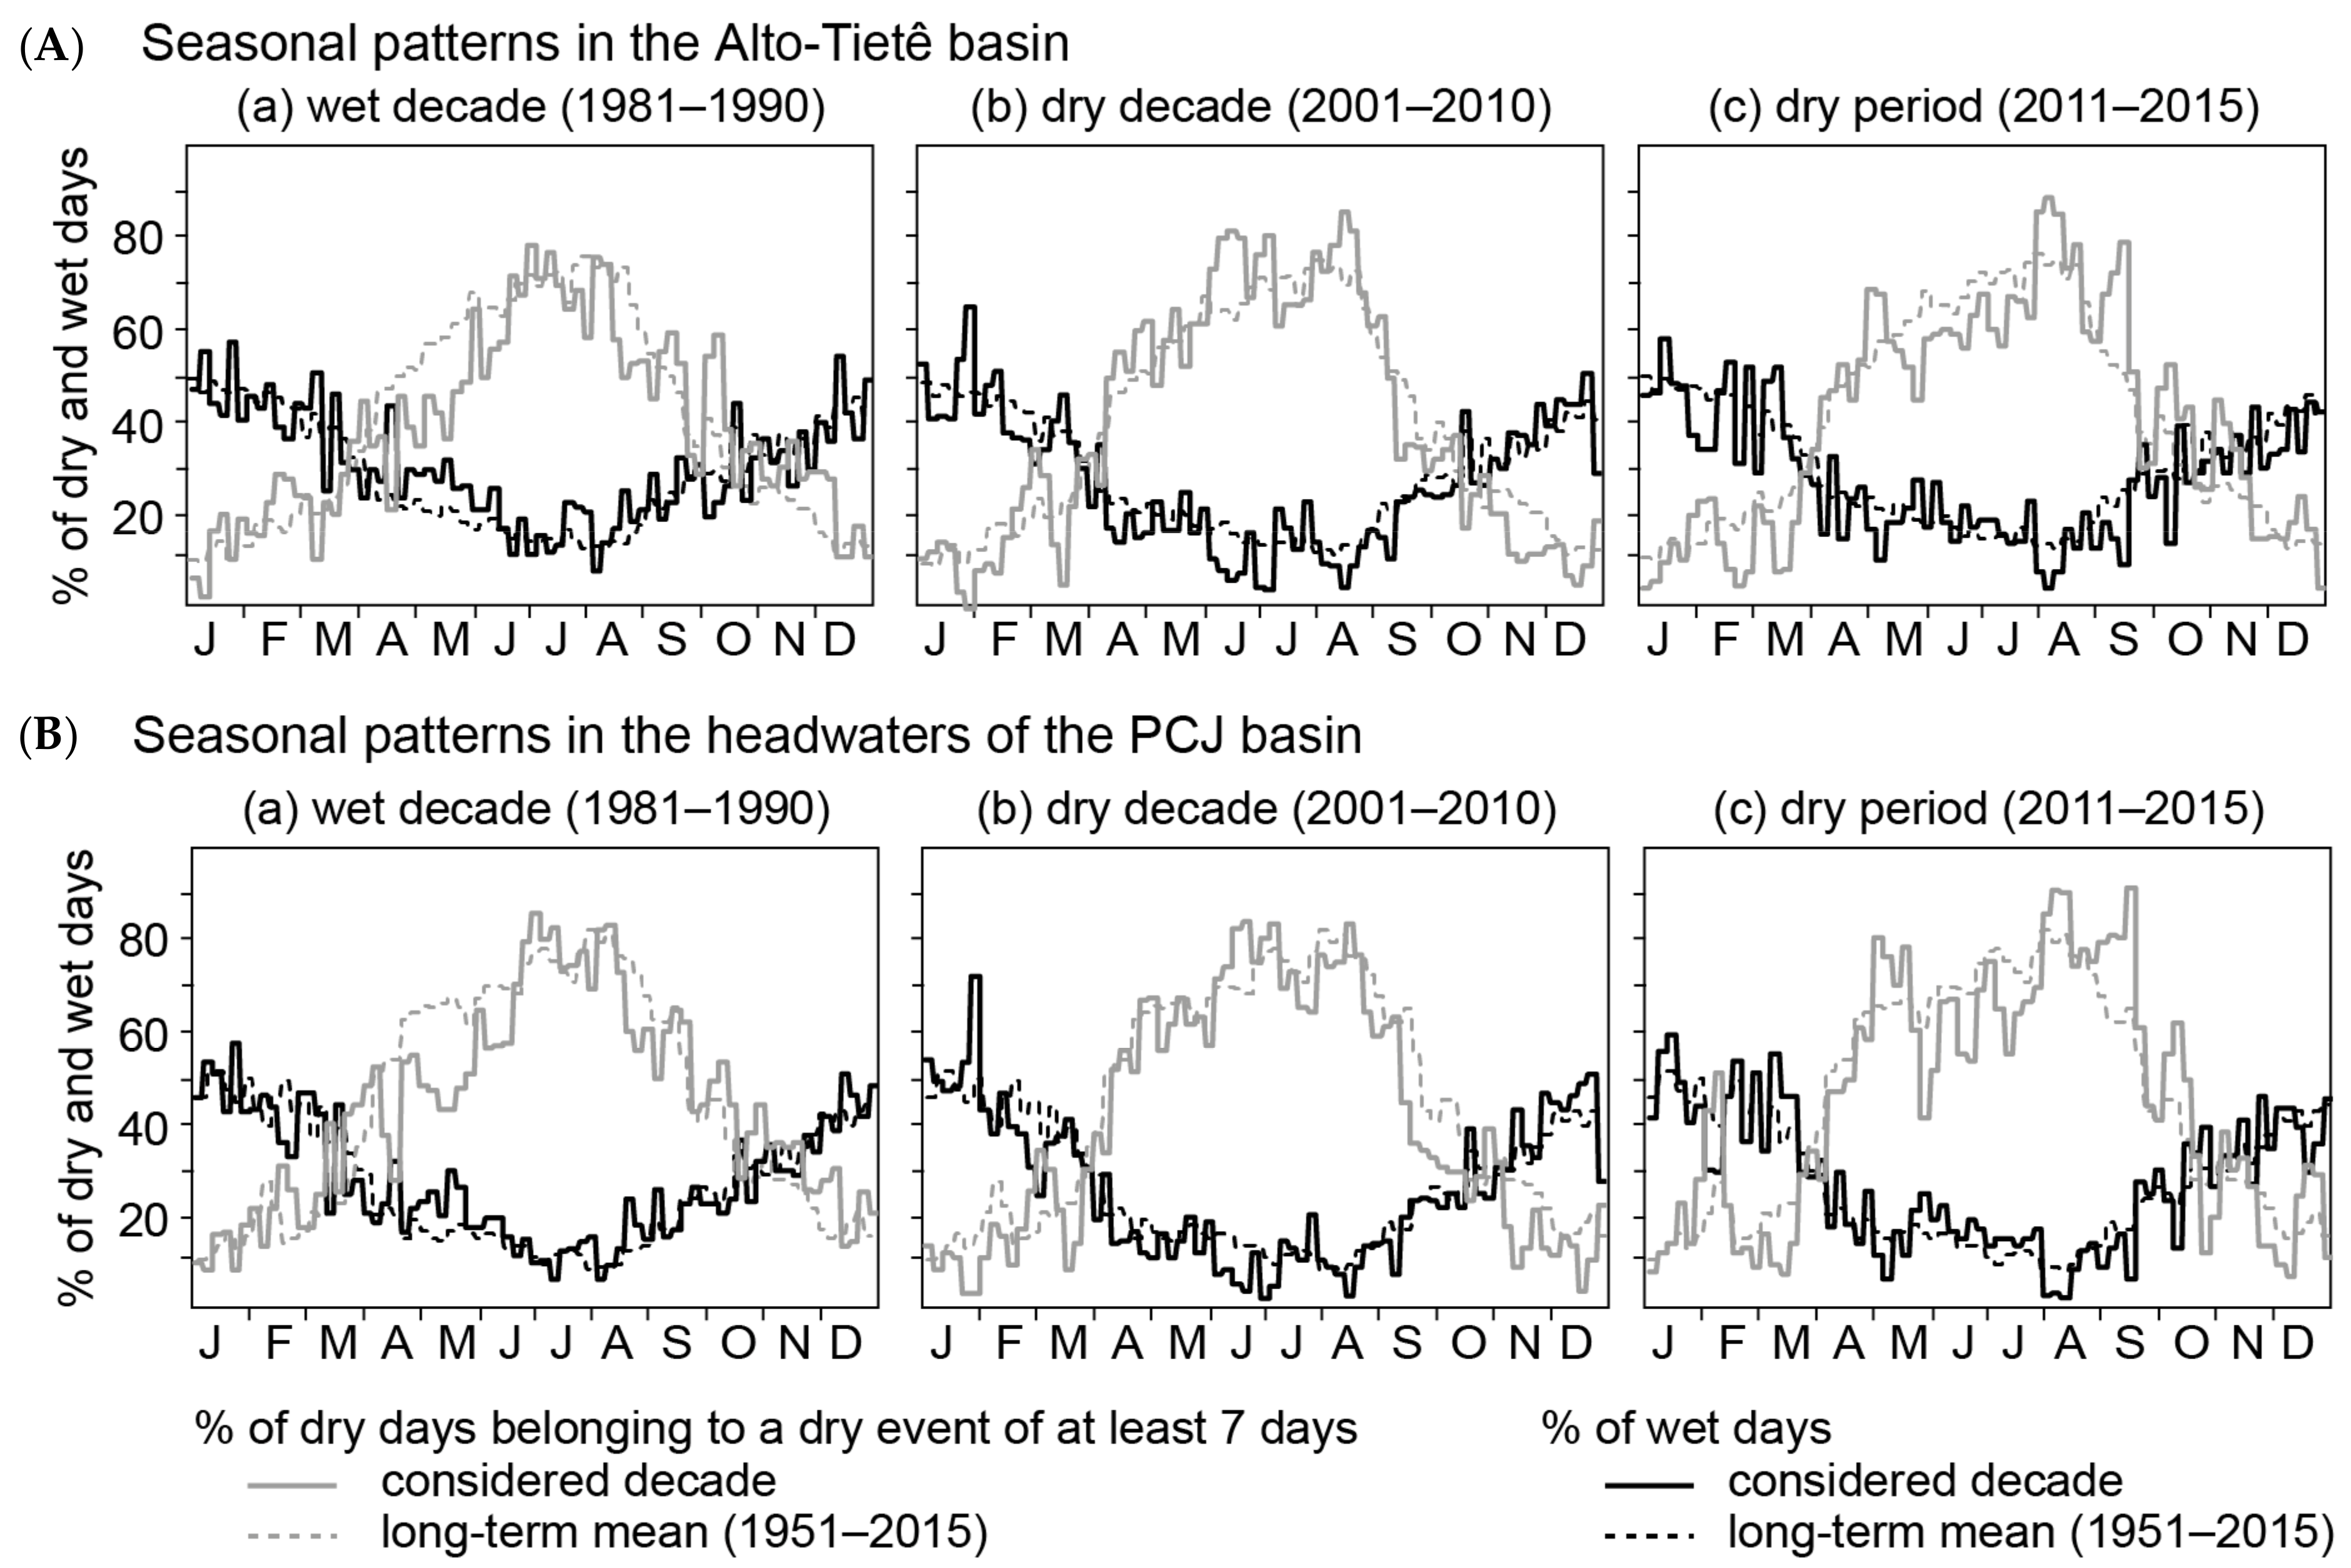
3.2. Seasonal Patterns of Precipitation and Runoff Series
3.3. Trends in Hydroclimatic Series
3.4. Hydroclimatic Variability
3.5. Intensity of Drought Events
3.6. Frequency of Drought Events
4. Results
4.1. Seasonal Patterns of Precipitation and Runoff
4.2. Long Term Trends in Precipitation and Runoff Since 1951
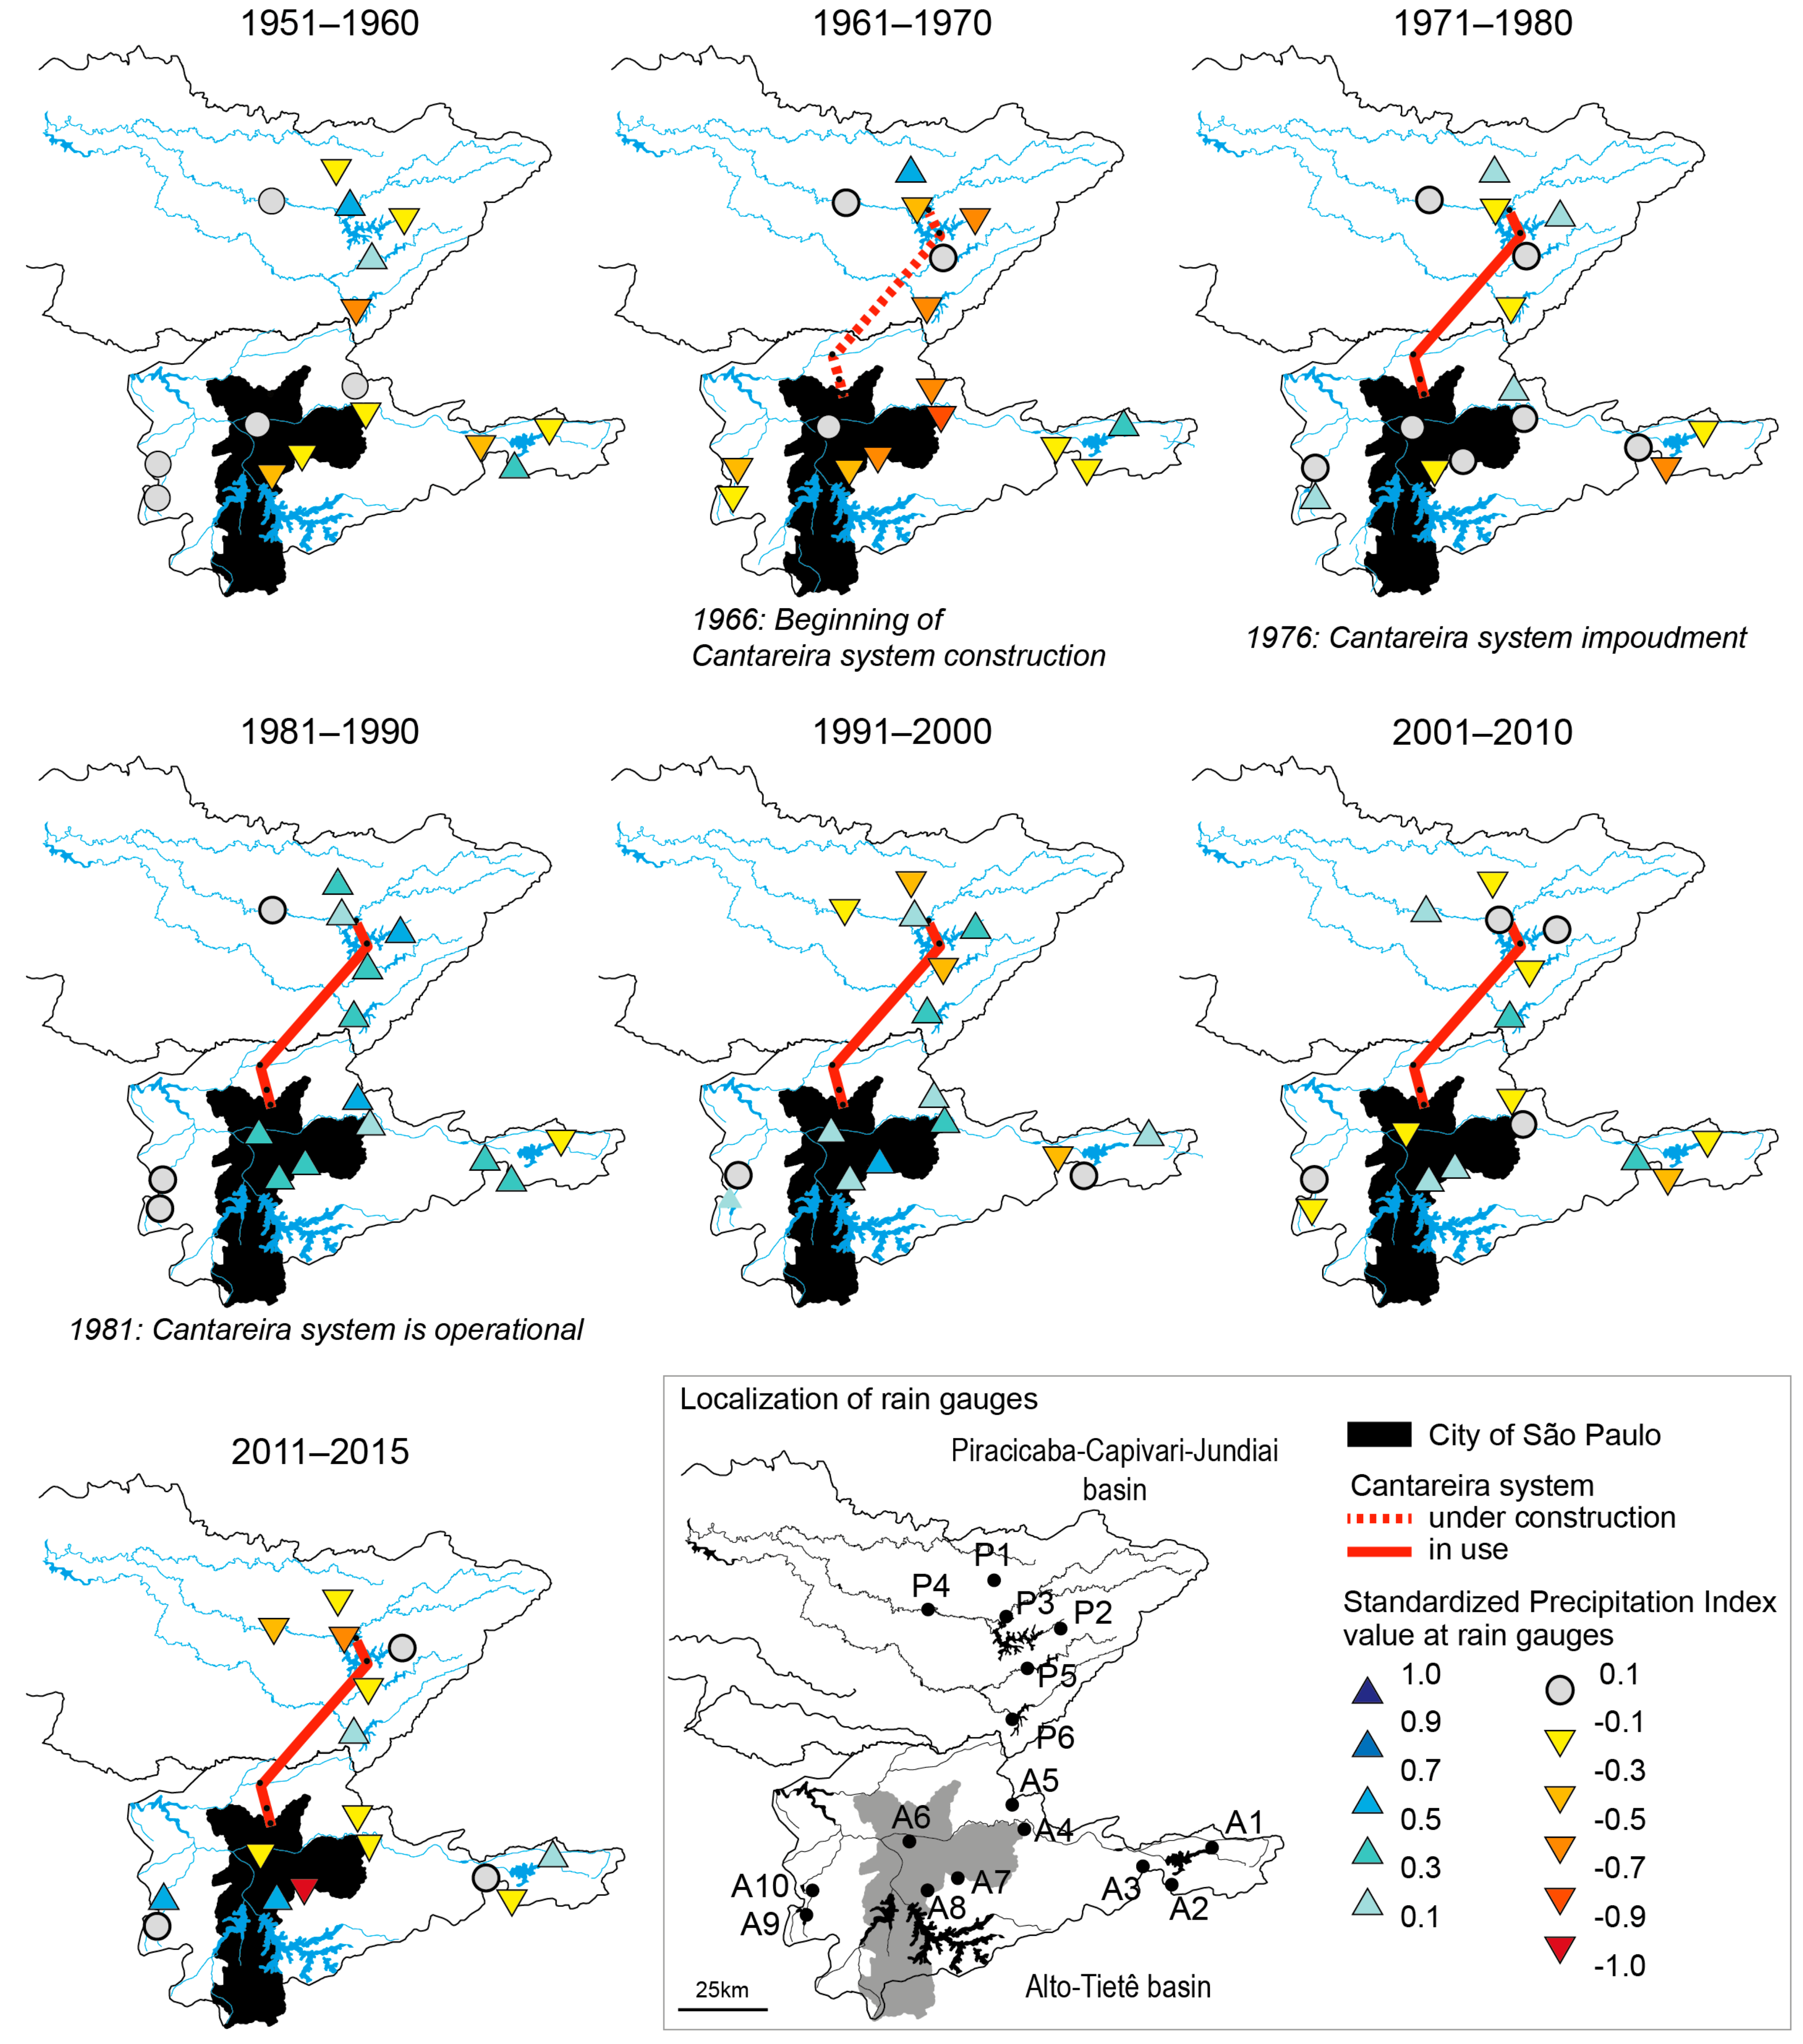
4.3. Spatial and Temporal Distribution of Precipitation Since 1951
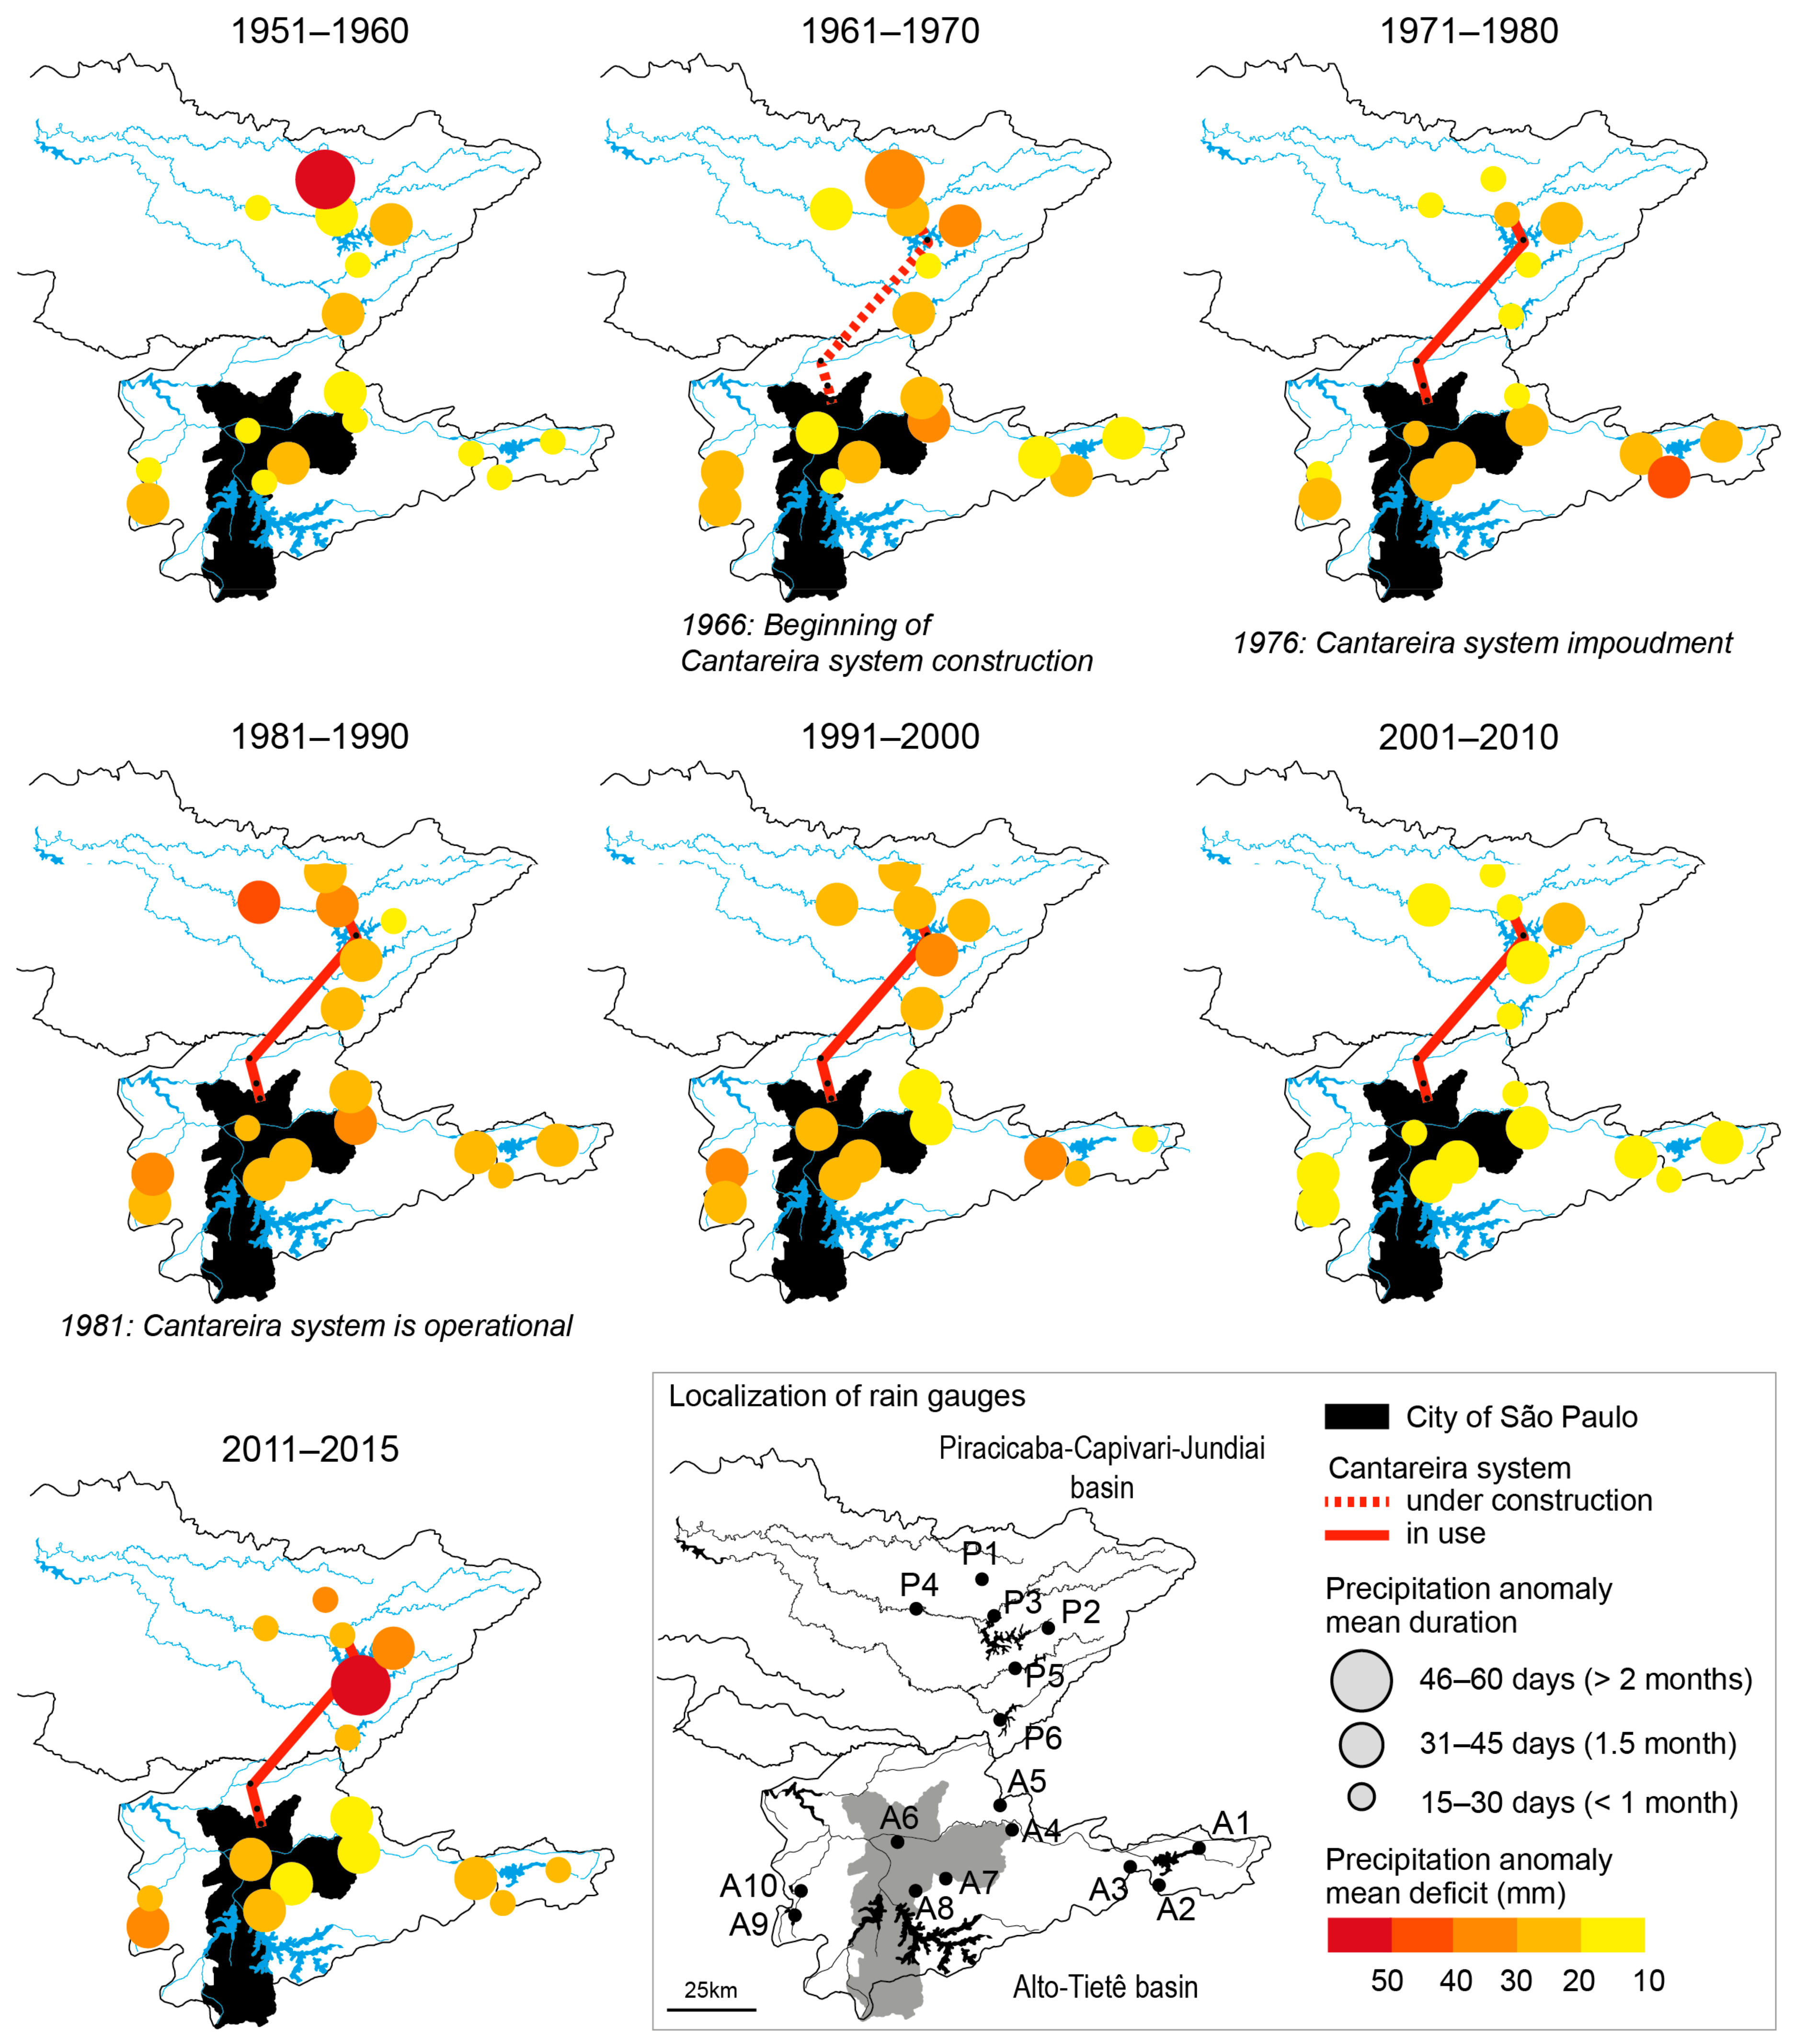
4.4. Precipitation Anomalies Since 1951
4.5. Hydrological Anomalies Since 1951
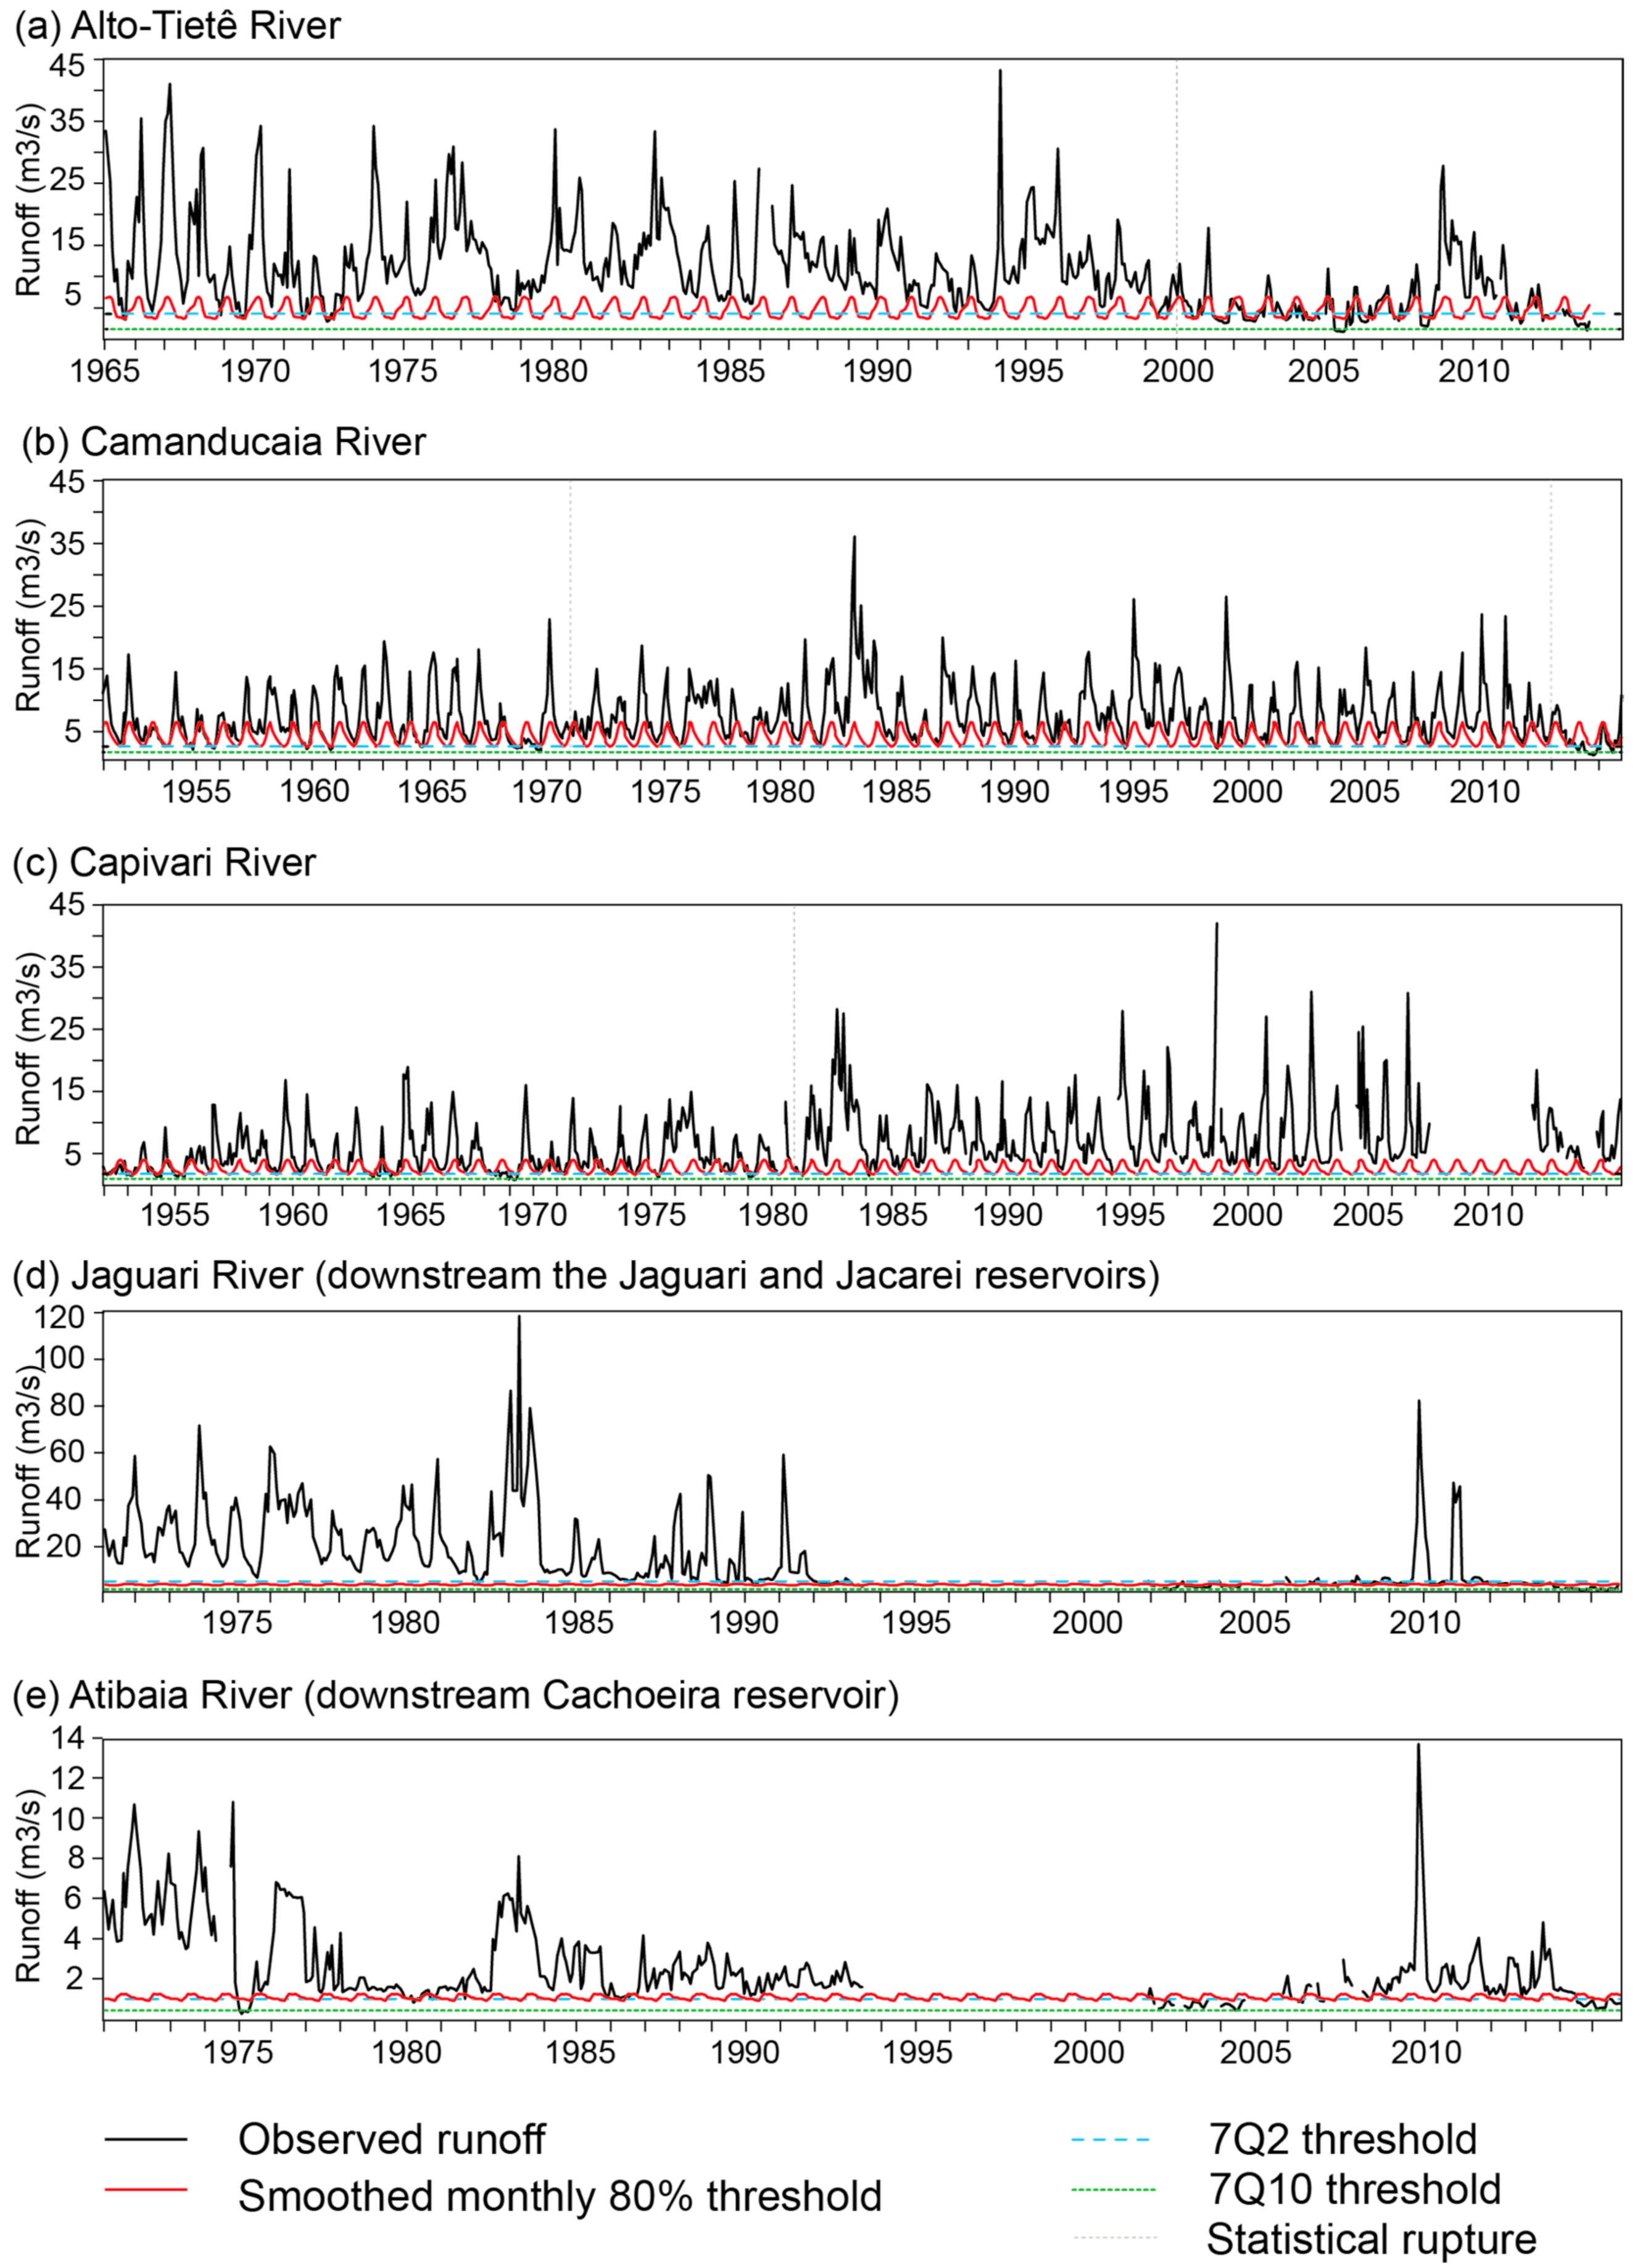
4.5.1. Thresholds to Pinpoint the Severity of Hydrological Droughts
4.5.2. Hydrological Droughts in the Alto-Tietê Basin
4.5.3. Hydrological Droughts in the Headwaters of the PCJ Basin
5. Discussion
5.1. Overview of Precipitation and Runoff Long-Term Trends
5.2. Overview of the Hydro-Climatic Context of the 2011–2015 Water Crisis
5.3. Coping With the Risk of Water Crisis
6. Conclusions
Author Contributions
Funding
Acknowledgments
Conflicts of Interest
References
- OECD—Organisation for Economic Cooperation and Development. Governança dos Recursos hídricos No Brasil; OECD Publishing: Paris, France, 2015; ISBN 978-92-64-23816-9. [Google Scholar]
- FAO—Food and Agriculture Organization of the United Nations. AQUASTAT Main Database, Food and Agriculture Organization of the United Nations (FAO). Available online: http://www.fao.org/nr/water/aquastat/data/query/ (accessed on 9 August 2018).
- ANA—Agência Nacional de Aguas. Conjuntura dos Recursos Hídricos No Brasil: Regiões hidrográficas Brasileiras. Edição Especial; Agência Nacional de Aguas, Ministéria do Meio Ambiente: Brasília, Brazil, 2015; 162p, ISBN 978-85-8210-027-1.
- ANA—Agência Nacional de Aguas. Encarte Especial Sobre a Crise Hídrica. Conjuntura dos Recursos Hídricos No Brasil; Agência Nacional de Aguas, Ministéria do Meio Ambiente: Brasília, Brazil, 2015; 31p.
- Jacobi, P.; Cibim, J.; Leão, R. Crise na macrometrópole paulista e respostas da sociedade civil. Estudos Avançados 2015, 29, 27–42. [Google Scholar] [CrossRef]
- Getirana, A. Extreme water deficit in Brazil detected from space. J. Hydrometeorol. 2016, 17, 591–599. [Google Scholar] [CrossRef]
- Nobre, C.; Marengo, J.; Seluchi, M.; Cuartas, A.; Alves, L. Some characteristics and impacts of the drought and water crisis in Southeastern Brazil during 2014 and 2015. J. Water Resour. Protect. 2016, 8, 252–262. [Google Scholar] [CrossRef]
- Soriano, E.; Londe, L.; Di Gregorio, L.; Coutinho, M.; Santos, L. Water crisis in São Paulo evaluated under the disaster’s point of view. Ambiente Soc. 2016, XIX, 21–39. [Google Scholar] [CrossRef]
- Emplasa. Região Metropolitana de São Paulo. Available online: https://www.emplasa.sp.gov.br/RMSP (accessed on 9 August 2018).
- Cortes, P.; Torrente, M.; Filho, A.; Ruiz, M.; Dias, A.; Rodrigues, R. Crise de abastecimento de água em São Paulo e falta de planejamento estratégico. Estudos Avançados 2015, 29, 7–26. [Google Scholar] [CrossRef]
- Gerberg, J. A Megacity without water: São Paulo’s drought. Time, 13 October 2015. Available online: http://time.com/4054262/drought-brazil-video/ (accessed on 9 August 2018).
- Romero, S. Taps start to run dry in Brazil’s largest city. São Paulo water crisis linked to growth, pollution and deforestation. The New York Times, 16 February 2015. Available online: https://www.nytimes.com/2015/02/17/world/americas/drought-pushes-sao-paulo-brazil-toward-water-crisis.html (accessed on 9 August 2018).
- Lobel, F. Sistema Cantareira passa a ter faixas de segurança contra períodos de seca. Folha de S.Paulo, 31 May 2017. Available online: https://www1.folha.uol.com.br/cotidiano/2017/05/1889154-sistema-cantareira-passa-a-ter-faixas-de-seguranca-contra-seca.shtml (accessed on 9 August 2018).
- Stefano, D. Governo de São Paulo não aprendeu com a crise da água, afriman especialitas. Modelo de gestão dos recursos hídricos continua inalterado desde os primeiros sinais de desabastecimento. Brasil de Fato, 22 March 2017. Available online: https://www.brasildefato.com.br/2017/03/22/governo-de-São-paulo-nao-aprendeu-com-a-crise-da-agua-afirmam-especialistas/ (accessed on 9 August 2018).
- Seth, A.; Fernandes, K.; Camargo, S. Two summers of São Paulo drought: Origins in the western tropical Pacific. Geophys. Res. Lett. 2015, 42, 10–816. [Google Scholar] [CrossRef]
- Silva, W.; Nascimento, M.; Menezes, W. Atmospheric blocking in the South Atlantic during the summer 2014: A synoptic analysis of the phenomenon. Atmos. Clim. Sci. 2015, 5, 386–393. [Google Scholar] [CrossRef]
- Oliveira, F.; Carvalho, L.; Ambrizzi, T. A new climatology for southern hemisphere blockings in the winter and the combined effect of ENSO and SAM phases. Int. J. Climatol. 2014, 34, 1676–1692. [Google Scholar] [CrossRef]
- Coelho, C.; De Oliveira, C.; Ambrizzi, T.; Rebolta, M.; Carpenedo, C.; Campos, J.; Tomaziello, A.; Pampuch, L.; Custodio, M.; Dutra, L.; et al. The 2014 southeast Brazil austral summer drought: Regional scale mechanisms and teleconnections. Clim. Dyn. 2016, 46, 3737–3752. [Google Scholar] [CrossRef]
- Coelho, C.; Cardoso, D.; Firpo, M. Precipitation diagnostics of an exceptionally dry event in São Paulo, Brazil. Theor. Appl. Climatol. 2015, 125, 769–784. [Google Scholar] [CrossRef]
- SABESP—Companhia de Saneamento Basico do Estado de Sao Paulo. Sustainability Report 2014; SABESP: São Paulo, Brazil, 2014. [Google Scholar]
- Coutinho, R.; Kraenkel, R.; Prado, P. Catastrophic regime shift in water reservoirs and São Paulo water supply crisis. PLoS ONE 2015, 10, e0138278. [Google Scholar] [CrossRef] [PubMed]
- IBGE—Instituto Brasileiro de Geografia e Estatística. São Paulo. Produto Interno Bruto dos Municípios 2015. Available online: http://cod.ibge.gov.br/ (accessed on 9 August 2018).
- CETESB—Companhia Ambiantal do Estado de São Paulo. Qualidade das águas superficias no estado de São Paulo 2014; CETESB: São Paulo, Brazil, 2015; ISBN 978-85-9467-062-5.
- Cunha, D.; Sabogal-Paz, L.; Dodds, W. Land use influence on raw surface water quality and treatment costs for drinking supply in São Paulo State (Brazil). Ecol. Eng. 2016, 516–524. [Google Scholar] [CrossRef]
- Nobre, A. The Future Climate of Amazonia; Scientific Assessment Report; Articulación Regional Amazônica: São Jose dos Campos, Brazil, 2014; ISBN 978-85-17-00074-4. [Google Scholar]
- Dobrovolski, R.; Rattis, L. Water collapse in Brazil: The danger of relying on what you neglect. Nat. Conserv. 2015, 13, 80–83. [Google Scholar] [CrossRef]
- Cohen, D. The rationed city: The politics of water, housing and land use in drought-parched São Paulo. Public Cult. 2016, 22, 261–289. [Google Scholar] [CrossRef]
- Marengo, J.; Alves, L. Crise hídrica em São Paulo em 2014: Seca e desmatamento. Geousp Espaço e Tempo 2016, 19, 485–494. [Google Scholar] [CrossRef]
- De Lima, G.; Lombardo, M.; Magana, V. Urban water supply and the changes in the precipitation patterns in the metropolitan area of São Paulo—Brazil. Appl. Geogr. 2018, 94, 223–229. [Google Scholar] [CrossRef]
- Millington, N. Producing water scarcity in São Paulo, Brazil: The 2014–2015 water crisis and the binding politics of infrastructure. Polit. Geogr. 2018, 65, 26–34. [Google Scholar] [CrossRef]
- Otto, F.; Coelho, C.; King, A.; Coughlan de Perez, E.; Wada, Y.; van Oldenborgh, G.; Haarsma, R.; Haustein, K.; Uhe, P.; van Aalst, M.; et al. Factors other than Climate Change, main drivers of 2014/15 water shortage in Southeast Brazil. Bull. Am. Meteorol. Soc. 2015, 96, S35–S40. [Google Scholar] [CrossRef]
- Miranda, G.M.; Reynard, E.; Milano, M.; Guerrin, J. Les caractéristiques climatiques de la crise hydrique de 2013-2014 dans la région métropolitaine de São Paulo, Brésil. In Climat et pollution de l’air. In Proceedings of the XXIXe Conference of the “Association Internationale de Climatologie”, Besançon, France, 6–9 July 2016; pp. 469–47492018. Available online: http://www.climato.be/aic/colloques.html (accessed on 9 August 2018).
- Johnson, R.; Kemper, K. Institutional and Policy Analysis of River Basin Management. The Alto-Tietê River basin, São Paulo, Brazil; World Bank Policy Research Working Paper 3650; World Bank: Washington, DC, USA, 2005; 53p. [Google Scholar]
- Aparecida de Mello-Théry, N. Conservation of natural areas in São Paulo. Estud. Av. 2011, 25, 175–187. [Google Scholar] [CrossRef]
- Bonduki, N. The urban development model of São Paulo needs to be reversed. Estud. Av. 2011, 25, 23–35. [Google Scholar] [CrossRef]
- DAEE—Departamento de Aguas e Energia Elétrica. Plano Estadual de Recursos Hídricos 2004/2007. Resumo; DAEE: São Paulo, Brazil, 2007.
- SEADE—Fundação Sistema Estadual de Análise de Dados. Portal de estatísticas do estado de São Paulo. Available online: http://www.imp.seade.gov.br/frontend/#/perfil (accessed on 9 August 2018).
- Consórcio, P.C.J. Sistema Cantareira: Um Mar de Desafios; Consórcio PCJ: São Paulo, Brazil, 2013; 26p. [Google Scholar]
- Rodrigues, D.; Gupta, H.; Serrat-Capdevila, A.; Oliveira, P.; Mendiondo, E.; Maddock, T.; Mahmoud, M. Contrasting American and Brazilian systems for water allocation and transfers. J. Water Resour. Plann. Manag. 2014, 140, 04014087-1–04014087-11. [Google Scholar] [CrossRef]
- Kelman, J. Water supply to the two largest Brazilian metropolitan regions. Aquat. Proced. 2015, 5, 13–21. [Google Scholar] [CrossRef]
- Erpicum, M.; Binard, M.; Peters, J.P.; Alexandre, J. Une méthode d’analyse des caractéristiques de la saison des pluies en région sahélienne. In Actes des Journées de climatologie. In Proceedings of the Journées de Climatologie, Liège, Belgium, 5–7 November 1987; Erpicum, M., Ed.; Presses Universitaires de Liège: Liège, Belgium, 1987; pp. 43–56. [Google Scholar]
- Kouassi, A.; Kouamé, K.; Koffi, Y.; Dje, K.; Paturel, E.; Oulare, S. Analyse de la variabilité climatique et de ses influences sur les régimes pluviométriques saisonniers en Afrique de l’Ouest: Cas du basin versant du N’zi (Bandama) en Côte d’Ivoire. Cybergeo Eur. J. Geography. Environ. Nat. Paysag. 2010, 513, 29. [Google Scholar] [CrossRef]
- Pardé, M. Fleuves et Rivières; A. Collin: Paris, France, 1933. [Google Scholar]
- Pettitt, A.N. A non-parametric approach to the change-point problem. Appl. Stat. 1979, 28, 126–135. [Google Scholar] [CrossRef]
- Lee, A.; Heghinian, S. A shift of the mean level in a sequence of independent normal random variables—A Bayesian approach. Technometrics 1977, 19, 503–506. [Google Scholar]
- Buishand, T. Some methods for testing the homogeneity of rainfall records. J. Hydrol. 1982, 58, 11–27. [Google Scholar] [CrossRef]
- Hubert, P.; Carbonnel, J.; Chaouche, A. Segmentation des séries hydro et météorologiques. Application à des séries de précipitations et de débits de l’Afrique de l’Ouest. J. Hydrol. 1989, 110, 349–367. [Google Scholar] [CrossRef]
- IRD—Institut de Recherche Pour le Développment. KhronoStat Version 1.0; Software IRD: Montpellier, France, 1998; Available online: http://www.hydrosciences.org/spip.php?article1000 (accessed on 9 August 2018).
- McKee, T.B.; Doesken, N.J.; Kleist, J. The relationship of drought frequency and duration to time scale. In Proceedings of the Eighth Conference on Applied Climatology, Anaheim, CA, USA, 17–22 January 1993; American Meteorological Society: Boston, MA, USA, 1993; pp. 179–184. [Google Scholar]
- WMO—World Meteorological Organization. Standardized Precipitation Index User Guide; WMO: Geneva, Switzerland, 2012; ISBN 978-92-63-11091-6. [Google Scholar]
- Edwards, D.C.; McKee, T.B. Characteristics of 20th Century Drought in the United States at Multiple Time Scale; Climatology Report 97-2; Department of Atmospheric Science, Colorado State University: Fort Collins, KO, USA, 1997. [Google Scholar]
- Tallaksen, L.; Van Lanen, H. Hydrological Drought: Processes and Estimation Methods for Streamflow and Groundwater; Elsevier: Amsterdam, The Netherlands; Boston, MA, USA, 2004; Volume 48. [Google Scholar]
- Van Loon, A.; Van Lanen, H. A process-based typology of hydrological drought. Hydrol. Earth Syst. Sci. 2012, 16, 1915–1946. [Google Scholar] [CrossRef]
- Beyene, B.; van Lanen, H.; Torfs, P. Drought Classification, Propagation Analysis and Prediction of Anomalies; Technical Report No. 37; DROUGHT-R&SPI: Wageningen, The Netherlands, 2015. [Google Scholar]
- Van Huijgevoort, M.; Hazenberg, P.; Van Lanen, H.; Uijlenhoet, R. A generic method for hydrological drought identification across different climate regions. Hydrol. Earth Syst. Sci. 2012, 16, 2437–2451. [Google Scholar] [CrossRef]
- Wong, G.; Van Lanen, H.; Torfs, P. Probabilistic analysis of hydrological drought characteristics using meteorological drought. Hydrol. Sci. J. 2013, 58, 253–270. [Google Scholar] [CrossRef]
- Smakhtin, V. Low flow hydrology: A review. J. Hydrol. 2001, 240, 147–186. [Google Scholar] [CrossRef]
- Risley, J.; Stonewall, A.; Haluska, T. Estimating Flow-Duration and Low-Flow Frequency Statistics for Unregulated Streams in Oregon; U.S. Geological Survey Scientific Investigations Report 2008–5126, Revision 1.1; US Geological Survey: Reston, VA, USA, 2009.
- MathWave. EasyFit—Distribution Fitting Made Easy. Software. Available online: http://www.mathwave.com/en/home.html (accessed on 9 August 2018).
- Ouarda, T.; Shu, C. Regional low-flow frequency analysis using single and ensemble artificial neural networks. Water Resour. Res. 2009, 45, W11428. [Google Scholar] [CrossRef]
- Requena, A.; Ouarda, T.; Chebana, F. Low-flow frequency analysis at ungauged sites based on regionally estimated streamflows. J. Hydrol. 2018, 563, 523–532. [Google Scholar] [CrossRef]
- Molugaram, K.; Rao, G. Chapter 9—Chi-Square Distribution. In Statistical Techniques for Transportation Engineering; Molugaram, K., Rao, G., Eds.; Butterworth-Heinemann: Oxford, UK, 2017; pp. 383–413. [Google Scholar]
- Stephens, M.A. EDF statistics for goodness of fit and some comparisons. J. Am. Stat. Assoc. 1974, 69, 730–737. [Google Scholar] [CrossRef]
- Masey, F., Jr. The Kolmogorov-Smirnov Test for Goodness of Fit. J. Am. Stat. Assoc. 1951, 46, 68–78. [Google Scholar] [CrossRef]
- Simoes, S.; Barros, A. Regional hydroclimatic variability and Brazil’s 2001 energy crisis. Manag. Environ. Qual. Int. J. 2007, 18, 263–273. [Google Scholar] [CrossRef]
- Franchito, H.; Rao, V.; Barbieri, P.; Santo, C. Rainy-season duration estimated from OLR versus rain gauge data and the 2001 drought in Southeast Brazil. J. Appl. Meteorol. Climatol. 2008, 47, 1493–1499. [Google Scholar] [CrossRef]
- Souza, D.; Rodriguez, M.; Reis, D. Crise ernergética 2001: Providencial e reflexiva. Rev. Educ. Tecnol. 2004, 8, 2179–6122. [Google Scholar]
- Obregón, G.; Marengo, J.; Nobre, C. Rainfall and climate variability: Long-term trends in the Metropolitan Area of São Paulo in the 20th century. Clim. Res. 2014, 61, 93–107. [Google Scholar] [CrossRef]
- Marengo, J. Climate Change and Extreme Events in Brazil; Fundação Brasileira para o Desenvolvimento Sustentável: Rio de Janeiro, Brazil, 2010. [Google Scholar]
- Gutiérrez, A.; Engle, N.; De Nys, E.; Molejon, C.; Martins, E. Drought preparedness in Brazil. Weather Clim. Extrem. 2014, 3, 95–106. [Google Scholar] [CrossRef]
- Sousa, W.; Baldwin, C.; Camkin, J.; Fidelman, P.; Silva, O.; Neto, S.; Smith, T. Water: Drought, crisis and governance in Australia and Brazil. Water 2016, 8, 493. [Google Scholar] [CrossRef]
- Autunes, L.; Thives, L.; Ghisi, E. Potential for potable water savings in buildings by using stormwater harvested from porous pavements. Water 2016, 8, 110. [Google Scholar] [CrossRef]
- Teston, A.; Geraldi, M.; Colasio, B.; Ghisi, E. Rainwater harvesting in buildings in Brazil: A literature review. Water 2018, 10, 471. [Google Scholar] [CrossRef]
- Araújo, R.; Alves, M.; de Melo, M.; Chrispim, Z.; Mendes, P.; Silva, G., Jr. Water resource management: A comparative evaluation of Brazil, Rio de Janeiro, the European Union, and Portugal. Sci. Total Environ. 2015, 511, 815–828. [Google Scholar] [CrossRef] [PubMed]
- Green, P.; Vörösmarty, C.; Harrison, I.; Farrell, T.; Sáenz, L.; Fekete, B. Freshwater ecosystem services supporting humans: Pivoting from water crisis to water solutions. Glob. Environ. Chang. 2015, 34, 108–118. [Google Scholar] [CrossRef]
- Mattos, J.; Santos, D.; Filho, C.; Santos, T.; Santos, M.; Paula, F. Water production in a Brazilian montane rainforest: Implications for water resources management. Environ. Sci. Pol. 2018, 84, 52–59. [Google Scholar] [CrossRef]


| Monitored River | Best-Fit Distribution | 7Q2 (m3/s) Return Period: 98 Years | 7Q10 (m3/s) Return Period: 99 Years |
|---|---|---|---|
| Alto-Tietê | Weibull | 4.0 | 1.5 |
| Camanducaia | GEV | 2.1 | 1.2 |
| Jaguari | Weibull | 4.6 | 1.2 |
| Atibaia | GEV | 1.0 | 0.4 |
| Capivari | GEV | 1.6 | 0.8 |
| Alto-Tietê River | Camanducaia River | Capivari River | |||||||
|---|---|---|---|---|---|---|---|---|---|
| Total Drought Events | Mean Duration (days) | Mean Deficit (m3) | Total Drought Events | Mean Duration (days) | Mean Deficit (m3) | Total Drought Events | Mean Duration (days) | Mean Deficit (m3) | |
| 1951–1960 | NA | NA | NA | 19 | 54 | 39.3 | 13 | 99 | 81.7 |
| 1961–1970 | 5 | 26 | 18.7 | 8 | 107 | 131.2 | 16 | 73 | 62.2 |
| 1971–1980 | 12 | 28 | 30.7 | 7 | 36 | 27.8 | 22 | 41 | 28.7 |
| 1981–1990 | 0 | - | - | 11 | 29 | 13.7 | 6 | 49 | 24.8 |
| 1991–2000 | 3 | 38 | 28.1 | 10 | 40 | 20.3 | 1 | 38 | 11.3 |
| 2001–2010 | 23 | 103 | 142.1 | 9 | 46 | 18.4 | 0 | - | - |
| 2011–2015 | 6 | 154 | 252.9 | 8 | 138 | 271.4 | 1 | 22 | 8.9 |
© 2018 by the authors. Licensee MDPI, Basel, Switzerland. This article is an open access article distributed under the terms and conditions of the Creative Commons Attribution (CC BY) license (http://creativecommons.org/licenses/by/4.0/).
Share and Cite
Milano, M.; Reynard, E.; Muniz-Miranda, G.; Guerrin, J. Water Supply Basins of São Paulo Metropolitan Region: Hydro-Climatic Characteristics of the 2013–2015 Water Crisis. Water 2018, 10, 1517. https://doi.org/10.3390/w10111517
Milano M, Reynard E, Muniz-Miranda G, Guerrin J. Water Supply Basins of São Paulo Metropolitan Region: Hydro-Climatic Characteristics of the 2013–2015 Water Crisis. Water. 2018; 10(11):1517. https://doi.org/10.3390/w10111517
Chicago/Turabian StyleMilano, Marianne, Emmanuel Reynard, Graziele Muniz-Miranda, and Joana Guerrin. 2018. "Water Supply Basins of São Paulo Metropolitan Region: Hydro-Climatic Characteristics of the 2013–2015 Water Crisis" Water 10, no. 11: 1517. https://doi.org/10.3390/w10111517
APA StyleMilano, M., Reynard, E., Muniz-Miranda, G., & Guerrin, J. (2018). Water Supply Basins of São Paulo Metropolitan Region: Hydro-Climatic Characteristics of the 2013–2015 Water Crisis. Water, 10(11), 1517. https://doi.org/10.3390/w10111517