Bioinformatics Approach to mTOR Signaling Pathway-Associated Genes and Cancer Etiopathogenesis
Abstract
1. Introduction
2. Materials and Methods
2.1. GeneCards
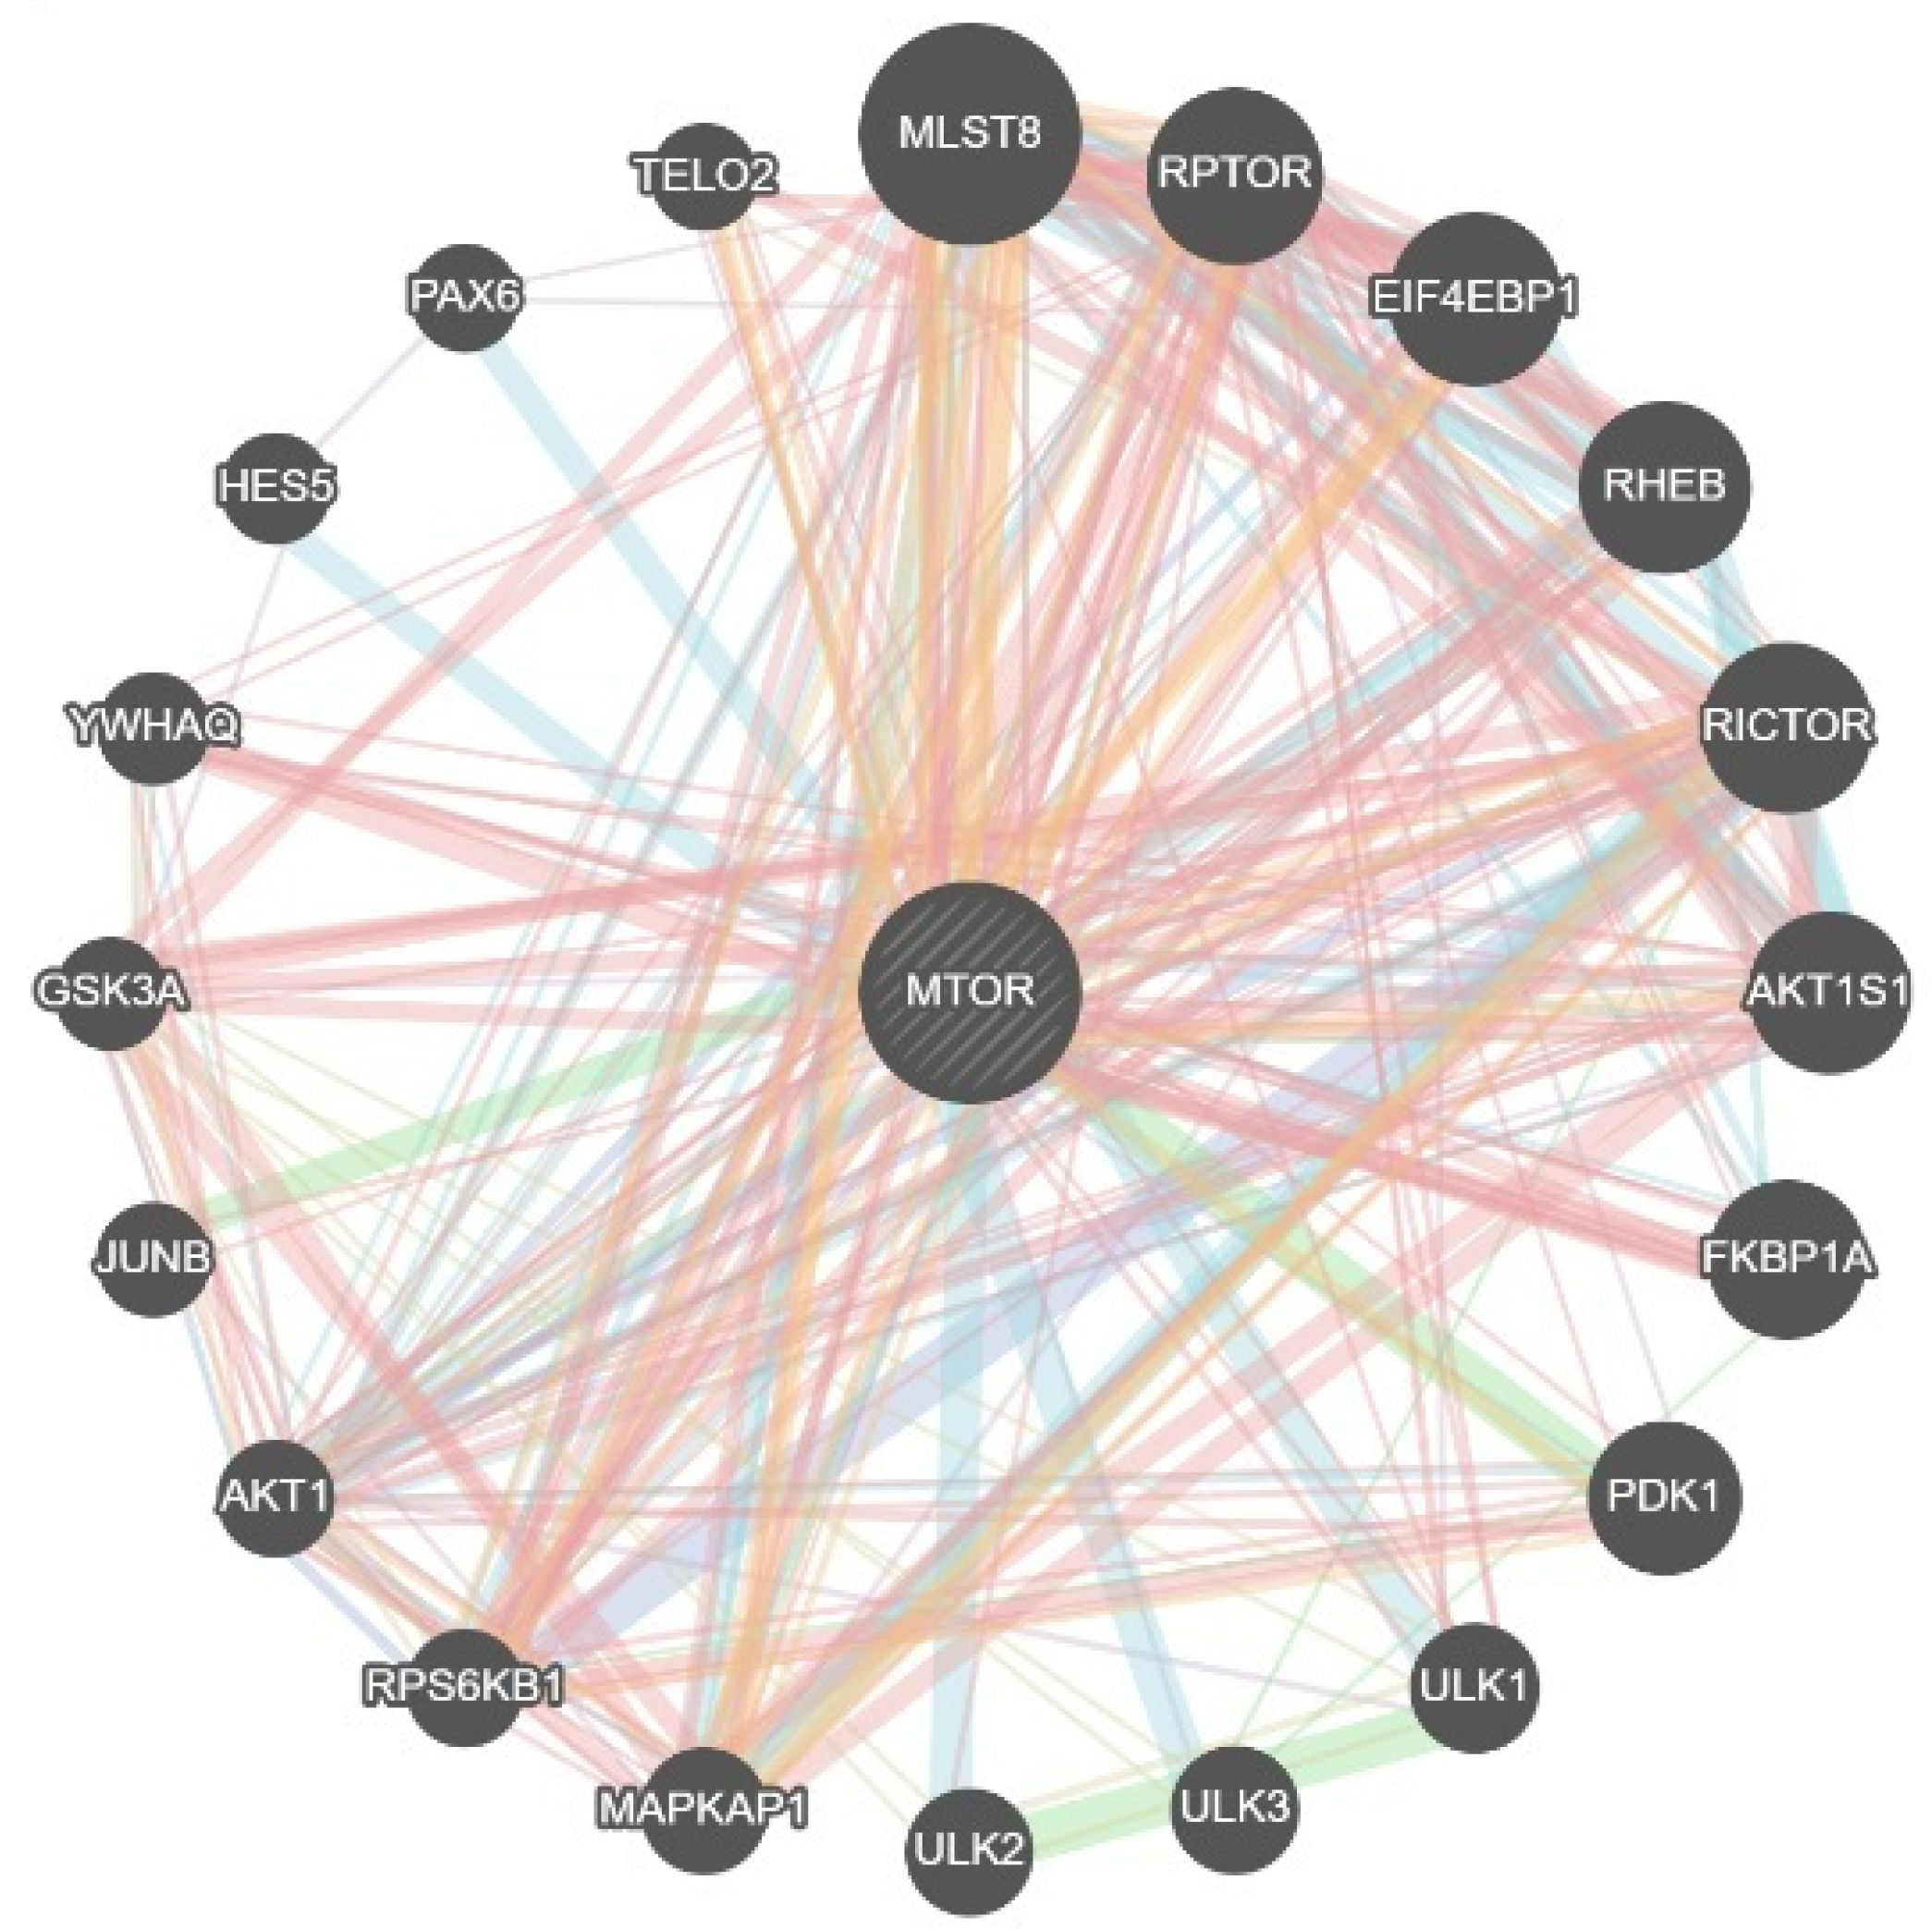
2.2. GeneMANIA
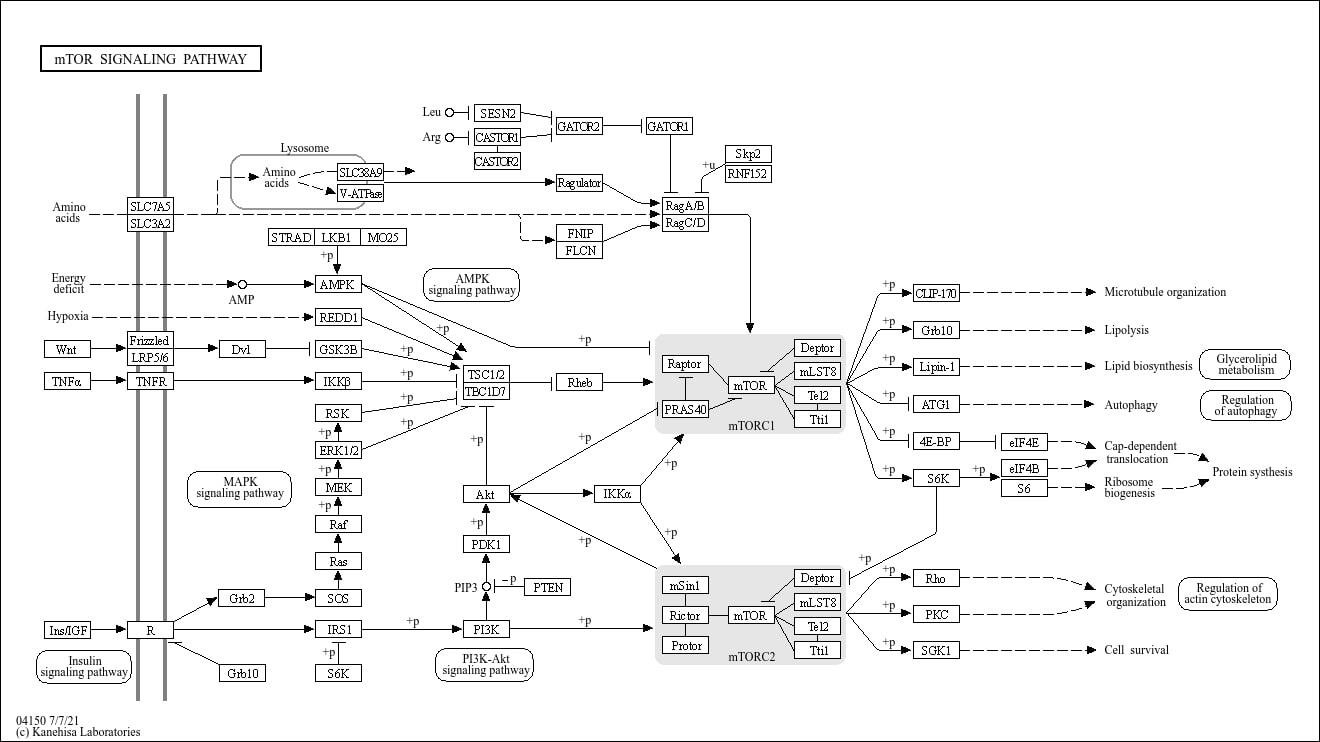
2.3. KEGG PATHWAY
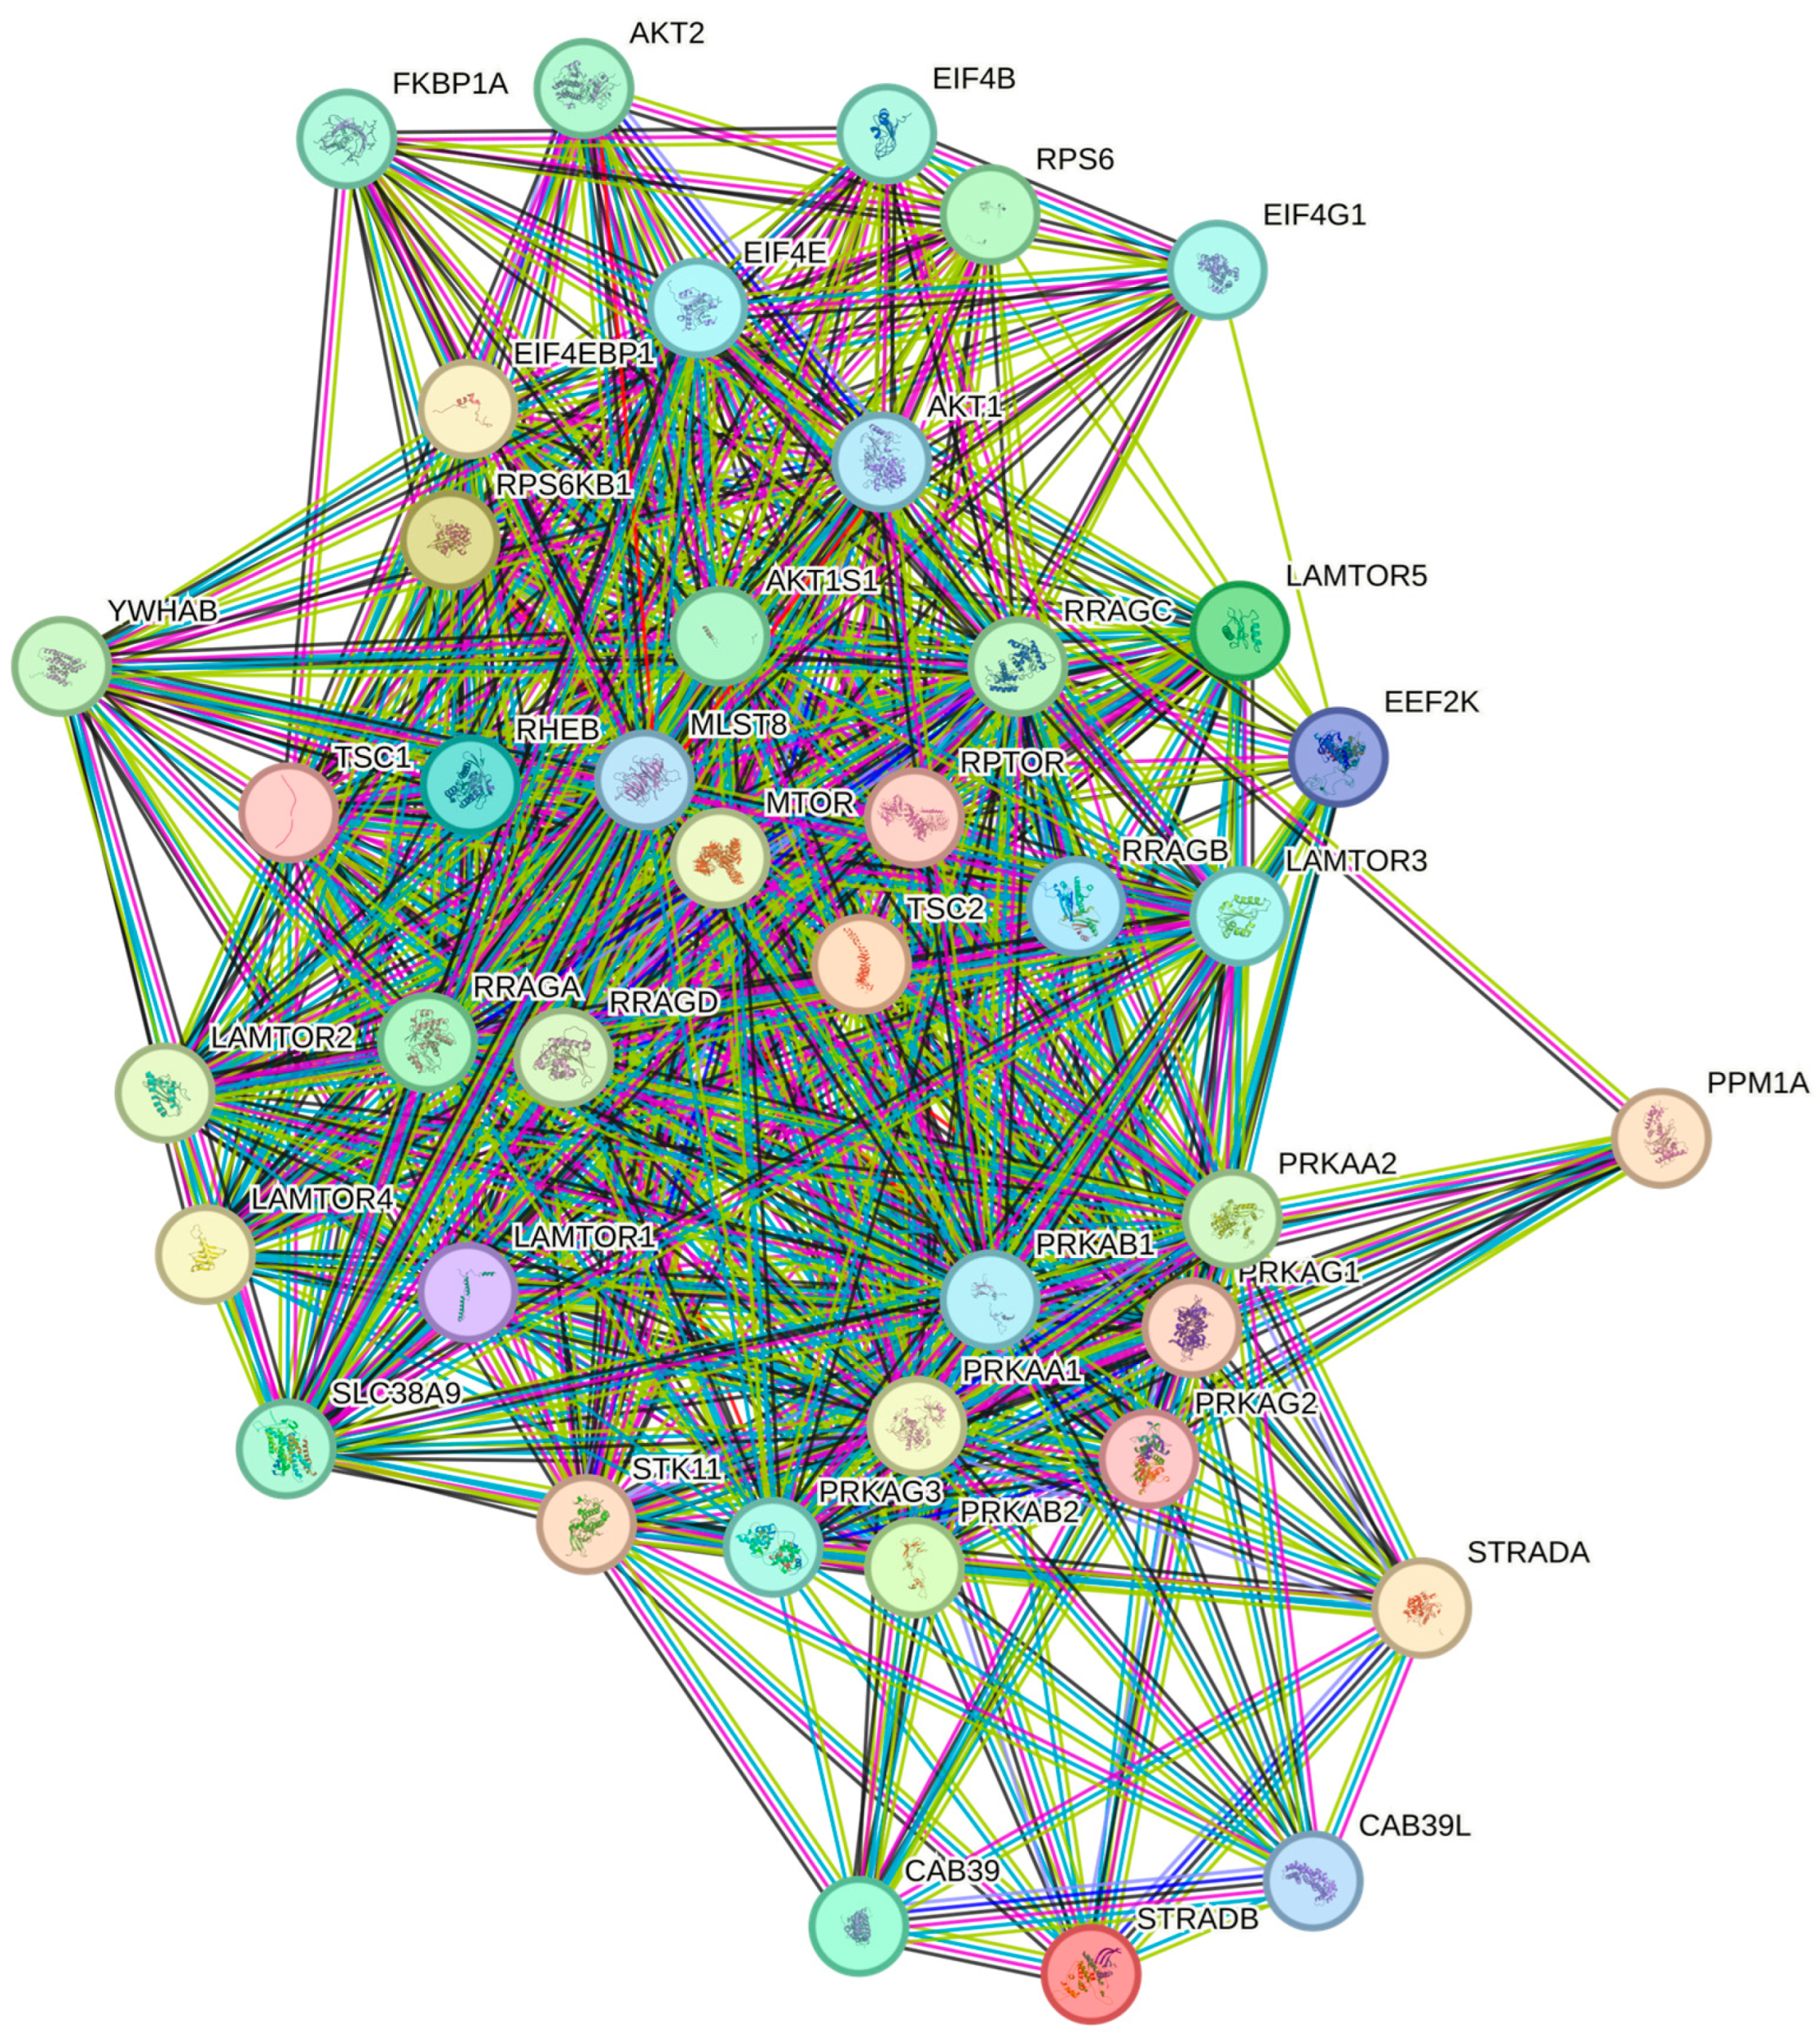
2.4. STRING
2.5. UniProtKB
2.6. PathCards
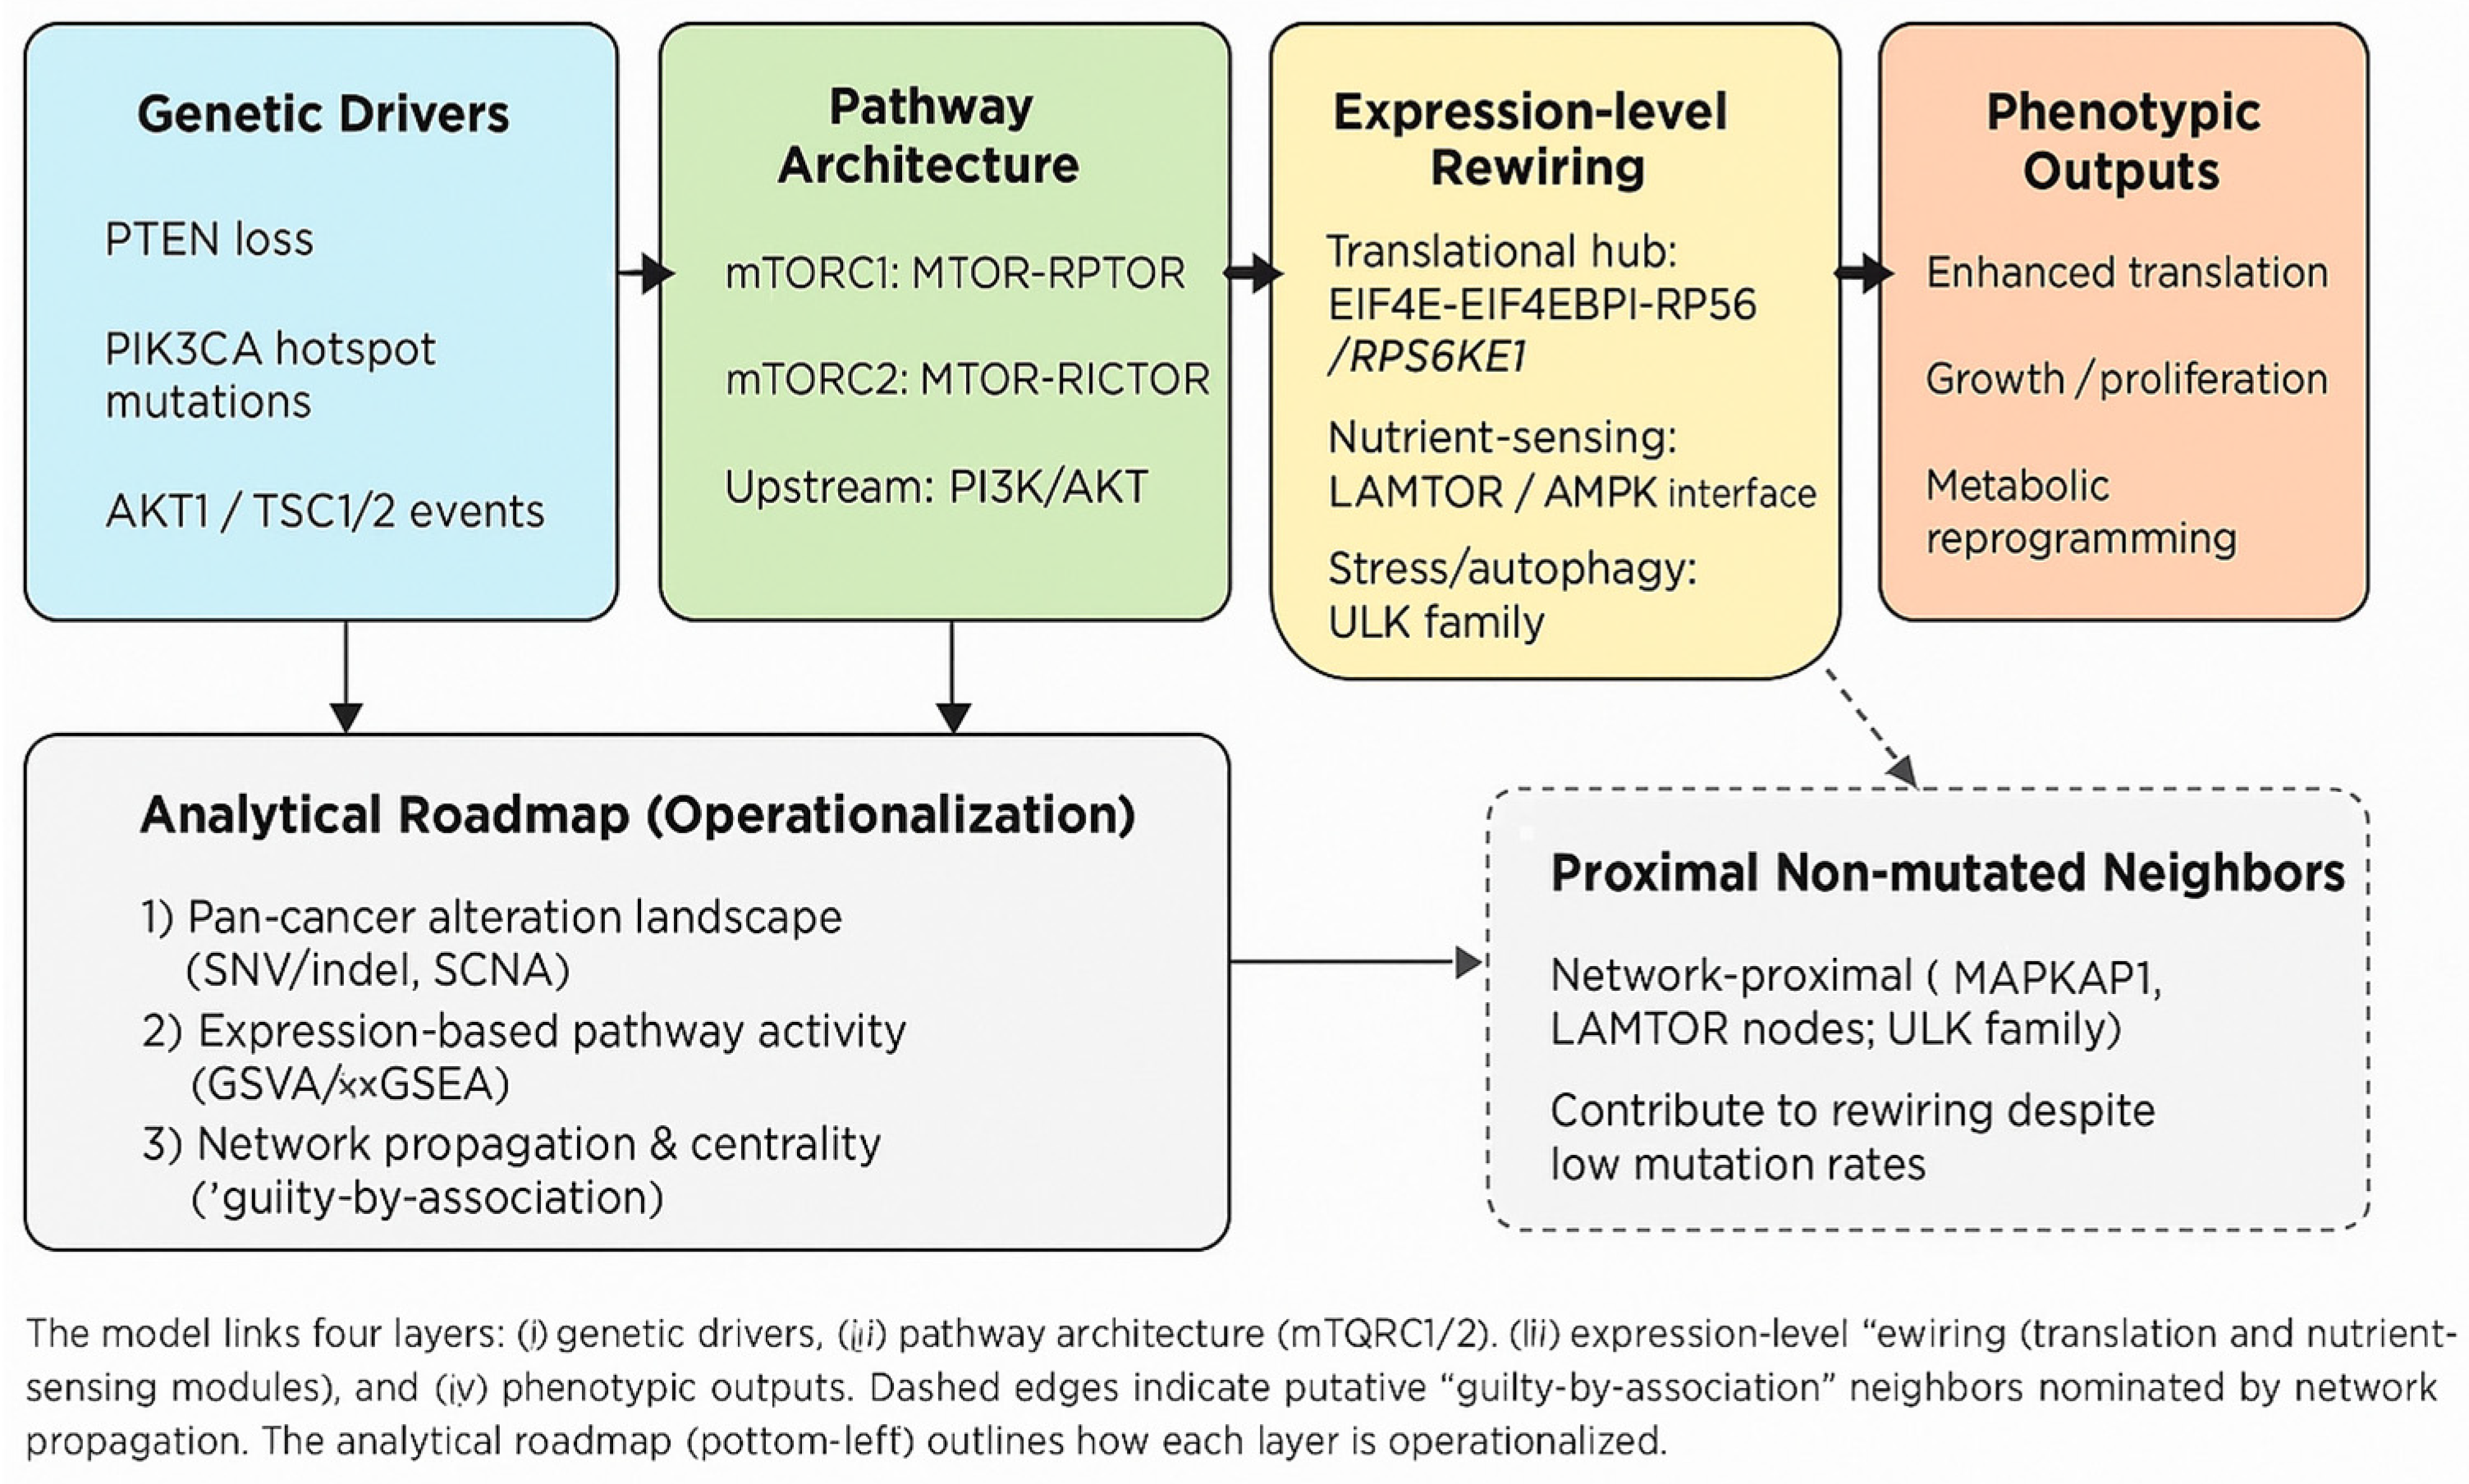
2.7. Analytical Roadmap (Operationalizing the Working Model)
2.7.1. Pan-Cancer Alteration Landscape (Tests H1)
2.7.2. Expression-Based Activity (Tests H3)
2.7.3. Network Propagation (Tests H2)
2.7.4. Mutual Exclusivity/Co-Occurrence
2.8. Statistical Analysis and Reproducibility
3. Results
3.1. Gene Set Derived from GeneCards
3.2. Functional Association Structure Around MTOR (GeneMANIA)
3.3. KEGG Pathway Context and Adjacency
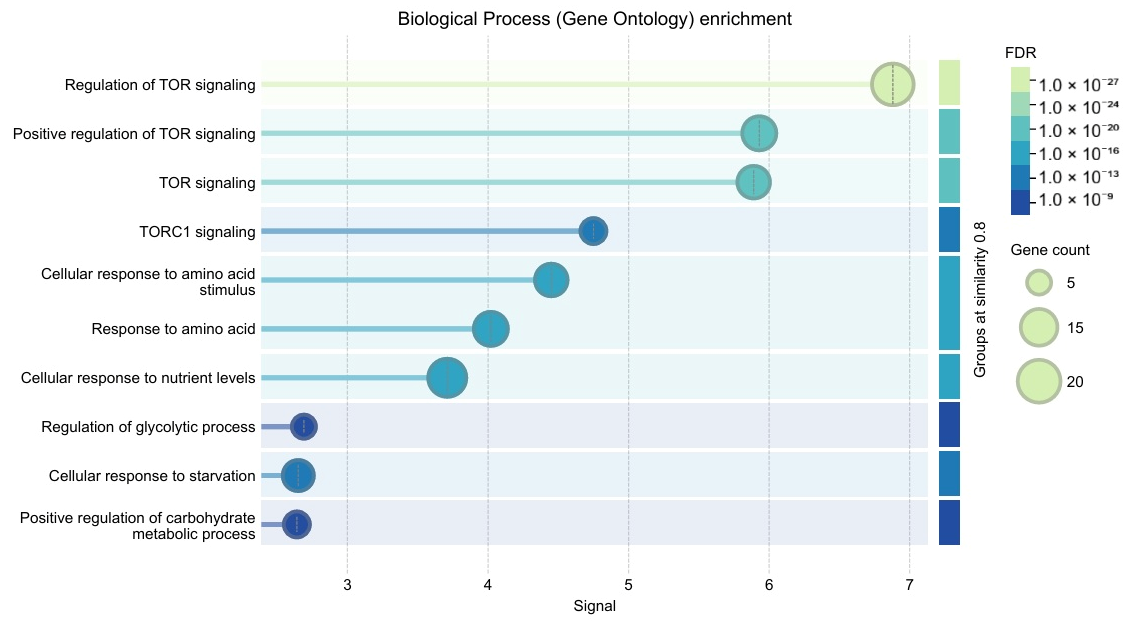
3.4. STRING Protein–Protein Interaction Network and Enrichment
3.5. MTOR Tissue Notes and Cancer-Linked Variants (UniProtKB)
3.6. Disease Associations from PathCards
3.7. Working Model and Hypotheses
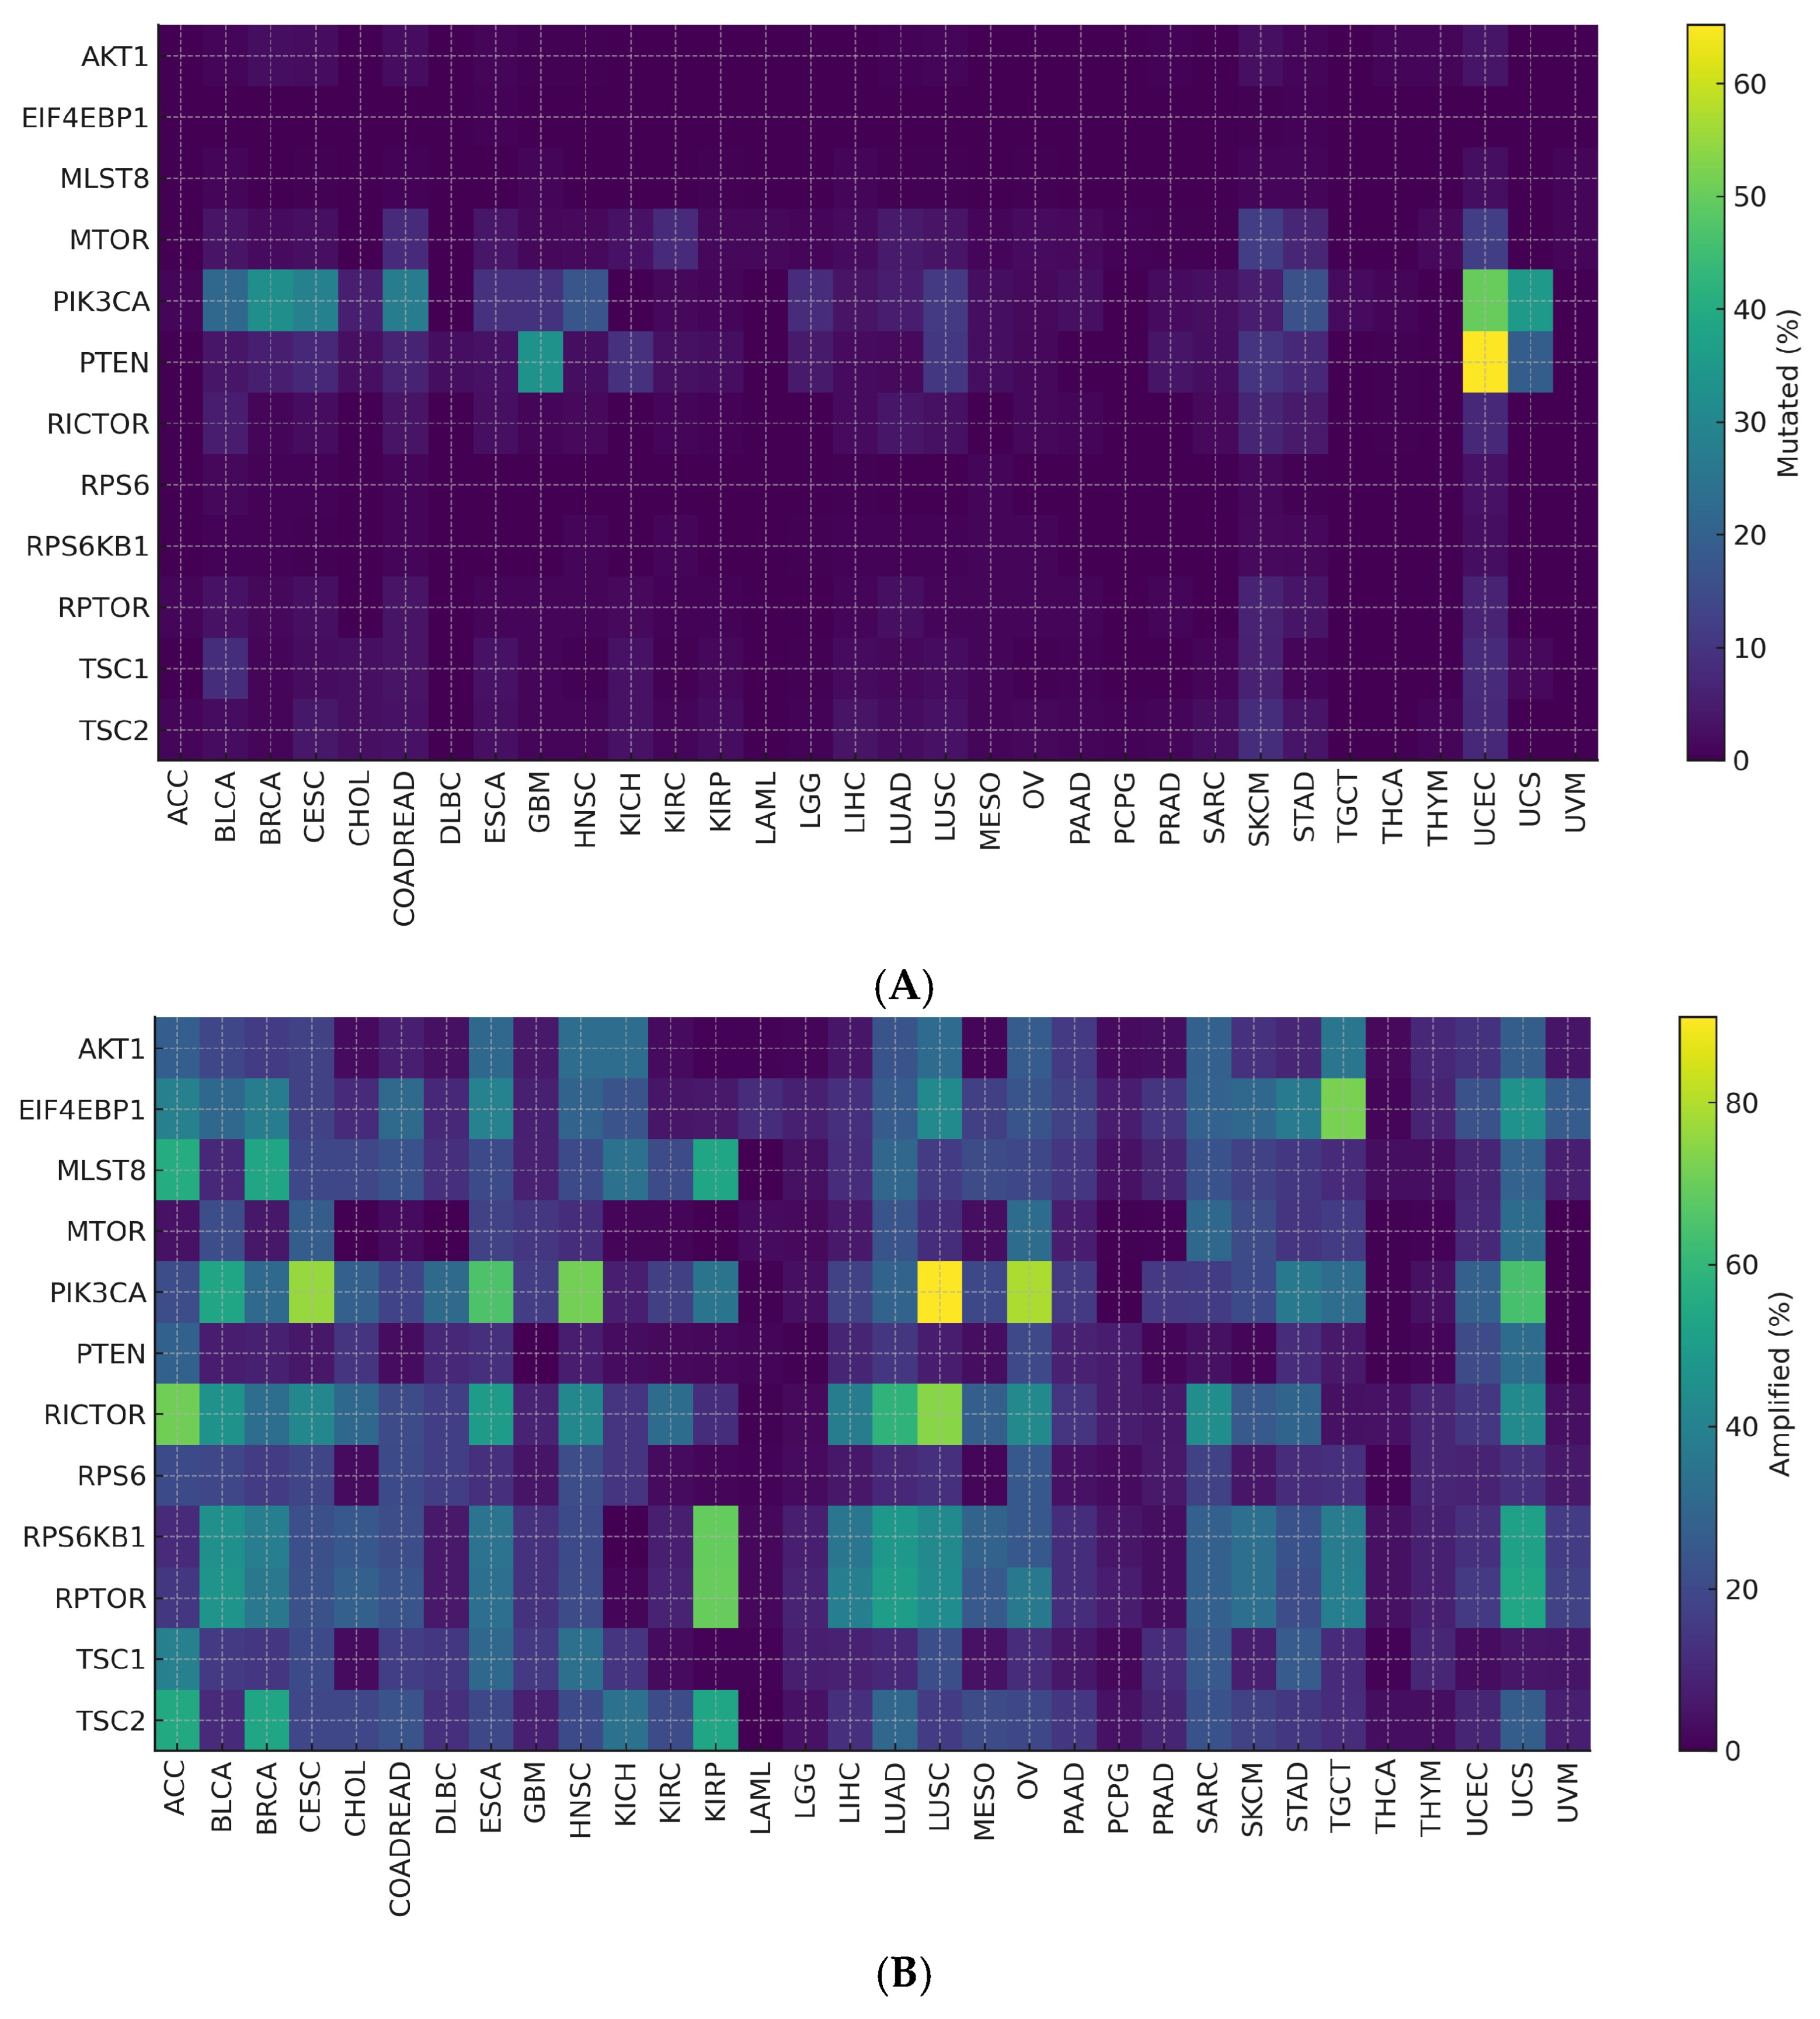
3.8. Pan-Cancer Alteration Landscape–Key Findings (H1)
3.9. Expression-Defined mTOR Activity (Tests H3)
3.10. Network Propagation and “Guilty-by-Association” Candidates (H2)
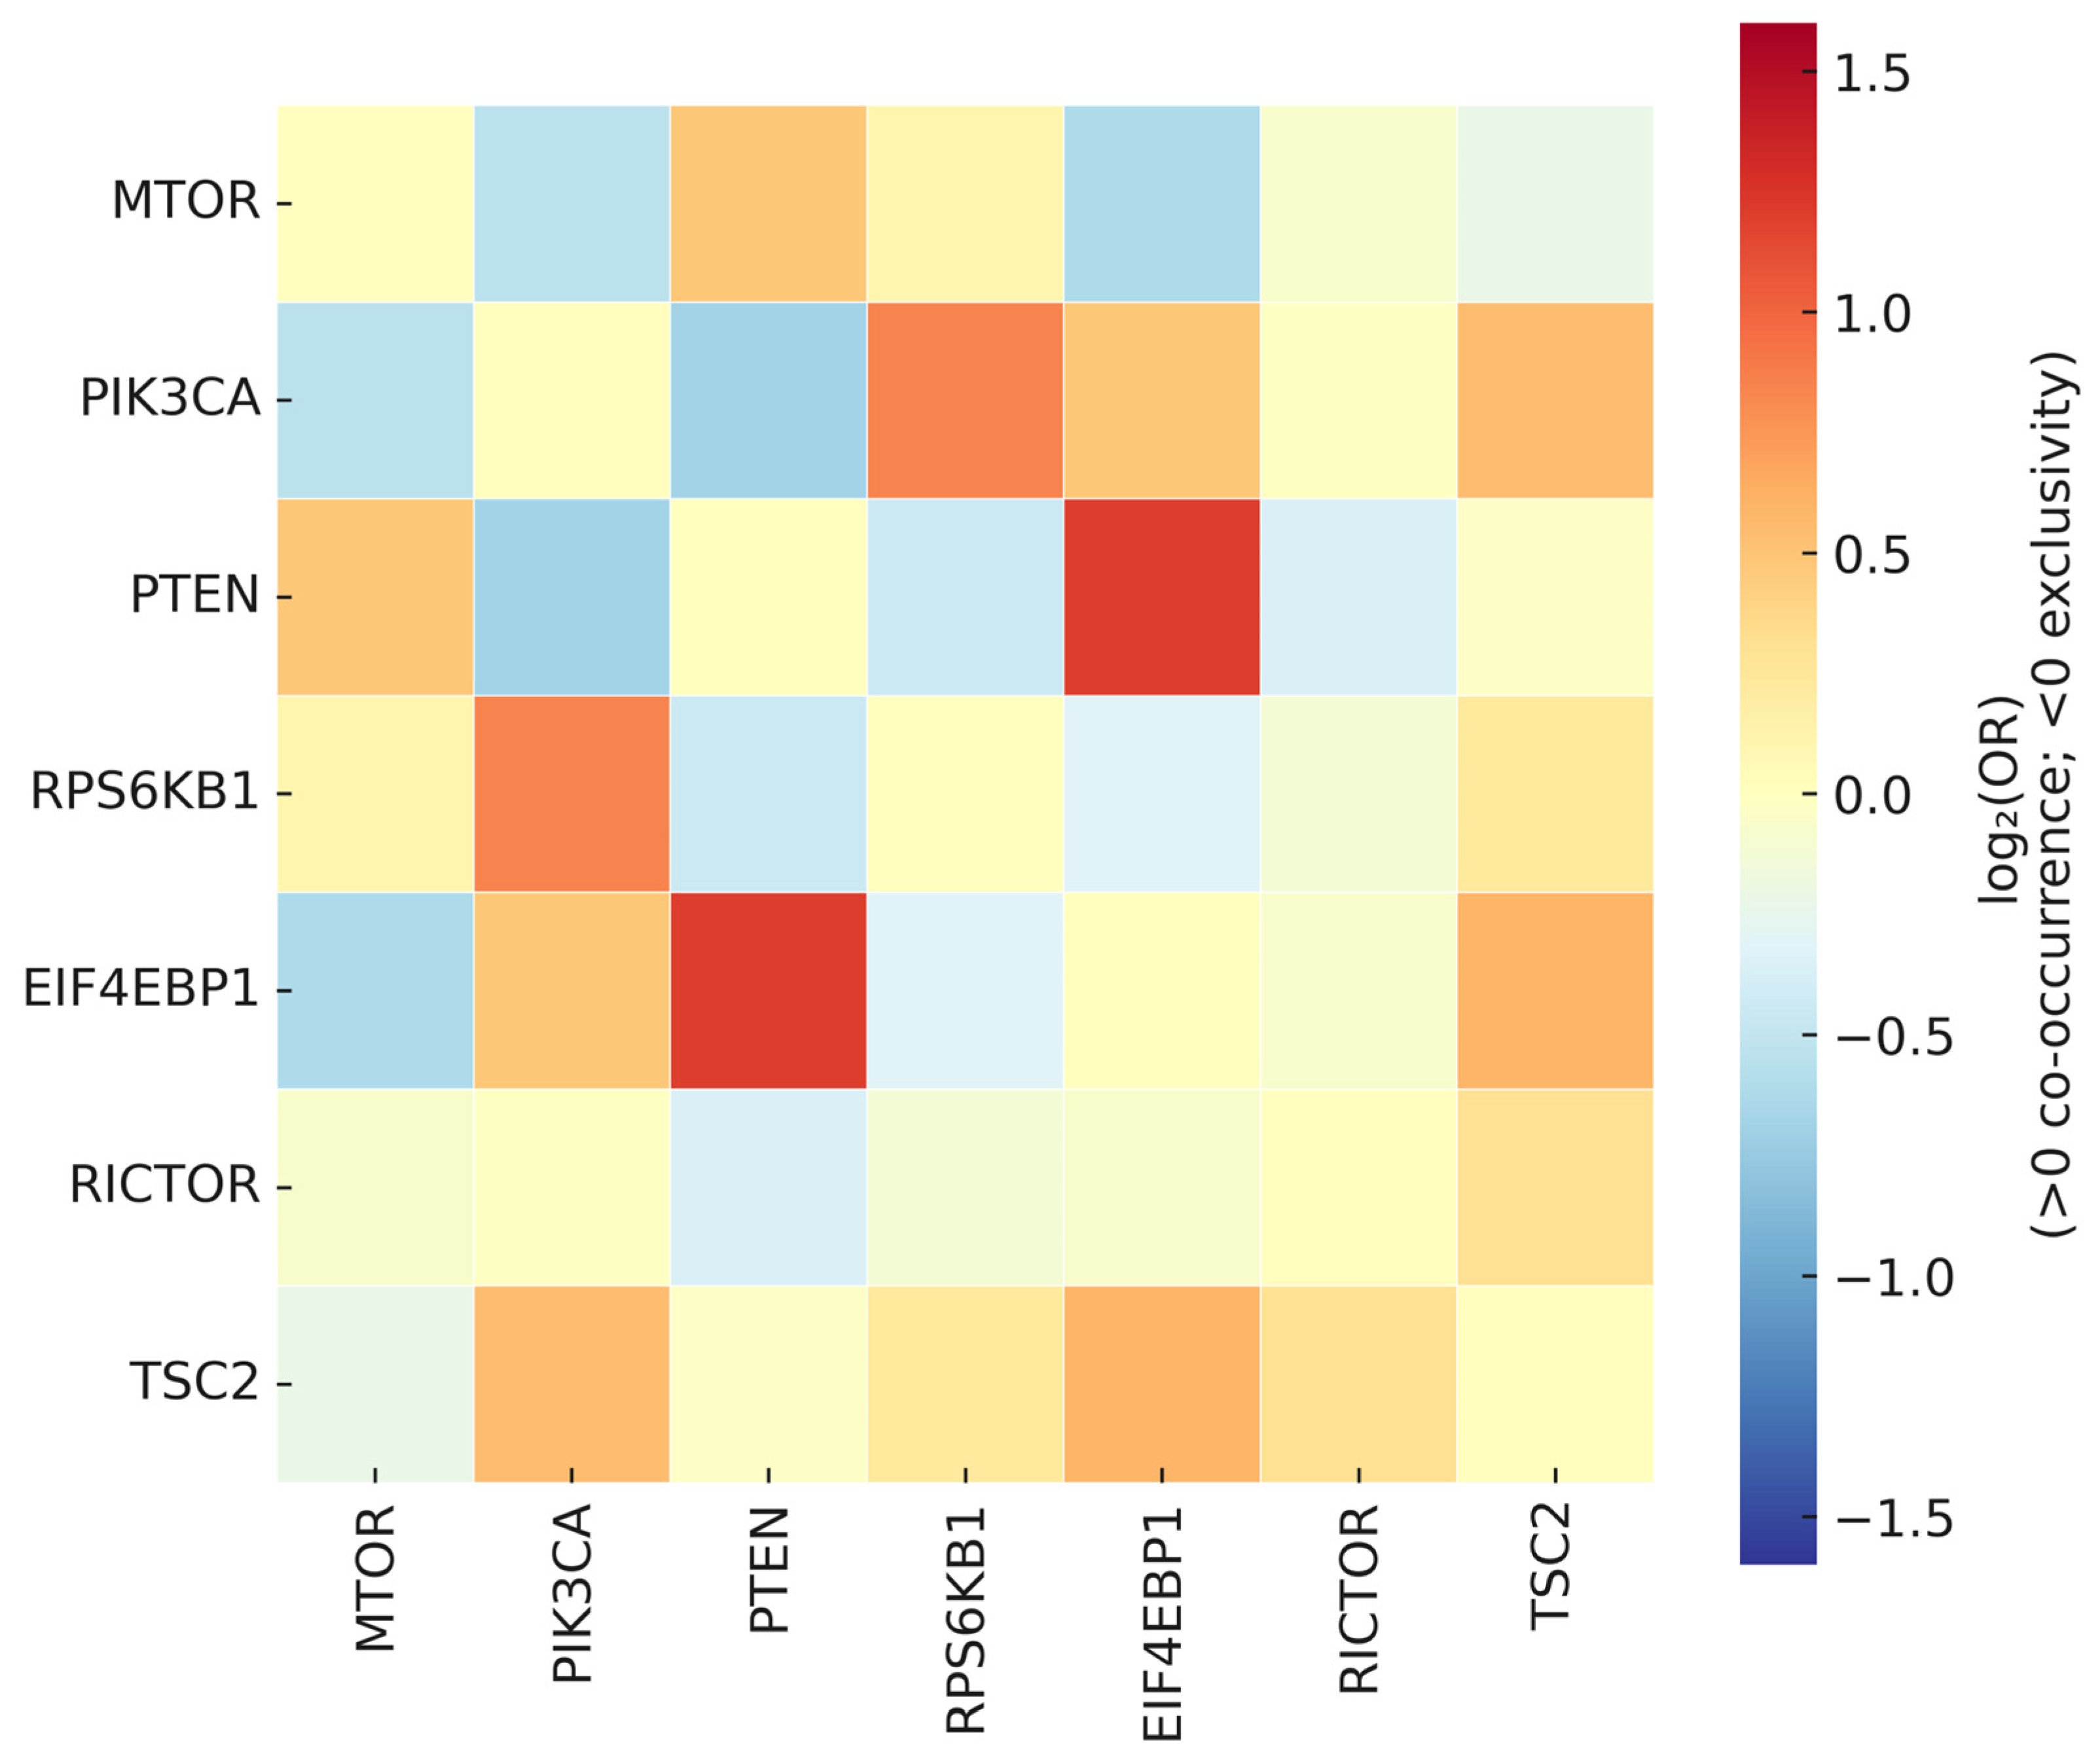
3.11. Mutual Exclusivity and Co-Occurrence of Pathway Alterations
3.12. Robustness and Sensitivity Analyses
4. Discussion
4.1. Key İntegrative Advances
4.1.1. From Catalogue to Prioritized Hypotheses
4.1.2. Topology-Aware Nominations Complement Mutation-Frequency Signals
4.1.3. Quantitative Pan-Cancer Partitioning İdentifies Contexts of Concentrated Dependency
4.1.4. Module-Level Hierarchy Clarifies Functional Readouts
4.1.5. Variant Contextualization Prioritizes Immediate Experimental Targets
4.1.6. Cross-Level Co-Occurrence/Exclusivity Patterns Inform Mechanistic and Therapeutic Choices
4.2. Reproducibility and Robustness
4.3. Clinical and Experimental Implications
4.4. Limitations
4.5. Concrete Next Steps for Validation
5. Conclusions
Supplementary Materials
Author Contributions
Funding
Institutional Review Board Statement
Informed Consent Statement
Data Availability Statement
Conflicts of Interest
References
- Faivre, S.; Kroemer, G.; Raymond, E. Current development of mTOR inhibitors as anticancer agents. Nat. Rev. Drug Discov. 2006, 5, 671–688. [Google Scholar] [CrossRef]
- Weber, J.D.; Gutmann, D.H. Deconvoluting mTOR biology. Cell Cycle 2012, 11, 236–248. [Google Scholar] [CrossRef]
- Zoncu, R.; Efeyan, A.; Sabatini, D.M. mTOR: From growth signal integration to cancer, diabetes and ageing. Nat. Rev. Mol. Cell Biol. 2011, 12, 21–35. [Google Scholar] [CrossRef] [PubMed]
- Dazert, E.; Hall, M.N. mTOR signaling in disease. Curr. Opin. Cell Biol. 2011, 23, 744–755. [Google Scholar] [CrossRef]
- Gomez-Pinillos, A.; Ferrari, A.C. mTOR signaling pathway and mTOR inhibitors in cancer therapy. Hematol. Oncol. Clin. N. Am. 2012, 26, 483–505,vii. [Google Scholar] [CrossRef]
- Bartholomeusz, C.; Gonzalez-Angulo, A.M. Targeting the PI3K signaling pathway in cancer therapy. Expert Opin. Ther. Targets 2012, 16, 121–130. [Google Scholar] [CrossRef] [PubMed]
- Atkins, M.B.; Hidalgo, M.; Stadler, W.M.; Logan, T.F.; Dutcher, J.P.; Hudes, G.R.; Park, Y.; Liou, S.H.; Marshall, B.; Boni, J.P.; et al. Randomized phase II study of multiple dose levels of CCI-779, a novel mammalian target of rapamycin kinase inhibitor, in patients with advanced refractory renal cell carcinoma. J. Clin. Oncol. 2004, 22, 909–918. [Google Scholar] [CrossRef] [PubMed]
- Sun, Q.; Chen, X.; Ma, J.; Peng, H.; Wang, F.; Zha, X.; Wang, Y.; Jing, Y.; Yang, H.; Chen, R.; et al. Mammalian target of rapamycin up-regulation of pyruvate kinase isoenzyme type M2 is critical for aerobic glycolysis and tumor growth. Proc. Natl. Acad. Sci. USA 2011, 108, 4129–4134. [Google Scholar] [CrossRef]
- Wysocki, P.J. mTOR in renal cell cancer: Modulator of tumor biology and therapeutic target. Expert Rev. Mol. Diagn. 2009, 9, 231–241. [Google Scholar] [CrossRef]
- Shaw, R.J.; Cantley, L.C. Ras, PI(3)K and mTOR signalling controls tumour cell growth. Nature 2006, 441, 424–430. [Google Scholar] [CrossRef]
- Vivanco, I.; Sawyers, C.L. The phosphatidylinositol 3-Kinase AKT pathway in human cancer. Nat. Rev. Cancer 2002, 2, 489–501. [Google Scholar] [CrossRef]
- Bellacosa, A.; Chan, T.O.; Ahmed, N.N.; Datta, K.; Malstrom, S.; Stokoe, D.; McCormick, F.; Feng, J.; Tsichlis, P. Akt activation by growth factors is a multiple-step process: The role of the PH domain. Oncogene 1998, 17, 313–325. [Google Scholar] [CrossRef]
- Sancak, Y.; Thoreen, C.C.; Peterson, T.R.; Lindquist, R.A.; Kang, S.A.; Spooner, E.; Carr, S.A.; Sabatini, D.M. PRAS40 is an insulin-regulated inhibitor of the mTORC1 protein kinase. Mol. Cell 2007, 25, 903–915. [Google Scholar] [CrossRef]
- Martina, J.A.; Chen, Y.; Gucek, M.; Puertollano, R. MTORC1 functions as a transcriptional regulator of autophagy by preventing nuclear transport of TFEB. Autophagy 2012, 8, 903–914. [Google Scholar] [CrossRef]
- Shannon, C.E. A mathematical theory of communication. Bell Syst. Tech. J. 1948, 27, 379–423. [Google Scholar] [CrossRef]
- Yanai, I.; Benjamin, H.; Shmoish, M.; Chalifa-Caspi, V.; Shklar, M.; Ophir, R.; Bar-Even, A.; Horn-Saban, S.; Safran, M.; Domany, E.; et al. Genome-wide midrange transcription profiles reveal expression level relationships in human tissue specification. Bioinformatics 2005, 21, 650–659. [Google Scholar] [CrossRef]
- Benjamini, Y.; Hochberg, Y. Controlling the False Discovery Rate: A Practical and Powerful Approach to Multiple Testing. J. R. Stat. Soc. Ser. B 1995, 57, 289–300. [Google Scholar] [CrossRef]
- Csardi, G.; Nepusz, T. The igraph software package for complex network research. In Complex Systems; InterJournal: Budapest, Hungary, 2006; p. 1695. [Google Scholar]
- Saxton, R.A.; Sabatini, D.M. mTOR Signaling in Growth, Metabolism, and Disease. Cell 2017, 168, 960–976. [Google Scholar] [CrossRef] [PubMed]
- Cowen, L.; Ideker, T.; Raphael, B.J.; Sharan, R. Network propagation: A universal amplifier of genetic associations. Nat. Rev. Genet. 2017, 18, 551–562. [Google Scholar] [CrossRef] [PubMed]
- Guertin, D.A.; Sabatini, D.M. Defining the role of mTOR in cancer. Cancer Cell 2007, 12, 9–22. [Google Scholar] [CrossRef] [PubMed]
- Laplante, M.; Sabatini, D.M. mTOR signaling in growth control and disease. Cell 2012, 149, 274–293. [Google Scholar] [CrossRef]
- Hsieh, A.C.; Liu, Y.; Edlind, M.P.; Ingolia, N.T.; Janes, M.R.; Sher, A.; Shi, E.Y.; Stumpf, C.R.; Christensen, C.; Bonham, M.J.; et al. The translational landscape of mTOR signalling steers cancer initiation and metastasis. Nature 2012, 485, 55–61. [Google Scholar] [CrossRef]
- Grabiner, B.C.; Nardi, V.; Birsoy, K.; Possemato, R.; Shen, K.; Sinha, S.; Jordan, A.; Beck, A.H.; Sabatini, D.M. A diverse array of cancer-associated MTOR mutations are hyperactivating and can predict rapamycin sensitivity. Cancer Discov. 2014, 4, 554–563. [Google Scholar] [CrossRef]
- Okkenhaug, K.; Graupera, M.; Vanhaesebroeck, B. Targeting PI3K in Cancer: Impact on Tumor Cells, Their Protective Stroma, Angiogenesis, and Immunotherapy. Cancer Discov. 2016, 6, 1090–1105. [Google Scholar] [CrossRef] [PubMed]
- Hudes, G.; Carducci, M.; Tomczak, P.; Dutcher, J.; Figlin, R.; Kapoor, A.; Staroslawska, E.; Sosman, J.; McDermott, D.; Bodrogi, I.; et al. Temsirolimus, interferon alfa, or both for advanced renal-cell carcinoma. N. Engl. J. Med. 2007, 356, 2271–2281. [Google Scholar] [CrossRef] [PubMed]
- Song, M.S.; Salmena, L.; Pandolfi, P.P. The functions and regulation of the PTEN tumour suppressor. Nat. Rev. Mol. Cell Biol. 2012, 13, 283–296. [Google Scholar] [CrossRef]
- Barretina, J.; Caponigro, G.; Stransky, N.; Venkatesan, K.; Margolin, A.A.; Kim, S.; Wilson, C.J.; Lehar, J.; Kryukov, G.V.; Sonkin, D.; et al. The Cancer Cell Line Encyclopedia enables predictive modelling of anticancer drug sensitivity. Nature 2012, 483, 603–607. [Google Scholar] [CrossRef] [PubMed]

| Residue Change | dbSNP | Variant Description | Cancer Type |
|---|---|---|---|
| A8S, p.Ala8Ser | rs748801456 | missense variant | lung large cell carcinoma |
| M2011V, p.Met2011Val | rs2100412651 | missense variant | ovarian mucinous carcinoma |
| S2215Y, p.Ser2215Tyr | rs587777894 | missense variant | colorectal adenocarcinoma |
| L2220F, p.Leu2220Phe | rs2100381099 | missense variant | renal cell carcinoma |
| V2406A, p.Val2406Ala | rs2100316251 | missense variant | renal cell carcinoma |
| Disorder | Genes | Score |
|---|---|---|
| Follicular basal cell carcinoma | TSC2, RICTOR, RHEB, RPS6KB1, MTOR, MLST8, TSC1, RPTOR, EIF4EBP1, AKT1 | 11.84 |
| Childhood ovarian dysgerminoma | AKT1, EIF4EBP1, MLST8, TSC1, TSC2, RPS6KB1, RPTOR, MTOR, RHEB, RICTOR | 11.78 |
| Paranoid schizophrenia | AKT1, EIF4EBP1, TSC2, RPTOR, TSC1, MTOR, RHEB, MLST8, RPS6KB1, RICTOR | 11.78 |
| Congenital lipomatous overgrowth, vascular malformations, and epidermal nevi | MTOR, AKT1, TSC2, TSC1 | 11.75 |
| Tuberous sclerosis | AKT1, EIF4EBP1, TSC1, RPS6KB1, TSC2, RHEB, MTOR | 11.70 |
| Postauricular lymphadenitis | AKT1, MAPK3, RAF1 | 11.69 |
| Mitochondrial complex iii deficiency, nuclear type 9 | AKT1, MTOR, TSC2 | 11.68 |
| Cowden syndrome 1 | AKT1, MTOR, TSC2 | 11.65 |
| Gastric adenocarcinoma | AKT1, MTOR, RAF1 | 11.64 |
| Mitochondrial complex iv deficiency, nuclear type 7 | AKT1, MTOR, TSC2 | 11.64 |
| Gene | Mutated%_Pan | Amplified%_Pan | Entropy | Tau | Class | Top_Cancer | Second_Cancer | Top_vs_Second_Diff(%) | Chi2_p | BH-FDR_q |
|---|---|---|---|---|---|---|---|---|---|---|
| PTEN | 9.681 | 7.803 | 0.786 | 0.881 | Shared | ucec_tcga_pan_can_atlas_2018 | gbm_tcga_pan_can_atlas_2018 | 10.568 | 0 | 0 |
| PIK3CA | 12.712 | 29.09 | 0.84 | 0.776 | Shared | ucec_tcga_pan_can_atlas_2018 | gbm_tcga_pan_can_atlas_2018 | 11.871 | 0 | 0 |
| RICTOR | 5.051 | 26.516 | 0.771 | 0.877 | Shared | gbm_tcga_pan_can_atlas_2018 | kirc_tcga_pan_can_atlas_2018 | 11.154 | 6.3 × 10−230 | 6.8 × 10−230 |
| RPS6KB1 | 3.913 | 22.638 | 0.688 | 0.91 | Shared | gbm_tcga_pan_can_atlas_2018 | kirc_tcga_pan_can_atlas_2018 | 10.842 | 4 × 10−304 | 8 × 10−304 |
| MTOR | 6.12 | 9.812 | 0.815 | 0.846 | Shared | gbm_tcga_pan_can_atlas_2018 | kirc_tcga_pan_can_atlas_2018 | 6.414 | 9.7 × 10−234 | 1.2 × 10−233 |
| RPTOR | 4.816 | 23.649 | 0.766 | 0.885 | Shared | gbm_tcga_pan_can_atlas_2018 | kirc_tcga_pan_can_atlas_2018 | 11.713 | 5.8 × 10−247 | 8.8 × 10−247 |
| MLST8 | 3.843 | 18.39 | 0.688 | 0.914 | Shared | gbm_tcga_pan_can_atlas_2018 | kirc_tcga_pan_can_atlas_2018 | 12.13 | 0 | 0 |
| AKT1 | 4.146 | 13.953 | 0.72 | 0.904 | Shared | gbm_tcga_pan_can_atlas_2018 | kirc_tcga_pan_can_atlas_2018 | 11.597 | 2.6 × 10−273 | 4.5 × 10−273 |
| TSC1 | 5.118 | 12.265 | 0.794 | 0.875 | Shared | gbm_tcga_pan_can_atlas_2018 | kirc_tcga_pan_can_atlas_2018 | 11.74 | 8.2 × 10−244 | 1.1 × 10−243 |
| TSC2 | 5.402 | 18.357 | 0.817 | 0.866 | Shared | gbm_tcga_pan_can_atlas_2018 | kirc_tcga_pan_can_atlas_2018 | 11.349 | 2.6 × 10−226 | 2.6 × 10−226 |
| EIF4EBP1 | 3.57 | 22.808 | 0.652 | 0.92 | Shared | gbm_tcga_pan_can_atlas_2018 | kirc_tcga_pan_can_atlas_2018 | 11.455 | 0 | 0 |
| RPS6 | 3.839 | 10.057 | 0.682 | 0.912 | Shared | gbm_tcga_pan_can_atlas_2018 | kirc_tcga_pan_can_atlas_2018 | 11.455 | 1 × 10−304 | 2.5 × 10−304 |
| Contrast | Module | Method | p | q (BH-FDR) | Cliff’s δ | Median Diff (1–0) | N0 | N1 | Median0 | Median1 | IQR0 | IQR1 |
|---|---|---|---|---|---|---|---|---|---|---|---|---|
| PTEN loss vs. WT | Translational | Mann–Whitney (Cliff’s δ) | 0.073534146 | 0.110301219 | −0.021835686 | 0.0286 | 6711 | 3360 | −0.0335 | −0.0049 | 0.72 | 0.7279 |
| PIK3CA mut vs. WT | Translational | Mann–Whitney (Cliff’s δ) | 0.054036275 | 0.110301219 | 0.032677061 | −0.0304 | 8735 | 1336 | −0.0214 | −0.0518 | 0.7277 | 0.6772 |
| RICTOR amp vs. diploid | Translational | Mann–Whitney (Cliff’s δ) | 0.287450376 | 0.287450376 | −0.013557931 | 0.0134 | 7201 | 2870 | −0.0269 | −0.0136 | 0.7075 | 0.753 |
| Filtered_Rank | Gene_Symbol | Page_Rank_Score | Pan_Cancer_Alteration_Pct (%) | Degree | Source_Support_Count |
|---|---|---|---|---|---|
| 1 | MAP2K1 | 0.018697 | 0.5 | 184 | 3 |
| 2 | PIK3CA | 0.018113 | 2.1 | 19 | 5 |
| 3 | MAPKAP1 | 0.017997 | 1.1 | 64 | 2 |
| 4 | AKT2 | 0.017284 | 0.1 | 168 | 1 |
| 5 | TSC2 | 0.015384 | 0.9 | 76 | 4 |
| 6 | GNB1 | 0.014972 | 0.1 | 150 | 4 |
| 7 | PAX6 | 0.014652 | 2.0 | 195 | 5 |
| 8 | SOS1 | 0.013520 | 0.6 | 31 | 5 |
| 9 | PRAS40 | 0.013374 | 1.4 | 170 | 1 |
| 10 | EIF4E | 0.013126 | 1.0 | 165 | 4 |
Disclaimer/Publisher’s Note: The statements, opinions and data contained in all publications are solely those of the individual author(s) and contributor(s) and not of MDPI and/or the editor(s). MDPI and/or the editor(s) disclaim responsibility for any injury to people or property resulting from any ideas, methods, instructions or products referred to in the content. |
© 2025 by the authors. Licensee MDPI, Basel, Switzerland. This article is an open access article distributed under the terms and conditions of the Creative Commons Attribution (CC BY) license (https://creativecommons.org/licenses/by/4.0/).
Share and Cite
Ozdilli, K.; Oztan, G.; Kıvanç, D.; Oğuz, R.; Oguz, F.; Ciftci, H.S. Bioinformatics Approach to mTOR Signaling Pathway-Associated Genes and Cancer Etiopathogenesis. Genes 2025, 16, 1253. https://doi.org/10.3390/genes16111253
Ozdilli K, Oztan G, Kıvanç D, Oğuz R, Oguz F, Ciftci HS. Bioinformatics Approach to mTOR Signaling Pathway-Associated Genes and Cancer Etiopathogenesis. Genes. 2025; 16(11):1253. https://doi.org/10.3390/genes16111253
Chicago/Turabian StyleOzdilli, Kursat, Gozde Oztan, Demet Kıvanç, Ruştu Oğuz, Fatma Oguz, and Hayriye Senturk Ciftci. 2025. "Bioinformatics Approach to mTOR Signaling Pathway-Associated Genes and Cancer Etiopathogenesis" Genes 16, no. 11: 1253. https://doi.org/10.3390/genes16111253
APA StyleOzdilli, K., Oztan, G., Kıvanç, D., Oğuz, R., Oguz, F., & Ciftci, H. S. (2025). Bioinformatics Approach to mTOR Signaling Pathway-Associated Genes and Cancer Etiopathogenesis. Genes, 16(11), 1253. https://doi.org/10.3390/genes16111253


