Article

Pan-Cancer Upregulation of the FOXM1 Transcription Factor

by
Daniele Pozzobon
1,
Arianna Bellezza
2 and
Federico M. Giorgi
2,*
1
Department of Computer Science, Free University, 1081 HV Amsterdam, The Netherlands
2
Department of Pharmacy and Biotechnology, University of Bologna, 40138 Bologna, Italy
*
Author to whom correspondence should be addressed.
Genes 2025, 16(1), 56; https://doi.org/10.3390/genes16010056
Submission received: 29 November 2024 / Revised: 31 December 2024 / Accepted: 3 January 2025 / Published: 6 January 2025
(This article belongs to the Special Issue Genomic Diagnosis of Human Cancers)

Abstract

:
Background: The human FOXM1 transcription factor controls cell cycle progression and genome stability, and it has been correlated to the onset and progression of many tumor types. Methods: In our study, we collected all recent sequence and quantitative transcriptomics data about FOXM1, testing its presence across vertebrate evolution and its upregulation in cancer, both in bulk tissue contexts (by comparing the TCGA tumor dataset and the GTEx normal tissue dataset) and in single-cell contexts. Results: FOXM1 is significantly and consistently upregulated in all tested tumor types, as well as in tumor cells within a cancer microenvironment. Its upregulation reverberates in the upregulation of its target genes and can be used as a biomarker for poor cancer outcome in at least four tumor types. Conclusions: Despite its lack of cancer-related mutations and amplifications, the recurring upregulation of FOXM1 in all tumors puts a focusing lens on this gene as a candidate pan-cancer master regulator.

1. Introduction

Cancer still constitutes a major global health challenge, with an estimated 9.7 million deaths annually and over 20 million new cases diagnosed each year [1]. While each cancer type possesses peculiar (epi)genetic and molecular features which lead to tumor initiation, progression and maintenance, all cancers ultimately leverage similar downstream molecular pathways, such as uncontrolled cell proliferation, deregulated metabolism, and immunoevasion [2]. Since the cause of cancer is eminently molecular, the current overarching direction of cancer research is aimed towards the identification of molecules (e.g., nucleotides, proteins, metabolites) which can be causally connected to tumor insurgence [3] and therefore used both as diagnostic biomarkers and potential pharmacological targets for therapy [4]. Our war against cancer therefore requires a complete knowledge of its molecular drivers. One such driver has been shown to be the FOXM1 gene, which has previously been linked to cancer initiation and progression [5].
The FOXM1 (Forkhead Box M1) gene in humans encodes for a transcription factor belonging to the larger family of Forkhead Box (FOX) proteins, which are evolutionarily conserved across a wide range of species [6]. The FOX proteins are known for their distinct Forkhead (FH) DNA-binding domain, which plays a pivotal role in regulating gene expression linked to cell proliferation, differentiation, development, and homeostasis in both normal and pathological conditions [7]. In humans, FOXM1 is particularly significant for its critical role as a regulator of a plethora of genes responsible for cell proliferation, as well as the maintenance of genomic stability [8].
From a pathway perspective, FOXM1 is the final effector of several signaling cascades associated with cell cycle progression, especially during the phase transitions [9]. FOXM1 primarily functions during the G1/S and G2/M transitions of the cell cycle, where it orchestrates the transcription of genes required for DNA replication, mitosis, and cytokinesis [10].
FOXM1′s role is not restricted to humans; it has been identified and studied in a variety of species. In Drosophila melanogaster, the Forkhead transcription factor homologs are critical for wing and eye development, reflecting its broader role in orchestrating tissue-specific gene expression during development [11]. In mammals, particularly in Mus musculus, the FOXM1 ortholog (Foxm1) has been shown to quickly switch on and off cell proliferation and differentiation pathways in several instances [12,13] using the intrinsically disordered nature of its protein structure, which can quickly switch from order to disorder and start/stop transcription [14].
In humans, the role of FOXM1 in cancer is still debated. For example, in breast cancer, overexpression of FOXM1 has been shown to be linked with tumor progression [15], while its downregulation is associated with an increase in metastasis [16]. The downstream effects of FOXM1 in activating target genes are likely oncogenic, as FOXM1 activates the transcription of several oncogenes, such as MYCN [17], KRAS, MAFB, and NUP98 [18,19] (Table S1), on top of regulating key architectural mechanisms of the cell cycle, like mitotic spindle assembly and chromosome segregation, through its activation of genes like AURKB, CCNB1 (Cyclin B1), and PLK1 [20]. In addition to cell cycle control, FOXM1 is involved in maintaining the DNA damage response by regulating the expression of genes such as EXO1, XRCC1, and NBS1, which are essential in DNA damage recognition and DNA repair via homologous recombination [21]. This dual role in promoting the cell cycle and preserving genomic stability makes FOXM1 the final molecular judge of tumor initiation, as it controls both a source of mutations and the proliferative hallmark of cancer.
In cancer, FOXM1 is generally considered a marker for poor prognosis in cancer survival studies [22], often as a co-effector with other cancer master regulators [23], such as CENPF in prostate cancer [24] and MYB in lymphoma [25]. However, while possessing a clear pro-proliferative nature, FOXM1 is not considered a canonical oncogene, since it has not yet been causally linked to tumor initiation, and it is currently not included in the COSMIC Cancer Gene Census, also due to its lack of cancer-specific somatic mutations [18].
In this manuscript, we will describe the presence of FOXM1 within the human proteome and across its vertebrate orthologs. We will then highlight the role of FOXM1 as a consistent overexpressor in cancer across the vast catalogue of tumor molecular samples available in the TCGA database [26], by comparing cancer signals with the largest transcriptional database for healthy human tissues, GTEx [27]. Finally, we will investigate the presence of FOXM1 in the tumor microenvironment via a relatively novel quantitative technology—single-cell RNA-Seq—by leveraging studies where cancer and non-cancer cells are identified and sequenced in the same samples. Our study should provide further evidence for the role of FOXM1 as a co-occurring element of tumorigenesis.

2. Materials and Methods

2.1. Sequence Analysis

Human FOXM1 isoforms were retrieved using NCBI RefSeq [28]. Domain identification for human FOXM1 isoforms was performed using SMART [29] and the PFAM domain database [30]. FOXM1 genomic alterations were calculated across TCGA [26] Pan-Cancer Atlas provided by cBio Portal, through their OncoPrint algorithm [31]. The position and frequency of somatic point mutations for FOXM1 were calculated using COSMIC [32].
FOXM1 putative orthologs in vertebrates were inferred using the NCBI orthology assignment annotation [33] (https://www.ncbi.nlm.nih.gov/gene/2305/ortholog, accessed on 25 November 2024), which reported, for each species, a single ortholog. We chose a single representative species for each of the following vertebrate subclades: birds (Gallus gallus), turtles (Trachemys scripta elegans), alligators (Alligator sinensis), lizards (Elgaria multicarinata webbii), amphibians (Xenopus tropicalis), coealacanths (Latimeria chalumnae), lungfishes (Protopterus annectens), bony fishes (Danio rerio), and cartilaginous fishes (Callorhinchus milii). For mammals, we picked one representative for monotremes (Ornithoryncus anatinus) and one for marsupials (Gracilinanus agilis). Amongst placental mammals, we picked one representative for rabbits (Oryctolagus cuniculus), two for rodents (Mus musculus and Rattus norvegicus), one for carnivores (Canis lupus familiaris), one for even-toed ungulates (Capra hircus), one for insectivores (Erinaceus europaeus), one for bats (Rhinolophus ferrumequinum), one for odd-toed ungulates (Equus caballus), one for pangolins (Manis pentadactyla), one for flying lemurs (Cynocephalus volans), one for tree shrews (Tupaia chinensis), one for afrotheria (Trichechus manatus latirostris), and one for armadillos (Choloepus didactylus). For primates, we picked three representatives: Homo sapiens, Gorilla gorilla gorilla, and Pan troglodytes. The sequence collection provided 31 distinct RefSeq entries. These 31 FOXM1 orthologous protein sequences were aligned using the MUSCLE multiple sequence alignment algorithm [34]. The tree building step of the phylogenetic analysis for FOXM1 was performed using the Neighbor-Joining method [35]. Branch confidence in the tree was calculated using bootstrapping with 100 replicates [36]. All the alignment, tree generation, and tree evaluation steps were performed using MEGA11 [37]. Graphical adjustments (color and branch thickness) to the tree were performed using Inkscape version 1.4 [38].

2.2. Bulk RNA-Seq

GTEx [27] and TCGA [26] data were preprocessed to remove batch effects and study-specific biases using the Wang method [39]. We used GTEx data as representative of normal tissues, and TCGA data (only tumor samples) as representative of tumor tissues. The following 15 TCGA cancers were selected based on the presence of a corresponding normal tissue dataset: BLCA (bladder cancer), BRCA (breast cancer), COAD (colon cancer), ESCA (esophageal cancer), KIRC (kidney clear cell cancer), KIRP (kidney papillary cell cancer), LIHC (liver hepatocellular cancer), LUAD (lung adenocarcinoma), LUSC (lung squamous cell carcinoma), PRAD (prostate adenocarcinoma), READ (rectal cancer), STAD (stomach adenocarcinoma), THCA (thyroid cancer), UCEC (uterine corpus endometrial cancer), and UCS (uterine carcinosarcoma). The following GTEx/TCGA pairing was applied to provide normal tissues to each of the tumor tissues: bladder/BLCA, breast/BRCA, colon/COAD, esophagus/ESCA, kidney/KIRC, kidney/KIRP, liver/LIHC, lung/LUAD, lung/LUSC, prostate/PRAD, colon/READ, stomach/STAD, thyroid/THCA, uterus/UCEC, and uterus/UCs.
All our analyses were performed on R version 4.4.1 [40]. Differential expression analysis for each tumor vs. normal contrast was performed using the DESeq2 algorithm version 1.44 [41], which has been previously shown to be a robust choice for datasets of this size and context [42]. Survival analysis was performed using the R survival package version 3.6.4, and patient groups were divided into “FOXM1 low” and “FOXM1 high” using the median value of FOXM1 expression as the breakpoint. Master regulator analysis of FOXM1 transcriptional network was performed using the R corto package version 1.2.4 [43], for both the network generation and the enrichment tests, as described before [44]. Networks were generated with 200 bootstraps and p-value = 10−10 for individual edges, with the exception of the UCS dataset where the sample size was one order of magnitude lower than other datasets (n = 47), and the p-value was set to 10−2 to provide comparable networks with those of other datasets. All p-values were adjusted (padj) using the Benjamini–Hochberg method [45].

2.3. Single-Cell RNA-Seq

We obtained single-cell RNA-seq dataset for breast cancer [46], colorectal cancer [47], and lung cancer [48]. In order to load and process the data, we used Seurat version 5.0.1 [49] running on R version 4.4.1 [40]. All three datasets were log-normalized and scaled using Seurat NormalizeData() and ScaleData() functions with default parameters. The filtering process was double-checked using the original authors’ thresholds for detected raw gene counts, UMIs and fraction of mitochondrial reads, confirming that the downloaded datasets were pre-filtered as described in the original publications. In particular, for the breast cancer dataset, we removed cells with less than 200 genes, less than 250 UMI and cells with more than 20% of mitochondrial genes expressed. For the colorectal cancer dataset, we discarded cells if they had either less than 200 genes detected, less than 1000 reads, fewer than 500 UMIs, more than 50% of UMIs mapping mitochondrial genes, non-empty droplet false discovery rate less than 0.1 or if more than 5% of reads were estimated to be chimeric. Finally, for the lung cancer dataset, since the data object is integrated between several different studies, we used, as the authors intended, the less stringent thresholds on gene counts (<600), number of genes detected (<200) and mitochondrial gene expression (>20%).
We used Seurat’s RunPCA() function to calculate the first 30 principal components and used them to compute the UMAP coordinates via the RunUMAP() function. Preliminary data exploration on FOXM1 expression across the three datasets was performed by extracting the log-normalized FOXM1 expression data from the Seurat objects with the FetchData() function (layer = “data” parameter), distinguishing between control and cancer cells. Control and cancer FOXM1 expression vectors for each cancer type were also used to perform one-sided non-parametric Wilcoxon tests in order to check whether FOXM1 expression was higher in tumor cells. For distribution visualizations, we used the beeswarm R package version 0.4.0 [50].

3. Results

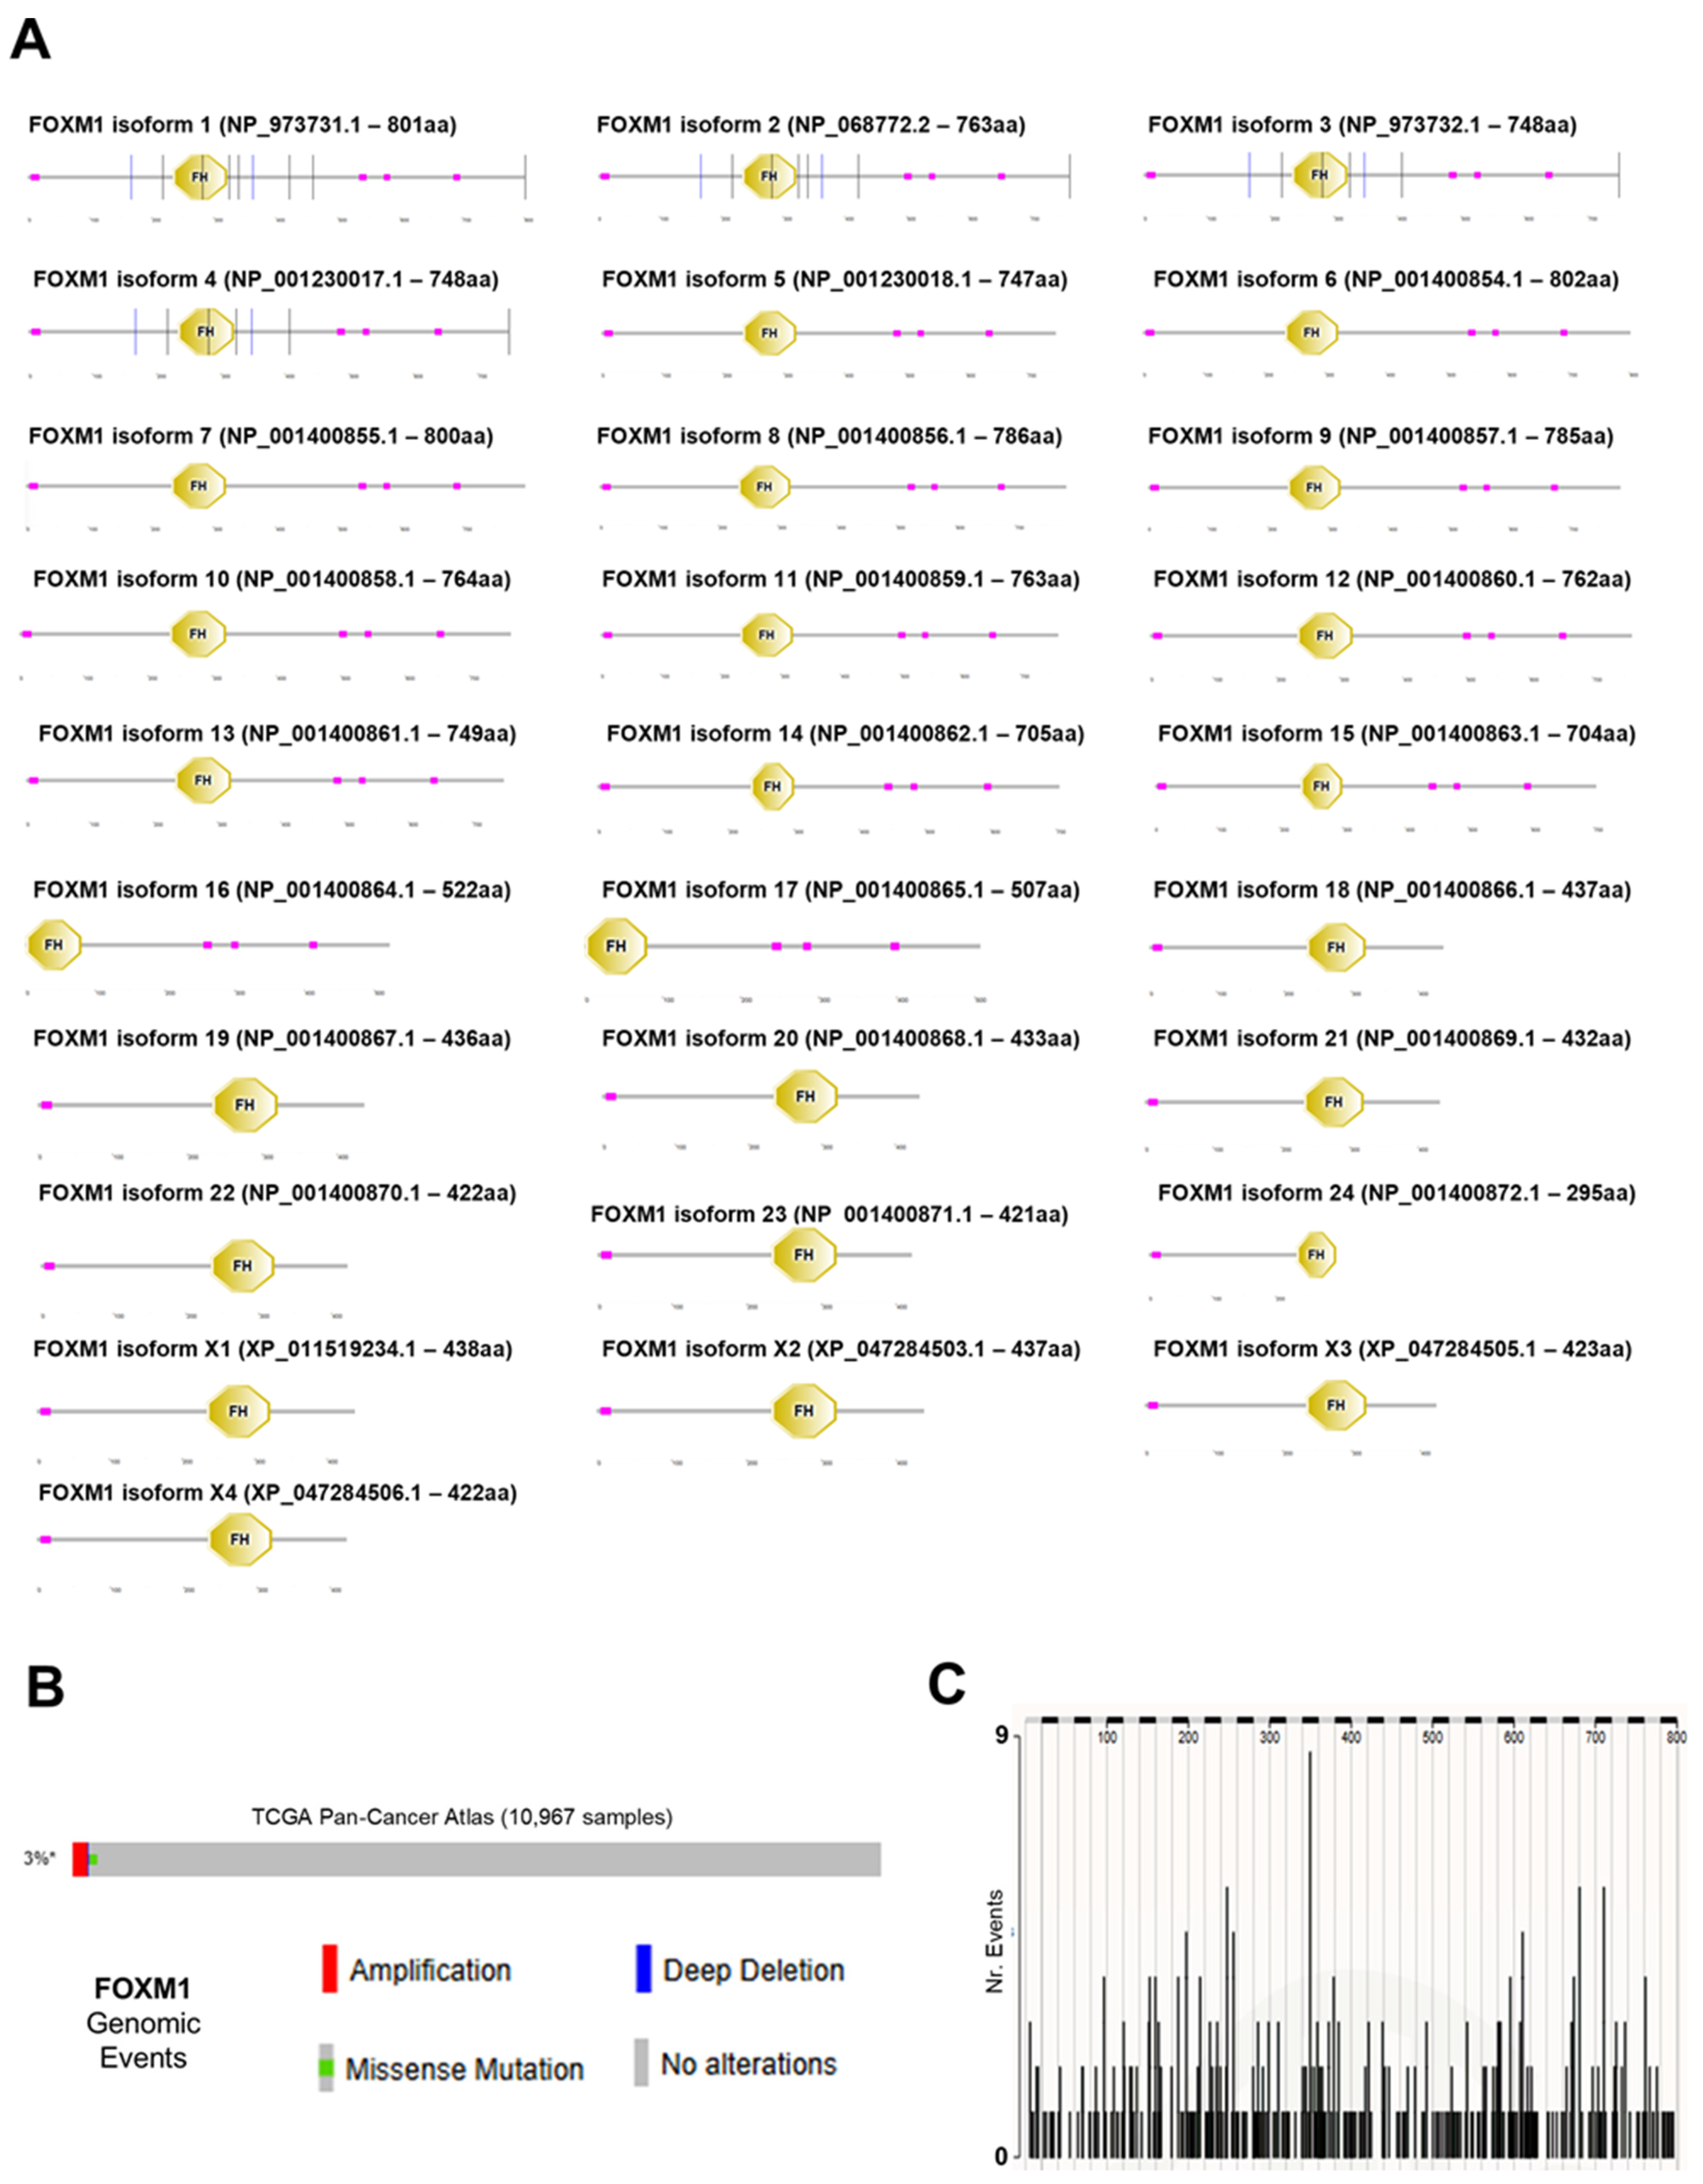
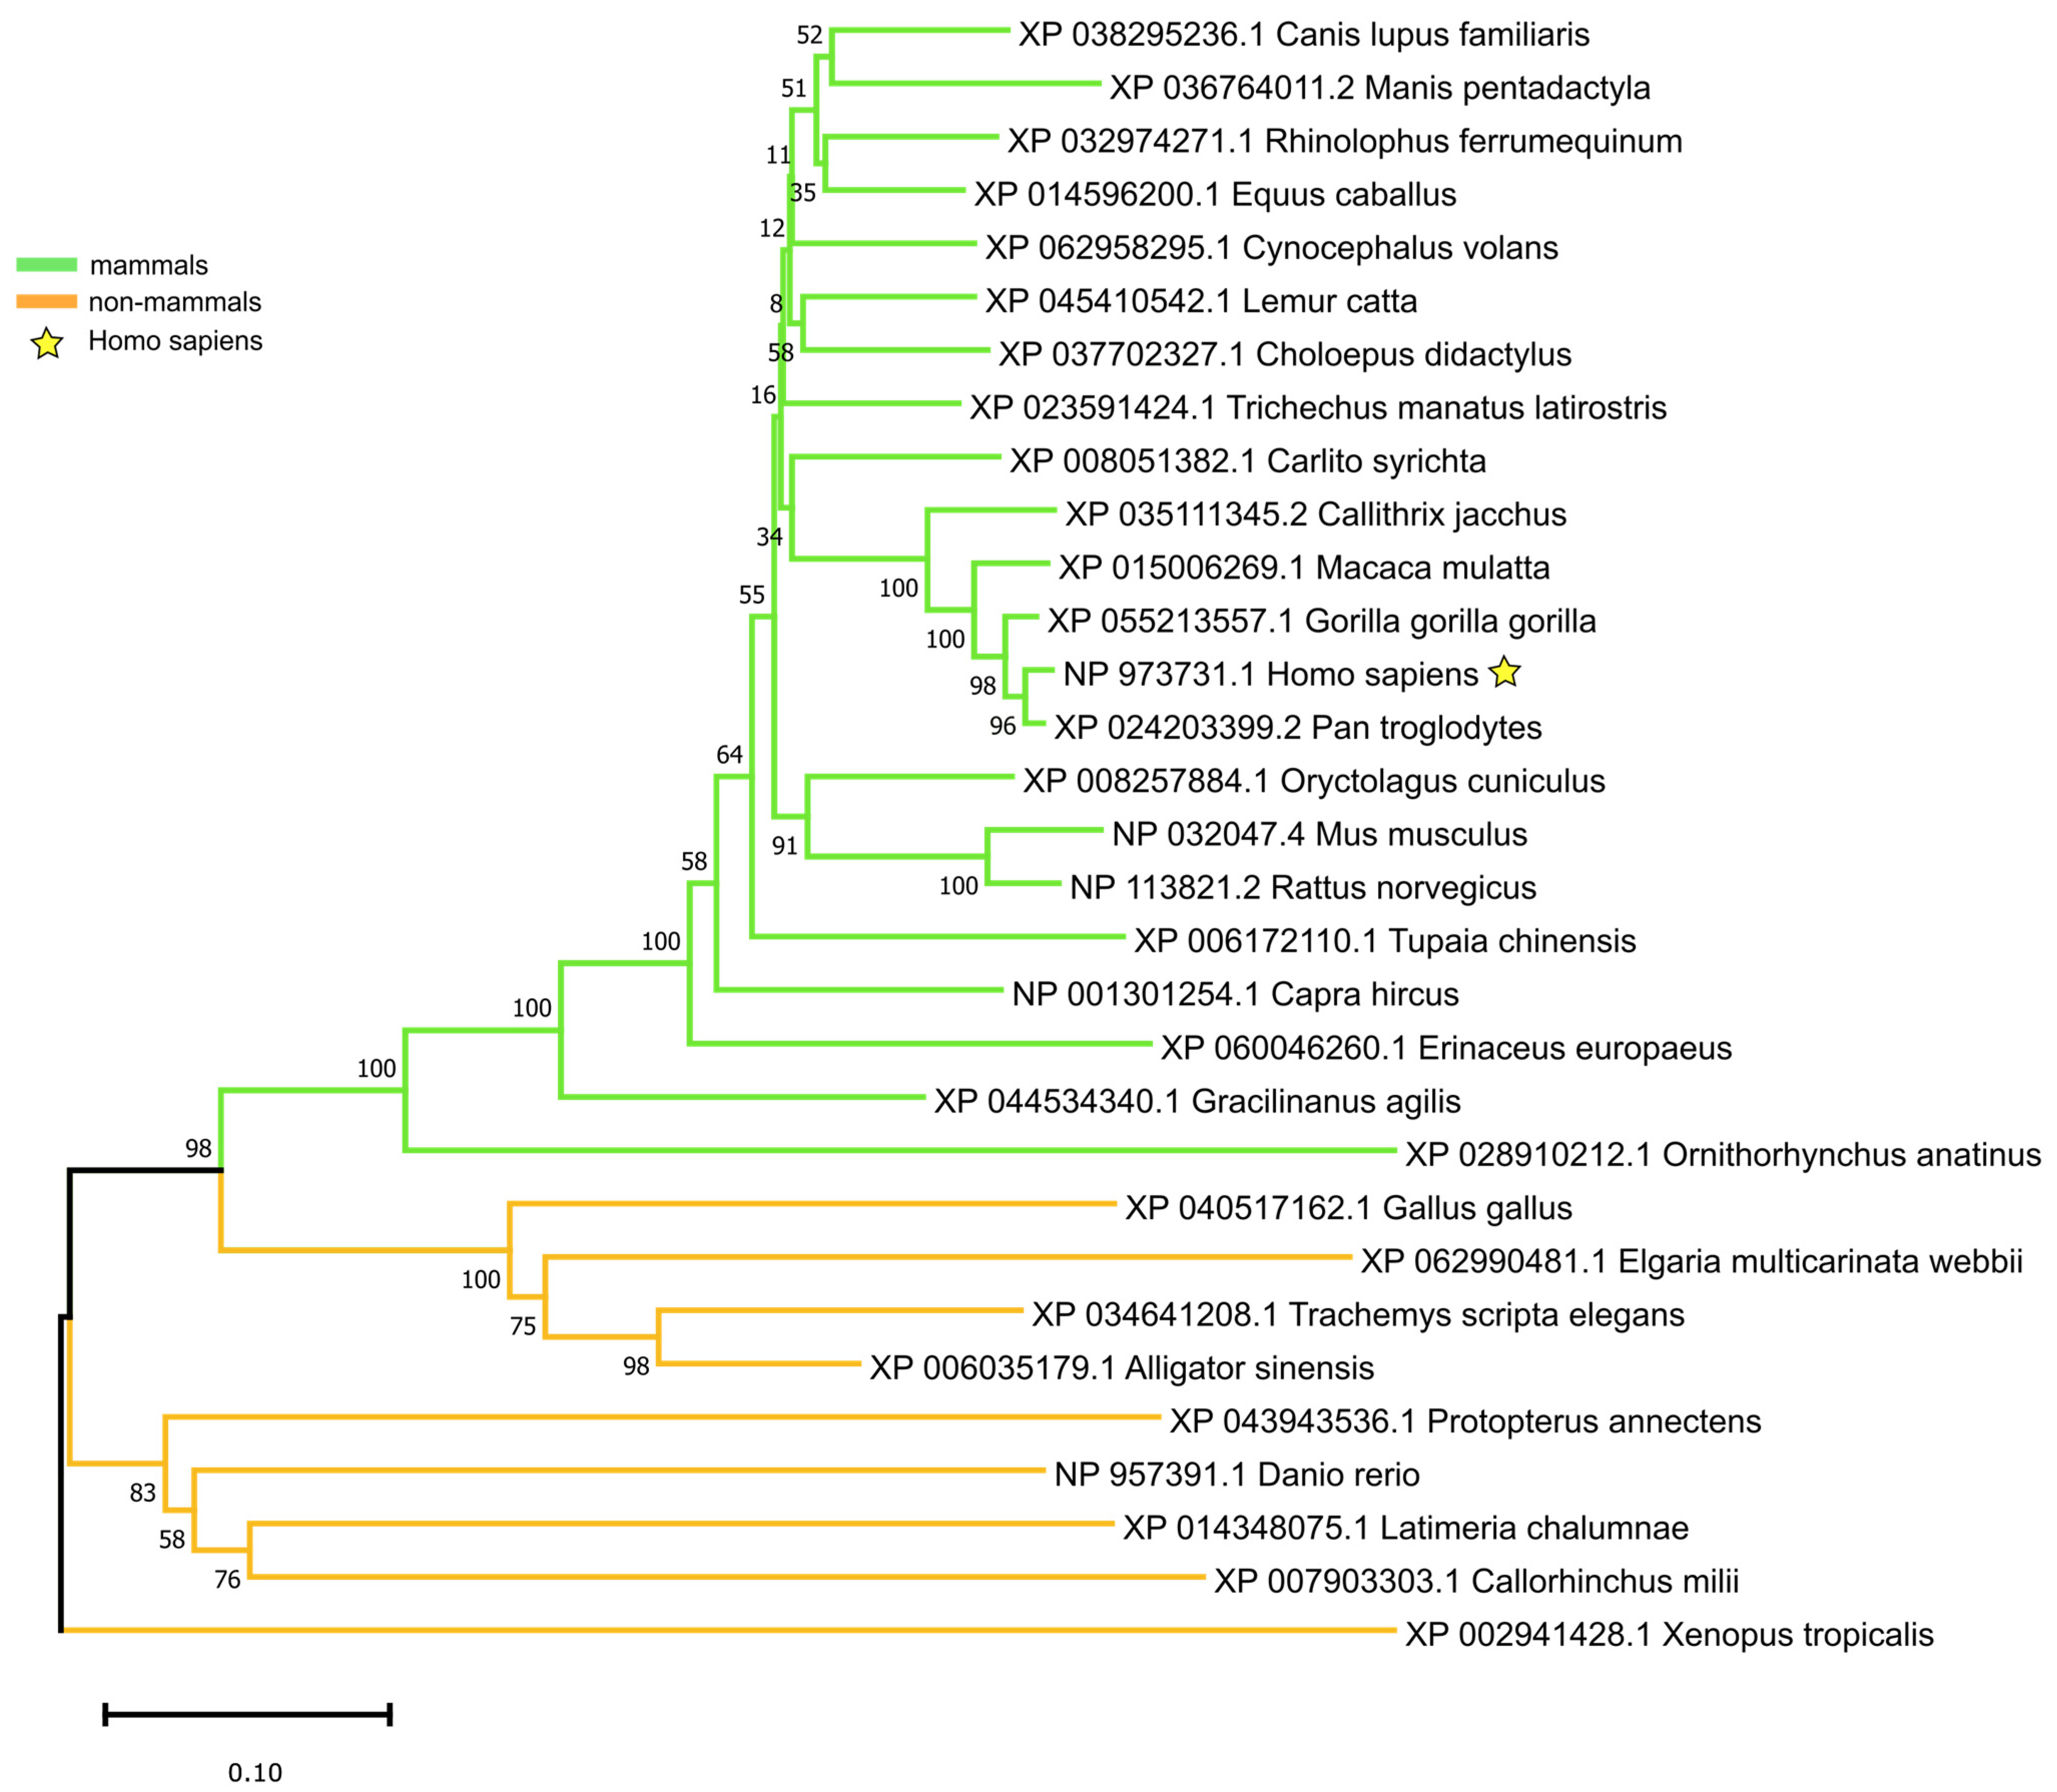
3.1. FOXM1 Sequence Across Species

According to the most recent NCBI annotation, the human proteome contains 28 distinct FOXM1 protein isoforms (24 RefSeq-validated and 4 predicted), ranging from 295 to 802 amino acids (Figure 1A). All human isoforms arise from alternative splicing, and all contain a complete Forkhead (FH) domain (Figure 1A). According to TCGA [26] and GTEx [27] data on physiological tissues, the most expressed FOXM1 transcripts encode for isoforms 1 through 4, which are nearly identical in their sequence and account for >99.9% of the total expression of FOXM1 [15]. Despite its role in cancer being acknowledged in literature [5,15], FOXM1 is altered in only 3% of all human cancer genomes (collected in the TCGA Pan-Cancer Atlas), with amplifications being the most common event (Figure 1B), followed by somatic point mutations. According to the COSMIC catalogue for somatic cancer mutations [32], there is no focal point for FOXM1 mutations, which are not only rare but also evenly distributed across its protein sequence (Figure 1C). We tested the presence of FOXM1 across all vertebrate clades and generated an evolutionary model for this gene (Figure 2). FOXM1 is present in all vertebrate clades as a single ortholog, according to the most recent orthology assignment pipelines by NCBI (Figure 2); we specifically searched for outparalogs of FOXM1 [51] across the vertebrate group and, to the best of our knowledge, we found none, at least in the representative species of each vertebrate subclade.

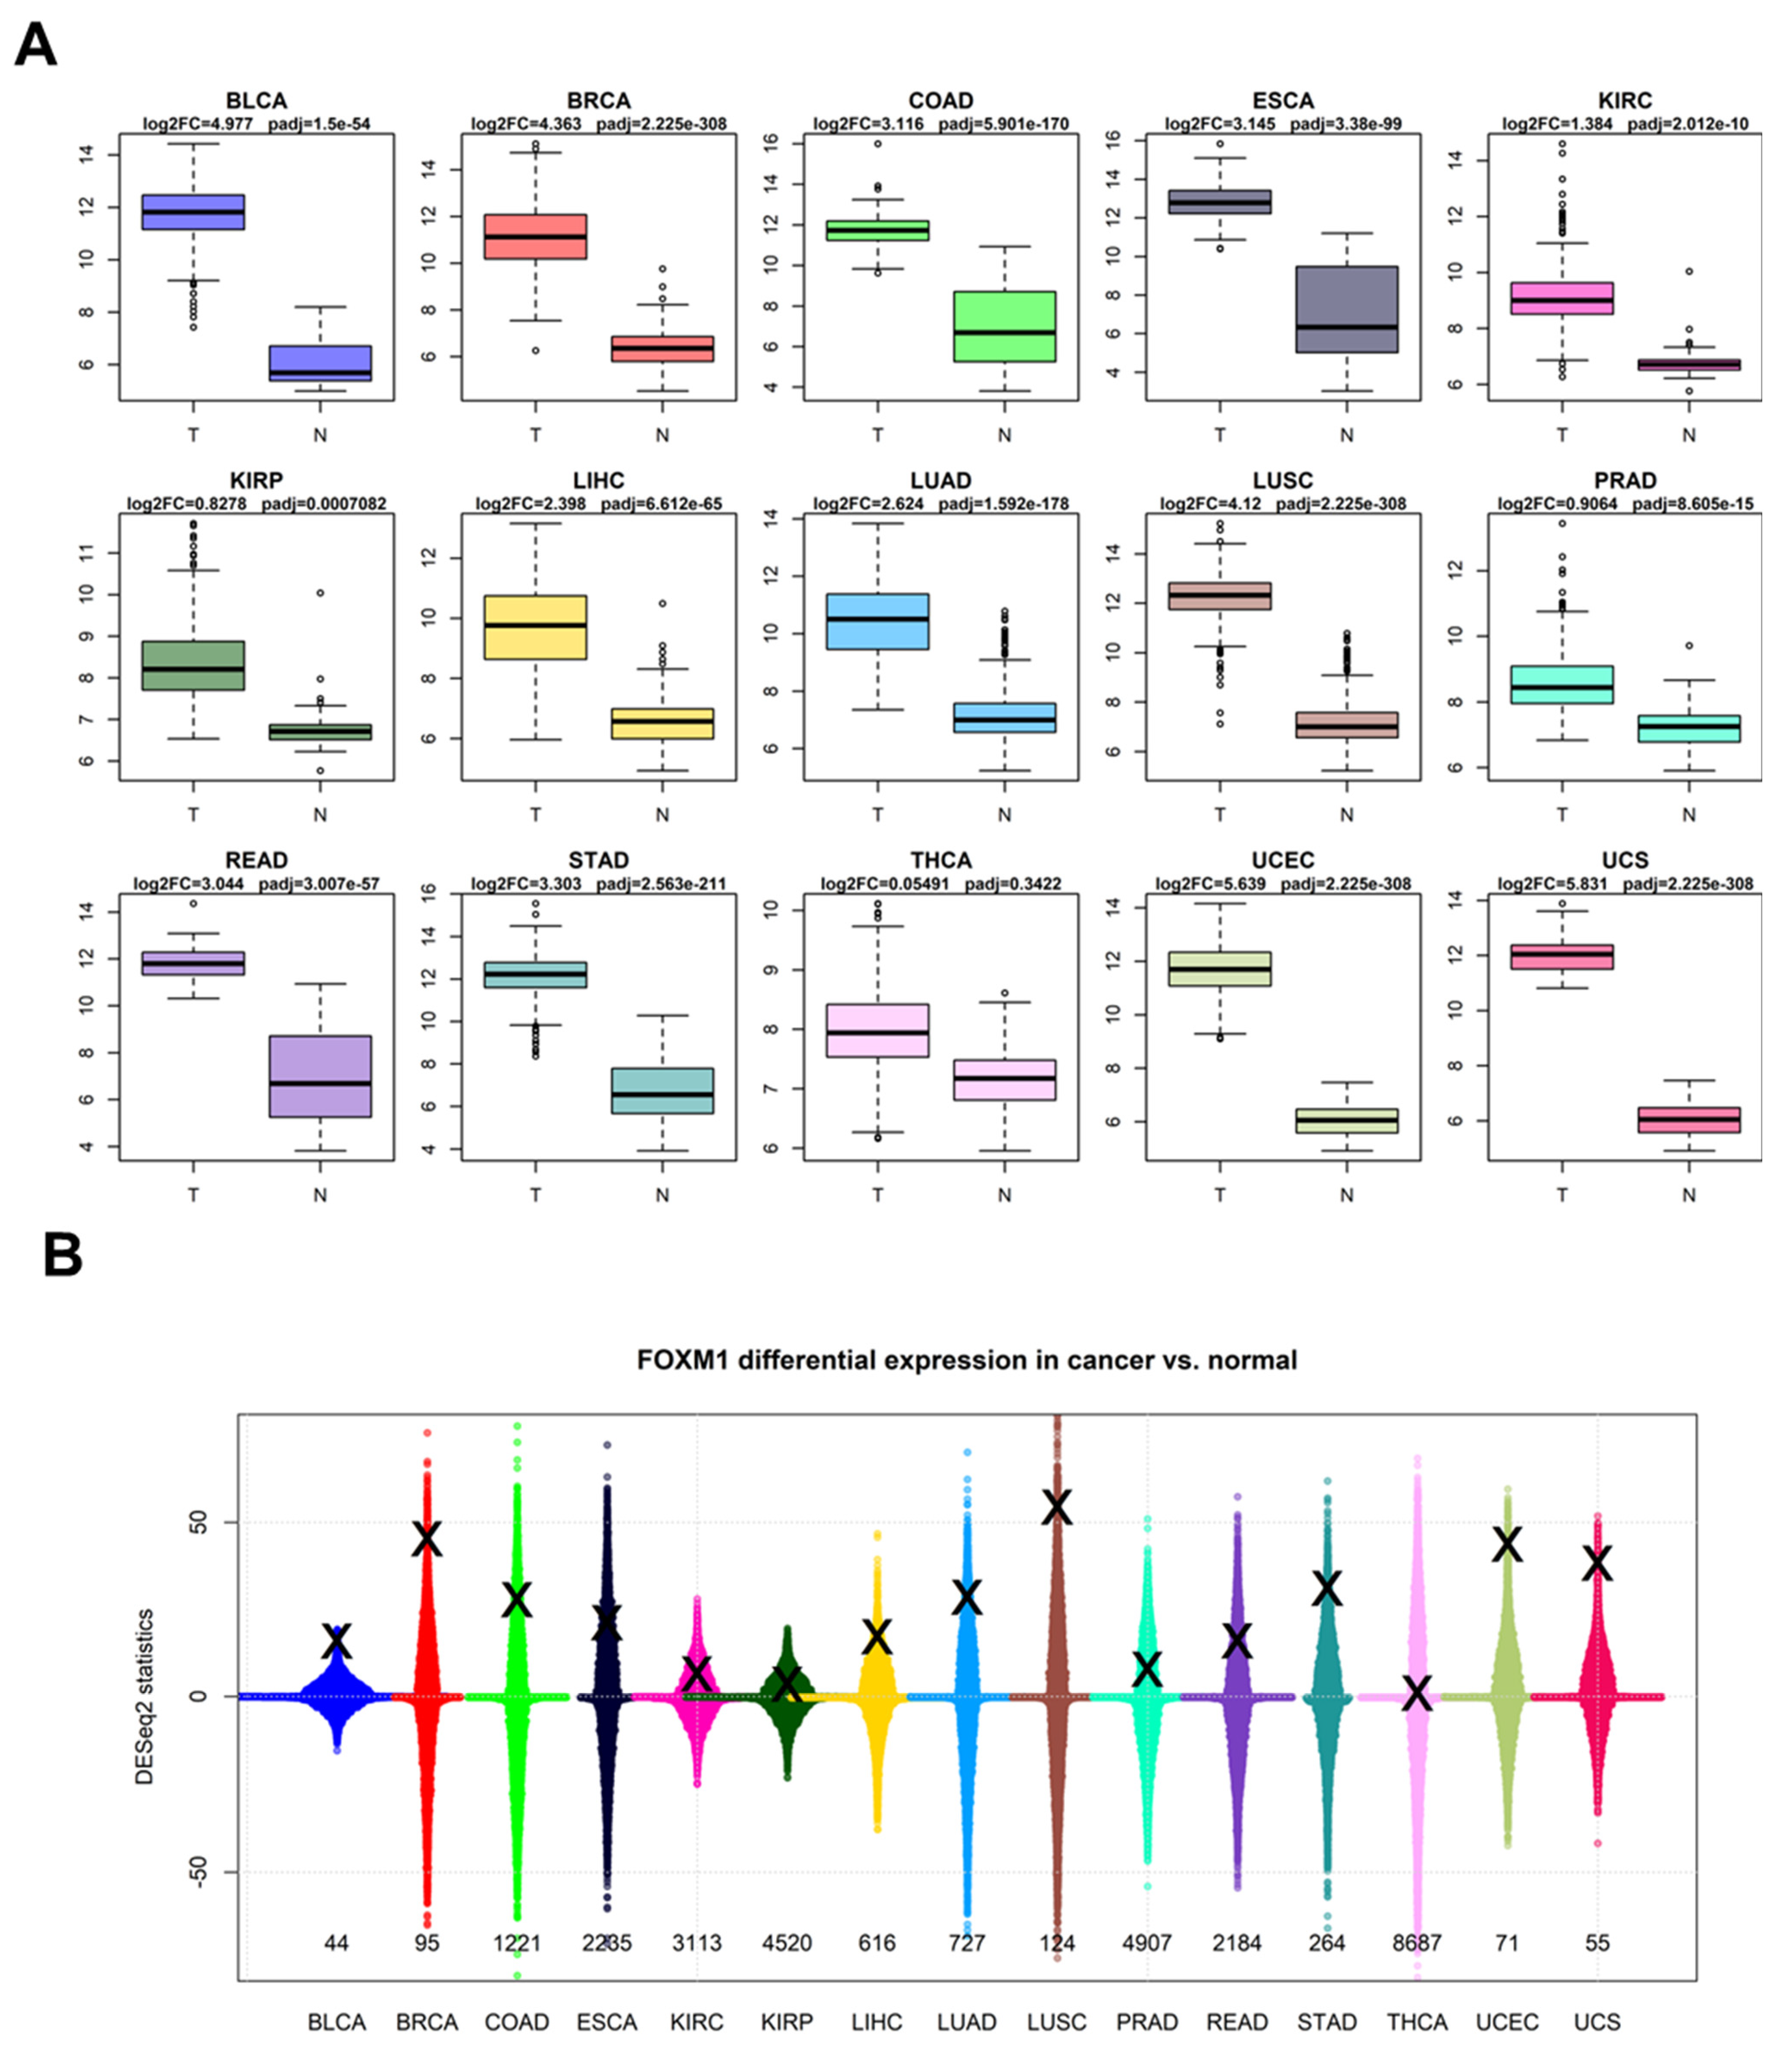
3.2. FOXM1 Expression in Bulk Cancer RNA-Seq

In our analysis, we investigated the presence of FOXM1 transcripts in the two largest human bulk RNA-Seq datasets generated so far and publicly available: GTEx [27] and TCGA [26]. These collections of data report the transcriptome-wide expression of tens of thousands of patients, encompassing every human gene. We decided to design a comparative differential expression analysis by using the two datasets at the same time, after the appropriate batch correction (see Section 2). For each human cancer, we chose the histologically more appropriate normal tissue available on GTEx (see Section 2), in order to investigate whether the FOXM1 transcript was altered in tumoral condition, relative to the most likely tissue of origin. We ultimately selected 15 cancer types with an appropriate comparative normal control and performed transcriptome-wide differential expression analysis. Our results strikingly show that FOXM1 is upregulated in all the 15 tumor types, with a significant (padj < 0.01) adjusted p-value (derived from the DESeq2 negative binomial test) in 14 out of 15, the only exception being thyroid cancer, with padj = 0.3422 (Figure 3A). FOXM1 is massively upregulated, with adjusted p-values below the limit of precision of the R software, so p < 2.2 × 10−308 in breast cancer (Log2 Fold Change = +4.36), lung squamous cancer (Log2 FC = +4.12), and the two uterine cancers (UCEC and UCS, with Log2 FC of +5.64 and +5.83). FOXM1 is therefore upregulated in a pan-cancer range, across all TCGA datasets with a corresponding normal tissue in GTEx.
While the upregulation of FOXM1 is a robust and monotonic result, and despite having corrected batch effects within and between datasets, one could argue that FOXM1 is just upregulated in all tumors as a byproduct of the majority of the human transcriptome being upregulated in tumors. In order to test this, we calculated differential expression in the tumor vs. normal contrast for all human genes across the 15 tumor types (Table S2). We considered only coding genes and genes measured in all TCGA and GTEx datasets, amounting to a total of 20,242 genes, a number consistent with what is currently known on the total number of human coding genes [52]. This showed us that the transcriptional rewiring (and relative differential expression scores) induced by cancer affects genes in a symmetrical way, with equal numbers of up- and downregulated genes (Figure 3B). FOXM1 is consistently upregulated, being in the top 150 of the most upregulated transcripts in some cancers (bladder, breast, lung squamous, and uterine cancers).
While significantly upregulated in most cancer types, survival analysis does not indicate FOXM1 as an immediate discriminant of mortality, as highlighted in Figure 4A. In fact, while a general pan-cancer tendency as a negative prognostic marker can be observed, survival of patients with a higher-than-median expression of FOXM1 is significantly worse in four cancer types, specifically BRCA (p = 0.011), KIRC (p = 0.00023), KIRP (p = 0.0066), and LUAD (p = 0.0023).
The pan-cancer upregulation of FOXM1 reverberates in its target genes, as highlighted by Master Regulator Analysis across the 15 selected cancer types. Collectively, the regulon of FOXM1 is significantly upregulated across all selected cancer types, with no exception, with p-values close to or below the limit of R p-value precision (2.2 × 10−308) in BRCA, COAD, ESCA, LIHC, LUAD, LUSC, READ, STAD, THCA, and UCEC (Figure 4B).

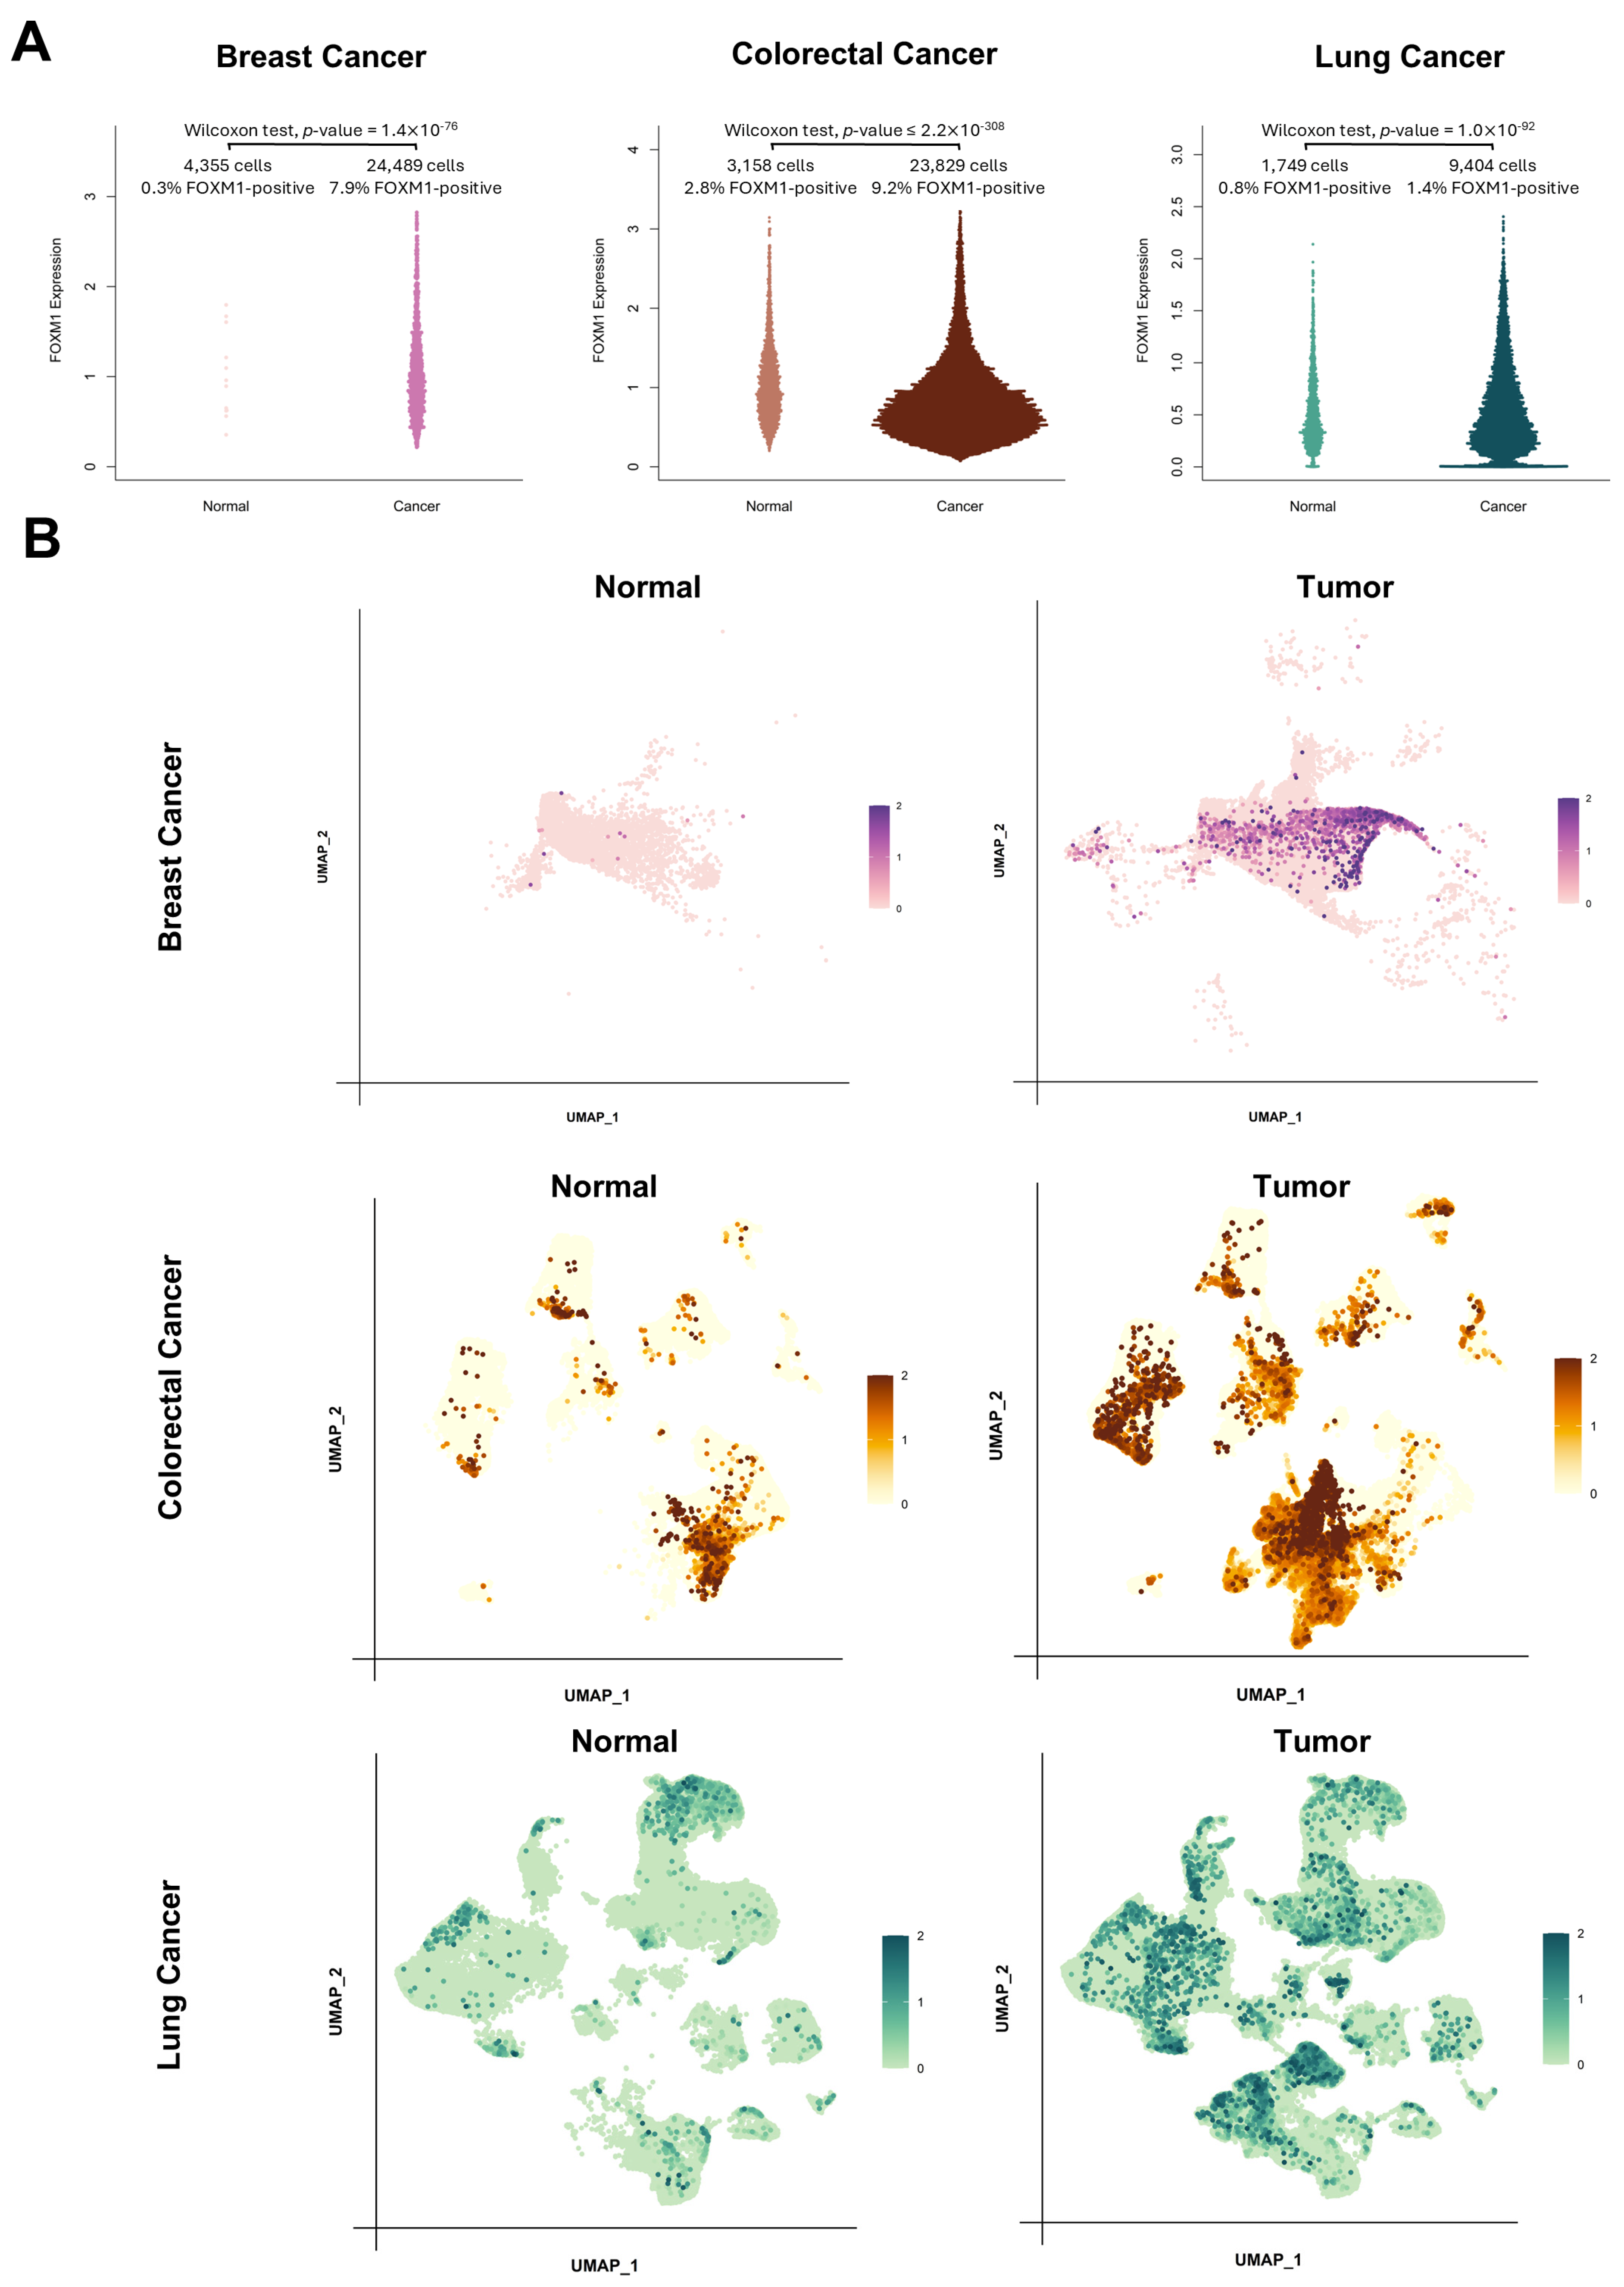
3.3. FOXM1 Expression in the Cancer Microenvironment

Given the compelling expression patterns of FOXM1 observed in bulk RNA-Seq data, we extended our analysis to scRNA-Seq datasets to determine whether similar upregulation patterns could be observed at the single-cell level. For this purpose, we utilized three publicly available scRNA-Seq atlases: the Breast Cancer Atlas (BrCA) from Wu et al. [46], the Colorectal Cancer Atlas (CRCA) from Pelka et al. [47], and the Lung Cancer Atlas (LuCA) from Salcher et al. [48]. To ensure accuracy, we performed standard preprocessing on each dataset (see Section 2). By leveraging the authors’ original metadata annotations, we meticulously excluded ambiguous and irrelevant cell populations, focusing exclusively on well-defined tumor cells and their matched healthy controls. This filtering step was essential to minimize background noise and enable precise comparisons of FOXM1 expression levels across cancer and normal tissues.
Our analysis revealed strikingly higher percentages of FOXM1-positive cells in the tumor groups compared to their normal counterparts (Figure 5A). We observed a significant and consistent upregulation of FOXM1 in cancer cells, when compared to normal cells, across all three tumor microenvironments (p = 1.4 × 10−76 for BrCA, p = 1.0 ×10−92 for LuCA and p < 2.2 × 10−308 for CRCA. These findings further confirm the consistent upregulation of FOXM1 not only in bulk but also in single-cell transcriptomics-wide data. Visualizing FOXM1 expression using UMAP plots further corroborated these observations (Figure 5B): in the tumor datasets, we identified distinct clusters of cells exhibiting high FOXM1 expression levels (Figure 5B). In contrast, healthy control datasets showed either no detectable FOXM1 expression (BrCA) or only minimal expression levels (CRCA and LuCA). This pattern was consistent across all three types of cancer (Figure 5B).
Moreover, differential gene expression analysis (DGEA) provided additional evidence of FOXM1 upregulation in cancer cells. FOXM1 consistently ranked among the topmost highly expressed genes in the tumor datasets, with highly significant adjusted p-values below threshold levels. Specifically, FOXM1 exhibited a Log2 FC of +1.22 with p < 2.2 × 10−308 (below R threshold) in CRCA, a Log2 FC of +0.94 with padj = 3.7 × 10−88 in LuCA, and a Log2 FC of +4.85 with padj = 7.6 × 10−72 in BrCA. These findings provide strong quantitative support for the role of FOXM1 as a pan-cancer master regulator.

4. Discussion

Our analysis tested the FOXM1 gene using the most recent sequence (and sequencing) data available at the time of writing (December 2024). According to our analysis, FOXM1 is highly conserved and present in all vertebrates (Figure 2). The conservation of FOXM1 is likely due to its critical role in cell cycle progression, cell differentiation, DNA damage repair and homeostasis [53], as has been observed for other genes with similar directional functions on core cellular mechanisms such as DRG1 [54], TCTP [55], and MCM4 [56]. Also, FOXM1 appears as a single-copy transcription factor gene, with no detectable recent duplication event in vertebrates (Figure 2). FOXM1 shares this low-duplicability feature with many cancer genes, which have been shown to possess a significantly lower chance to duplicate when compared to non-cancer genes [57]: the delicate pro-oncogenic nature of cancer genes likely poses a constraint to any change in their copy number and dosage, keeping cancer genes as evolutionary soloists.
We also tested FOXM1 expression levels across 15 tumor types using the combination of the two largest human datasets for tumor (TCGA) and normal (GTEx) transcriptome-wide datasets, and detected a strikingly consistent upregulation of FOXM1 in all tumor types (Figure 3). This upregulation is reflected also in the higher-resolution scenario of single-cell transcriptomics data, where FOXM1 is upregulated in cancer cells within the same microenvironment in at least three tumor contexts (breast, colon and lung), both in absolute expression and number of cells with detectable FOXM1 mRNAs (Figure 5).
While the upregulation of FOXM1 in cancer contexts has been shown before [24], we present here that this gene is consistently upregulated in a pan-cancer manner, constituting a recurring mechanism cancer adopts to increase cell proliferation, one of the hallmarks of cancer [2]. In only one of the tumor types (THCA), FOXM1 was not upregulated when compared to normal tissue (Figure 3A). While we have no final explanation for this finding, it can be stated that normal thyroid is already a proliferating tissue [58], which may mask the pro-proliferative effect of FOXM1 in cancer. However, thanks to master regulator analysis, we at least observed that FOXM1 transcriptional targets are upregulated in thyroid cancer when compared to normal thyroid tissue (Figure 4B).
Unlike canonical oncogenes, like BRAF [59] or KRAS [60], FOXM1 is not commonly mutated nor amplified in cancer, warranting its exclusion from common “cancer gene lists” such as the Sanger Institute’s COSMIC Cancer Gene Census [18]. Despite this, FOXM1 is one of the strongest pro-proliferative agents in human cancer and therefore constitutes an ideal candidate biomarker for tracking cancer progression; unlike some oncogenes or tumor suppressor genes, whose activation or inactivation is cancer-specific, activation of FOXM1 is a consistent phenomenon spanning all neoplastic tissues. Being a transcription factor, the upregulation of FOXM1 increasingly cascades into hundreds of transcriptional targets [61], further fueling its upregulation and pro-proliferative effects (Figure 4B). FOXM1 is generally a negative predictor of survival (Figure 4A), with significantly negative prognostic power in four cancer types. In truth, other cancer types, such as PRAD and THCA, provide similar patterns but are limited by the low number of death events in the TCGA dataset (respectively, n = 8 and n = 14). Specifically for prostate cancer, when survival was tested using different datasets and more data, the negative prognostic power of FOXM1 in cancer survival became apparent [24].
Given these properties, developing pharmacological solutions to inhibit FOXM1 would seem like the perfect strategy to combat or mitigate tumor progression across all cancer types. However, three limitations to hypothetical anti-FOXM1 pan-cancer therapy remain. The first is that correlation does not imply causation, especially in cancer [62], meaning that the upregulation of FOXM1 could very well be a downstream pro-proliferative effect of a multi-directional upstream cancer-driving event; however, the direct causative role of FOXM1 has been proven experimentally in at least one cancer type (PRAD) [24]. However, we do show in our analysis that FOXM1 is likely one of the cancer master regulators (Figure 4B), which may further corroborate the notion of FOXM1 as the ideal and central carrier of pro-proliferative signals. The second limitation is that FOXM1, like all human genes hijacked by cancer, also possesses a physiological pro-proliferative function, and it is also active in non-cancer cells. The blunt inhibition of FOXM1, without devices able to target it specifically towards cancer cells, would have detrimental effects on the overall health of the treated patient, much like standard untargeted chemotherapy [63]. The third and last limitation is that any anti-FOXM1 therapy is impaired by the current lack of small molecules targeting this protein specifically, a problem shared by many non-hormone transcription factors [64]. If these limitations are overcome in the future, FOXM1 could become the ideal focus not only for biomarker development but also for pan-anti-cancer therapy.

5. Conclusions

The transcription factor FOXM1 is conserved across vertebrates as a single-copy gene. Both its expression and the expression of its targets are significantly upregulated in 15 tumor types when compared to corresponding normal tissues. FOXM1 is also upregulated in the tumor microenvironment, showing a marked upregulation in tumor cells compared to normal cells. FOXM1 is, however, scarcely mutated in cancer and does not always strongly appear as a pan-cancer predictor for survival.

Supplementary Materials

The following supporting information can be downloaded at: https://www.mdpi.com/article/10.3390/genes16010056/s1, Table S1: intersection between FOXM1 targets (defined in the Harmonizome catalogue) and oncogenes + tumor suppressor genes (defined in the Cancer Gene Census catalogue). Table S2: transcriptome-wide differential expression analysis for fifteen human tumor vs. normal contrasts.

Author Contributions

Conceptualization, F.M.G.; Data curation, D.P., A.B. and F.M.G.; Formal analysis, D.P., A.B. and F.M.G.; Funding acquisition, F.M.G.; Investigation, D.P. and F.M.G.; Methodology, D.P. and F.M.G.; Project administration, F.M.G.; Resources, F.M.G.; Software, D.P. and F.M.G.; Supervision, F.M.G.; Visualization, D.P., A.B. and F.M.G.; Writing—original draft, F.M.G.; Writing—review and editing, D.P. and F.M.G. All authors have read and agreed to the published version of the manuscript.

Funding

This research was funded by the Italian Ministry of University and Research, with the following programs: PON “Ricerca e Innovazione” 2014–2020; PRIN project 2022CEHEX8; PNRR program for HPC, Big Data, and the Quantum Computing.

Institutional Review Board Statement

Not applicable.

Informed Consent Statement

Not applicable.

Data Availability Statement

No new raw data has been generated in this study.

Acknowledgments

We thank Astra Fornasari for the fruitful discussion about FOXM1 phylogenesis.

Conflicts of Interest

The authors declare no conflicts of interest.

References

  1. Bray, F.; Laversanne, M.; Sung, H.; Ferlay, J.; Siegel, R.L.; Soerjomataram, I.; Jemal, A. Global Cancer Statistics 2022: GLOBOCAN Estimates of Incidence and Mortality Worldwide for 36 Cancers in 185 Countries. CA A Cancer J. Clin. 2024, 74, 229–263. [Google Scholar] [CrossRef]
  2. Hanahan, D. Hallmarks of Cancer: New Dimensions. Cancer Discov. 2022, 12, 31–46. [Google Scholar] [CrossRef]
  3. Defilippo, A.; Giorgi, F.M.; Veltri, P.; Guzzi, P.H. Understanding Complex Systems through Differential Causal Networks. Sci. Rep. 2024, 14, 27431. [Google Scholar] [CrossRef] [PubMed]
  4. Torke, S.; Walther, W.; Stein, U. Immune Response and Metastasis—Links between the Metastasis Driver MACC1 and Cancer Immune Escape Strategies. Cancers 2024, 16, 1330. [Google Scholar] [CrossRef]
  5. Koo, C.-Y.; Muir, K.W.; Lam, E.W.-F. FOXM1: From Cancer Initiation to Progression and Treatment. Biochim. Biophys. Acta (BBA) Gene Regul. Mech. 2012, 1819, 28–37. [Google Scholar] [CrossRef] [PubMed]
  6. Hannenhalli, S.; Kaestner, K.H. The Evolution of Fox Genes and Their Role in Development and Disease. Nat. Rev. Genet. 2009, 10, 233–240. [Google Scholar] [CrossRef]
  7. Benayoun, B.A.; Caburet, S.; Veitia, R.A. Forkhead Transcription Factors: Key Players in Health and Disease. Trends Genet. 2011, 27, 224–232. [Google Scholar] [CrossRef]
  8. Wierstra, I. Chapter Three—The Transcription Factor FOXM1 (Forkhead Box M1): Proliferation-Specific Expression, Transcription Factor Function, Target Genes, Mouse Models, and Normal Biological Roles**The Present Chapter Is Part I of a Two-Part Review on the Transcription Factor FOXM1. Part II of This FOXM1 Review Is Published in Volume 119 of Advances in Cancer Research: Inken Wierstra, FOXM1 (Forkhead Box M1) in Tumorigenesis: Overexpression in Human Cancer, Implication in Tumorigenesis, Oncogenic Functions, Tumor-Suppressive Properties and Target of Anti-Cancer Therapy. Advances in Cancer Research, 2013, Volume 119, in Press. In Advances in Cancer Research; Tew, K.D., Fisher, P.B., Eds.; Academic Press: Cambridge, MA, USA, 2013; Volume 118, pp. 97–398. [Google Scholar]
  9. Laoukili, J.; Alvarez, M.; Meijer, L.A.T.; Stahl, M.; Mohammed, S.; Kleij, L.; Heck, A.J.R.; Medema, R.H. Activation of FoxM1 during G2 Requires Cyclin A/Cdk-Dependent Relief of Autorepression by the FoxM1 N-Terminal Domain. Mol. Cell. Biol. 2008, 28, 3076–3087. [Google Scholar] [CrossRef] [PubMed]
  10. Wierstra, I. Chapter Six—FOXM1 (Forkhead Box M1) in Tumorigenesis: Overexpression in Human Cancer, Implication in Tumorigenesis, Oncogenic Functions, Tumor-Suppressive Properties, and Target of Anticancer Therapy☆☆The Present Chapter Is Part II of a Two-Part Review on the Transcription Factor FOXM1. Part I of This FOXM1 Review Is Published in Volume 118 of Advances in Cancer Research: Inken Wierstra. The Transcription Factor FOXM1 (Forkhead Box M1): Proliferation-Specific Expression, Transcription Factor Function, Target Genes, Mouse Models, and Normal Biological Roles. Advances in Cancer Research, 2013, Volume 118, Pages 97–398. In Advances in Cancer Research; Tew, K.D., Fisher, P.B., Eds.; Academic Press: Cambridge, MA, USA, 2013; Volume 119, pp. 191–419. [Google Scholar]
  11. Myatt, S.S.; Lam, E.W.-F. The Emerging Roles of Forkhead Box (Fox) Proteins in Cancer. Nat. Rev. Cancer 2007, 7, 847–859. [Google Scholar] [CrossRef]
  12. Bolte, C.; Zhang, Y.; Wang, I.-C.; Kalin, T.V.; Molkentin, J.D.; Kalinichenko, V.V. Expression of Foxm1 Transcription Factor in Cardiomyocytes Is Required for Myocardial Development. PLoS ONE 2011, 6, e22217. [Google Scholar] [CrossRef]
  13. Kalin, T.V.; Ustiyan, V.; Kalinichenko, V.V. Multiple Faces of FoxM1 Transcription Factor: Lessons from Transgenic Mouse Models. Cell Cycle 2011, 10, 396–405. [Google Scholar] [CrossRef] [PubMed]
  14. Marceau, A.H.; Brison, C.M.; Nerli, S.; Arsenault, H.E.; McShan, A.C.; Chen, E.; Lee, H.-W.; Benanti, J.A.; Sgourakis, N.G.; Rubin, S.M. An Order-to-Disorder Structural Switch Activates the FoxM1 Transcription Factor. eLife 2019, 8, e46131. [Google Scholar] [CrossRef] [PubMed]
  15. Katzenellenbogen, B.S.; Guillen, V.S.; Katzenellenbogen, J.A. Targeting the Oncogenic Transcription Factor FOXM1 to Improve Outcomes in All Subtypes of Breast Cancer. Breast Cancer Res. 2023, 25, 76. [Google Scholar] [CrossRef] [PubMed]
  16. Kopanja, D.; Chand, V.; O’Brien, E.; Mukhopadhyay, N.K.; Zappia, M.P.; Islam, A.B.M.M.K.; Frolov, M.V.; Merrill, B.J.; Raychaudhuri, P. Transcriptional Repression by FoxM1 Suppresses Tumor Differentiation and Promotes Metastasis of Breast Cancer. Cancer Res. 2022, 82, 2458–2471. [Google Scholar] [CrossRef]
  17. Wang, I.-C.; Ustiyan, V.; Zhang, Y.; Cai, Y.; Kalin, T.V.; Kalinichenko, V.V. Foxm1 Transcription Factor Is Required for the Initiation of Lung Tumorigenesis by Oncogenic KrasG12D. Oncogene 2014, 33, 5391–5396. [Google Scholar] [CrossRef]
  18. Sondka, Z.; Bamford, S.; Cole, C.G.; Ward, S.A.; Dunham, I.; Forbes, S.A. The COSMIC Cancer Gene Census: Describing Genetic Dysfunction across All Human Cancers. Nat. Rev. Cancer 2018, 18, 696–705. [Google Scholar] [CrossRef] [PubMed]
  19. Diamant, I.; Clarke, D.J.B.; Evangelista, J.E.; Lingam, N.; Ma’ayan, A. Harmonizome 3.0: Integrated Knowledge about Genes and Proteins from Diverse Multi-Omics Resources. Nucleic Acids Res. 2024, gkae1080. [Google Scholar] [CrossRef] [PubMed]
  20. Laoukili, J.; Kooistra, M.R.H.; Brás, A.; Kauw, J.; Kerkhoven, R.M.; Morrison, A.; Clevers, H.; Medema, R.H. FoxM1 Is Required for Execution of the Mitotic Programme and Chromosome Stability. Nat. Cell Biol. 2005, 7, 126–136. [Google Scholar] [CrossRef]
  21. Zona, S.; Bella, L.; Burton, M.J.; Nestal de Moraes, G.; Lam, E.W.-F. FOXM1: An Emerging Master Regulator of DNA Damage Response and Genotoxic Agent Resistance. Biochim. Biophys. Acta (BBA) Gene Regul. Mech. 2014, 1839, 1316–1322. [Google Scholar] [CrossRef]
  22. Li, L.; Wu, D.; Yu, Q.; Li, L.; Wu, P. Prognostic Value of FOXM1 in Solid Tumors: A Systematic Review and Meta-Analysis. Oncotarget 2017, 8, 32298–32308. [Google Scholar] [CrossRef] [PubMed]
  23. Paull, E.O.; Aytes, A.; Jones, S.J.; Subramaniam, P.S.; Giorgi, F.M.; Douglass, E.F.; Tagore, S.; Chu, B.; Vasciaveo, A.; Zheng, S.; et al. A Modular Master Regulator Landscape Controls Cancer Transcriptional Identity. Cell 2021, 184, 334–351.e20. [Google Scholar] [CrossRef]
  24. Aytes, A.; Mitrofanova, A.; Lefebvre, C.; Alvarez, M.J.; Castillo-Martin, M.; Zheng, T.; Eastham, J.A.; Gopalan, A.; Pienta, K.J.; Shen, M.M.; et al. Cross-Species Analysis of Genome-Wide Regulatory Networks Identifies a Synergistic Interaction between FOXM1 and CENPF That Drives Prostate Cancer Malignancy. Cancer Cell 2014, 25, 638–651. [Google Scholar] [CrossRef] [PubMed]
  25. Lefebvre, C.; Rajbhandari, P.; Alvarez, M.J.; Bandaru, P.; Lim, W.K.; Sato, M.; Wang, K.; Sumazin, P.; Kustagi, M.; Bisikirska, B.C.; et al. A Human B-cell Interactome Identifies MYB and FOXM1 as Master Regulators of Proliferation in Germinal Centers. Mol. Syst. Biol. 2010, 6, 377. [Google Scholar] [CrossRef] [PubMed]
  26. Deng, M.; Brägelmann, J.; Schultze, J.L.; Perner, S. Web-TCGA: An Online Platform for Integrated Analysis of Molecular Cancer Data Sets. BMC Bioinform. 2016, 17, 72. [Google Scholar] [CrossRef] [PubMed]
  27. Carithers, L.J.; Moore, H.M. The Genotype-Tissue Expression (GTEx) Project. Biopreserv. Biobank 2015, 13, 307–308. [Google Scholar] [CrossRef]
  28. O’Leary, N.A.; Wright, M.W.; Brister, J.R.; Ciufo, S.; Haddad, D.; McVeigh, R.; Rajput, B.; Robbertse, B.; Smith-White, B.; Ako-Adjei, D.; et al. Reference Sequence (RefSeq) Database at NCBI: Current Status, Taxonomic Expansion, and Functional Annotation. Nucleic Acids Res. 2016, 44, D733–D745. [Google Scholar] [CrossRef]
  29. Letunic, I.; Khedkar, S.; Bork, P. SMART: Recent Updates, New Developments and Status in 2020. Nucleic Acids Res. 2021, 49, D458–D460. [Google Scholar] [CrossRef]
  30. Mistry, J.; Chuguransky, S.; Williams, L.; Qureshi, M.; Salazar, G.A.; Sonnhammer, E.L.L.; Tosatto, S.C.E.; Paladin, L.; Raj, S.; Richardson, L.J.; et al. Pfam: The Protein Families Database in 2021. Nucleic Acids Res. 2021, 49, D412–D419. [Google Scholar] [CrossRef]
  31. Gao, J.; Aksoy, B.A.; Dogrusoz, U.; Dresdner, G.; Gross, B.; Sumer, S.O.; Sun, Y.; Jacobsen, A.; Sinha, R.; Larsson, E.; et al. Integrative Analysis of Complex Cancer Genomics and Clinical Profiles Using the cBioPortal. Sci. Signal. 2013, 6, pl1. [Google Scholar] [CrossRef]
  32. Tate, J.G.; Bamford, S.; Jubb, H.C.; Sondka, Z.; Beare, D.M.; Bindal, N.; Boutselakis, H.; Cole, C.G.; Creatore, C.; Dawson, E.; et al. COSMIC: The Catalogue of Somatic Mutations in Cancer. Nucleic Acids Res. 2019, 47, D941–D947. [Google Scholar] [CrossRef] [PubMed]
  33. Pruitt, K.D.; Maglott, D.R. RefSeq and LocusLink: NCBI Gene-Centered Resources. Nucleic Acids Res. 2001, 29, 137–140. [Google Scholar] [CrossRef] [PubMed]
  34. Edgar, R.C. MUSCLE: Multiple Sequence Alignment with High Accuracy and High Throughput. Nucleic Acids Res. 2004, 32, 1792–1797. [Google Scholar] [CrossRef] [PubMed]
  35. Saitou, N.; Nei, M. The Neighbor-Joining Method: A New Method for Reconstructing Phylogenetic Trees. Mol. Biol. Evol. 1987, 4, 406–425. [Google Scholar] [CrossRef]
  36. Felsenstein, J. Confidence Limits on Phylogenies: An Approach Using the Bootstrap. Evolution 1985, 39, 783–791. [Google Scholar] [CrossRef] [PubMed]
  37. Tamura, K.; Stecher, G.; Kumar, S. MEGA11: Molecular Evolutionary Genetics Analysis Version 11. Mol. Biol. Evol. 2021, 38, 3022–3027. [Google Scholar] [CrossRef]
  38. Yuan, S.; Chan, H.C.S.; Filipek, S.; Vogel, H. PyMOL and Inkscape Bridge the Data and the Data Visualization. Structure 2016, 24, 2041–2042. [Google Scholar] [CrossRef]
  39. Wang, Q.; Armenia, J.; Zhang, C.; Penson, A.V.; Reznik, E.; Zhang, L.; Minet, T.; Ochoa, A.; Gross, B.E.; Iacobuzio-Donahue, C.A.; et al. Unifying Cancer and Normal RNA Sequencing Data from Different Sources. Sci. Data 2018, 5, 180061. [Google Scholar] [CrossRef] [PubMed]
  40. Giorgi, F.M.; Ceraolo, C.; Mercatelli, D. The R Language: An Engine for Bioinformatics and Data Science. Life 2022, 12, 648. [Google Scholar] [CrossRef]
  41. Love, M.I.; Huber, W.; Anders, S. Moderated Estimation of Fold Change and Dispersion for RNA-Seq Data with DESeq2. Genome Biol. 2014, 15, 550. [Google Scholar] [CrossRef] [PubMed]
  42. Mercatelli, D.; Cabrelle, C.; Veltri, P.; Giorgi, F.M.; Guzzi, P.H. Detection of Pan-Cancer Surface Protein Biomarkers via a Network-Based Approach on Transcriptomics Data. Brief. Bioinform. 2022, 23, bbac400. [Google Scholar] [CrossRef]
  43. Mercatelli, D.; Lopez-Garcia, G.; Giorgi, F.M. Corto: A Lightweight R Package for Gene Network Inference and Master Regulator Analysis. Bioinformatics 2020, 36, 3916–3917. [Google Scholar] [CrossRef]
  44. Alvarez, M.J.; Shen, Y.; Giorgi, F.M.; Lachmann, A.; Ding, B.B.; Ye, B.H.; Califano, A. Functional Characterization of Somatic Mutations in Cancer Using Network-Based Inference of Protein Activity. Nat. Genet. 2016, 48, 838–847. [Google Scholar] [CrossRef]
  45. Li, A.; Barber, R.F. Multiple Testing with the Structure-Adaptive Benjamini–Hochberg Algorithm. J. R. Stat. Soc. Ser. B Stat. Methodol. 2019, 81, 45–74. [Google Scholar] [CrossRef]
  46. Wu, S.Z.; Al-Eryani, G.; Roden, D.L.; Junankar, S.; Harvey, K.; Andersson, A.; Thennavan, A.; Wang, C.; Torpy, J.R.; Bartonicek, N.; et al. A Single-Cell and Spatially Resolved Atlas of Human Breast Cancers. Nat. Genet. 2021, 53, 1334–1347. [Google Scholar] [CrossRef]
  47. Pelka, K.; Hofree, M.; Chen, J.H.; Sarkizova, S.; Pirl, J.D.; Jorgji, V.; Bejnood, A.; Dionne, D.; Ge, W.H.; Xu, K.H.; et al. Spatially Organized Multicellular Immune Hubs in Human Colorectal Cancer. Cell 2021, 184, 4734–4752.e20. [Google Scholar] [CrossRef] [PubMed]
  48. Salcher, S.; Sturm, G.; Horvath, L.; Untergasser, G.; Kuempers, C.; Fotakis, G.; Panizzolo, E.; Martowicz, A.; Trebo, M.; Pall, G.; et al. High-Resolution Single-Cell Atlas Reveals Diversity and Plasticity of Tissue-Resident Neutrophils in Non-Small Cell Lung Cancer. Cancer Cell 2022, 40, 1503–1520.e8. [Google Scholar] [CrossRef] [PubMed]
  49. Hao, Y.; Stuart, T.; Kowalski, M.H.; Choudhary, S.; Hoffman, P.; Hartman, A.; Srivastava, A.; Molla, G.; Madad, S.; Fernandez-Granda, C.; et al. Dictionary Learning for Integrative, Multimodal and Scalable Single-Cell Analysis. Nat. Biotechnol. 2024, 42, 293–304. [Google Scholar] [CrossRef]
  50. Kenny, M.; Schoen, I. Violin SuperPlots: Visualizing Replicate Heterogeneity in Large Data Sets. Mol. Biol. Cell 2021, 32, 1333–1334. [Google Scholar] [CrossRef] [PubMed]
  51. Berglund, A.-C.; Sjölund, E.; Östlund, G.; Sonnhammer, E.L.L. InParanoid 6: Eukaryotic Ortholog Clusters with Inparalogs. Nucleic Acids Res. 2008, 36, D263–D266. [Google Scholar] [CrossRef]
  52. Suhre, K.; McCarthy, M.I.; Schwenk, J.M. Genetics Meets Proteomics: Perspectives for Large Population-Based Studies. Nat. Rev. Genet. 2021, 22, 19–37. [Google Scholar] [CrossRef]
  53. Kalathil, D.; John, S.; Nair, A.S. FOXM1 and Cancer: Faulty Cellular Signaling Derails Homeostasis. Front. Oncol. 2021, 10, 626836. [Google Scholar] [CrossRef]
  54. Beljan, S.; Dominko, K.; Talajić, A.; Hloušek-Kasun, A.; Škrobot Vidaček, N.; Herak Bosnar, M.; Vlahoviček, K.; Ćetković, H. Structure and Function of Cancer-Related Developmentally Regulated GTP-Binding Protein 1 (DRG1) Is Conserved between Sponges and Humans. Sci. Rep. 2022, 12, 11379. [Google Scholar] [CrossRef] [PubMed]
  55. Liu, A.-B.; Liu, J.; Wang, S.; Ma, L.; Zhang, J.-F. Biological Role and Expression of Translationally Controlled Tumor Protein (TCTP) in Tumorigenesis and Development and Its Potential for Targeted Tumor Therapy. Cancer Cell Int. 2024, 24, 198. [Google Scholar] [CrossRef] [PubMed]
  56. Li, Y.; Gao, W.; Yang, Z.; Hu, Z.; Li, J. Multi-Omics Pan-Cancer Analyses Identify MCM4 as a Promising Prognostic and Diagnostic Biomarker. Sci. Rep. 2024, 14, 6517. [Google Scholar] [CrossRef] [PubMed]
  57. Rambaldi, D.; Giorgi, F.M.; Capuani, F.; Ciliberto, A.; Ciccarelli, F.D. Low Duplicability and Network Fragility of Cancer Genes. Trends Genet. 2008, 24, 427–430. [Google Scholar] [CrossRef]
  58. Dumont, J.E.; Maenhaut, C.; Lamy, F. Control of Thyroid Cell Proliferation and Goitrogenesis. Trends Endocrinol. Metab. 1992, 3, 12–17. [Google Scholar] [CrossRef]
  59. Davies, H.; Bignell, G.R.; Cox, C.; Stephens, P.; Edkins, S.; Clegg, S.; Teague, J.; Woffendin, H.; Garnett, M.J.; Bottomley, W.; et al. Mutations of the BRAF Gene in Human Cancer. Nature 2002, 417, 949–954. [Google Scholar] [CrossRef]
  60. Huang, L.; Guo, Z.; Wang, F.; Fu, L. KRAS Mutation: From Undruggable to Druggable in Cancer. Signal Transduct. Target. Ther. 2021, 6, 386. [Google Scholar] [CrossRef]
  61. Mangan, S.; Zaslaver, A.; Alon, U. The Coherent Feedforward Loop Serves as a Sign-Sensitive Delay Element in Transcription Networks. J. Mol. Biol. 2003, 334, 197–204. [Google Scholar] [CrossRef]
  62. Ng, C.; Weigelt, B.; Grigoriadis, A.; Reis-Filho, J.S. Prognostic Signatures in Breast Cancer: Correlation Does Not Imply Causation. Breast Cancer Res. 2012, 14, 313. [Google Scholar] [CrossRef]
  63. Wang, Y.; Wen, L.; Zhao, S.; Ai, Z.; Guo, J.; Liu, W. FoxM1 Expression Is Significantly Associated with Cisplatin-Based Chemotherapy Resistance and Poor Prognosis in Advanced Non-Small Cell Lung Cancer Patients. Lung Cancer 2013, 79, 173–179. [Google Scholar] [CrossRef] [PubMed]
  64. Halasi, M.; Gartel, A.L. Targeting FOXM1 in Cancer. Biochem. Pharmacol. 2013, 85, 644–652. [Google Scholar] [CrossRef] [PubMed]
Figure 1. (A) Domain annotation of human FOXM1 isoforms. The Forkhead (FH) domain is shown as an octagon. Purple boxes indicate low complexity regions. Vertical bars are provided by the SMART tool for the most studied isoforms and indicate the positions of intron/exon junction. (B) Genomic alteration detection for FOXM1 across the TCGA Pan-Cancer Atlas (calculated by the cBioPortal OncoPrint algorithm). (C) Location of single-point somatic mutations in the FOXM1 gene according to the COSMIC cancer catalogue.
Genes 16 00056 g001
Figure 2. Phylogenetic tree of FOXM1 orthologs in vertebrates. The optimal tree, calculated using the Neighbor-Joining method, is shown. 100 bootstrapping replicates were generated, and the percentage of replicate trees in which the downstream taxa grouped together is shown. The branch lengths are proportional to the number of amino acid substitutions per site, after the Poisson correction method was applied. Tree drawn with MEGA11 and Inkscape.
Genes 16 00056 g002
Figure 3. Expression of FOXM1 across 15 human normal (GTEx) and cancer (TCGA) tissues. (A) Box plots indicting the difference between tumor (left) and normal (right) samples. (B) Beeswarm plots indicating gene-by-gene differential expression (expressed as DESeq2 negative binomial statistics) across 15 human cancer vs. normal comparisons. The X indicates the position of FOXM1 in the gene ranking, and the number below each plot indicates the ranking of FOXM1 in the upregulated transcriptome.
Genes 16 00056 g003
Figure 4. (A) Survival analysis of FOXM1 for the 15 TCGA cancer types selected in this study. Patients were stratified in two groups: with FOXM1 expression above the mean (“FOXM1 high”, in red) and below the mean (“FOXM1 low”, in blue). (B) Master regulator analysis of FOXM1 across the 15 TCGA cancer types selected in this study.
Genes 16 00056 g004
Figure 5. FOXM1 in single cancer cells. (A) Beeswarm plots indicating the levels of FOXM1 in normal cells (left) and tumor cells (right). (B) UMAP plots indicating the expression level of FOXM1 (as LogScale-normalized FPKMs) in normal and tumor cells.
Genes 16 00056 g005
Disclaimer/Publisher’s Note: The statements, opinions and data contained in all publications are solely those of the individual author(s) and contributor(s) and not of MDPI and/or the editor(s). MDPI and/or the editor(s) disclaim responsibility for any injury to people or property resulting from any ideas, methods, instructions or products referred to in the content.

