Article

Genome-Wide Single-Nucleotide Polymorphism-Based Genomic Diversity and Runs of Homozygosity for Selection Signatures in Equine Breeds

1
ICAR-National Research Centre on Equines, Sirsa Road, Hisar 125001, India
2
Division of Agricultural Bioinformatics, ICAR-Indian Agricultural Statistics Research Institute, New Delhi 110012, India
3
ICAR-Central Institute for Research on Buffaloes, Hisar 125001, India
4
Indian Council of Agricultural Research, Krishi Bhawan, New Delhi 110001, India
*
Authors to whom correspondence should be addressed.
These authors contributed equally to this work.
Genes 2023, 14(8), 1623; https://doi.org/10.3390/genes14081623
Submission received: 28 March 2023 / Revised: 31 July 2023 / Accepted: 1 August 2023 / Published: 14 August 2023
(This article belongs to the Special Issue Molecular Genetics in Livestock Production and Disease Resistance)

Abstract

:
The horse, one of the most domesticated animals, has been used for several purposes, like transportation, hunting, in sport, or for agriculture-related works. Kathiawari, Marwari, Manipuri, Zanskari, Bhutia, Spiti, and Thoroughbred are the main breeds of horses, particularly due to their agroclimatic adaptation and role in any kind of strong physical activity, and these characteristics are majorly governed by genetic factors. The genetic diversity and phylogenetic relationship of these Indian equine breeds using microsatellite markers have been reported, but further studies exploring the SNP diversity and runs of homozygosity revealing the selection signature of breeds are still warranted. In our study, the identification of genes that play a vital role in muscle development is performed through SNP detection via the whole-genome sequencing approach. A total of 96 samples, categorized under seven breeds, and 620,721 SNPs were considered to ascertain the ROH patterns amongst all the seven breeds. Over 5444 ROH islands were mined, and the maximum number of ROHs was found to be present in Zanskari, while Thoroughbred was confined to the lowest number of ROHs. Gene enrichment of these ROH islands produced 6757 functional genes, with AGPAT1, CLEC4, and CFAP20 as important gene families. However, QTL annotation revealed that the maximum QTLs were associated with Wither’s height trait ontology that falls under the growth trait in all seven breeds. An Equine SNP marker database (EqSNPDb) was developed to catalogue ROHs for all these equine breeds for the flexible and easy chromosome-wise retrieval of ROH along with the genotype details of all the SNPs. Such a study can reveal breed divergence in different climatic and ecological conditions.

1. Introduction

The horse, scientifically known as Equus ferus caballus, was one of the first domesticated animals and has been used for scores of purposes in human societies. It is used as a companion animal, as well as for food, transportation, draught and agricultural work, and is used in sport, hunting, and warfare [1,2]. In India, there are different species of the family Equidae used for diverse purposes due to the country’s complex arrangement of varying terrains and climatic conditions. The National Commission on Agriculture has identified seven different breeds of horses in India, based on their geographical localization and phenotypic characteristics: Kathiawari, Marwari, Manipuri, Zanskari, Bhutia, Spiti, and Thoroughbred. These breeds of horses differ not just due to their agroclimatic adaptation but also due to their particular performance characteristics [3,4,5,6].
The phenotypical characteristics of Indian equines are highly distinctive and unique in comparison to horses in the rest of the world, which suggests their geographical distribution and subsequent acquisition of selective characteristics over time. The ponies, Spiti and Zanskari, belong to the Himalayan region, making them susceptible to cold temperatures and scarce food availability. Both breeds have high stamina since they can move on steep terrains. Bhutia and Manipuri ponies are similarly capable, with high endurance. Marwari and Kathiawari breeds are understood to be similar to each other due to their close resemblance, as they are related to Arabian horses. Still, Marwari horses are longer than Kathiawari. Kathiawari horses are considered to be the offspring of wild horses of Gujarat and Arabian Sea [4].
A variety of genomic tools have been used to study the genome and functions of modern equines. Considering equines across the world, several generations of high-throughput genotyping arrays known as “single nucleotide polymorphism (SNP) chips” have been released since the equine genome was first sequenced, enabling rapid and cost-effective genotyping. A genotyping array with 54,602 SNPs (Illumina EquineSNP50 BeadChip; Illumina, San Diego, CA, USA) was developed using SNPs identified via Sanger sequencing of a small group of horses [7]. Additionally, Illumina released a higher-density array (Illumina EqineSNP70 BeadChip) with 65,157 SNPs. SNP50 and SNP70 BeadChips have been superseded by the MNEc670 K array, which uses SNPs identified from whole-genome sequences of 153 horses to survey 670,805 sites across the equine genome [8]. Due to an increase in short-read-based whole-genome sequencing (WGS), coupled with advances in chip-based genotyping technologies, the HGS array MNEc2M and the HGS array MNEc670k were entirely redesigned in February 2017.
One of the most common concerns about equines is their physical deformities, which occur due to their racing- and performance-based activities, as well as genetic factors [9]. A lot of equines suffer from skeletal-related diseases. One such disease is skeletal ativism, which causes abnormal growth of the uvula and tarsal joints, sometimes leading to the death of the horses. A similar study has been conducted on Sweden Shetland ponies and their mutations have been detected, leading to the cause of ativism. Using the method of whole-genome sequencing through SNP detection, the importance and significance of the gene SHOX in the muscle development of horses have been determined [10]. Divergent genetic population studies were also conducted using an approximately 670,000-SNP genotyping array in European horse breeds [11]. The study highlighted the putative target genes like embryonic morphogenesis (HOXB), energy metabolism (IGFBP-1, IGFBP-3), and autophagy (RALB). This study conducted the experiment on 1476 horses belonging to 12 breeds. Population-based studies are important in horses in order to help us understand their genetic variations and domestication possibilities. Equine SNP arrays have been successfully used in the discovery of variation associated with important traits [12,13,14,15,16].
Though a study on the genetic diversity and phylogenetic relationship of Indian equine breeds like Spiti, Zanskari, Manipuri, Bhutia, Kathiawari, and Marwari using microsatellite markers was reported [3,4,6], there are no reports on SNP diversity and runs of homozygosity revealing the selection signature of breeds. Such a study can reveal how breed divergence has occurred in different climatic and ecological conditions.

2. Methodology

2.1. Samples Collection, DNA Extraction and SNP Genotyping

Blood samples were collected from the jugular vein into a vacutainer with potassium ethylenediaminetetraacetic acid (K2 EDTA) from 07 horse breeds, namely Manipuri (17), Zanskari (20), Bhutia (20), Spiti (16), Kathiawari (10), Marwari (10), and Thoroughbred (3), covering 96 genotypes. All blood samples were transported to the research laboratory in an ice box and stored at 4 °C and processed for DNA isolation.
According to the manufacturer’s instructions, genomic DNA was isolated from blood using a ReliaPrep™ Blood gDNA Miniprep System (Promega, DC, USA). The isolated DNA was stored at −20 °C to prevent DNA degradation. Agarose gel electrophoresis (0.8% agarose gel) and a Qubit4 fluorometer were used to qualitatively and quantitatively analyze DNA (at 260 nm/280 nm absorbance). Samples were genotyped using the Axiom™ Equine Genotyping Array with an average recall rate of 92.6% for each sample.

2.2. Data Quality Control and Measurement of Runs of Homozygosity and Their Distribution

For every individual, Runs of Homozygosity (ROH) were computed using PLINK v 1.9 [17,18]. Before estimation of Runs of Homozygosity, a quality check and Linkage Disequilibrium pruning were performed. To check the quality of the SNPs, markers with more than 15% missing values and low-frequency SNPs were eliminated by setting the minor allele frequency (MAF) to less than 5%. Individuals with more than 10% missing SNP calls were removed from the genotype dataset.
To exclude short and common ROH, which were present across the genome, the minimum ROH length was set to 1 Mb so that short ROHs induced by LD effects could be excluded [19]. Other parameters that were set for computing ROH were (i) a sliding window with 50 SNPs across the whole genome; (ii) an overlapping homozygous proportion window at 0.05; (iii) a minimum number of consecutive ROH at 100; (iv) minimum length of ROH at 1 Mb; (v) density of single SNP per 50 kb; (vi) a maximum distance between consecutive homozygous SNPs of 100 kb; and (vii) allowing a maximum of 5 SNPs with missing genotypes and up to one heterozygous genotypes in a ROH. The obtained ROH were congregated into five classes according to the nomenclature of Kirin et al. (2010) and Ferenčaković et al. (2013a; 2013b), i.e., 1–2, 2–4, 4–8, 8–16 and >16 Mb [20,21,22]. For every individual of each breed, the mean number of ROH per individual (MROH), the average length of ROH (AROH) and the total number of ROH per breed (NROH) were computed. The percentage of chromosomes covered by ROH was also computed. To achieve this, the mean ROH length was calculated by adding all the ROHs (in Mb) on each chromosome and dividing by the number of individuals that had ROH on that chromosome. This mean was then further divided by the length of the chromosome (in Mb).

2.3. Genomic Inbreeding Coefficients

The genomic inbreeding coefficients (both FHOM and FROH) were estimated using PLINK v 1.9. FROH (Inbreeding coefficient) was computed as stated by McQuillan et al. [23], i.e.,
F R O H = L R O H L A U T O
where, L R O H refers to the total length of all ROH in an individual genome and L A U T O represents the total autosomal length covered by SNPs included in an array.
Inbreeding based on the observed versus expected number of homozygous genotypes (FHOM) was calculated using PLINK v1.90 by computing observed and expected autosomal homozygous genotypes counts for each sample as follows:
F H O M = Number of observed homozygous loci Number of expected homozygous loci Number of nonmissing loci Number of expected homozygous loci

2.4. Population Diversity Analysis

For population diversity analysis, STRUCTURE v.2.3.1 was used [24], which implements a Bayesian model-based clustering approach that identifies the second-order rate of change of the likelihood (∆K). It estimates the optimal subpopulations and the membership probability of each genotype to the subpopulations. For this analysis, 5 independent iterations for each sub-population were performed under the admixture model of population structure with correlated allele frequencies and 50,000 lengths burn-in period. Then, 100,000 Markov Chain Monte Carlo (MCMC) replications after burn-in were applied for each iteration.

2.5. Gene Annotation and Functional Enrichment Analysis

All the SNPs of ROH were annotated to mine the functional genes using SnpEFF [25]. These Genes corresponding to ROH island regions were further used for enrichment analysis. Gene ontology (GO) and Kyoto Encyclopedia of Genes and Genomes (KEGG) pathway enrichment analysis was performed by searching against the GO database using DAVID, a Bioinformatics resource [26]. All horse genes annotated in ENSEMBL were considered the background set. The p-value was adjusted using false discovery rates (q values). Subsequently, significance was based on a corrected false discovery rate value set at q ≤ 0.05.

2.6. ROH Annotation by Horse QTL Database

Known QTLs of horses, which are falling in ROH regions, were superimposed over the horse QTL map. QTL details were obtained from the Horse QTL database (https://www.animalgenome.org/cgi-bin/QTLdb/EC/index) (accessed on 14 March 2022) for the EC_3.0 assembly and was plotted against top 20 ROH islands. Information used to locate the important traits within the relevant genomic regions was mined and this was carried out based on SNP markers via the filtering criteria.

2.7. Development of Equine SNP Marker Database

The Equine SNP marker database (EqSNPDb) was developed using three-tier architecture. It consists of a database layer, an application layer (server), and a presentation layer (client). It is a relational database that provides information about the Runs of Homozygosity (ROH) deciphered from SNPs of the equine breeds under study. All the information about ROHs was saved in the form of tables in MySQL at the database level. For fetching and queries provided by the user, scripting in PHP was conducted in the middle tier, i.e., the application layer. To allow clients to browse the database, web pages were developed in the form of a presentation layer.

3. Results

3.1. Filtration of Genotypes

The overall genotyping rate for these 96 samples was 99.8%. These 96 genotypes belonged to seven breeds, namely, Manipuri (17), Zanskari (20), Bhutia (20), Spiti (16), Kathiawari (10), Marwari (10) and Thoroughbred (3). A total of 620,721 SNPs were filtered and were carried further for ROH analysis.

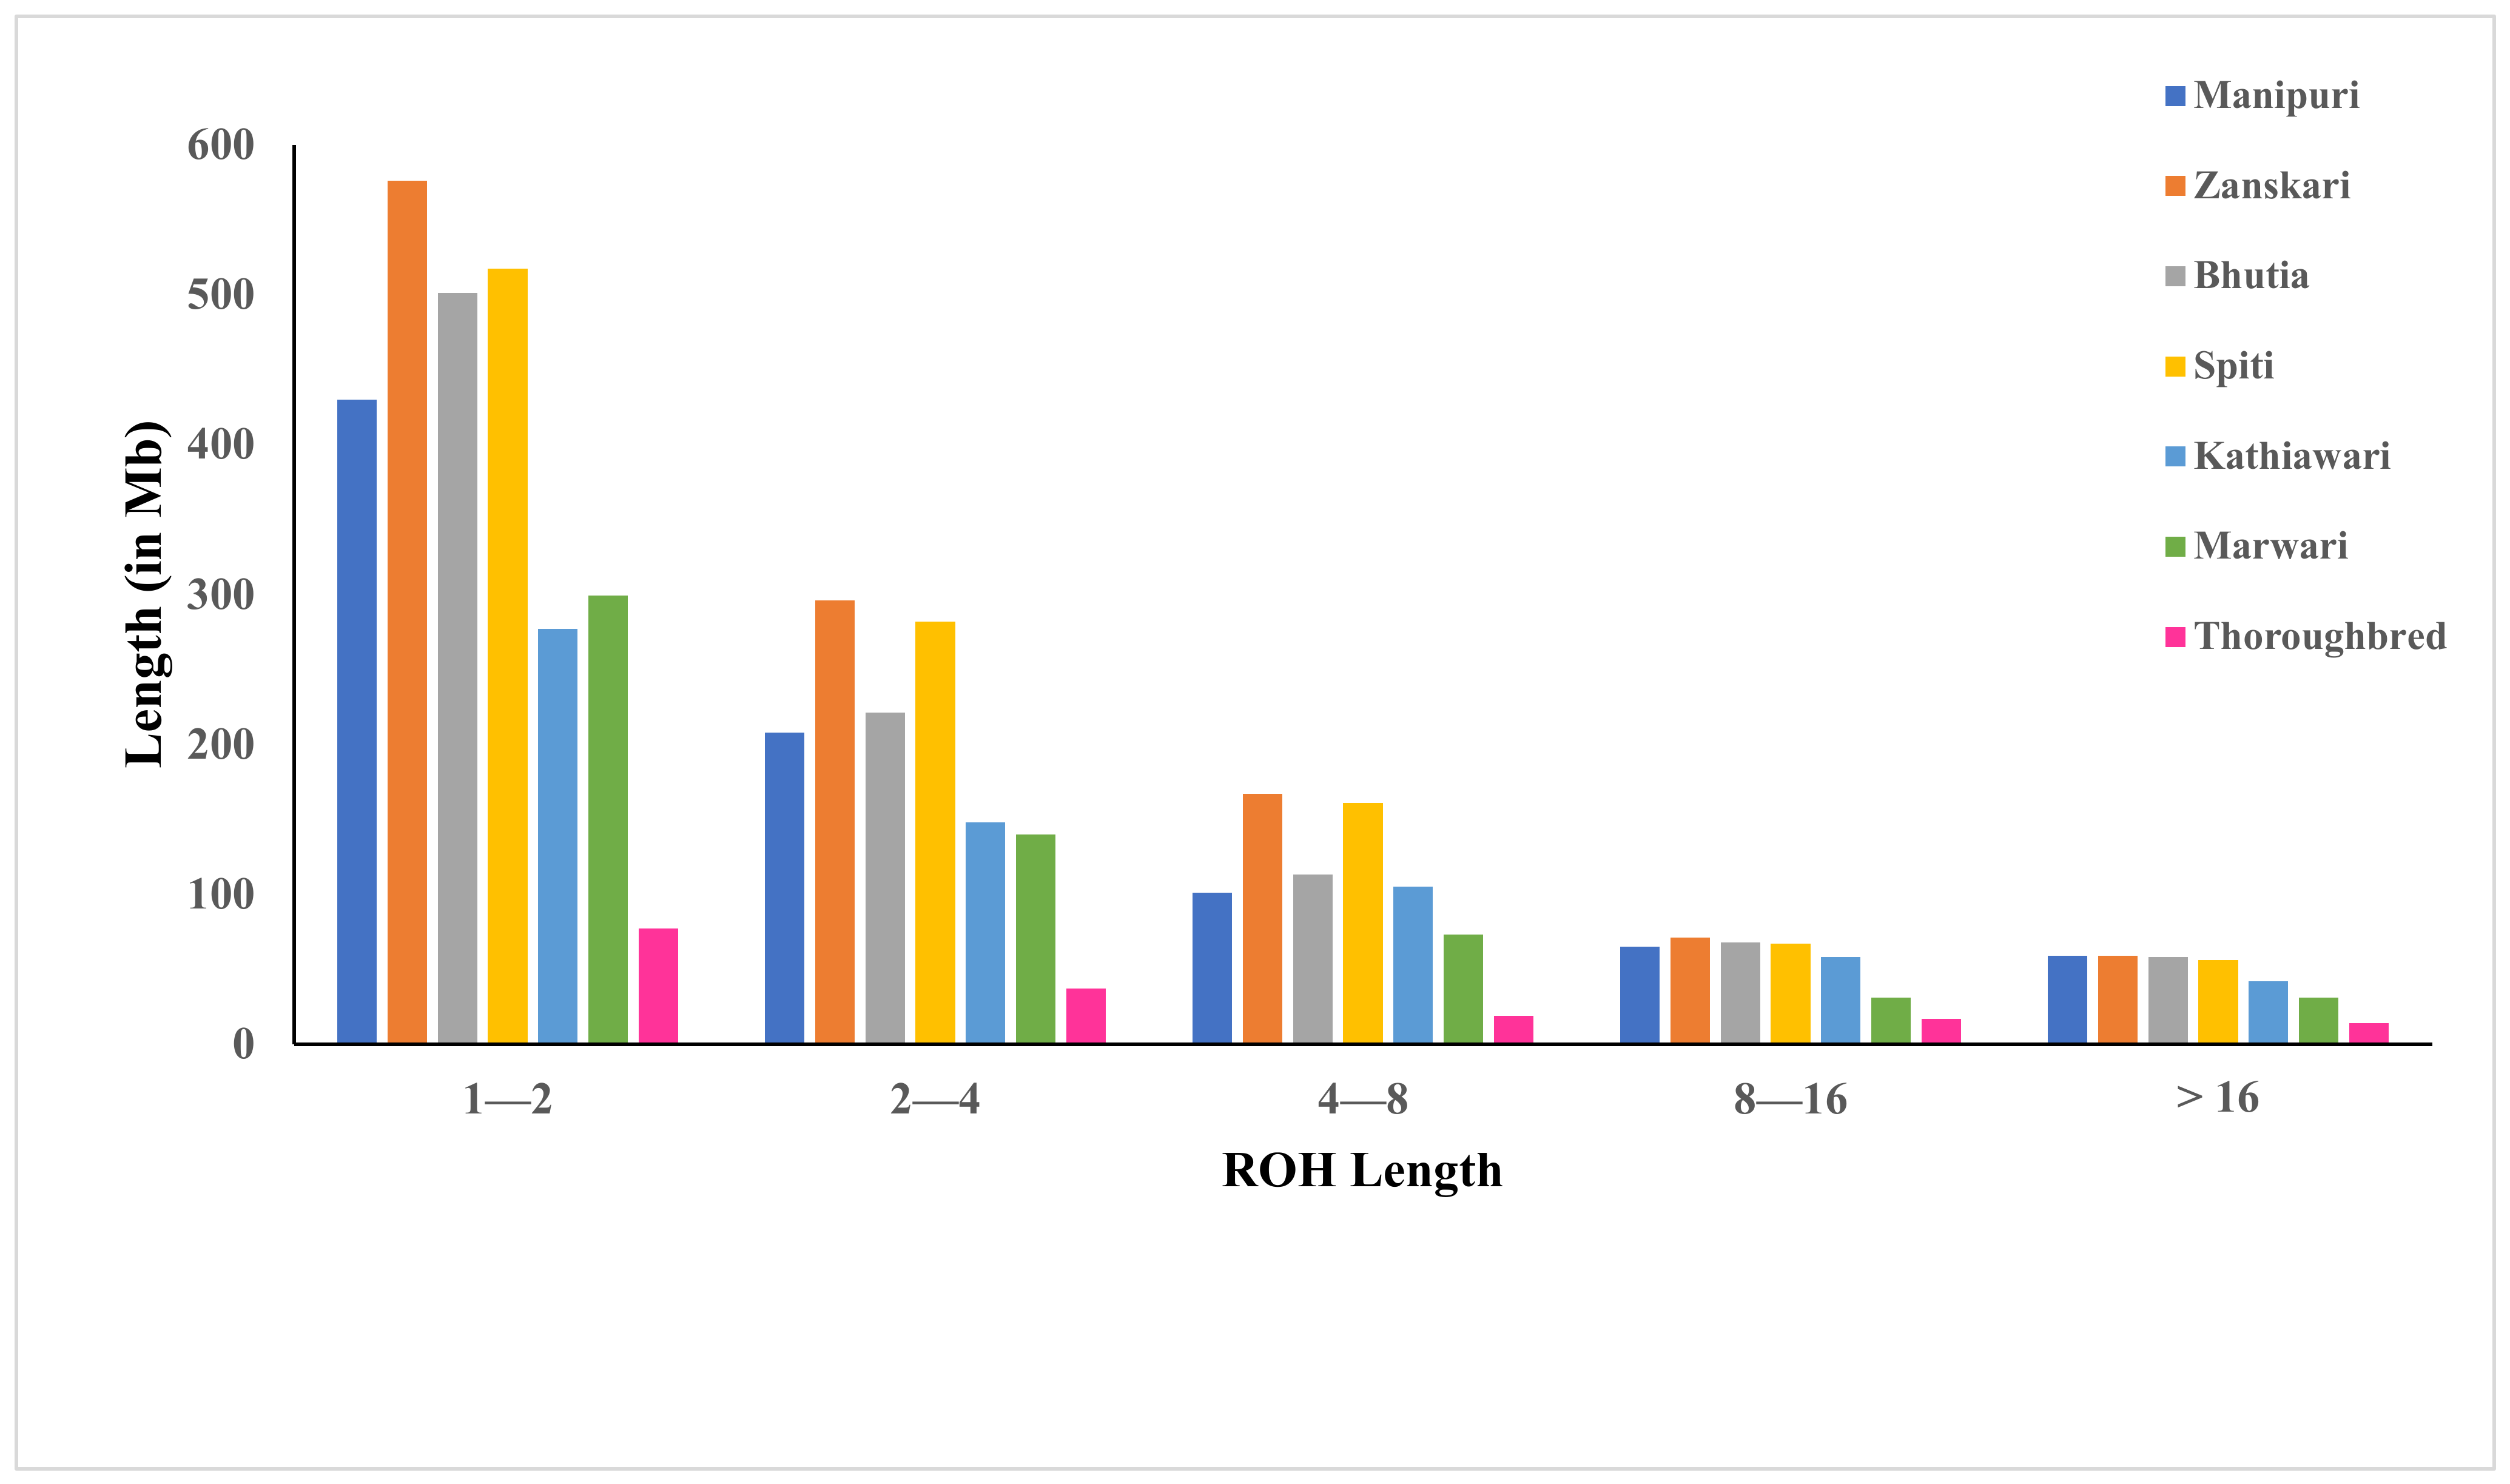
3.2. ROH Distribution

A total of 5444 homozygous segments were identified. The mean number of ROH was highest for Thoroughbred (1350.84), followed by Kathiawari (1286.31) and Bhutia (1212.11), while the mean number of ROH per animal was highest in Spiti, i.e., 67.69, and lowest in Bhutia, i.e., 48.05. After computing the average length of ROHs for all breeds, it was observed that the Marwari breed had the lowest average length of 4.6 Mb and Thoroughbred had highest average length of 5.7 Mb. A significant number of ROHs were observed on chromosome 1, i.e., 373 (6.85%) and the chromosome 30 had the least number of ROHs, i.e., 66 (1.01%). Details of the ROHs for each chromosome are given in Figure 1. The percentage variation of the ROHs of each chromosome for all breeds is also shown. Breed-wise ROH for each chromosome is given in Supplementary Sheet S1. Chromosome X are the scaffolds showing the number of ROHs.
The total number and length of genomes under ROH for each individual in a breed is given in Figure 2. It was observed that majority of the individuals clustered close to the origin due to the abundant presence of short ROHs in all seven breeds.
The proportion of autosomal ROH variation within a breed and between different breeds was studied. When the frequency of ROH categorized according to the length of ROH among all the breeds was plotted, Zanskari showed the maximum length, followed by Spiti and Manipuri (Figure 3).
While studying the percentage of genome coverage by ROH, Manipuri had minimum coverage and Spiti had maximum genome coverage. The average genomic inbreeding (FROH > 1 Mb) coefficient of Spiti was higher and Thoroughbred had the lowest. On the other hand, FROH > 8 Mb of Thoroughbred was the highest and Zanskari had minimum value. Detailed information about the inbreeding coefficient for all the species has been provided in Table 1 above. Statistics of ROH size based on the breeds are provided in Table 2.

3.3. Population Diversity and Structure Analysis

To comprehend the pattern of the genetic structure, a Bayesian clustering analysis was conducted using STRUCTURE. This population structure analysis was conducted with K values ranging from 2 to 7 with an admixture model and five iterative runs for each K value. An Evanno test was further conducted to determine the log-likelihood (LnP(D)) values and ΔK between for each K number. A population structure analysis of all 96 individuals from different breeds of Equus caballus based on SNPdata at K = 2, 3 and 4 is represented in Figure 4. Here, each bar represents an individual, where different colors for that particular individual show the estimated admixture from the ancestral population, calculated using the Q statistic. At K = 2, 3 and 4, all seven breeds with 96 samples were divided into two, three and four subpopulations, respectively (Figure 4), indicating the inferred ancestral population. The structure analysis at K = 2 suggested that admixture has occurred to a greater extent, as pure lines were present in a lesser amount, and this was also validated with the help of PCA results. A similar admixture pattern was detected with K = 3 and k = 4 as clustering criteria, and again this was confirmed with PCA results. It was observed that most of the population exhibited a certain amount of admixture and contained far less pure lines. Bhutia had the least diversity, followed by Marwari, compared to other breeds which were under study. As a whole, it can be inferred that high levels of introgression have ensued to a wider extent amongst the breeds under study.

3.4. Gene Annotation and Enrichment Analysis

SNP annotation by SnpEff produced total of 18,395 candidate genes within ROH islands. In all the breeds, GO terms and pathways associated with these genes were verified for evidence of functional enrichment. This produced 6757 genes which were further categorized into Biological Processes, Molecular Functions, and Cellular Components. The details of their GO IDs have been provided in Supplementary Sheet S2. Detailed gene ontology segregation according to the category has been provided in Figure 5.
Pathway analysis revealed that most of the genes were involved in metabolic pathways, followed by pathways related to cancer. Most of the genes covered under ROH islands were related to various diseases in horses, directly or indirectly. Top genes based on gene count and p-value were chosen and plotted. Details of all the pathways along with their p-values and gene count have been provided in Supplementary Sheet S3, Supplementary Figure S1.

3.5. QTL Analysis

It was observed that the maximum number of QTLs (52) was present in Zanskari, while Manipuri possessed the minimum number of QTLs, i.e., 42. Details based on class have been provided in Table 3. Maximum QTLs which were involved were linked with Wither’s height, which is the sub-category of the Growth trait in all seven breeds. Another important QTL that was identified was CMO: a body movement measurement which determines the type of gait in the horse. (This trait falls under the performance category of traits). Other traits which were mined during QTL analysis are insect bite hypersensitivity, racing ability, osteochondrosis, semen quality, and jumping ability. Details of all the traits are provided in Supplementary Sheet S4. Various important genes associated with different traits have been provided in Table 4.

3.6. Development of Equine SNP Marker Database

In the Equine SNP marker database (EqSNPDb), ROHs have been catalogued for all seven equine breeds along with all the samples in the form of a database. The ROH page provides an interactive interface where the user can choose the breed name as well as the chromosome number to retrieve the information of a particular breed. The result table provides the sample names corresponding to that breed, chromosome number, SNP ID, SNP position, length of ROH, and the number of SNPs in that ROH. SNPs page provides the genotype details of all the 620,721 SNPs in a tabular form. EqSNPDb is freely accessible at http://webtom.cabgrid.res.in/eqsnpdb/.

4. Discussion

In this study, Axiom™ Equine Genotyping Array Chip was used to identify the ROH islands in seven Indian horse (Equus caballus) breeds. According to the study published by Willing et al., Colli et al., and Utsunomiya et al. [27,28,29], a sample size can be as small as 4–6 and the polymorphic SNPs markers under investigation must be sufficiently large. To obtain better results, we have tried to fulfill both conditions by taking sample size accordingly for all the seven breeds, and the 620,721 variants were used for the ROH study. Amongst 5444 ROH islands, the mean number of ROH per animal was highest in Spiti and lowest in Bhutia. The maximum number of ROHs was present in the Zanskari breed, followed by Spiti distributed over all 31 chromosomes, and Thoroughbred contained least ROHs. ROH islands give a direct breed signature, as reported in the study of Ovine SNP 50 K in which 17 unique ROH islands could segregate 13 breeds under study [30]. ROH islands can also provide information about the genes associated with the desired traits and contribute to the inbreeding estimation of synthetic breed population, i.e., artificial selection [31].
The maximum amount of genome coverage was shown by the Spiti breed, which was in coherence with a large number of ROHs, while the minimum coverage was shown by the Manipuri breed. The length of ROH has a negative correlation with the time of co-ancestry because the random recombination events interrupt the transfer of lengthy chromosomal segments in the long run [32,33]. Thus, long ROH (>8 Mb) in Zanskari must have arrived due to inbreeding of up to five generations. On the contrary, the genomic segments possessing short ROHs (~1–8 Mb) have a greater relatedness, historically [34].
Among the seven breeds, four of them (Bhutia, Spiti, Kathiawari, Thoroughbred) had a greater portion of their autosome genome covered by ROH. The genomic inbreeding coefficient was low (FROH > 1 Mb) in all the breeds except Thoroughbred. These estimates of inbreeding are in agreement with the abundance and length of ROH in all the samples.
Upon gene enrichment analysis, a total of 6757 genes were annotated as functional. Upon analysis, it was revealed that the maximum number of genes was a part that was responsible for cellular components. Some of the important genes that were identified are from the AGPAT1, CLEC4, and CFAP20 families [35,36,37] and are involved in lipid biosynthesis, part of the C-type lectin domain that contains and regulates cell motility. Many of the genes like OAS1 and BPIF that are involved in immune response were also located in the study [38]. CRK-like proto-oncogene (CRKL) was also mined, and this plays a vital role in the regulation of immune cell functions that lead to cell migration and adhesion, cell proliferation, differentiation, and finally apoptosis, as suggested in a study involving humans [39]. ROH can act as a selection signature over the genome of a population to indicate the genes associated with significant traits leading to differentiation of the breed. Such studies have been previously carried out in sheep to study the role of genes lying near ROHs to identify the important traits like growth, body weight, meat quality/production, wool production and pigmentation, etc. [40].
ROH can also contribute to the conservation program of the breed by keeping in mind the level of inbreeding, pedigree comparison and heterozygosity correlation, followed by the construction of breed specific model for conservation rather than a generalized model for breed conservation. It can be used for analysis of animal admixture and monitoring of effective population size rather than census size for effective conservation programs [41]. Besides, the STRUCTURE analysis result gives the idea of introgression of alleles (i.e., breed admixture/ dilution) and the historical migration of individuals among the populations as well as common ancestry, if any, for different numbers of clusters [42].
It has been reported that FROH provides insight for inferring details about the history as well as about inbreeding levels of a population. Therefore, ROH has been used for the conservation of endangered populations for which genealogical information is not available [43].
In our study, while considering QTL annotation, maximum QTLs were linked with Wither’s height trait ontology that falls under the growth trait in all seven breeds. Various other traits that were present included insect bite hypersensitivity, racing ability, osteochondrosis, semen quality, and jumping ability. ROH patterns can reveal the genomic regions containing alleles associated with the traits under selection, and hence can predict QTL. Thus, they provide insight into genes related to a variety of traits, as reported in sheep [44]. Additionally, ROH association studies have been found to be more effective for explaining genetic variance concerning SNP [45].

5. Conclusions

Our study highlights the characterization of autozygosity in seven important horse breeds of India, with the main focus of short (ROH > 1 Mb) and long (ROH > 8 Mb) ROH regions. By monitoring genomic inbreeding (FROH), it was revealed that most of the breeds are mostly random bred and hence preserve sufficient genetic variability. The main genes underlying these ROH regions were mainly responsible for various metabolic functions, constituted cell parts, or were a part of major biological processes.

Supplementary Materials

The following supporting information can be downloaded at: https://www.mdpi.com/article/10.3390/genes14081623/s1, Sheet S1: ROH variation chromosome wise for all breeds; Sheet S2: Gene ontology analysis results Sheet S3: List of important Pathways; Sheet S4: Detailed results of QTL analysis; Supplementary Figure S1. Pathway Analysis.

Author Contributions

A.B. and S.J. conceived the theme of the study; A.B., Y.P., V.N., S.S., R.A.L. and T.R.T. performed the sample collection and DNA extraction; G.T., N.K.S., M.A.I. and S.J. performed the computational analysis; A.B., G.T. and S.J. drafted the original manuscript; M.A.I., V.N., Y.P., T.K.B., B.N.T., A.R. and D.K. edited the manuscript; All co-authors read and approved the final manuscript. All authors have read and agreed to the published version of the manuscript.

Funding

This work was supported by CABin grant (F. No. Agril. Edn.4-1/2013-A&P) of ICAR-IASRI, New Delhi.

Institutional Review Board Statement

Permission of the Institute Animal Ethics Committee (IAEC), ICAR-National Research Centre on Equines, Hisar was obtained before sample collection via approval number NRCE/CPCSEA/2017-18 Dated 18 September 2017.

Informed Consent Statement

Not applicable.

Data Availability Statement

All analysed data are available at http://webtom.cabgrid.res.in/eqsnpdb/. The same is mentioned in the manuscript also.

Acknowledgments

The authors are thankful to the Indian Council of Agricultural Research, Ministry of Agriculture and Farmers’ Welfare, Govt. of India for providing financial assistance in the form of CABin grant (F. no. Agril. Edn.4-1/2013-A&P) as well as the Advanced Super Computing Hub for Omics Knowledge in Agriculture (ASHOKA) facility at ICAR-IASRI, New Delhi, India. The grant of Junior Research Fellowship to NKS provided by the ICAR-Indian Agricultural Research Institute, New Delhi is duly acknowledged.

Conflicts of Interest

The authors declare that there are no conflict of interest.

References

  1. Wade, C.M.; Giulotto, E.; Sigurdsson, S.; Zoli, M.; Gnerre, S.; Imsland, F.; Lindblad-Toh, K. Genome sequence, comparative analysis, and population genetics of the domestic horse. Science 2009, 326, 865–867. [Google Scholar] [PubMed] [Green Version]
  2. Jun, J.; Cho, Y.S.; Hu, H.; Kim, H.M.; Jho, S.; Gadhvi, P.; Bhak, J. Whole genome sequence and analysis of the Marwari horse breed and its genetic origin. BMC Genom. 2014, 15, S4. [Google Scholar]
  3. Gupta, A.K.; Tandon, S.N.; Pal, Y.; Bhardwaj, A.; Chauhan, M. Phenotypic characterization of Indian equine breeds: A comparative study. Anim. Genet. Resour. 2012, 50, 49–58. [Google Scholar]
  4. Gupta, A.K.; Chauhan, M.; Bhardwaj, A.; Gupta, N.; Gupta, S.C.; Pal, Y.; Vijh, R.K. Comparative genetic diversity analysis among six Indian breeds and English Thoroughbred horses. Livest. Sci. 2014, 163, 1–11. [Google Scholar]
  5. Pal, Y.; Legha, R.A.; Bhardwaj, A.; Tripathi, B.N. Status and conservation of equine biodiversity in India. Indian J. Comp. Microbiol. Immunol. Infect. Dis. 2020, 41, 174–184. [Google Scholar]
  6. Behl, R.; Behl, J.; Gupta, N.; Gupta, S.C. Genetic relationships of five Indian horse breeds using microsatellite markers. Animal 2007, 1, 483–488. [Google Scholar] [PubMed] [Green Version]
  7. McCue, M.E.; Bannasch, D.L.; Petersen, J.L.; Gurr, J.; Bailey, E.; Binns, M.M.; Mickelson, J.R. A high density SNP array for the domestic horse and extant Perissodactyla: Utility for association mapping, genetic diversity, and phylogeny studies. PLoS Genet. 2012, 8, e1002451. [Google Scholar]
  8. Schaefer, R.J.; Schubert, M.; Bailey, E.; Bannasch, D.L.; Barrey, E.; Bar-Gal, G.K.; McCue, M.E. Developing a 670k genotyping array to tag~ 2M SNPs across 24 horse breeds. BMC Genom. 2017, 18, 565. [Google Scholar]
  9. Gupta, A.; Bhardwaj, A.; Sharma, P.; Pal, Y. Mitochondrial DNA-a tool for phylogenetic and biodiversity search in equines. J. Biodivers. Endanger. Species 2015, 1, 1–8. [Google Scholar]
  10. Rafati, N.; Andersson, L.S.; Mikko, S.; Feng, C.; Raudsepp, T.; Pettersson, J.; Rubin, C.J. Large deletions at the SHOX locus in the pseudoautosomal region are associated with skeletal atavism in Shetland Ponies. G3 Genes Genomes Genet. 2016, 6, 2213–2223. [Google Scholar]
  11. Grilz-Seger, G.; Neuditschko, M.; Ricard, A.; Velie, B.; Lindgren, G.; Mesarič, M.; Druml, T. Genome-wide homozygosity patterns and evidence for selection in a set of European and near eastern horse breeds. Genes 2019, 10, 491. [Google Scholar] [PubMed] [Green Version]
  12. Solé, M.; Ablondi, M.; Binzer-Panchal, A.; Velie, B.D.; Hollfelder, N.; Buys, N.; Ducro, B.J.; François, L.; Janssens, S.; Schurink, A.; et al. Inter-and intra-breed genome-wide copy number diversity in a large cohort of European equine breeds. BMC Genom. 2019, 20, 759. [Google Scholar]
  13. Norton, E.; Schultz, N.; Geor, R.; McFarlane, D.; Mickelson, J.; McCue, M. Genome-wide association analyses of equine metabolic syndrome phenotypes in Welsh ponies and Morgan horses. Genes 2019, 10, 893. [Google Scholar] [PubMed]
  14. Raudsepp, T.; McCue, M.E.; Das, P.J.; Dobson, L.; Vishnoi, M.; Fritz, K.L.; Schaefer, R.; Rendahl, A.K.; Derr, J.N.; Love, C.C.; et al. Genome-wide association study implicates testis-sperm specific FKBP6 as a susceptibility locus for impaired acrosome reaction in stallions. PLoS Genet. 2012, 8, 1003139. [Google Scholar]
  15. Fawcett, J.A.; Sato, F.; Sakamoto, T.; Iwasaki, W.M.; Tozaki, T.; Innan, H. Genome-wide SNP analysis of Japanese Thoroughbred racehorses. PLoS ONE 2019, 14, 0218407. [Google Scholar]
  16. Cosgrove, E.J.; Sadeghi, R.; Schlamp, F.; Holl, H.M.; Moradi-Shahrbabak, M.; Miraei-Ashtiani, S.R.; Brooks, S.A. Genome diversity and the origin of the Arabian horse. Sci. Rep. 2020, 10, 9702. [Google Scholar] [PubMed]
  17. Chang, C.C.; Chow, C.C.; Tellier, L.C.; Vattikuti, S.; Purcell, S.M.; Lee, J.J. Second-generation PLINK: Rising to the challenge of larger and richer datasets. Gigascience 2015, 4, s13742-015. [Google Scholar]
  18. Purcell, S.; Neale, B.; Todd-Brown, K.; Thomas, L.; Ferreira, M.A.; Bender, D.; Maller, J.; Sklar, P.; De Bakker, P.I.; Daly, M.J.; et al. PLINK: A tool set for whole-genome association and population-based linkage analyses. Am. J. Hum. Genet. 2007, 81, 559–575. [Google Scholar]
  19. Fang, Y.; Hao, X.; Xu, Z.; Sun, H.; Zhao, Q.; Cao, R.; Pan, Y. Genome-wide detection of runs of homozygosity in Laiwu pigs revealed by sequencing data. Front. Genet. 2021, 12, 629966. [Google Scholar]
  20. Kirin, M.; McQuillan, R.; Franklin, C.S.; Campbell, H.; McKeigue, P.M.; Wilson, J.F. Genomic runs of homozygosity record population history and consanguinity. PLoS ONE 2010, 5, e13996. [Google Scholar]
  21. Ferenčaković, M.; Hamzić, E.; Gredler, B.; Solberg, T.R.; Klemetsdal, G.; Curik, I.; Sölkner, J. Estimates of autozygosity derived from runs of homozygosity: Empirical evidence from selected cattle populations. J. Anim. Breed. Genet. 2013, 130, 286–293. [Google Scholar]
  22. Ferenčaković, M.; Sölkner, J.; Curik, I. Estimating autozygosity from high-throughput information: Effects of SNP density and genotyping errors. Genet. Sel. Evol. 2013, 45, 42. [Google Scholar]
  23. McQuillan, R.; Leutenegger, A.L.; Abdel-Rahman, R.; Franklin, C.S.; Pericic, M.; Barac-Lauc, L.; Smolej-Narancic, N.; Janicijevic, B.; Polasek, O.; Tenesa, A.; et al. Runs of homozygosity in European populations. Am. J. Hum. Genet. 2008, 83, 359–372. [Google Scholar] [CrossRef] [Green Version]
  24. Kaeuffer, R.; Réale, D.; Coltman, D.W.; Pontier, D. Detecting population structure using STRUCTURE software: Effect of background linkage disequilibrium. Heredity 2007, 99, 374–380. [Google Scholar]
  25. Cingolani, P. Variant annotation and functional prediction: SnpEff. In Variant Calling: Methods and Protocols; Springer: New York, NY, USA, 2022; pp. 289–314. [Google Scholar]
  26. Huang, D.W.; Sherman, B.T.; Tan, Q.; Kir, J.; Liu, D.; Bryant, D.; Guo, Y.; Stephens, R.; Baseler, M.W.; Lane, H.C.; et al. DAVID Bioinformatics Resources: Expanded annotation database and novel algorithms to better extract biology from large gene lists. Nucleic Acids Res. 2007, 35 (Suppl. 2), W169–W175. [Google Scholar]
  27. Willing, E.M.; Dreyer, C.; van Oosterhout, C. Estimates of genetic differentiation measured by FST do not necessarily require large sample sizes when using many SNP markers. PLoS ONE 2012, 7, e42649. [Google Scholar]
  28. Colli, L.; Milanesi, M.; Vajana, E.; Iamartino, D.; Bomba, L.; Puglisi, F. New insights on water buffalo genomic diversity and postdomestication migration routes from medium density SNP chip data. Front. Genet. 2018, 9, 53. [Google Scholar] [CrossRef] [Green Version]
  29. Utsunomiya, Y.T.; Milanesi, M.; Fortes, M.R.S.; Porto-Neto, L.R.; Utsunomiya, A.T.H.; Silva, M.V.G.B.; Garcia, J.F.; Ajmone-Marsan, P. Genomic clues of the evolutionary history of Bos indicus cattle. Anim. Genet. 2019, 50, 557–568. [Google Scholar]
  30. Dzomba, E.F.; Chimonyo, M.; Pierneef, R.; Muchadeyi, F.C. Runs of homozygosity analysis of South African sheep breeds from various production systems investigated using OvineSNP50k data. BMC Genom. 2021, 22, 7. [Google Scholar]
  31. Xu, Z.; Mei, S.; Zhou, J.; Zhang, Y.; Qiao, M.; Sun, H.; Peng, X. Genome-wide assessment of runs of homozygosity and estimates of genomic inbreeding in a chinese composite pig breed. Front. Genet. 2021, 12, 720081. [Google Scholar]
  32. Howrigan, D.P.; Simonson, M.A.; Keller, M.C. Detecting autozygosity through runs of homozygosity: A comparison of three autozygosity detection algorithms. BMC Genom. 2011, 12, 460. [Google Scholar]
  33. Mastrangelo, S.; Tolone, M.; Sardina, M.T.; Sottile, G.; Sutera, A.M.; Di Gerlando, R.; Portolano, B. Genome-wide scan for runs of homozygosity identifies potential candidate genes associated with local adaptation in Valle del Belice sheep. Genet. Sel. Evol. 2017, 49, 84. [Google Scholar]
  34. Peripolli, E.; Stafuzza, N.B.; Munari, D.P.; Lima, A.L.F.; Irgang, R.; Machado, M.A.; do Carmo Panetto, J.C.; Vieira Ventura, R.; Baldi, F.; da Silva, M.V.G.B. Assessment of runs of homozygosity islands and estimates of genomic inbreeding in Gyr (Bos indicus) dairy cattle. BMC Genom. 2018, 19, 34. [Google Scholar]
  35. Subauste, A.R.; Elliott, B.; Das, A.K.; Burant, C.F. A role for 1-acylglycerol-3-phosphate-O-acyltransferase-1 in myoblast differentiation. Differentiation 2010, 80, 140–146. [Google Scholar]
  36. Zhu, Q.; Huo, H.; Fu, Q.; Yang, N.; Xue, T.; Zhuang, C.; Liu, X.; Wang, B.; Su, B.; Li, C. Identification and characterization of a C-type lectin in turbot (Scophthalmus maximus) which functioning as a pattern recognition receptor that binds and agglutinates various bacteria. Fish Shellfish Immunol. 2021, 115, 104–111. [Google Scholar]
  37. Hestand, M.S.; Kalbfleisch, T.S.; Coleman, S.J.; Zeng, Z.; Liu, J.; Orlando, L.; MacLeod, J.N. Annotation of the protein coding regions of the equine genome. PLoS ONE 2015, 10, e0124375. [Google Scholar]
  38. Ząbek, T.; Semik, E.; Wnuk, M.; Fornal, A.; Gurgul, A.; Bugno-Poniewierska, M. Epigenetic structure and the role of polymorphism in the shaping of DNA methylation patterns of equine OAS1 locus. J. Appl. Genet. 2015, 56, 231–238. [Google Scholar]
  39. Braiman, A.; Isakov, N. The role of Crk adaptor proteins in T-cell adhesion and migration. Front. Immunol. 2015, 6, 509. [Google Scholar] [CrossRef] [Green Version]
  40. Nosrati, M.; Nanaei, H.A.; Javanmard, A.; Esmailizadeh, A. The pattern of runs of homozygosity and genomic inbreeding in world-wide sheep populations. Genomics 2021, 113, 1407–1415. [Google Scholar]
  41. Addo, S.; Klingel, S.; Thaller, G.; Hinrichs, D. Genetic diversity and the application of runs of homozygosity-based methods for inbreeding estimation in German White-headed Mutton sheep. PLoS ONE 2021, 16, e0250608. [Google Scholar]
  42. Barani, S.; Nejati-Javaremi, A.; Moradi, M.H.; Moradi-Sharbabak, M.; Gholizadeh, M.; Esfandyari, H. Genome-wide study of linkage disequilibrium, population structure, and inbreeding in Iranian indigenous sheep breeds. PLoS ONE 2023, 18, e0286463. [Google Scholar]
  43. Peripolli, E.; Munari, D.P.; Silva, M.V.G.B.; Lima, A.L.F.; Irgang, R.; Baldi, F. Runs of homozygosity: Current knowledge and applications in livestock. Anim. Genet. 2017, 48, 255–271. [Google Scholar]
  44. Selli, A.; Ventura, R.V.; Fonseca, P.A.; Buzanskas, M.E.; Andrietta, L.T.; Balieiro, J.C.; Brito, L.F. Detection and visualization of heterozygosity-rich regions and runs of homozygosity in worldwide sheep populations. Animals 2021, 11, 2696. [Google Scholar]
  45. Sanglard, L.P.; Huang, Y.; Gray, K.A.; Linhares, D.C.; Dekkers, J.; Niederwerder, M.C.; Serão, N.V. Further host-genomic characterization of total antibody response to PRRSV vaccination and its relationship with reproductive performance in commercial sows: Genome-wide haplotype and zygosity analyses. Genet. Sel. Evol. 2021, 53, 1–17. [Google Scholar]
Figure 1. Chromosome-wise ROH variation of autosomes of all equine breeds under study (S = scaffolds). Blue bars represent the chromosome-wise number (frequency) of ROH. Brown line is the frequency curve joining the mid-points of each blue bar.
Genes 14 01623 g001
Figure 2. The total number of ROH and length of genome under ROH for each individual in equine breeds.
Genes 14 01623 g002
Figure 3. The breed-wise mean sum of ROH. Within each ROH length category, the sum of ROH (in Mb) was calculated per animal and averaged breed-wise.
Genes 14 01623 g003
Figure 4. Population structure analysis of 96 individuals of Equus caballus based on SNPdata at K = 2, 3 and 4 presented by different colors inferred by Structure analysis. Each bar represents an individual, where different colors in that individual represent the estimated admixture using the Q statistic.
Genes 14 01623 g004
Figure 5. Gene function with their counts according to the category in which they fall.
Genes 14 01623 g005
Table 1. Genomic distributions and descriptive statistics of ROH in different horse breeds.
BreedsnROHRange ROHNMROHMGLROH
(Mb)
MGPROH
(%)
ALROH
(Mb)
FROH > 1 MbFROH > 8 MbFHOMr (FROH > 1 Mb—FHOM)r (FROH > 8 Mb—FHOM)
Manipuri86313–1271168.62242.8895.10.2470.2660.5420.2950.277
Zanskari116917–1331100.94295.510.944.890.2850.1890.5460.2610.357
Bhutia96120–1161212.11301.3511.165.280.2380.2020.5410.3030.339
Spiti108326–1541139.23409.415.165.130.2880.20.5530.2650.353
Kathiawari63018–1471286.31330.3212.235.50.280.2830.5610.2810.278
Marwari57422–1111018.45268.79.954.650.2840.2190.5450.2610.326
Thoroughbred16418–1141350.84346.6312.845.710.2140.370.5550.3410.185
nROH: Total number of ROH per breed; NMROH: mean number of ROH in a breed; MGLROH: breed-wise mean genome length covered by ROH in Mb; MGPROH: breed-wise mean genome proportion covered by ROH in percentage; ALROH: average length of ROH (Mb) in a breed; FROH: inbreeding coefficient based on ROH; FHOM: inbreeding coefficient based on homozygous loci; r: Spearman’s correlation coefficient.
Table 2. Statistics of ROH observed in diverse Indian horse breeds under different length classes (ROH1–2 Mb, ROH2–4 Mb, ROH4–8 Mb, ROH8–16 Mb, ROH > 16 Mb).
BreedsManipuriZanskariBhutiaSpitiKathiawariMarwariThoroughbred
nROH86311699611083630574164
ROH 1–2 Mb43057650151727729977
NROH (percent)49.8349.2752.1347.7443.9752.0946.95
Mean length (Mb) ± SD1.36 ± 0.281.37 ± 0.281.34 ± 0.271.39 ± 0.281.39 ± 0.281.38 ± 0.271.35 ± 0.27
ROH 2–4 Mb20829622128214814037
NROH (percent)24.1025.3223.0026.0423.4924.3922.56
Mean length (Mb) ± SD2.84 ± 0.602.79 ± 0.582.77 ± 0.572.78 ± 0.592.85 ± 0.612.77 ± 0.562.70 ± 0.52
ROH 4–8 Mb1011671131611057319
NROH (percent)11.7014.2911.7614.8716.6712.7211.59
Mean length (Mb) ± SD5.52 ± 1.085.47 ± 1.105.71 ± 1.175.50 ± 1.035.58 ± 1.165.63 ± 1.035.38 ± 1.05
ROH 8–16 Mb65716867583117
NROH (percent)7.536.077.086.199.215.4010.37
Mean length (Mb) ± SD10.62 ± 1.9711.20 ± 2.0111.12 ± 2.3410.73 ± 2.2311.10 ± 2.3210.72 ± 1.8611.79 ± 2.27
ROH > 16 Mb59595856423114
NROH (percent)6.845.056.045.176.675.408.54
Mean length (Mb) ± SD33.56 ± 22.8640.68 ± 28.1841.25 ± 30.1143.80 ± 28.5633.96 ± 19.2036.32 ± 25.5630.80 ± 17.85
Table 3. Number of traits based on classes in all the breeds.
TraitMarwariBhutiaSpitiKathiawariZanskariManipuriThoroughbred
Health13151316161317
Growth12181515171418
Exterior2441240
Reproduction7263735
Performance108981086
Total44474743524246
Table 4. Genes associated with different traits.
TraitAssociated Genes
HealthFRZB, XIRP2, MATN1, COL1A2, ARHGAP26, TBC1D22A, CCNG1, GABRA6, TENM2, IGF1, ACAN
GrowthOXCT1, HMGA2, MYPN
ExteriorMGP, KIT
ReproductionPLCZ1, NXPE3
PerformanceSLC16A1, XIRP2, SOX5, CCT5, MRPL44, SERPINE2, CUL3, GIGYF2, INPP5D, MSTN, GRIN2B, SLC16A1, ARL15, DOCK8, HMGA2, DMRT3, MYPN, NXPE3, WDFY2, ATP7B, KCNRG, IGF1, CNTN3, PDZRN3, PPP4R2, GXYLT2
Disclaimer/Publisher’s Note: The statements, opinions and data contained in all publications are solely those of the individual author(s) and contributor(s) and not of MDPI and/or the editor(s). MDPI and/or the editor(s) disclaim responsibility for any injury to people or property resulting from any ideas, methods, instructions or products referred to in the content.

