
The Complete Mitochondrial Genome of the Freshwater Fish Onychostoma ovale (Cypriniformes, Cyprinidae): Genome Characterization and Phylogenetic Analysis


Abstract
1. Introduction
2. Materials and Methods
2.1. Sampling, DNA Extraction, PCR Amplification, and Sanger Sequencing
2.2. Mitogenome Assembly, Annotation, and Bioinformatics Analysis
2.3. Phylogenetic Analysis
3. Results and Discussion
3.1. Mitochondrial Genomic Structure and Base Composition
3.2. Protein-Coding Genes and Codon Usage
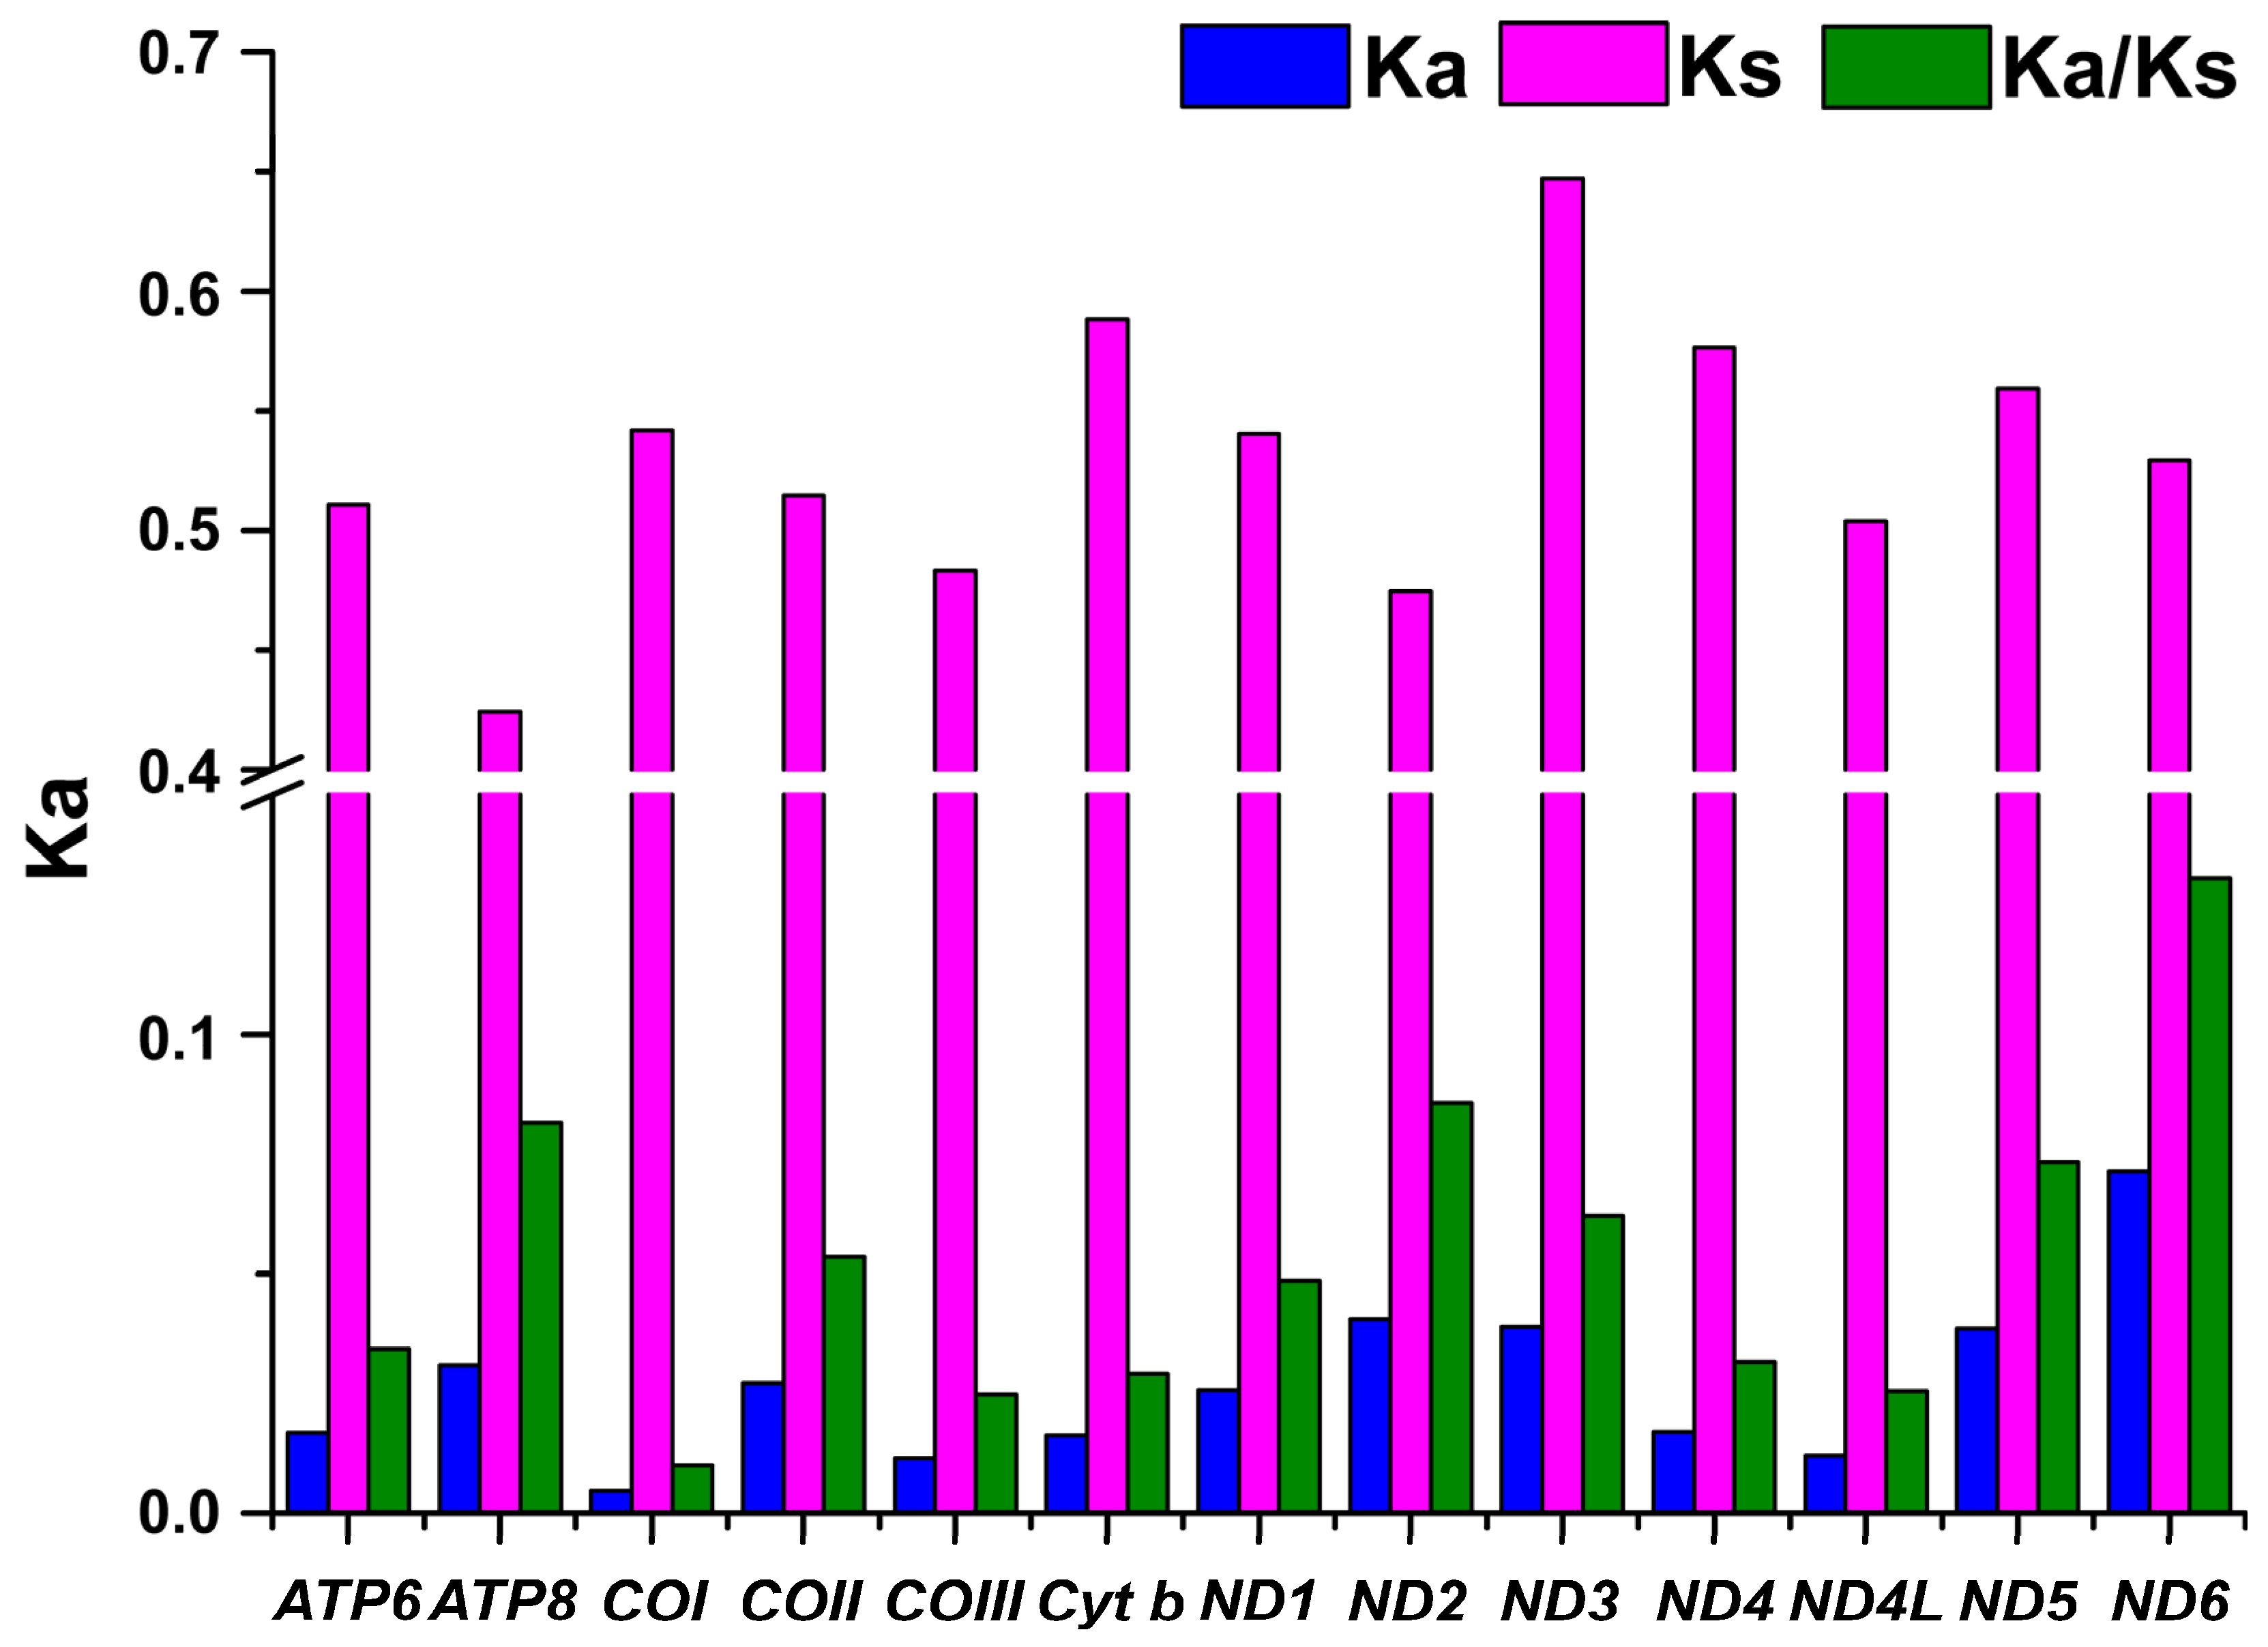
3.3. Selective Pressure Analysis
3.4. Transfer RNAs, Ribosomal RNAs, and Control Region
3.5. Phylogenetic Analysis
4. Conclusions
Supplementary Materials
Author Contributions
Funding
Institutional Review Board Statement
Informed Consent Statement
Data Availability Statement
Conflicts of Interest
References
- Xiao, W.H.; Zhang, Y.P. Genetics and evolution of mitochondrial DNA in fish. Acta Hydrobiol. Sin. 2000, 24, 384–391. [Google Scholar]
- Satoh, T.P.; Miya, M.; Mabuchi, K.; Nishida, M. Structure and variation of the mitochondrial genome of fishes. BMC Genom. 2016, 17, 719. [Google Scholar] [CrossRef] [PubMed]
- Brown, K.H. Fish mitochondrial genomics: Sequence, inheritance and functional variation. J. Fish Biol. 2008, 72, 355–374. [Google Scholar] [CrossRef]
- Zhang, R.; Deng, L.; Lv, X.; Tang, Q. Complete mitochondrial genomes of two catfishes (Siluriformes, Bagridae) and their phylogenetic implications. Zookeys 2022, 1115, 103–116. [Google Scholar] [CrossRef] [PubMed]
- Zhang, R.; Tang, Q.; Deng, L. The complete mitochondrial genome of Microphysogobio elongatus (Teleostei, Cyprinidae) and its phylogenetic implications. Zookeys 2021, 1061, 57–73. [Google Scholar] [CrossRef]
- Yang, L.; Sado, T.; Hirt, M.V.; Pasco-Viel, E.; Arunachalam, M.; Li, J.; Wang, X.; Freyhof, J.; Saitoh, K.; Simons, A.M.; et al. Phylogeny and polyploidy: Resolving the classification of cyprinine fishes (Teleostei: Cypriniformes). Mol. Phylogenetics Evol. 2015, 85, 97–116. [Google Scholar] [CrossRef]
- Tan, M.; Armbruster, J.W. Phylogenetic classification of extant genera of fishes of the order Cypriniformes (Teleostei: Ostariophysi). Zootaxa 2018, 4476, 6–39. [Google Scholar] [CrossRef]
- Froese, R.; Pauly, D. (Eds.) FishBase. Available online: https://www.fishbase.org (accessed on 8 January 2023).
- Shan, X.; Lin, R.; Yue, P.; Chu, X. Barbinae. In Fauna Sinica, Osteichthyes, Cypriniformes (III); Yue, P., Ed.; Science Press: Beijing, China, 2000; pp. 3–170. [Google Scholar]
- Zheng, L.-P.; Yang, J.-X.; Chen, X.-Y. Molecular phylogeny and systematics of the Barbinae (Teleostei: Cyprinidae) in China inferred from mitochondrial DNA sequences. Biochem. Syst. Ecol. 2016, 68, 250–259. [Google Scholar] [CrossRef]
- Wang, I.-C.; Lin, H.-D.; Liang, C.-M.; Huang, C.-C.; Wang, R.-D.; Yang, J.-Q.; Wang, W.-K. Complete mitochondrial genome of the freshwater fish Onychostoma lepturum (Teleostei, Cyprinidae): Genome characterization and phylogenetic analysis. Zookeys 2020, 1005, 57–72. [Google Scholar] [CrossRef]
- Wu, L. The Fishes of Guizhou; Guizhou People’s Publishing House: Guiyang, China, 1989. [Google Scholar]
- Aljanabi, S.M.; Martinez, I. Universal and rapid salt-extraction of high quality genomic DNA for PCR- based techniques. Nucleic Acids Res. 1997, 25, 4692–4693. [Google Scholar] [CrossRef]
- Iwasaki, W.; Fukunaga, T.; Isagozawa, R.; Yamada, K.; Maeda, Y.; Satoh, T.P.; Sado, T.; Mabuchi, K.; Takeshima, H.; Miya, M.; et al. MitoFish and MitoAnnotator: A Mitochondrial Genome Database of Fish with an Accurate and Automatic Annotation Pipeline. Mol. Biol. Evol. 2013, 30, 2531–2540. [Google Scholar] [CrossRef]
- Bernt, M.; Donath, A.; Jühling, F.; Externbrink, F.; Florentz, C.; Fritzsch, G.; Pütz, J.; Middendorf, M.; Stadler, P.F. MITOS: Improved de novo metazoan mitochondrial genome annotation. Mol. Phylogenetics Evol. 2013, 69, 313–319. [Google Scholar] [CrossRef] [PubMed]
- Lowe, T.M.; Chan, P.P. tRNAscan-SE On-line: Integrating search and context for analysis of transfer RNA genes. Nucleic Acids Res. 2016, 44, W54–W57. [Google Scholar] [CrossRef] [PubMed]
- Tamura, K.; Stecher, G.; Peterson, D.; Filipski, A.; Kumar, S. MEGA6: Molecular Evolutionary Genetics Analysis Version 6.0. Mol. Biol. Evol. 2013, 30, 2725–2729. [Google Scholar] [CrossRef]
- Zhang, D.; Gao, F.; Jakovlić, I.; Zhou, H.; Zhang, J.; Li, W.X.; Wang, G.T. PhyloSuite: An integrated and scalable desktop platform for streamlined molecular sequence data management and evolutionary phylogenetics studies. Mol. Ecol. Resour. 2020, 20, 348–355. [Google Scholar] [CrossRef] [PubMed]
- Perna, N.T.; Kocher, T.D. Patterns of nucleotide composition at fourfold degenerate sites of animal mitochondrial genomes. J. Mol. Evol. 1995, 41, 353–358. [Google Scholar] [CrossRef]
- Rozas, J.; Ferrer-Mata, A.; Sánchez-DelBarrio, J.C.; Guirao-Rico, S.; Librado, P.; Ramos-Onsins, S.E.; Sánchez-Gracia, A. DnaSP 6: DNA Sequence Polymorphism Analysis of Large Data Sets. Mol. Biol. Evol. 2017, 34, 3299–3302. [Google Scholar] [CrossRef]
- Katoh, K.; Standley, D.M. MAFFT Multiple Sequence Alignment Software Version 7: Improvements in Performance and Usability. Mol. Biol. Evol. 2013, 30, 772–780. [Google Scholar] [CrossRef]
- Lanfear, R.; Frandsen, P.B.; Wright, A.M.; Senfeld, T.; Calcott, B. PartitionFinder 2: New Methods for Selecting Partitioned Models of Evolution for Molecular and Morphological Phylogenetic Analyses. Mol. Biol. Evol. 2017, 34, 772–773. [Google Scholar] [CrossRef]
- Nguyen, L.-T.; Schmidt, H.A.; Von Haeseler, A.; Minh, B.Q. IQ-TREE: A Fast and Effective Stochastic Algorithm for Estimating Maximum-Likelihood Phylogenies. Mol. Biol. Evol. 2015, 32, 268–274. [Google Scholar] [CrossRef]
- Ronquist, F.; Teslenko, M.; van der Mark, P.; Ayres, D.L.; Darling, A.; Höhna, S.; Larget, B.; Liu, L.; Suchard, M.A.; Huelsenbeck, J.P. MrBayes 3.2: Efficient Bayesian Phylogenetic Inference and Model Choice across a Large Model Space. Syst. Biol. 2012, 61, 539–542. [Google Scholar] [CrossRef] [PubMed]
- Letunic, I.; Bork, P. Interactive Tree Of Life (iTOL) v4: Recent updates and new developments. Nucleic Acids Res. 2019, 47, 256–259. [Google Scholar] [CrossRef]
- Zhang, D.-X.; Hewitt, G.M. Insect mitochondrial control region: A review of its structure, evolution and usefulness in evolutionary studies. Biochem. Syst. Ecol. 1997, 25, 99–120. [Google Scholar] [CrossRef]
- Ojala, D.; Montoya, J.; Attardi, G. tRNA punctuation model of RNA processing in human mitochondria. Nature 1981, 290, 470–474. [Google Scholar] [CrossRef] [PubMed]
- Yang, Z.; Bielawski, J.P. Statistical methods for detecting molecular adaptation. Trends Ecol. Evol. 2000, 15, 496–503. [Google Scholar] [CrossRef]
- Hou, X.-J.; Lin, H.-D.; Tang, W.-Q.; Liu, D.; Han, C.-C.; Yang, J.-Q. Complete mitochondrial genome of the freshwater fish Acrossocheilus longipinnis (Teleostei: Cyprinidae): Genome characterization and phylogenetic analysis. Biologia 2020, 75, 1871–1880. [Google Scholar] [CrossRef]
- Chen, I.-S.; Han, M.; Wang, C.-L.; Shen, C.-N. The complete mitochondrial genome of rainbow barbel Acrossocheilus barbodon (Nichols and Pope) (Teleostei, Cyprinidae, Barbinae). Mitochondrial DNA 2015, 26, 145–146. [Google Scholar] [CrossRef]
- Yu, J.-N.; Kim, S.; Kwak, M. Complete mitochondrial genome sequence of a Korean Pungtungia herzi (Cypriniformes, Gobioninae). Mitochondrial DNA 2014, 25, 414–415. [Google Scholar] [CrossRef]
- Wang, C.; Ye, P.; Liu, M.; Zhang, Y.; Feng, H.; Liu, J.; Zhou, H.; Wang, J.; Chen, X. Comparative Analysis of Four Complete Mitochondrial Genomes of Epinephelidae (Perciformes). Genes 2022, 13, 660. [Google Scholar] [CrossRef]
- Wolstenholme, D.R. Animal Mitochondrial DNA: Structure and Evolution. Int. Rev. Cytol. 1992, 141, 173–216. [Google Scholar] [CrossRef]


| Primer Name | Primer Sequences (5′–3′) | Annealing Temperature |
|---|---|---|
| OF1 | AGGGACAAAAGTAAGCAAAA | 43.7 °C |
| OR1 | CCCAACCGAAGGTAAAATA | |
| OF2 | TGCCCAGTGACCACAAGTT | 51.6 °C |
| OR2 | GTGAGGCTCCCAGGAAAAG | |
| OF3 | GTGAGGCTCCCAGGAAAAG | 43.9 °C |
| OR3 | TGGTTGAGTTGGTTGTGTT | |
| OF4 | TTAGTAGGGGGATGAGGAG | 47.3 °C |
| OR4 | GGGTCAAAGAATGTGGTGT | |
| OF5 | TTCCACGAATGAACAACA | 42.2 °C |
| OR5 | AATACAGCGGGTAAAATG | |
| OF6 | GCATTCGTTCAAGTTCAA | 44.2 °C |
| OR6 | TACGGCAGTAGCGATAAG | |
| OF7 | AGAAGGACACAAATGAGCAC | 46.3 °C |
| OR7 | AGGAAAAAGCGTAGAGAGAA | |
| OF8 | GCCTGATACTGACACTTCGT | 48 °C |
| OR8 | GGCTTCTACATGTGCTTTTG | |
| OF9 | TTCCAACCCTCATCATCAT | 46.9 °C |
| OR9 | CCTACTCCTTCTCAGCCAA | |
| OF10 | CTTTCTCATCCTACTCCACC | 45 °C |
| OR10 | GTTTTTGCCATAGTTTTTTG | |
| OF11 | AAGCAAACAAGTAAAAATCA | 37 °C |
| OR11 | AACAAACGGTAGTAGGAAGT | |
| OF12 | CCTCTACAAAGAAACCTGAAAC | 43.3 °C |
| OR12 | CAAGTGAAAAGAAACCAAAAA | |
| OF13 | TCAGGGACAATAACTGTGGGGG | 53.4 °C |
| OR13 | TTGGTGTGTTTTGACGGGGAG |
| NO. | Species | Size (bp) | A% | T% | G% | C% | A + T Content | A + T Skew | G + C Skew | Accession No. |
|---|---|---|---|---|---|---|---|---|---|---|
| 1 | Acrossocheilus barbodon | 16,596 | 31.55 | 24.37 | 15.88 | 28.20 | 55.92 | 0.13 | −0.28 | NC_022184 |
| 2 | Acrossocheilus beijiangensis | 16,600 | 31.16 | 24.99 | 16.13 | 27.73 | 56.14 | 0.11 | −0.26 | NC_028206 |
| 3 | Acrossocheilus fasciatus | 16,589 | 30.85 | 24.87 | 16.54 | 27.75 | 55.71 | 0.11 | −0.25 | NC_023378 |
| 4 | Acrossocheilus hemispinus | 16,590 | 31.16 | 24.70 | 16.15 | 28.00 | 55.85 | 0.12 | −0.27 | NC_022183 |
| 5 | Acrossocheilus iridescens | 16,596 | 31.51 | 24.42 | 15.93 | 28.14 | 55.94 | 0.13 | −0.28 | NC_031551 |
| 6 | Acrossocheilus jishouensis | 16,587 | 31.16 | 25.09 | 16.19 | 27.55 | 56.25 | 0.11 | −0.26 | NC_034917 |
| 7 | Acrossocheilus kreyenbergii | 16,849 | 31.16 | 25.43 | 16.26 | 27.15 | 56.60 | 0.10 | −0.25 | NC_024844 |
| 8 | Acrossocheilus longipinnis | 16,593 | 31.54 | 24.39 | 15.95 | 28.12 | 55.93 | 0.13 | −0.28 | NC_047455 |
| 9 | Acrossocheilus monticola | 16,599 | 31.42 | 24.54 | 15.81 | 28.24 | 55.96 | 0.12 | −0.28 | NC_022145 |
| 10 | Acrossocheilus paradoxus | 16,586 | 31.13 | 25.10 | 16.24 | 27.52 | 56.23 | 0.11 | −0.26 | MG878098 |
| 11 | Acrossocheilus parallens | 16,592 | 30.97 | 24.70 | 16.33 | 28.00 | 55.67 | 0.11 | −0.26 | NC_026973 |
| 12 | Acrossocheilus spinifer | 16,591 | 31.24 | 24.71 | 16.07 | 27.97 | 55.95 | 0.12 | −0.27 | NC_034918 |
| 13 | Acrossocheilus stenotaeniatus | 16,594 | 31.22 | 24.70 | 16.07 | 28.02 | 55.91 | 0.12 | −0.27 | NC_024934 |
| 14 | Acrossocheilus wenchowensis | 16,591 | 31.05 | 24.97 | 16.32 | 27.67 | 56.02 | 0.11 | −0.26 | NC_020145 |
| 15 | Acrossocheilus wuyiensis | 16,594 | 31.12 | 24.71 | 16.16 | 28.01 | 55.83 | 0.11 | −0.27 | NC_034919 |
| 16 | Acrossocheilus yunnanensis | 16,588 | 31.39 | 24.66 | 16.12 | 27.83 | 56.05 | 0.12 | −0.27 | NC_028527 |
| 17 | Cyprinus carpio | 16,575 | 31.86 | 24.88 | 15.80 | 27.46 | 56.74 | 0.12 | −0.27 | NC_001606 |
| 18 | Folifer brevifilis | 16,707 | 31.08 | 24.63 | 16.36 | 27.93 | 55.71 | 0.12 | −0.26 | NC_031606 |
| 19 | Onychostoma alticorpus | 16,607 | 30.88 | 23.57 | 16.56 | 28.99 | 54.45 | 0.13 | −0.27 | NC_021473 |
| 20 | Onychostoma barbatulum | 16,597 | 31.45 | 25.15 | 16.00 | 27.40 | 56.60 | 0.11 | −0.26 | NC_021644 |
| 21 | Onychostoma barbatum | 16,592 | 31.54 | 24.49 | 15.94 | 28.04 | 56.03 | 0.13 | −0.28 | NC_019630 |
| 22 | Onychostoma fangi | 16,597 | 31.55 | 24.50 | 15.90 | 28.05 | 56.05 | 0.13 | −0.28 | NC_031529 |
| 23 | Onychostoma gerlachi | 16,601 | 31.38 | 24.24 | 16.09 | 28.29 | 55.62 | 0.13 | −0.27 | NC_026549 |
| 24 | Onychostoma lepturus | 16,601 | 31.31 | 23.89 | 16.16 | 28.64 | 55.20 | 0.13 | −0.28 | NC_054158 |
| 25 | Onychostoma lini | 16,595 | 31.62 | 24.57 | 15.87 | 27.94 | 56.19 | 0.13 | −0.28 | NC_018043 |
| 26 | Onychostoma macrolepis | 16,595 | 31.29 | 24.53 | 16.21 | 27.97 | 55.82 | 0.12 | −0.27 | NC_023799 |
| 27 | Onychostoma meridionale | 16,595 | 31.19 | 24.30 | 16.23 | 28.29 | 55.49 | 0.12 | −0.27 | NC_031603 |
| 28 | Onychostoma ovale | 16,602 | 31.47 | 24.07 | 15.92 | 28.54 | 55.54 | 0.13 | −0.28 | NC_066040 |
| 29 | Onychostoma rarum | 16,590 | 31.49 | 24.15 | 15.88 | 28.47 | 55.65 | 0.13 | −0.28 | NC_022869 |
| 30 | Onychostoma simum | 16,601 | 31.31 | 24.30 | 16.11 | 28.28 | 55.61 | 0.13 | −0.27 | NC_021972 |
| Gene | Position Number | Size (bp) | Codon | Strand | Intergenetic Nucleotide | ||
|---|---|---|---|---|---|---|---|
| Start | Stop | Start | Stop | ||||
| tRNAPhe | 1 | 69 | 69 | H | 0 | ||
| 12S rRNA | 70 | 1028 | 959 | H | 0 | ||
| tRNAVal | 1029 | 1100 | 72 | H | 0 | ||
| 16S rRNA | 1101 | 2780 | 1680 | H | 0 | ||
| tRNALeu | 2781 | 2856 | 76 | H | 0 | ||
| ND1 | 2858 | 3832 | 975 | ATG | TAA | H | +1 |
| tRNAIle | 3837 | 3908 | 72 | H | +4 | ||
| tRNAGln | 3907 | 3977 | 71 | L | −2 | ||
| tRNAMet | 3979 | 4047 | 69 | H | +1 | ||
| ND2 | 4048 | 5092 | 1045 | ATG | T-- | H | 0 |
| tRNATrp | 5093 | 5163 | 71 | H | 0 | ||
| tRNAAla | 5166 | 5234 | 69 | L | +2 | ||
| tRNAAsn | 5236 | 5308 | 73 | L | +1 | ||
| tRNACys | 5342 | 5408 | 67 | L | +33 | ||
| tRNATyr | 5408 | 5478 | 71 | L | −1 | ||
| COI | 5480 | 7030 | 1551 | GTG | TAA | H | +1 |
| tRNASer | 7031 | 7101 | 71 | L | 0 | ||
| tRNAAsp | 7104 | 7175 | 72 | H | +2 | ||
| COII | 7191 | 7881 | 691 | ATG | T-- | H | +15 |
| tRNALys | 7882 | 7957 | 76 | H | 0 | ||
| ATPase8 | 7959 | 8123 | 165 | ATG | TAG | H | +1 |
| ATPase6 | 8117 | 8800 | 684 | ATG | TAA | H | −7 |
| COIII | 8800 | 9584 | 785 | ATG | TA- | H | −1 |
| tRNAGly | 9585 | 9656 | 72 | H | 0 | ||
| ND3 | 9657 | 10,005 | 349 | GTG | T-- | H | 0 |
| tRNAArg | 10,006 | 10,075 | 70 | H | 0 | ||
| ND4L | 10,076 | 10,372 | 297 | ATG | TAA | H | 0 |
| ND4 | 10,366 | 11,746 | 1381 | ATG | T-- | H | −7 |
| tRNAHis | 11,747 | 11,815 | 69 | H | 0 | ||
| tRNASer | 11,816 | 11,884 | 69 | H | 0 | ||
| tRNALeu | 11,886 | 11,958 | 73 | H | +1 | ||
| ND5 | 11,959 | 13,782 | 1824 | ATG | TAA | H | 0 |
| ND6 | 13,779 | 14,300 | 522 | ATG | TAA | L | −4 |
| tRNAGlu | 14,301 | 14,369 | 69 | L | 0 | ||
| Cyt b | 14,376 | 15,516 | 1141 | ATG | T-- | H | +6 |
| tRNAThr | 15,517 | 15,588 | 72 | H | 0 | ||
| tRNAPro | 15,588 | 15,657 | 70 | L | −1 | ||
| D-loop | 15,658 | 16,602 | 945 | 0 | |||
| Size (bp) | A% | T% | G% | C% | A + T% | G + C% | A + T Skew | G + C Skew | |
|---|---|---|---|---|---|---|---|---|---|
| Genome | 16,602 | 31.47 | 24.07 | 15.92 | 28.54 | 55.54 | 44.46 | 0.13 | −0.28 |
| PCGs | 11,410 | 29.36 | 25.74 | 15.45 | 29.45 | 55.10 | 44.90 | 0.07 | −0.31 |
| First codon position | 3807 | 26.87 | 20.23 | 25.64 | 27.26 | 47.10 | 52.90 | 0.14 | −0.03 |
| Second codon position | 3802 | 18.52 | 40.19 | 13.62 | 27.67 | 58.71 | 41.29 | −0.37 | −0.34 |
| Third codon position | 3801 | 42.70 | 16.81 | 7.08 | 33.41 | 59.51 | 40.49 | 0.43 | −0.65 |
| rRNA | 2639 | 34.71 | 18.98 | 20.73 | 25.58 | 53.69 | 46.31 | 0.29 | −0.10 |
| tRNA | 1563 | 28.60 | 27.00 | 23.22 | 21.18 | 55.60 | 44.38 | 0.03 | 0.05 |
| D-loop region | 945 | 33.97 | 33.02 | 12.59 | 20.42 | 66.99 | 33.01 | 0.01 | −0.24 |
| AA | Codon | Count | RSCU | AA | Codon | Count | RSCU |
|---|---|---|---|---|---|---|---|
| Phe | UUU(F) | 74 | 0.66 | Tyr | UAU(Y) | 34 | 0.58 |
| Phe | UUC(F) | 149 | 1.34 | Tyr | UAC(Y) | 83 | 1.42 |
| Leu | UUA(L) | 73 | 0.70 | Stop codon | UAA | 6 | 3.43 |
| Leu | UUG(L) | 16 | 0.15 | Stop codon | UAG | 1 | 0.57 |
| Leu | CUU(L) | 85 | 0.81 | His | CAU(H) | 23 | 0.45 |
| Leu | CUC(L) | 114 | 1.09 | His | CAC(H) | 80 | 1.55 |
| Leu | CUA(L) | 284 | 2.71 | Gln | CAA(Q) | 99 | 1.89 |
| Leu | CUG(L) | 57 | 0.54 | Gln | CAG(Q) | 6 | 0.11 |
| Ile | AUU(I) | 128 | 0.89 | Asn | AAU(N) | 27 | 0.44 |
| Ile | AUC(I) | 159 | 1.11 | Asn | AAC(N) | 95 | 1.56 |
| Met | AUA(M) | 118 | 1.40 | Lys | AAA(K) | 69 | 1.79 |
| Met | AUG(M) | 50 | 0.60 | Lys | AAG(K) | 8 | 0.21 |
| Val | GUU(V) | 44 | 0.80 | Asp | GAU(D) | 14 | 0.39 |
| Val | GUC(V) | 44 | 0.80 | Asp | GAC(D) | 58 | 1.61 |
| Val | GUA(V) | 106 | 1.92 | Glu | GAA(E) | 87 | 1.74 |
| Val | GUG(V) | 27 | 0.49 | Glu | GAG(E) | 13 | 0.26 |
| Ser | UCU(S) | 40 | 1.03 | Cys | UGU(C) | 9 | 0.69 |
| Ser | UCC(S) | 49 | 1.26 | Cys | UGC(C) | 17 | 1.31 |
| Ser | UCA(S) | 88 | 2.26 | Trp | UGA(W) | 106 | 1.77 |
| Ser | UCG(S) | 5 | 0.13 | Trp | UGG(W) | 14 | 0.23 |
| Pro | CCU(P) | 22 | 0.41 | Arg | CGU(R) | 11 | 0.58 |
| Pro | CCC(P) | 63 | 1.18 | Arg | CGC(R) | 13 | 0.68 |
| Pro | CCA(P) | 123 | 2.30 | Arg | CGA(R) | 45 | 2.37 |
| Pro | CCG(P) | 6 | 0.11 | Arg | CGG(R) | 7 | 0.37 |
| Thr | ACU(T) | 33 | 0.42 | Ser | AGU(S) | 12 | 0.31 |
| Thr | ACC(T) | 117 | 1.48 | Ser | AGC(S) | 40 | 1.03 |
| Thr | ACA(T) | 159 | 2.01 | Stop codon | AGA | 0 | 0.00 |
| Thr | ACG(T) | 8 | 0.10 | Stop codon | AGG | 0 | 0.00 |
| Ala | GCU(A) | 55 | 0.65 | Gly | GGU(G) | 28 | 0.46 |
| Ala | GCC(A) | 141 | 1.66 | Gly | GGC(G) | 48 | 0.79 |
| Ala | GCA(A) | 135 | 1.59 | Gly | GGA(G) | 125 | 2.05 |
| Ala | GCG(A) | 8 | 0.09 | Gly | GGG(G) | 43 | 0.70 |
Disclaimer/Publisher’s Note: The statements, opinions and data contained in all publications are solely those of the individual author(s) and contributor(s) and not of MDPI and/or the editor(s). MDPI and/or the editor(s) disclaim responsibility for any injury to people or property resulting from any ideas, methods, instructions or products referred to in the content. |
© 2023 by the authors. Licensee MDPI, Basel, Switzerland. This article is an open access article distributed under the terms and conditions of the Creative Commons Attribution (CC BY) license (https://creativecommons.org/licenses/by/4.0/).
Share and Cite
Zhang, R.; Zhu, T.; Luo, Q. The Complete Mitochondrial Genome of the Freshwater Fish Onychostoma ovale (Cypriniformes, Cyprinidae): Genome Characterization and Phylogenetic Analysis. Genes 2023, 14, 1227. https://doi.org/10.3390/genes14061227
Zhang R, Zhu T, Luo Q. The Complete Mitochondrial Genome of the Freshwater Fish Onychostoma ovale (Cypriniformes, Cyprinidae): Genome Characterization and Phylogenetic Analysis. Genes. 2023; 14(6):1227. https://doi.org/10.3390/genes14061227
Chicago/Turabian StyleZhang, Renyi, Tingting Zhu, and Qi Luo. 2023. "The Complete Mitochondrial Genome of the Freshwater Fish Onychostoma ovale (Cypriniformes, Cyprinidae): Genome Characterization and Phylogenetic Analysis" Genes 14, no. 6: 1227. https://doi.org/10.3390/genes14061227
APA StyleZhang, R., Zhu, T., & Luo, Q. (2023). The Complete Mitochondrial Genome of the Freshwater Fish Onychostoma ovale (Cypriniformes, Cyprinidae): Genome Characterization and Phylogenetic Analysis. Genes, 14(6), 1227. https://doi.org/10.3390/genes14061227