Article

Complete Chloroplast Genome Determination of Ranunculus sceleratus from Republic of Korea (Ranunculaceae) and Comparative Chloroplast Genomes of the Members of the Ranunculus Genus

Animal & Plant Research Department, Nakdonggang National Institute of Biological Resources, Sangju 37242, Republic of Korea
*
Author to whom correspondence should be addressed.
Genes 2023, 14(6), 1149; https://doi.org/10.3390/genes14061149
Submission received: 26 April 2023 / Revised: 23 May 2023 / Accepted: 24 May 2023 / Published: 25 May 2023
(This article belongs to the Topic Plant Chloroplast Genome and Evolution)

Abstract

:
Ranunculus sceleratus (family: Ranunculaceae) is a medicinally and economically important plant; however, gaps in taxonomic and species identification limit its practical applicability. This study aimed to sequence the chloroplast genome of R. sceleratus from Republic of Korea. Chloroplast sequences were compared and analyzed among Ranunculus species. The chloroplast genome was assembled from Illumina HiSeq 2500 sequencing raw data. The genome was 156,329 bp and had a typical quadripartite structure comprising a small single-copy region, a large single-copy region, and two inverted repeats. Fifty-three simple sequence repeats were identified in the four quadrant structural regions. The region between the ndhC and trnV-UAC genes could be useful as a genetic marker to distinguish between R. sceleratus populations from Republic of Korea and China. The Ranunculus species formed a single lineage. To differentiate between Ranunculus species, we identified 16 hotspot regions and confirmed their potential using specific barcodes based on phylogenetic tree and BLAST-based analyses. The ndhE, ndhF, rpl23, atpF, rps4, and rpoA genes had a high posterior probability of codon sites in positive selection, while the amino acid site varied between Ranunculus species and other genera. Comparison of the Ranunculus genomes provides useful information regarding species identification and evolution that could guide future phylogenetic analyses.

1. Introduction

The family Ranunculaceae is distributed worldwide, comprising 59 genera and more than 2500 species [1]. Among them, Ranunculus (buttercups) is the largest genus, comprising approximately 600 species, and is classified into 20 taxonomic sections [2,3]. Ranunculus inhabits tropical and temperate regions within temperate forests, arctic tundra, mountainous regions, freshwater systems, and terrestrial ecosystems [3,4]. Genetically, this genus is diverse with a wide distribution, making its classification highly complex [1]. In particular, taxonomic difficulties have occurred due to the morphological and ecological diversity of traits that have arisen during the evolution of Ranunculus in different environments [5,6].
R. sceleratus L. is an annual or perennial herbaceous plant in the family Ranunculaceae [7] that primarily inhabits wetlands or slow rivers and is distributed worldwide, including throughout Republic of Korea [8]. Dried and fresh R. sceleratus is reportedly used in the treatment of esophageal and breast cancer, as well as malaria-induced jaundice [8,9]. Additionally, as a medicinal plant, it can suppress the occurrence of degenerative diseases by acting as an antibacterial agent and antioxidant [10]. Indeed, plants of the genus Ranunculus have been reported to protect the liver and exhibit anti-inflammatory and anti-malarial effects [11,12,13,14,15,16]. They have pharmacological activity and potentially high value as new drug candidates [17]. However, the application of R. sceleratus as a drug candidate species has been limited by the reported variation in the major pharmacologically active ingredients within the plant based on geographical differences [18,19].
Besides its medicinal value, R. sceleratus has potential value in plant purification and landscaping. R. sceleratus has attractive characteristics, including pale yellow flowers and cylindrical fruits during flowering [7]. These features are found around parks, cities, and rivers and provide potential value for attractive landscaping [7]. In particular, this plant exhibits significant potential to purify contaminated sewage by adsorbing heavy metals, such as Fe and Zn, and removing organic matter, such as total nitrogen and phosphorus [20,21,22]. As such, it is important to be able to accurately identify the distinct geographical features as well as the different species within Ranunculus to improve their application in the fields of pharmaceuticals and heavy metal decontamination.
To address these gaps in taxonomic and species identification, we previously sought to identify Ranunculus species using molecular biological methods [6]. Results showed that species of Batrachium, a subgenus of Ranunculus, can be identified based on chloroplast or nuclear markers, such as trnH-psbA, matK, and ITS; however, close relatives, including Ranunculus peltatus and Ranunculus penicillatus, could not be similarly distinguished [6]. Thus, a marker with high species resolution is required to effectively identify related species of the genus Ranunculus, which are difficult to morphologically identify.
As a molecular marker in plants, the mitochondrial genome does not function as a species identification DNA barcode owing to the low level of nucleotide substitutions [23,24]. Therefore, chloroplast (cp) genomes are commonly assessed to achieve the evolutionary and species identification of plants [25,26,27]. In particular, the trnH-psbA, matK, rpoB, rpoC1, and trnL-F intergenic spacer regions of the chloroplast genome region are commonly employed; however, a consensus has not been reached regarding universally available barcodes because of discrepancies in each plant taxon [25,28]. Hence, while DNA barcodes of these chloroplast sequence regions are useful for phylogenetic and barcode studies at high taxonomic levels, they are not suitable at lower taxonomic levels owing to insufficient variation [29]. Accordingly, specific barcodes for lower taxonomic levels are required [29].
Specific barcodes examine repeats, indels, and substitutions in the chloroplast genome for species identification and hotspot regions to identify loci that represent species-level differences. As such, these barcodes represent a powerful tool for the identification of species that cannot be identified by commonly used barcodes [27]. Moreover, optimized primers for specific barcodes are needed to improve polymerase chain reaction (PCR) efficiency and avoid the risk of ambiguous alignment by loci [30].
Currently, studies on the genus Ranunculus have reported the complete cp genomes for Nuphar advena and Ranunculus macranthus in angiosperms [26,31,32,33,34]. However, comparative cp genome studies for Ranunculus have not been conducted. These studies have important implications for understanding interspecies phylogeny and for species identification and evolutionary studies.
This study aimed to (1) sequence the complete cp genome of R. sceleratus from Republic of Korea and compare it with R. sceleratus from China to identify population-specific regions, (2) screen potential barcode markers for specific barcodes by exploring phylogenetic positions for R. sceleratus from Republic of Korea and hotspot regions via comparison of 12 cp Ranunculus genomes, and (3) explore positive selection in Ranunculus to advance the current genetic and evolutionary understanding of this genus.

2. Materials and Methods

2.1. Plant Sampling and Sequencing

The leaves of R. sceleratus were collected from Yeongi-gun, Chungcheongnam-do, Republic of Korea (36°37′32″ N, 127°17′16″ E). The identification and collection of plants were conducted by the author Sun-Yu Kim. The voucher number was NNIBRVP70282, which was deposited with the Nakdonggang National Institute of Biological Resources. Total genomic DNA extraction was performed on R. sceleratus leaves with the DNeasy® Plant Mini kit (Qiagen) according to the manufacturer’s instructions. An Illumina HiSeq 2500 sequencing library was prepared according to the manufacturer’s protocol. The DNA library was sequenced with a 150 bp paired-end.

2.2. Chloroplast Genome Assembly and Annotation

A short raw read was assembled to obtain the R. sceleratus cp genome, which was then assembled using NOVOPlasty ver. 4.3.1 software [35]. The cp genome was verified for sequence identity using GetOrganelle ver. 1.7.7 [36]. Both assemblers confirmed the sequence of the same cp genome. The complete R. sceleratus cp genome was annotated using CPGAVAS2 [37]. Ranunculus seleratus from Republic of Korea was annotated using Ranunculus seleratus from China (MK253452). Areas with errors in the annotations were manually corrected using Geneious ver. 11.0.1 software. Finally, the annotated cp genome sequence was uploaded to GenBank under the accession number ON755204 using NCBI BankIt. An image of the cp genome for R. sceleratus from Republic of Korea was drawn using OrganellarGenome DRAW [38].

2.3. Simple Sequence Repeat Analysis

The simple sequence repeat (SSR) regions in the cp genome were screened using the MIcroSAtellite (MISA) tool [39]. The SSR motif conditions were 10, 5, 4, 3, 3, and 3 for mono-, di-, tri-, tetra-, penta-, and hexa-nucleotides, respectively. Additionally, duplicates and errors were manually screened for SSR regions.
Repeat Finder of Geneious ver. 11.0.1 was used to identify the types of long repeat sequences, i.e., palindromic, forward, reverse, and complement. Repeat sequence identification conditions were set to a minimum repeat size of 20 bp and 100% sequence identity.

2.4. Phylogenetic Analysis

To construct phylogenetic trees, 13 cp genomes of the species belonging to the family Ranunculaceae were downloaded from NCBI GenBank. The dataset was constructed by arranging the genome and gene sequences in the same order. The datasets were then realigned using MAFFT ver. 7.490 [40], and a phylogenetic tree was constructed using two methods: maximum likelihood (ML) and Bayesian inference (BI). The ML method used jModelTest ver. 2.1.7 [41] to select the appropriate optimal model (GTR + G + I) from the dataset and constructed the phylogenetic tree using PhyML ver. 3.0 [42]. Moreover, 1000 bootstrap replicates were included for the ML tree. The BI method reconstructed a phylogenetic tree using MrBayes ver. 3.2.7 [43] under the GTR + G + I model (lset nst = 6, Rates = invgamma), which is the optimal base substitution model. The Markov Chain Monte Carlo (MCMC) algorithm used in the analysis was repeated for 10 million MCMC and sampled every 100 generations, with the first 25% discarded as burn-in. The posterior probability values for each node were determined by consensus on multiple trees. Additionally, the phylogenetic trees drawn by both methods were constructed by consensus. The support for the ML and BI consensus trees was expressed as bootstrap values and posterior probabilities, respectively.

2.5. Comparative CP Genome Analysis and Screening of Barcoding Regions

Chloroplast genome sequences for Ranunculus species were downloaded from NCBI (Table S1) and rearranged using MAFFT ver. 7.490 [40]. For the aligned sequence, the coding sequence (CDS) present for each species was extracted using Geneious ver. 11.0.1 [44]. Additionally, the intergenic regions in 12 cp genomes were extracted and sequenced. To analyze the nucleotide diversity (Pi), the CDS and intergenic regions of the cp genome for Ranunculus were analyzed using DnaSP ver. 6.12 software [45]. Ranunculus species genomes were compared using mVISTA software (http://genome.lbl.gov/vista/index.shtml, accessed on 2 March 2022) and visualized in shuffle-LAGAN mode.

2.6. Specific Barcode Region Primer Design

Primers for effective molecular markers were designed based on the identifiable intergenic region of Ranunculus species. First, Ranunculus austro-oreganus L.D. Benson, R. bungei Steud., R. cantoniensis DC., R. japonicas Thunb., R. macranthus Scheele, R. occidentalis Nutt., R. pekinensis (L.Liou) Luferov, R. reptans L., R. repens L., R. sceleratus L., and R. yunnanensis Franch were downloaded from GenBank. Additionally, a dataset including the cp genome of R. sceleratus from Republic of Korea assembled in this study was used for subsequent analysis. A total of 12 cp genomes were multi-aligned using MAFFT ver. 7.490 [40]. Among the DNA barcode regions (coding sequence and intergenic), 13 CDS (Pi ≥ 0.02) and 48 intergenic regions (Pi ≥ 0.040) with high nucleotide diversity were selected as hotspots. The PCR amplified product size range was 150–1500 bp.
To evaluate the success of species identification for specific barcode markers, two methods were employed, namely, the phylogenetic tree-based method and the sequence similarity-based method. The phylogenetic tree method analyzed two phylogenetic trees (32 specific barcode region sequences), ML and BI, and judged whether they were consistent with the tree drawn based on the cp genome. The similarity-based method constructed a local database using BLAST 2.2.29+; and the sequences were run through BLAST to perform the query. Identification of species barcoding markers was considered successful when the concordance for homogeneity was 100%.

2.7. Positive Selection Analysis

Extraction of the aligned CDS for Ranunculus was performed using Geneious ver. 11.0.1 [44]. For positive selection analysis, the optimized branch site model method was applied using the CODEML program of the PAML ver. 4.10.6 package [46,47]. We implemented Bayes Empirical Bayes (BEB) and Naive Empirical Bayes (NEB) methods to identify specific amino acid sites in potential positive selection genes to calculate posterior probabilities. Codon sites with high posterior probability (P > 0.5) were considered positively selected sites [48,49]; positive selection: ratio ω > 1, neural selection: ω = 1, and negative selection: ω < 1 [50]. An alternative branching site model (model = 2, NSsites = 2, Fix = 0) and a neutral branching site model (model = 2, NSsites = 2, Fix = 1, Fix ω = 1) were applied to identify positively selected sites. Genes with a p-value < 0.05 and a positively selected site were considered a positive selection. Visualization of the amino acid sequence portions of positively selected genes was performed using Jalview ver. 2.11.2 software [51].

3. Results and Discussion

3.1. CP Genome Characterization for Ranunculus Species

Whole-genome sequencing of R. sceleratus from Republic of Korea produced 958 million reads using the HiSeq 2500 platform, yielding a total of 144 GB (Table 1). The complete cp genome of R. sceleratus from Republic of Korea was obtained by assembly based on the reference genome of R. sceleratus from China (NCBI Accession No.: MK253452). The cp genome of R. sceleratus from Republic of Korea was 156,329 bp in length and had a typical quadripartite structure (Figure 1). The cp genome contained large single-copy (LSC, 85,840 bp), small single-copy (SSC, 19,885 bp), and inverted repeat (IR) regions; the IR comprised two copies of IRs a and b and was 25,302 bp in size (Table 1).
Although the cp genome of higher plants is highly conserved, the extension and contraction between the IR, LSC, and SSC regions cause differences in genome length between species [26,33,34,52,53]. In the case of Ranunculus species, a change in gene position due to the expansion and contraction of IR and SSC was observed. More specifically, in nine species (except R. austro-oreganus and R. occidentalis), the atpH gene was located between the atpF and atpI genes in the 1.3 kb LSC region (Figure 2). In contrast, the atpH gene in R. austro-oreganus and R. occidentalis was located between the ycf1 and trnN-GUU (11.5 kb) genes in the SSC region. Structural variations in IR and SSC can result in gene rearrangement [54,55]. In this study, the SSC region lengths of R. austro-oreganus (21,249 bp) and R. occidentalis (21,269 bp) were extended by more than ~2 kb compared to the SSC region lengths of R. japonicus and R. macranthus (18,909 bp) and, thus, might represent a major cause of atpH gene rearrangement [54,55].
No contraction or expansion was detected in the IR and SSC regions between R. sceleratus from Republic of Korea and China; however, a small 5 bp sequence difference was observed in the LSC region (Table S2). Given that the cp genome tends to be highly conserved across species [56,57,58], it was estimated that low levels of sequence variation exist between the Republic of Korean and Chinese species. Hence, these minor sequence differences in the cp genome serve as useful markers for differentiating geographic populations [27]. This marker can potentially be used for population identification, but further population studies are needed to verify this.
The GC content of the cp genome was 37.9%, which corresponded with that of R. sceleratus from China; 12 other Ranunculus species genomes were reported to have a similar GC content (37.7–37.9%; Table S3). The GC content of the LSC region of the 13 cp genome was 35.9–36.2%; that of the SSC region was 31.0–31.7%, and that of the IR region was 42.8–43.6%, with the largest difference in GC content in the IR region. The cp genome was classified into self-replication, photosynthesis, and other genes, as it is in other plants (Table S2). The Ranunculus species, excluding R. austro-oreganus, R. occidentalis, and R. sceleratus from China, carried 112 genes. The genetic and structural makeup of most species was similar. That is, R. sceleratus from Republic of Korea and China carried infA, while R. austro-oreganus and R. occidentalis had ycf15 genes (Table S2). Notably, the infA gene has been lost in many angiosperms, and in certain plants, it has been transferred to the nucleus [59,60]. Loss of the genome may be a low-cost strategy for rapid replication in adverse environmental conditions [61].

3.2. SSR Analysis of Ranunculus CP Genomes
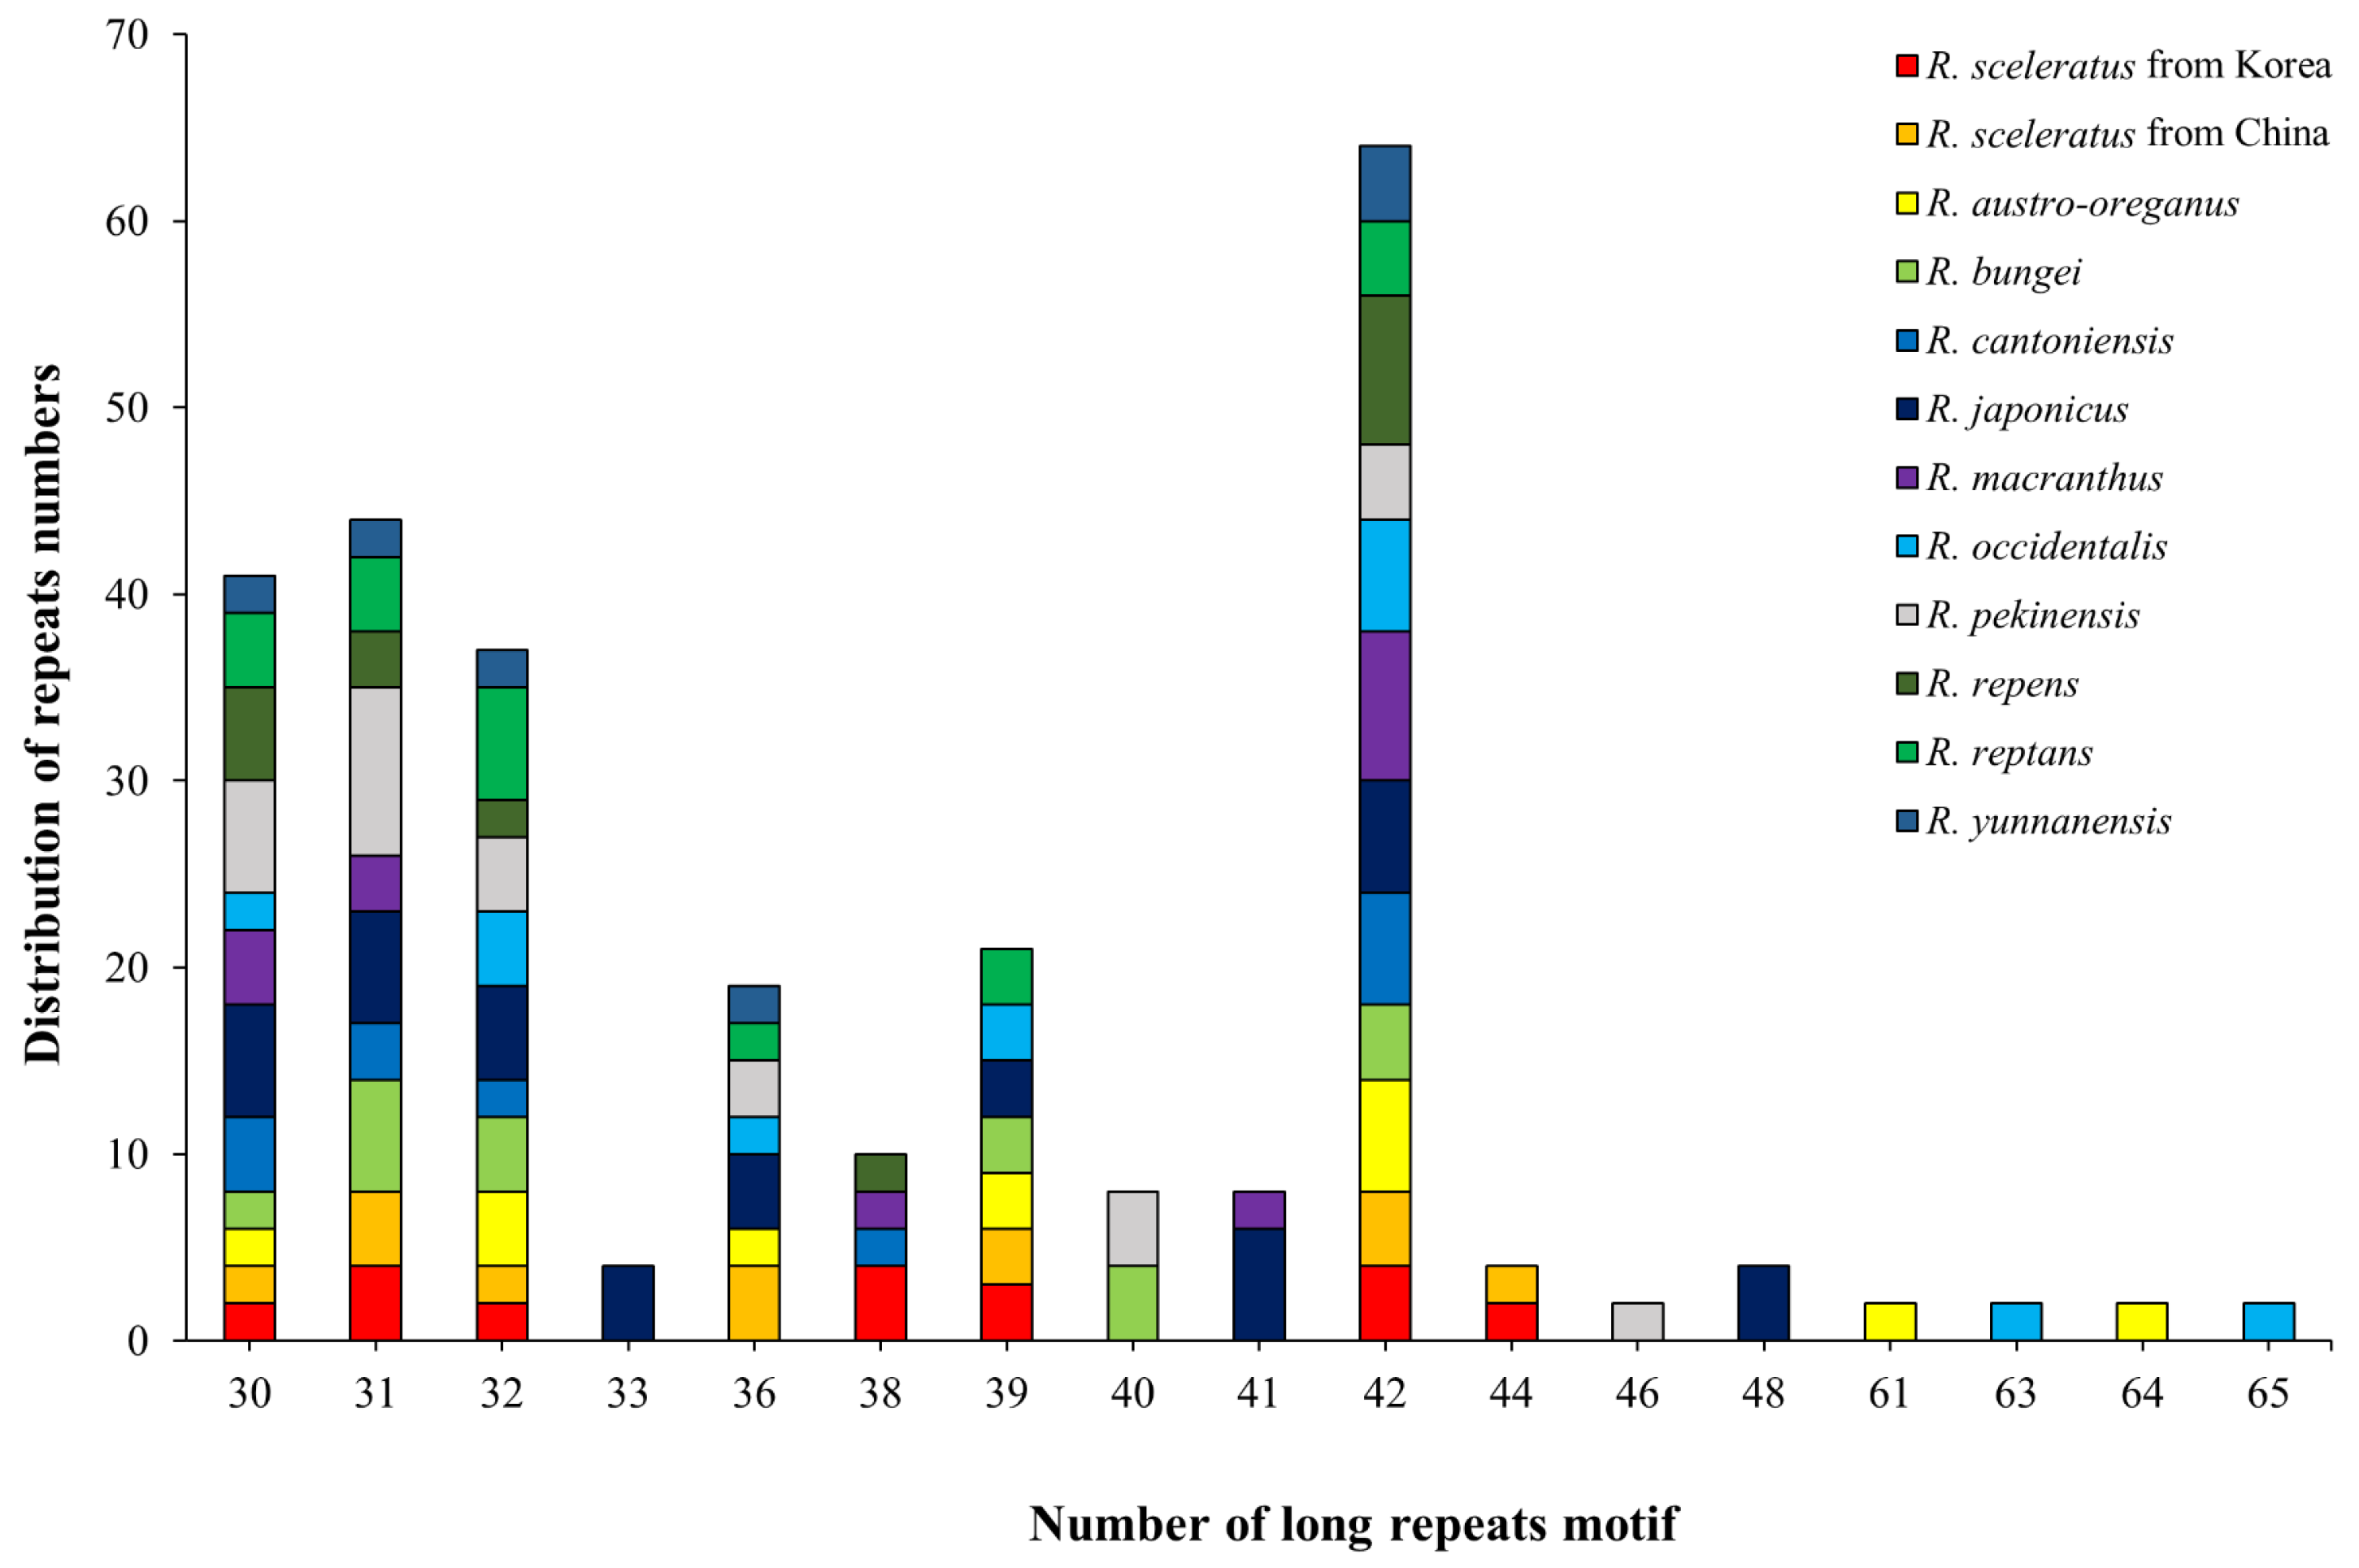
3.2.1. Long Repeats

Long repeats are important hotspots for genetic rearrangement and population variation in the cp genome [62,63,64]. A total of 402 repeats were identified for 12 Ranunculus cp genomes (Table S4), including 148 forward repeats, 127 reverse repeats, 96 complementary repeats, and 31 palindromic repeats. Regarding the number of repeats by species, R. japonicus contained the most (64), while R. yunnanensis had the fewest (18; Figure 3). According to the number of iterations, the largest number of species contained 42 repeats (Figure 4, Table S5). Notably, most species could be identified based on the total number of repeats, excluding R. austro-oreganus (31), R. occidentalis (31), R. bungei (34), and R. reptans (34; Table S4). However, species with the same number of repeats could be identified based on the type of repeats and the ratio of repeats between species (Table S5). Repeat sequences rearrange the cp genome [63] and reportedly enable interspecies identification owing to their random distribution [63,65].

3.2.2. SSR Analysis

In this study, 53, 52, 47, 43, 45, 47, 48, 45, 49, 38, 44, and 37 SSRs were identified for R. sceleratus from Republic of Korea, R. sceleratus from China, R. austro-oreganus, R. bungei, R. cantoniensis, R. japonicus, R. macranthus, R. occidentalis, R. pekinensis, R. reptans, R. repens, and R. yunnanensis, respectively (Table S6). The motif distribution of the Ranunculus species was 58.21% mono-nucleotide, 17.34% di-nucleotide, 15.69% tetra-nucleotide, 6.02% tri-nucleotide, 2.37% penta-nucleotide, and 0.36% hexa-nucleotide (Table S6). The number of SSRs throughout the genome is generally large in the order of di-, mono-, tri-, and tetra-nucleotides [66,67,68]. However, herein, the SSR distribution in the cp genome was large in the order of mono-, di-, tetra-, and tri-nucleotides, with a difference observed in the distribution of SSR between the genome and cp genome. This appears to be a feature of SSR distribution in the cp genome of plants [69,70].
In the cp genome of R. sceleratus from Republic of Korea, 64.15% (34 SSRs) of the SSRs were located in the LSC region, followed by 28.30% (15 SSRs) in the SSC region and 7.55% (4 SSRs) in the IR (Table S6). The R. sceleratus from Republic of Korea and China exhibited small intraspecies sequence differences in the LSC region, which was located between the ndhC and trnV-UAC genes. However, an indel difference in the TAAAG repeat sequence was detected (Figure S1). Hence, the region between these two genes may be useful as a genetic marker to distinguish R. sceleratus species from Republic of Korea and China.
The number of mono-, di-, and tetra-nucleotide repeats was highly variable in the cp genome of Ranunculus species. In fact, if the total number of SSRs among species was the same, it was possible to distinguish between species based on differences in SSR distribution (R. austro-oreganus: 47, R. japonicus: 47, R. cantoniensis: 45, and R. occidentalis: 45). SSR variations in the cp genomes of nine Ranunculus taxa were determined to be useful for comparing phylogenetic relationships through genetic polymorphisms at the population and species level, suggesting their importance for SSR studies.

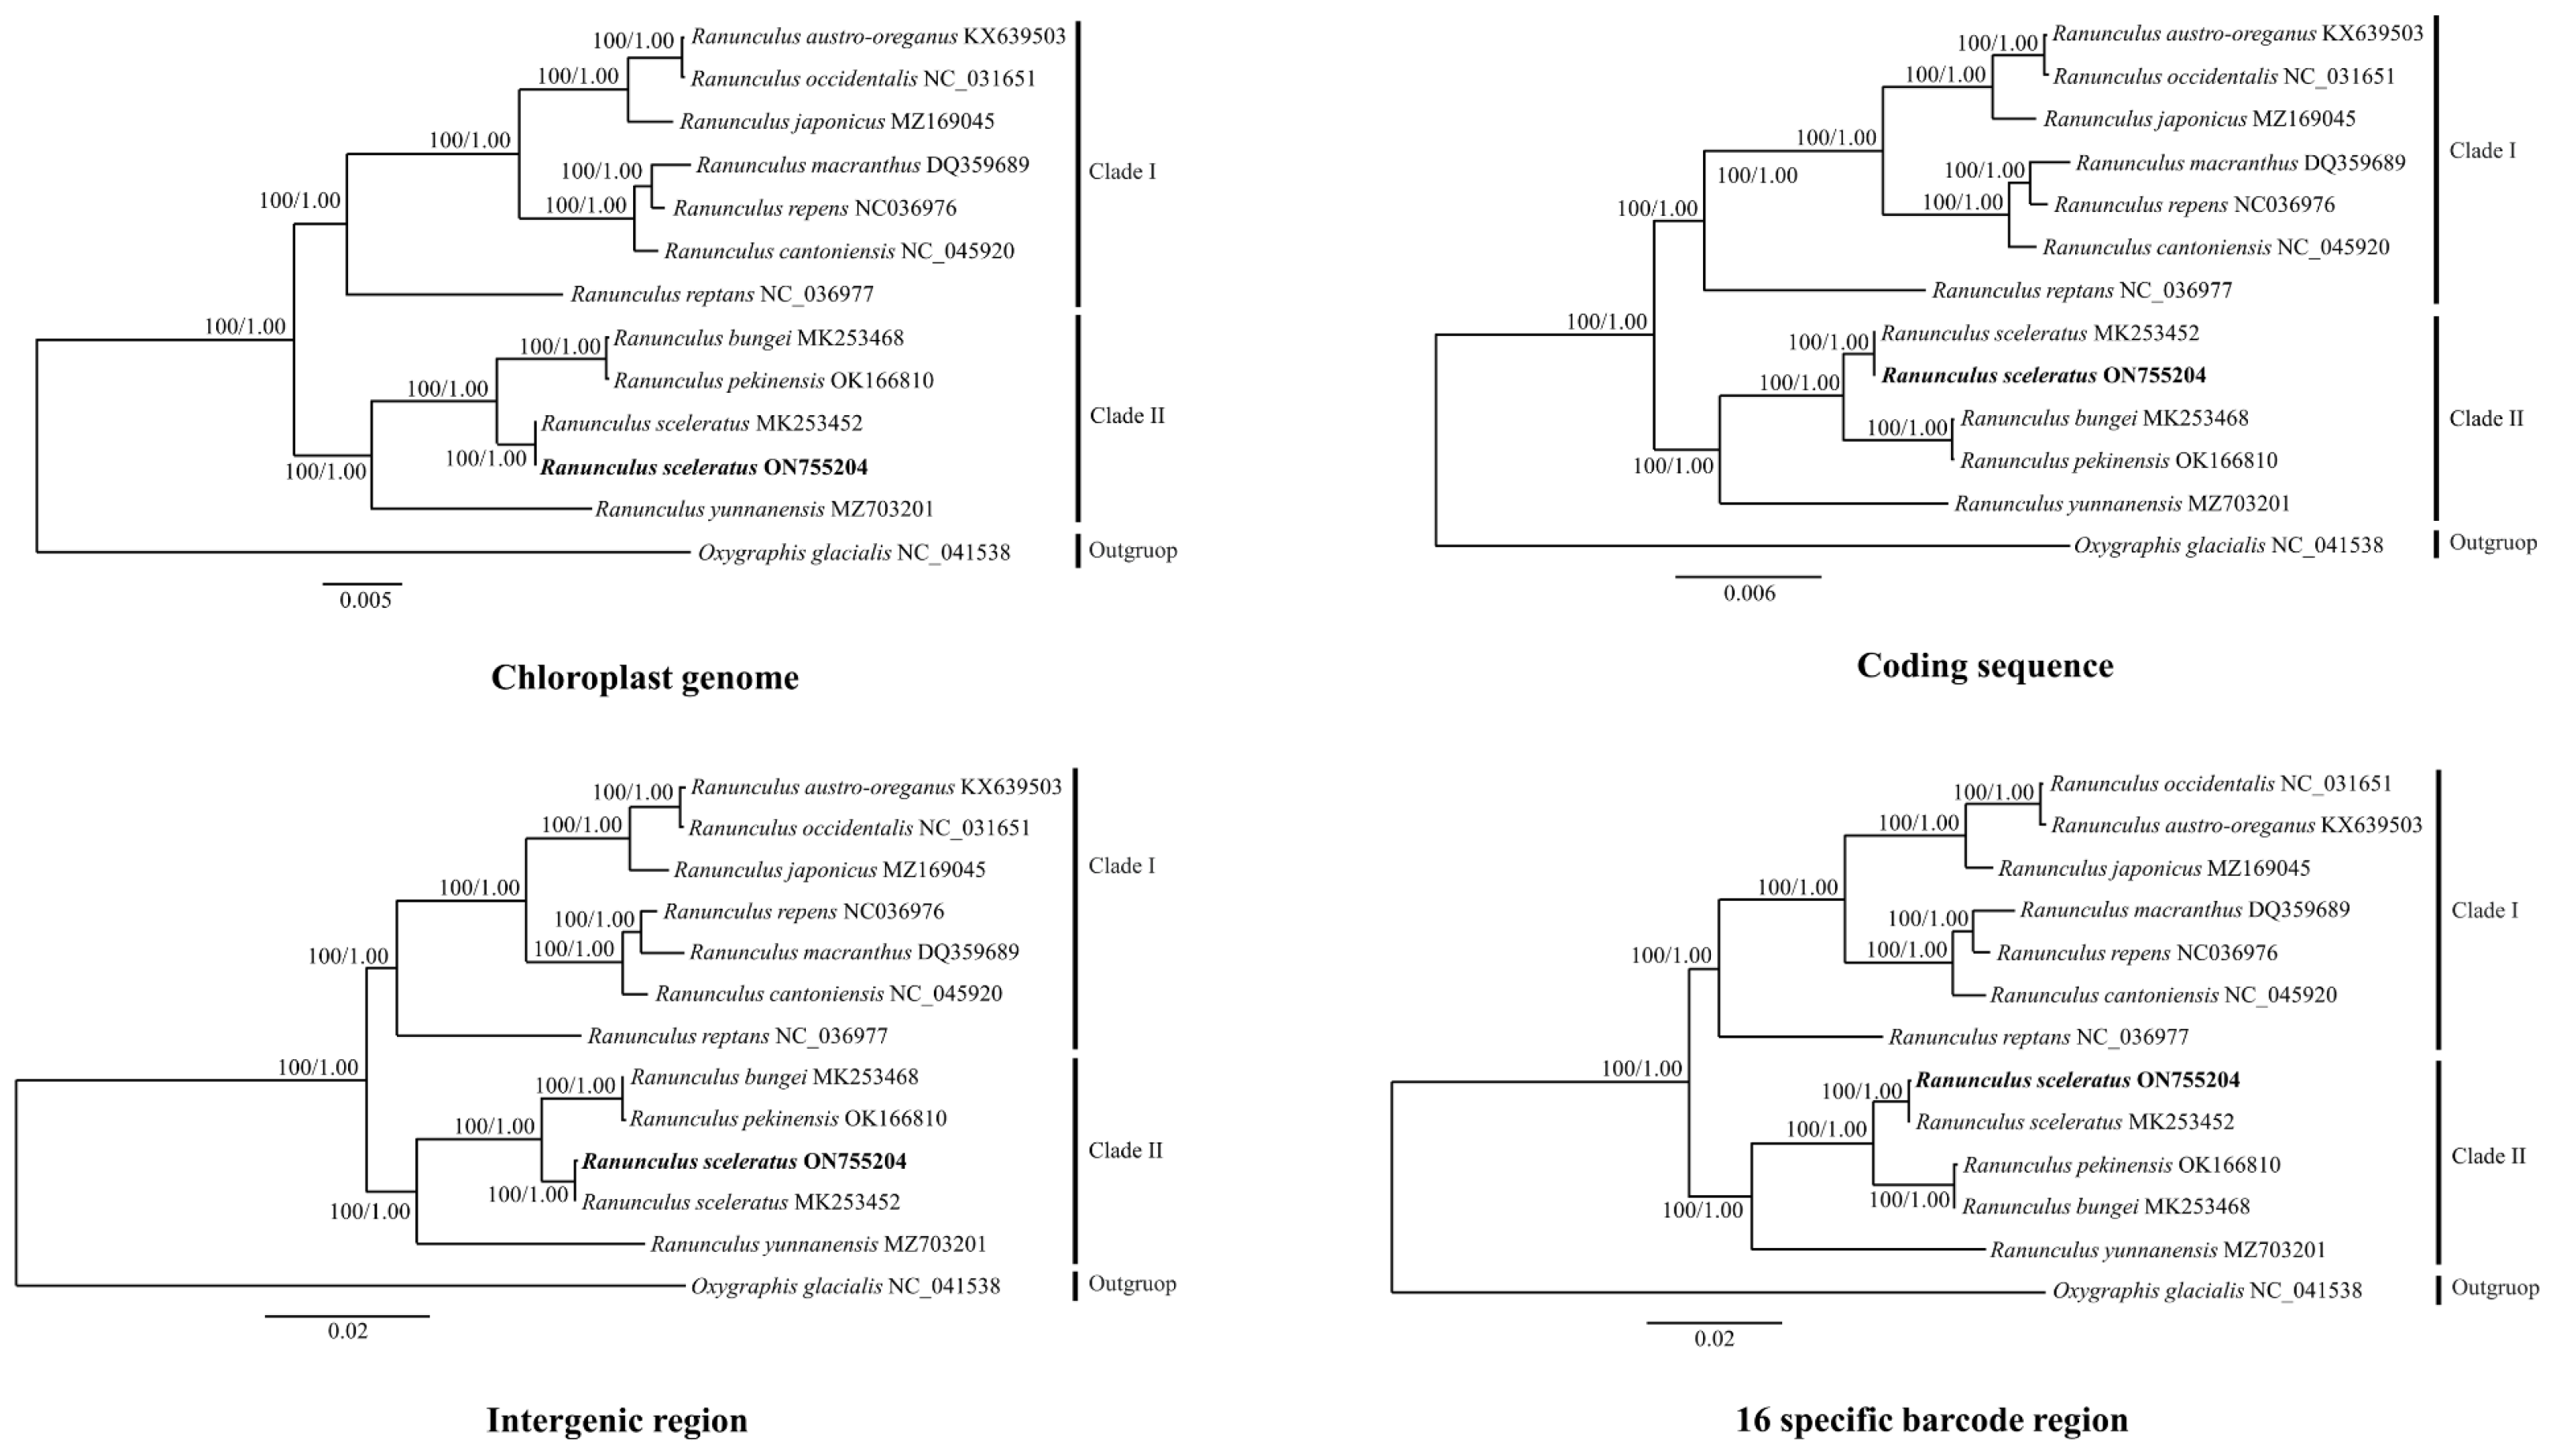
3.3. Phylogenetic Analysis

Datasets used for phylogenetic analysis were classified and constructed to include the cp genome, coding sequences, intergenic regions, and specific barcode regions. ML and BI tree analysis of the four datasets showed that Ranunculus was generated as a single clade; the bootstrap value was strongly supported at 100% for all clades (Figure 5). The first clade comprised six species (R. austro-oreganus, R. occidentalis, R. japonicus, R. cantoniensis, R. macranthus, and R. repens), while the second comprised R. sceleratus from China (MK253452), R. sceleratus from Republic of Korea (ON755204), R. bungei, R. pekinensis, and R. yunnanensis. Ranunculus sceleratus from Republic of Korea was most closely related to R. sceleratus from China.
The complete cp genome has been proposed to be useful for taxonomic reconstruction [26,32] and utilized in previous studies to resolve interspecies phylogenetic relationships within Ranunculus. The current study also demonstrated the potential of using the complete cp genome to resolve phylogenetic relationships [4,26,32,71]. Although the cp genome is phylogenetically informative, the closely related R. austro-oreganus, R. occidentalis, R. bungee, and R. pekinensis required high-resolution specific barcodes for species identification.
The CDS phylogenetic tree did not clearly differentiate between these four closely related species; however, the intergenic regions and 16 specific barcode regions facilitated their identification. In particular, the tree constructed based on specific barcode regions efficiently differentiated the species using a small number of intergenic regions.

3.4. Barcoding Region Screening of Genome Divergence Regions

Genome comparison plots were created using mVISTA to assess the sequence similarity of the cp genomes between Ranunculus species (Figure S2). The aligned gene positions among Ranunculus species showed that the positions and sequences of genes, except atpH, were conserved. When comparing the same species, relatively no difference was detected in the sequences (R. sceleratus from Republic of Korea and China); however, a clear difference in sequences was observed between Ranunculus species. Notably, the IR was relatively more conserved than the LSC and SSC regions, which agrees with results for other plant species.
We multi-aligned the cp genome sequence of the Ranunculus genus and screened the protein-coding regions, intergenic regions, and intronic regions to identify unique regions within the genome. DnaSP analysis searched for polymorphic genes in coding sequences and intergenic regions. The nucleotide diversity (Pi) values ranged from 0.000 (rpl23) to 0.043 (ccsA). The most polymorphic genes were ccsA, matK, rpl32, rps3, ndhE, rps15, ndhG, ndhA, psbH, accD, clpP, atpF, and ndhH (Pi ≥ 0.02), and the least polymorphic gene was rpl23 (Pi: 0.000; Figure 6). The nucleotide diversity of the intergenic region ranged from 0.002 (rpl23-trnL-CAU) to 0.103 (ndhF-rpl32).
The highly polymorphic intergenic regions were ndhF-rpl32, ccsA-ndhD, petG-trnW-CCA, trnH-GUG-psbA, rpl32-trnL-UAG, psbT-psbN, rpl16-rps3, trnL-UAG-ccsA, trnW-CCA-trnP-UGG, rps8-rpl14, ndhE-ndhG, rps16-trnQ-UUG, psaC-ndhE, ndhD-psaC, petA-psbJ, psaJ-rpl33, ndhG-ndhI, rps15-ycf1, petN-psbM, petD-rpoA, trnS-GGA-rps4, trnD-GUC-trnY-GUA, accD-psaI, ndhH-rps15, trnG-GCC-trnfM-CAU, atpF-atpI, trnG-UCC-trnR-UCU, psbI-trnS-GCU, trnT-UGU-trnL-UAA, psbZ-trnG-GCC, petL-petG, trnK-UUU-rps16, ndhC-trnV-UAC, rpl36-rps8, psbK-psbI, rps19-rpl2, rpl14-rpl16, rps2-rpoC2, ycf3-trnS-GGA, psbA-trnK-UUU, rpl22-rps19, trnC-GCA-petN, trnT-GGU-psbD, rps18-rpl20, psbE-petL, psbC-trnS-UGA, rpl33-rps18, and trnP-UGG-psaJ (Pi ≥ 0.040).
Herein, when the sequence diversity of 11 Ranunculus species was compared, the noncoding region was more variable than the coding region (Figure 6). Similarly, in angiosperms, the nucleotide diversity is higher within the intergenic region than within the coding region [27,72,73,74]. Certain hotspots within these variable regions were used to design primers to differentiate Ranunculus species from others, demonstrating that these regions can be utilized as potential barcoding markers. More specifically, within the protein-coding region, 13 regions with a Pi ≥ 0.02 and 48 intergenic regions with a Pi ≥ 0.040 were set as hotspot regions.

3.5. Barcode Validation of Hotspot Regions in the Genome

Among the 48 hotspot regions, those useful as specific barcodes were selected based on BLAST and phylogenetic tree analyses. The specific barcode regions ndhG-ndhI, petN-psbM, atpF-atpI, ndhC-trnV-UAC, trnT-GGU-psbD, and psbE-petL had a BLAST-based species identification rate of 100%. For the remaining 10 markers, the species identification rate using BLAST was 83.3–91.7% (Table 2).
Based on ML and BI analysis, the single hotspot region markers ndhC-trnV-UAC and psbE-petL had 100% species identification, followed by rps8-rpl14, petN-psbM, atpF-atpI, and trnT-GGU-psbD with 91.7% and rpl32-trnL-UAG, rpl16-rps3, rps16-trnQ-UUG, ndhG-ndhI, accD-psaI, trnG-GCC-trnfM-CAU, trnT-UGU-trnL-UAA, psbZ-trnG-GCC, and trnK-UUU-rps16 with 83.3% (Figure S3). The petG-trnW-CCA had the lowest species identification rate at 75% and did not match the phylogenetic tree for other intergenic markers. Indeed, if the evolution and gene locus of a species differ, then the gene tree and the species tree may differ [75].
With the exception of R. austro-oreganus and R. occidentalis, the first group of markers to distinguish between nine Ranunculus species included trnT-UGU-trnL-UAA and trnK-UUU-rps16. The second group of markers to distinguish between nine Ranunculus species, with the exception of R. bungei and R. pekinensis, included petG-trnW-CCA, rpl32-trnL-UAG, rpl16-rps3, rps16-trnQ-UUG, accD-psaI, trnG-GCC-trnfM-CAU, and psbZ-trnG-GCC. With the exception of R. macranthus and R. repens, the third group of markers to distinguish between nine Ranunculus species included rps8-rpl14. Combining two or more markers provides a higher rate of species identification than a single marker [76,77]. Therefore, to enhance species identification, ML and BI phylogenetic tree construction and BLAST were performed to analyze the species identification rate by combining the first, second, and third group markers.
Each of the 37 datasets showed a high species identification rate of 100% compared to the existing single markers (Figure S3). The hotspot markers were petG-trnW-CCA + trnT-UGU-trnL-UAA + rps8-rpl14, rpl16-rps3 + rps8-rpl14, rpl16-rps3 + trnT-UGU-trnL-UAA + rps8-rpl14, rpl16-rps3 + trnK-UUU-rps16 + rps8-rpl14, rps16-trnQ-UUG + rps8-rpl14, accD-psaI + rps8-rpl14, accD-psaI + trnT-UGU-trnL-UAA + rps8-rpl14, accD-psaI + trnK-UUU-rps16 + rps8-rpl14, trnG-GCC-trnfM-CAU + rps8-rpl14, trnG-GCC-trnfM-CAU + trnT-UGU-trnL-UAA + rps8-rpl14, trnG-GCC-trnfM-CAU + trnK-UUU-rps16 + rps8-rpl14, trnT-UGU-trnL-UAA + rps8-rpl14, psbZ-trnG-GCC + rps8-rpl14, psbZ-trnG-GCC + trnT-UGU-trnL-UAA + rps8-rpl14, psbZ-trnG-GCC + trnK-UUU-rps16 + rps8-rpl14, and trnK-UUU-rps16 + rps8-rpl14, which showed 100% species identification (Table S6, Figure S3).
The combination of specific barcode markers identified seven-fold more variant sites than conventional single specific barcode markers. Given that markers have different rates of nucleotide variation at different loci, when assessing closely related species, the application of combination markers may be more advantageous for species identification [78]. The conventional barcoding markers, rbcL, psbA-trnH-GUG, and trnL-UAA-trnF-GAA, showed a low 75% species identification rate using BLAST and phylogenetic tree-based methods (Table 3). Therefore, the combination of specific barcode markers and single specific barcode markers with high species resolution developed in this study can replace the existing barcoding markers.
Primers were designed for the flanking regions of these markers to enable the use of 16 hotspot regions as specific barcodes (Table 4). The 100% species identifiable markers for Ranunculus showed high resolution for genetically closely related species, such as R. austro-oreganus, R. occidentalis, R. bungei, and R. pekinensis. Accordingly, these markers can be effectively applied for the identification of very closely related species of the genus Ranunculus.

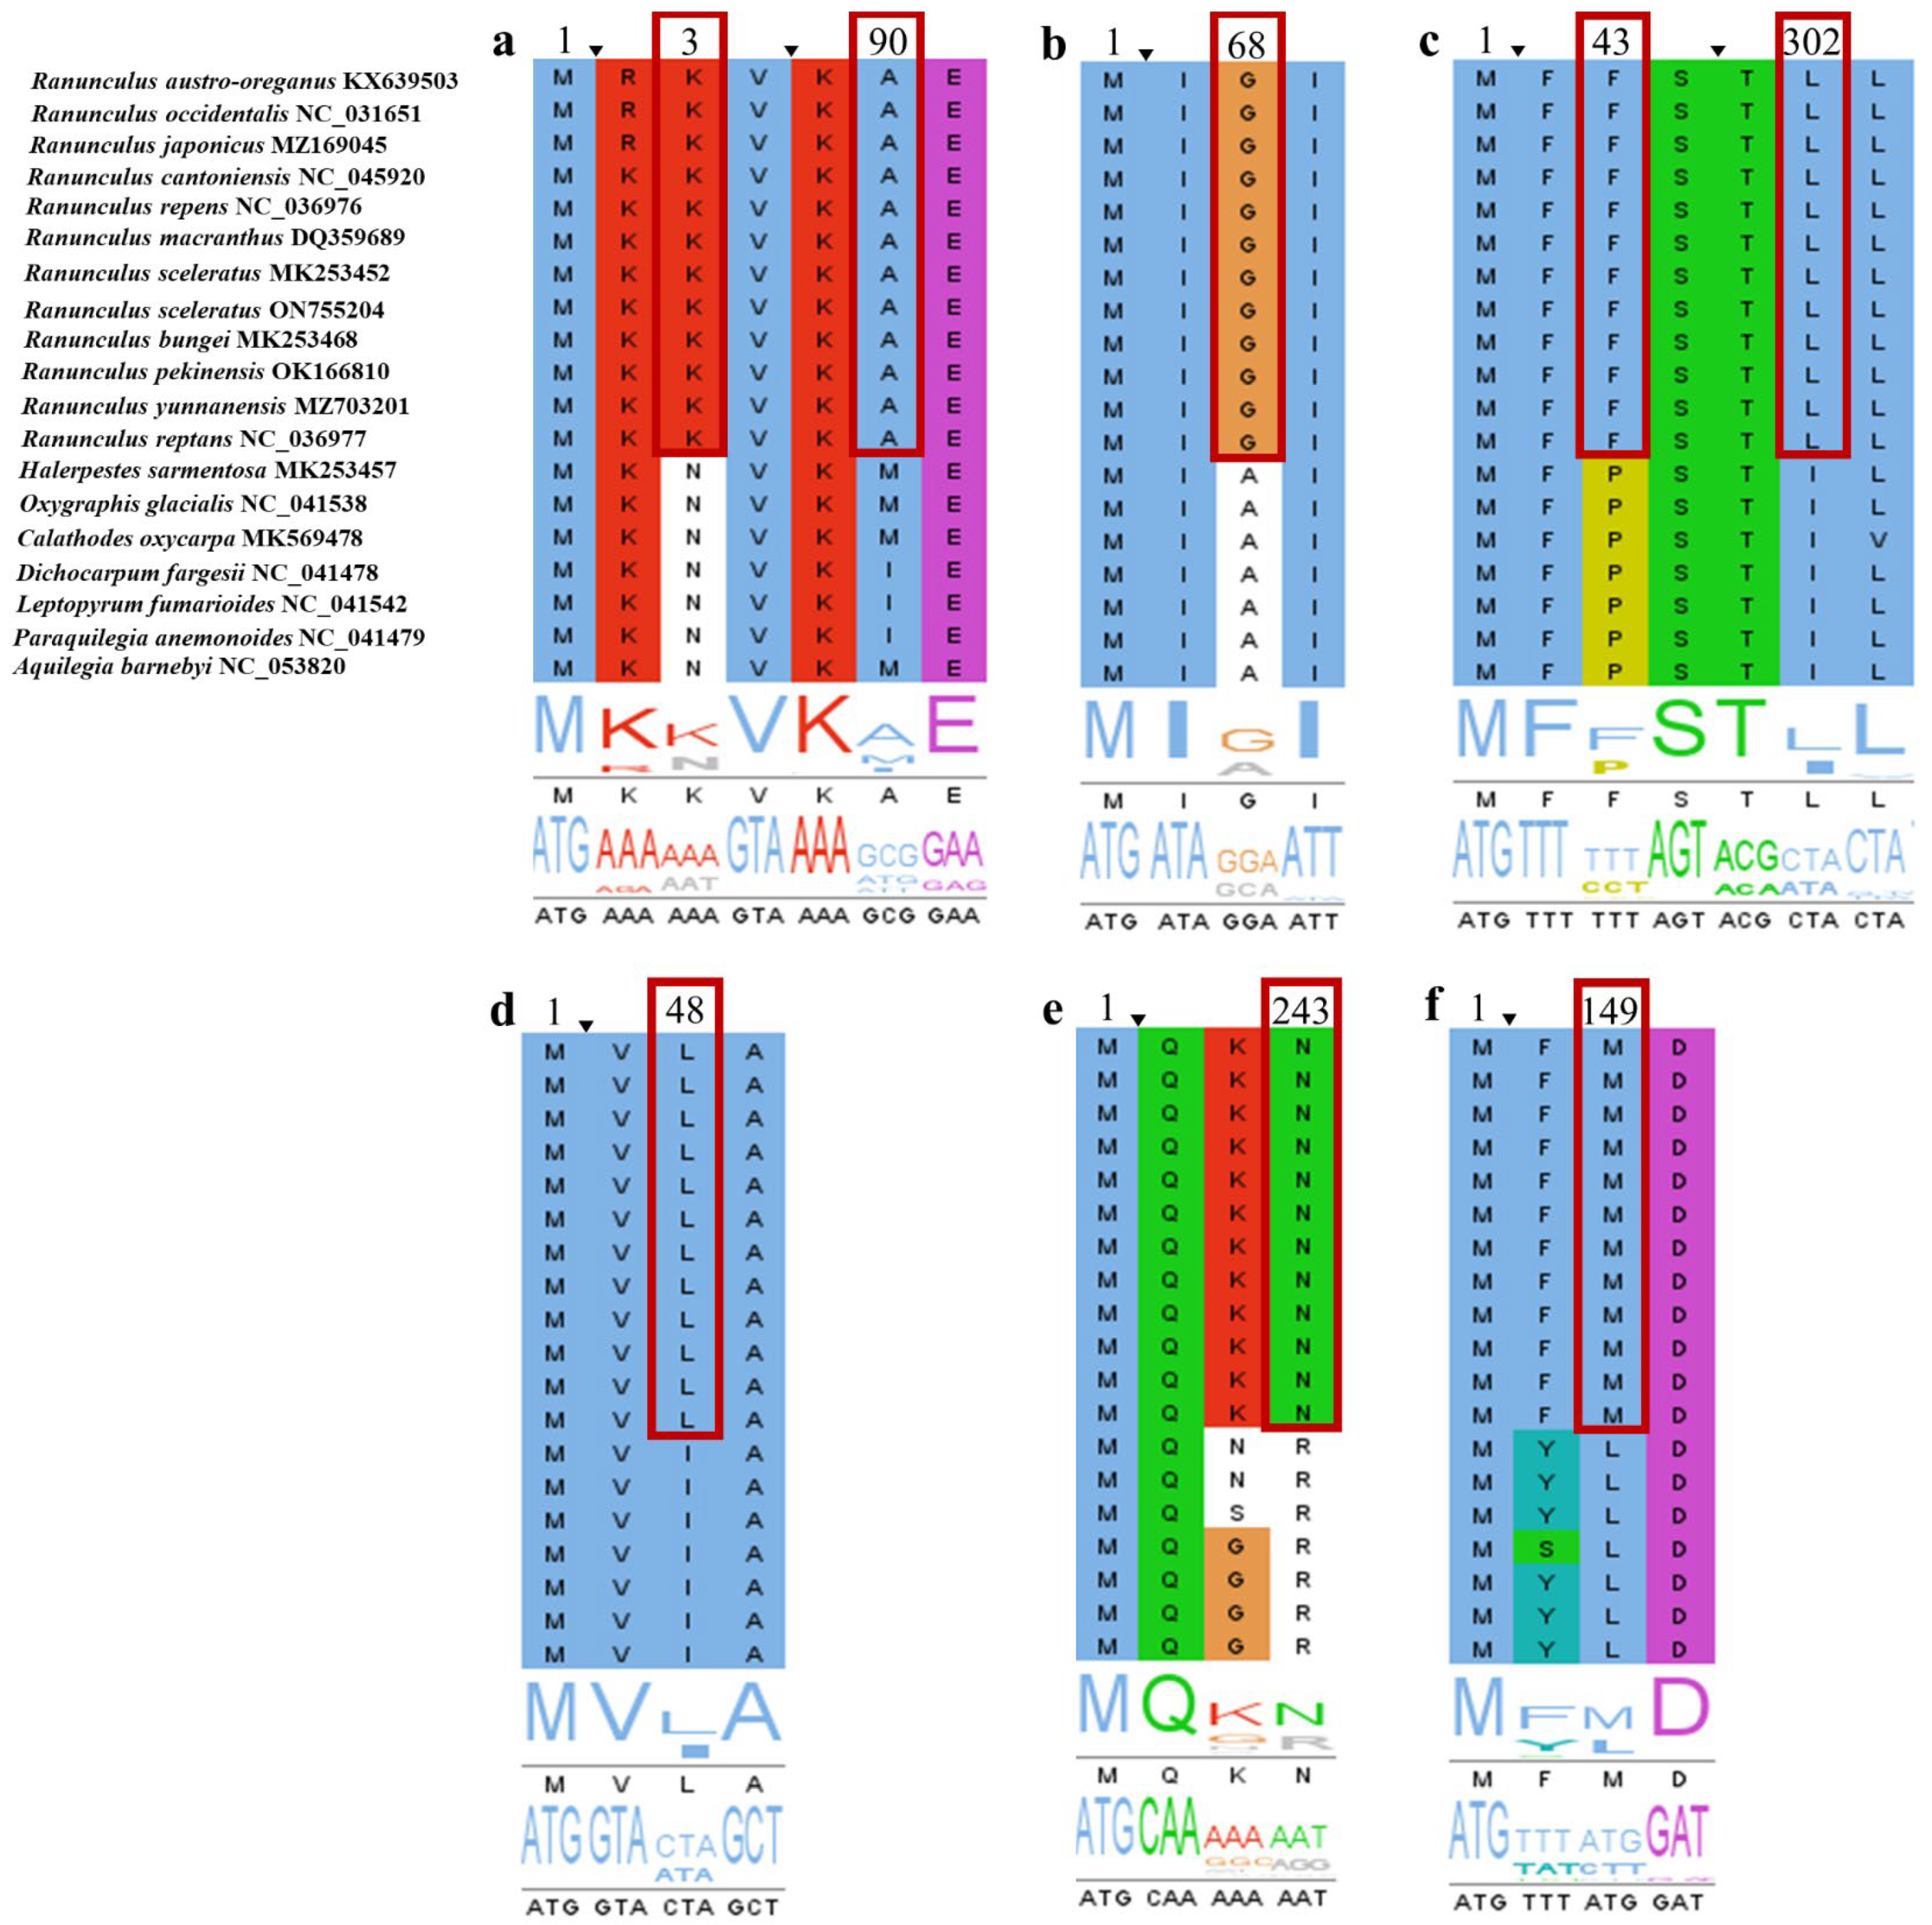
3.6. Positive Selection Analyses

Positive selection analysis was performed on 66 CDS. In the likelihood ratio analysis, most p-values for all genes were >0.05, i.e., insignificant. In contrast, in the BEB test, atpF, ndhE, ndhF, rpl23, rpoA, rps4, and ycf4 showed posterior probabilities ≥ 0.7, with ndhE, ndhF, and rpl23 having values ≥ 0.9. In the NEB method, positively selected sites in atpF, ndhF, rps4, and rpoA genes were detected as ≥0.8 (Table S8). In a previous study, codon regions with high posterior probability based on BEB and NEB analyses were considered positive selection genes [48]. Therefore, we ultimately selected atpF, ndhE, ndhF, rpl23, rpoA, and rps4 as positive selection genes. The six amino acid characteristics between Ranunculus species and other genera are shown in Figure 7.
The atpF gene, which is required for electron transport and photophosphorylation during photosynthesis, encodes the H+-ATP synthetase subunit [79]. The rpoA gene encodes a plastid-encoded RNA polymerase (PEP) that regulates gene expression [80,81,82]. The rpl and rps genes encode large and small subunits of ribosomal proteins and are differentially expressed according to abiotic and biotic environmental factors by regulating plant growth and transcription [83,84].
The chloroplast ndh gene forms a thylakoid NADH dehydrogenase (Ndh) complex homologous to the encoded polypeptide and mitochondrial complex I [85,86,87]. As such, ndh plays an essential role in photosynthesis in higher plants [88]. In particular, the Ndh complex generated from ndh protects against photooxidation-related stress and maintains an optimal photophosphorylation rate [88]. However, the ndh gene is presumably not required in mild, unstressed environments and exhibits rapid changes in function under light-related stress [88,89,90]. In this study, ndhE, ndhF, rpl23, atpF, rps4, and rpoA were confirmed to have high positive selection sites. Considering that various light-related stressful environments alter the biochemical composition and morphology of plants during acclimatization [91], it is inferred that these positive selection sites represent mutations in gene function related to environmental resistance as a light-related stress response in Ranunculus species. Therefore, genes that are positively selected and adapted to these genes could represent adaptation to new environmental conditions for Ranunculus species.

4. Conclusions

Ranunculus sceleratus (family: Ranunculaceae) is a medicinally and economically important plant; however, gaps in taxonomic and species identification limit its practical applicability. The aim of this study was to elucidate the chloroplast genome of R. sceleratus from Republic of Korea, identify how it differed from the chloroplast genome of R. sceleratus from China, and identify potential specific barcodes through genome comparisons in the genus Ranunculus. The chloroplast genome was assembled from Illumina HiSeq 2500 sequencing raw data. The genome was 156,329 bp and had a typical quadripartite structure comprising a small single-copy region, a large single-copy region, and two inverted repeats. Fifty-three simple sequence repeats were identified in the four quadrant structural regions. The region between the ndhC and trnV-UAC genes could be useful as a genetic marker to distinguish between R. sceleratus populations from Republic of Korea and China. The Ranunculus species formed a single lineage. To differentiate between Ranunculus species, we identified 16 hotspot regions and confirmed their potential using specific barcodes based on phylogenetic tree and BLAST-based analyses. The ndhE, ndhF, rpl23, atpF, rps4, and rpoA genes were considered positively selected owing to their high posterior probability. The amino acid site varied between Ranunculus species and other genera. Comparison of the Ranunculus genomes provides useful information regarding species identification and evolution that could guide future phylogenetic analyses.

Supplementary Materials

The following supporting information can be downloaded at: https://www.mdpi.com/article/10.3390/genes14061149/s1, Figure S1: The alignment of the chloroplast sequence was based on the chloroplast genome of R. sceleratus from Republic of Korea and China; Figure S2: The alignment of the chloroplast sequence was based on the chloroplast genome of R. sceleratus from Republic of Korea; Figure S3: Maximum Likelihood and Bayesian Inference phylogenetic trees of specific barcode region markers; Figure S4: Maximum Likelihood and Bayesian Inference phylogenetic trees of combination markers of intergenic regions; Table S1: List of species information used for comparative chloroplast genome analysis of Ranunculus; Table S2: List of genes in the Ranunculus species; Table S3: Comparative information of the cp genome structure of the species in the Ranunculus genus; Table S4: Repeat type information of Ranunculus species; Table S5: Distribution by species according to the long repeat sequence; Table S6: SSR region information of the species cp genome of the genus Ranunculus; Table S7: Sequence and tree-based species identification rate of combinatorial markers of the genus Ranunculus; Table S8: The potential positive selection test based on the branch-site model of Ranunculus.

Author Contributions

Conceptualization, K.-R.K., S.Y.P., H.K., and J.-N.Y.; Data curation, K.-R.K., S.Y.P., H.K., and S.-Y.K.; Formal analysis, K.-R.K., S.Y.P., and J.-N.Y.; Funding acquisition, J.-N.Y.; Investigation, J.M.H. and S.-Y.K.; Project administration, J.-N.Y.; Supervision, J.-N.Y.; Validation, K.-R.K. and J.M.H.; Visualization, K.-R.K.; Writing—original draft, K.-R.K. and J.-N.Y.; Writing—review and editing, K.-R.K. and J.-N.Y. All authors have read and agreed to the published version of the manuscript.

Funding

This work was supported by the Republic of Korea Environment Industry & Technology Institute (KEITI) through the Project to make multi-ministerial national biological research resources more advanced, funded by the Republic of Korea Ministry of Environment (MOE) (2021003420003).

Institutional Review Board Statement

Not applicable.

Informed Consent Statement

Not applicable.

Data Availability Statement

The genome sequence data that support the findings of this study are openly available from NCBI GenBank (https://www.ncbi.nlm.nih.gov/ accessed on 2 March 2022) under the accession no. ON755204.

Conflicts of Interest

The authors declare no conflict of interest. The funders had no role in the design of the study; in the collection, analyses, or interpretation of data; in the writing of the manuscript; or in the decision to publish the results.

Abbreviations

CPchloroplast genome
CDScoding sequence
BEBBayes Empirical Bayes
NEBNaïve Empirical Bayes
MLmaximum likelihood
Pinucleotide diversity
SSRsimple sequence repeat

References

  1. Almerekova, S.; Shchegoleva, N.; Abugalieva, S.; Turuspekov, Y. The molecular taxonomy of three endemic Central Asian species of Ranunculus (Ranunculaceae). PLoS ONE 2020, 15, e0240121. [Google Scholar] [CrossRef] [PubMed]
  2. Tamura, M. Ranunculaceae. In The Families and Genera of Vascular Plants. II. Dicotyledons; Kubitzki, K., Rower, J.G., Bittrich, V., Eds.; Springer: New York, NY, USA, 1993; pp. 563–583. [Google Scholar]
  3. Tamura, M. Angiospermae. Ordnung Ranunculales. Fam. Ranunculaceae. II. Systematic Part. In Die Natürliche Pflanzenfamilien, 2nd ed.; Hiepko, P., Ed.; Duncker & Humblot: Berlin, Germany, 1995; pp. 223–519. [Google Scholar]
  4. Emadzade, K.; Lehnebach, C.; Lockhart, P.; Hörandl, E. A molecular phylogeny, morphology and classification of genera of Ranunculeae (Ranunculaceae). Taxon 2010, 59, 809–828. [Google Scholar] [CrossRef]
  5. Hoerandl, E.; Emadzade, K. Evolutionary classification: A case study on the diverse plant genus Ranunculus L. (Ranunculaceae). Perspect. Plant Ecol. Evol. Syst. 2012, 14, 310–324. [Google Scholar] [CrossRef]
  6. Telford, A.; O’Hare, M.T.; Cavers, S.; Holmes, N. Can genetic bar-coding be used to identify aquatic Ranunculus L. subgenus Batrachium (DC) A. Gray? A test using some species from the British Isles. Aquat. Bot. 2011, 95, 65–70. [Google Scholar] [CrossRef]
  7. Mei, H.; Zuo, S.; Ye, L.; Wang, J.; Ma, S. Review of the application of the traditional Chinese medicinal herb, Ranunculus sceleratus Linn. J. Med. Plant Res. 2012, 6, 1821–1826. [Google Scholar] [CrossRef]
  8. Zhang, Z.; Miao, Y.; Xu, M.; Cheng, W.; Yang, C.; She, X.; Geng, Q.; Zhang, Q. TianJiu therapy for α-naphthyl isothiocyanate-induced intrahepatic cholestasis in rats treated with fresh Ranunculus sceleratus L. J. Ethnopharmacol. 2020, 248, 112310. [Google Scholar] [CrossRef]
  9. Li, X.F. The buttercup medical plant resource of Qian Xi Na Zhou. Chin. Wild Plant Resour. 1999, 18, 49–50. [Google Scholar]
  10. Shahid, S.; Riaz, T.; Asghar, M.N. Screening of Ranunculus sceleratus for enzyme inhibition, antibacterial and antioxidant activities. Bangladesh J. Pharmacol. 2015, 10, 436–442. [Google Scholar] [CrossRef]
  11. Akkol, E.K.; Süntar, I.; Erdoğan, T.F.; Keleş, H.; Gonenc, T.M.; Kıvçak, B. Wound healing and anti-inflammatory properties of Ranunculus pedatus and Ranunculus constantinapolitanus: A comparative study. J. Ethnopharmacol. 2012, 139, 478–484. [Google Scholar] [CrossRef]
  12. Cao, B.J.; Meng, Q.Y.; Ji, N. Analgesic and anti-inflammatory effects of Ranunculus japonicus extract. Planta Med. 1992, 58, 496–498. [Google Scholar] [CrossRef]
  13. Kong, C.S.; Lee, J.I.; Karadeniz, F.; Kim, H.; Seo, Y. Effect of the Arctic terrestrial plant Ranunculus hyperboreus on LPS-induced inflammatory response via MAPK pathways. Z. Naturforsch. C 2018, 73, 273–279. [Google Scholar] [CrossRef] [PubMed]
  14. Li, H.; Zhou, C.X.; Pan, Y.; Gao, X.; Wu, X.; Bai, H.; Zhou, L.; Chen, Z.; Zhang, S.; Shi, S.; et al. Evaluation of antiviral activity of compounds isolated from Ranunculus sieboldii and Ranunculus sceleratus. Planta Med. 2005, 71, 1128–1133. [Google Scholar] [CrossRef] [PubMed]
  15. Saber, A.H.; Mahran, G.H.; El–Alfy, T. Phytochemical investigation of Ranunculus sceleratus L. Planta Med. 1968, 16, 231–238. [Google Scholar] [CrossRef] [PubMed]
  16. Yun, H.S.; Dinzouna-Boutamba, S.D.; Lee, S.; Moon, Z.; Kwak, D.; Rhee, M.H.; Chung, D.I.; Hong, Y.; Goo, Y.K. Antimalarial effect of the total glycosides of the medicinal plant, Ranunculus japonicus. Pathogens 2021, 10, 532. [Google Scholar] [CrossRef]
  17. Goo, Y.K. Therapeutic potential of Ranunculus species (Ranunculaceae): A literature review on traditional medicinal herbs. Plants 2022, 11, 1599. [Google Scholar] [CrossRef]
  18. Dong, T.T.; Cui, X.M.; Song, Z.H.; Zhao, K.J.; Ji, Z.N.; Lo, C.K.; Tsim, K.W. Chemical assessment of roots of Panax notoginseng in China: Regional and seasonal variations in its active constituents. J. Agric. Food Chem. 2003, 51, 4617–4623. [Google Scholar] [CrossRef]
  19. Lian, C.; Yang, H.; Lan, J.; Zhang, X.; Zhang, F.; Yang, J.; Chen, S. Comparative analysis of chloroplast genomes reveals phylogenetic relationships and intraspecific variation in the medicinal plant Isodon rubescens. PLoS ONE 2022, 17, e0266546. [Google Scholar] [CrossRef]
  20. Guo, B.J. A technique for monitoring pollutants by means of micronuclear cells in root-tip cells of Ranunculus sceleratus. Acta Sci. Circum. 1985, 5, 322–326. [Google Scholar]
  21. Hu, J.F.; Wang, X.M.; Shi, G.R.; Hu, Z.D. The purification of Fe2+ in wastewater with Ranunculus sceleratus in gardens. J. Huaibei Coal Indust. Teach. College 2007, 28, 31–33. [Google Scholar]
  22. Wang, D.; Zhang, Y.L.; Pang, B. Study on purification effect in different concentrations of sewage by Ranunculus sceleratus L. J. Shandong For. Sci. Technol. 2009, 39, 14–16. [Google Scholar]
  23. Fazekas, A.J.; Burgess, K.S.; Kesanakurti, P.R.; Graham, S.W.; Newmaster, S.G.; Husband, B.C.; Percy, D.M.; Hajibabaei, M.; Barrett, S.C. Multiple multilocus DNA barcodes from the plastid genome discriminate plant species equally well. PLoS ONE 2008, 3, e2802. [Google Scholar] [CrossRef] [PubMed]
  24. Kress, W.J.; Wurdack, K.J.; Zimmer, E.A.; Weigt, L.A.; Janzen, D.H. Use of DNA barcodes to identify flowering plants. Proc. Natl. Acad. Sci. USA 2005, 102, 8369–8374. [Google Scholar] [CrossRef]
  25. Hollingsworth, M.L.; Clark, A.A.; Forrest, L.L.; Richardson, J.; Pennington, R.T.; Long, D.G.; Cowan, R.; Chase, M.W.; Gaudeul, M.; Hollingsworth, P.M. Selecting barcoding loci for plants: Evaluation of seven candidate loci with species-level sampling in three divergent groups of land plants. Mol. Ecol. Res. 2009, 9, 439–457. [Google Scholar] [CrossRef] [PubMed]
  26. Rao, R.; Zeng, Z.-F.; Du, Y.; Mao, C.-M.; Xie, L.; Guo, X.-L.; Yue, L.L. The complete chloroplast genome of Ranunculus yunnanensis (Ranunculaceae). Mitochondrial DNA Part B Resour. 2022, 7, 60–61. [Google Scholar] [CrossRef] [PubMed]
  27. Zhao, K.; Li, L.; Quan, H.; Yang, J.; Zhang, Z.; Liao, Z.; Lan, X. Comparative analyses of chloroplast genomes from 14 Zanthoxylum species: Identification of variable DNA markers and phylogenetic relationships within the genus. Front. Plant Sci. 2021, 11, 605793. [Google Scholar] [CrossRef] [PubMed]
  28. Lahaye, R.; Van der Bank, M.; Bogarin, D.; Warner, J.; Pupulin, F.; Gigot, G.; Maurin, O.; Duthoit, S.; Barraclough, T.G.; Savolainen, V. DNA barcoding the floras of biodiversity hotspots. Proc. Natl. Acad. Sci. USA 2008, 105, 2923–2928. [Google Scholar] [CrossRef]
  29. Li, X.; Yang, Y.; Henry, R.J.; Rossetto, M.; Wang, Y.; Chen, S. Plant DNA barcoding: From gene to genome. Biol. Rev. 2015, 90, 157–166. [Google Scholar] [CrossRef]
  30. Chase, M.W.; Cowan, R.S.; Hollingsworth, P.M.; van den Berg, C.; Madrinan, S.; Petersen, G.; Seberg, O.; Jørgsensen, T.; Cameron, K.M.; Carine, M.; et al. A proposal for a standardised protocol to barcode all land plants. Taxon 2007, 56, 295–299. [Google Scholar] [CrossRef]
  31. Li, T.; Fu, X.; Deng, H.; Han, X.; Wen, F.; Xu, L. The complete chloroplast genome of Ranunculus cantoniensis. Mitochondrial DNA Part B Resour. 2019, 4, 1095–1096. [Google Scholar] [CrossRef]
  32. Liu, X.; Yang, W.; Zhang, D.; Liu, H.; Cui, Y.; Wang, L.; Hu, H.; Yin, Y.; Zhang, G. The complete chloroplast genome sequence of Ranunculus pekinensis (L. Liou) Luferov (Ranunculaceae), a species endemic to China. Mitochondrial DNA Part B Resour. 2022, 7, 841–843. [Google Scholar] [CrossRef]
  33. Raubeson, L.A.; Peery, R.; Chumley, T.W.; Dziubek, C.; Fourcade, H.M.; Boore, J.L.; Jansen, R.K. Comparative chloroplast genomics: Analyses including new sequences from the angiosperms Nuphar advena and Ranunculus macranthus. BMC Genom. 2007, 8, 1–27. [Google Scholar] [CrossRef] [PubMed]
  34. Zeng, W.-Q.; Yan, H.-J.; Wu, Y.-Z.; Wang, R.; Xiao, X.-F.; Qi, Z.-C.; Yan, X.L. The complete chloroplast genome sequence of Japanese buttercup Ranunculus japonicus Thunb. Mitochondrial DNA Part B Resour. 2021, 6, 3186–3187. [Google Scholar] [CrossRef] [PubMed]
  35. Dierckxsens, N.; Mardulyn, P.; Smits, G. NOVOPlasty: De novo assembly of organelle genomes from whole genome data. Nucleic Acids Res. 2017, 45, e18. [Google Scholar] [CrossRef] [PubMed]
  36. Jin, J.-J.; Yu, W.-B.; Yang, J.-B.; Song, Y.; DePamphilis, C.W.; Yi, T.-S.; Li, D.Z. GetOrganelle: A fast and versatile toolkit for accurate de novo assembly of organelle genomes. Genome Biol. 2020, 21, 1–31. [Google Scholar] [CrossRef] [PubMed]
  37. Shi, L.; Chen, H.; Jiang, M.; Wang, L.; Wu, X.; Huang, L.; Liu, C. CPGAVAS2, an integrated plastome sequence annotator and analyzer. Nucleic Acids Res. 2019, 47, W65–W73. [Google Scholar] [CrossRef] [PubMed]
  38. Lohse, M.; Drechsel, O.; Kahlau, S.; Bock, R. OrganellarGenomeDRAW—A suite of tools for generating physical maps of plastid and mitochondrial genomes and visualizing expression data sets. Nucleic Acids Res. 2013, 41, W575–W581. [Google Scholar] [CrossRef]
  39. Beier, S.; Thiel, T.; Münch, T.; Scholz, U.; Mascher, M. MISA-web: A web server for microsatellite prediction. Bioinformatics 2017, 33, 2583–2585. [Google Scholar] [CrossRef]
  40. Katoh, K.; Standley, D.M. MAFFT multiple sequence alignment software version 7: Improvements in performance and usability. Mol. Biol. Evol. 2013, 30, 772–780. [Google Scholar] [CrossRef]
  41. Posada, D. jModelTest: Phylogenetic model averaging. Mol. Biol. Evol. 2008, 25, 1253–1256. [Google Scholar] [CrossRef]
  42. Guindon, S.; Dufayard, J.-F.; Lefort, V.; Anisimova, M.; Hordijk, W.; Gascuel, O. New algorithms and methods to estimate maximum-likelihood phylogenies: Assessing the performance of PhyML 3.0. Sys. Biol. 2010, 59, 307–321. [Google Scholar] [CrossRef]
  43. Ronquist, F.; Teslenko, M.; van der Mark, P.; Ayres, D.L.; Darling, A.; Höhna, S.; Larget, B.; Liu, L.; Suchard, M.A.; Huelsenbeck, J.P. MrBayes 3.2: Efficient Bayesian phylogenetic inference and model choice across a large model space. Syst. Biol. 2012, 61, 539–542. [Google Scholar] [CrossRef] [PubMed]
  44. Kearse, M.; Moir, R.; Wilson, A.; Stones-Havas, S.; Cheung, M.; Sturrock, S.; Buxton, S.; Cooper, A.; Markowitz, S.; Duran, C.; et al. Geneious Basic: An integrated and extendable desktop software platform for the organization and analysis of sequence data. Bioinformatics 2012, 28, 1647–1649. [Google Scholar] [CrossRef] [PubMed]
  45. Rozas, J.; Ferrer-Mata, A.; Sánchez-DelBarrio, J.C.; Guirao-Rico, S.; Librado, P.; Ramos-Onsins, S.E.; Sanchez-Gracia, A. DnaSP 6: DNA sequence polymorphism analysis of large data sets. Mol. Biol. Evol. 2017, 34, 3299–3302. [Google Scholar] [CrossRef] [PubMed]
  46. Yang, Z. PAML: A program package for phylogenetic analysis by maximum likelihood. Comput. Appl. Biosci. 1997, 13, 555–556. [Google Scholar] [CrossRef]
  47. Yang, Z.; Dos Reis, M. Statistical properties of the branch-site test of positive selection. Mol. Biol. Evol. 2010, 28, 1217–1228. [Google Scholar] [CrossRef]
  48. Lan, Y.; Sun, J.; Tian, R.; Bartlett, D.H.; Li, R.; Wong, Y.H.; Zhang, W.; Qiu, J.W.; Xu, T.; He, L.S.; et al. Molecular adaptation in the world’s deepest-living animal: Insights from transcriptome sequencing of the hadal amphipod Hirondellea gigas. Mol. Ecol. 2017, 26, 3732–3743. [Google Scholar] [CrossRef]
  49. Xie, D.-F.; Yu, Y.; Deng, Y.-Q.; Li, J.; Liu, H.-Y.; Zhou, S.-D.; He, X.J. Comparative analysis of the chloroplast genomes of the Chinese endemic genus Urophysa and their contribution to chloroplast phylogeny and adaptive evolution. Int. J. Mol. Sci. 2018, 19, 1847. [Google Scholar] [CrossRef]
  50. Yang, Z.; Nielsen, R. Codon-substitution models for detecting molecular adaptation at individual sites along specific lineages. Mol. Biol. Evol. 2002, 19, 908–917. [Google Scholar] [CrossRef]
  51. Clamp, M.; Cuff, J.; Searle, S.M.; Barton, G.J. The jalview java alignment editor. Bioinformatics 2004, 20, 426–427. [Google Scholar] [CrossRef]
  52. Dann, M.; Bellot, S.; Schepella, S.; Schaefer, H.; Tellier, A. Mutation rates in seeds and seed-banking influence substitution rates across the angiosperm phylogeny. bioRxiv 2017. [Google Scholar] [CrossRef]
  53. He, J.; Yao, M.; Lyu, R.-D.; Lin, L.-L.; Liu, H.-J.; Pei, L.-Y.; Yan, S.X.; Xie, L.; Cheng, J. Structural variation of the complete chloroplast genome and plastid phylogenomics of the genus Asteropyrum (Ranunculaceae). Sci. Rep. 2019, 9, 15285. [Google Scholar] [CrossRef] [PubMed]
  54. Hirao, T.; Watanabe, A.; Kurita, M.; Kondo, T.; Takata, K. Complete nucleotide sequence of the Cryptomeria japonica D. Don. chloroplast genome and comparative chloroplast genomics: Diversified genomic structure of coniferous species. BMC Plant Biol. 2008, 8, 1–20. [Google Scholar] [CrossRef] [PubMed]
  55. Zeng, S.; Zhou, T.; Han, K.; Yang, Y.; Zhao, J.; Liu, Z.L. The complete chloroplast genome sequences of six Rehmannia species. Genes 2017, 8, 103. [Google Scholar] [CrossRef] [PubMed]
  56. Dobrogojski, J.; Adamiec, M.; Luciński, R. The chloroplast genome: A review. Acta Physiol. Plant. 2020, 42, 1–13. [Google Scholar] [CrossRef]
  57. Ravi, V.; Khurana, J.P.; Tyagi, A.K.; Khurana, P. An update on chloroplast genomes. Plant Syst. Evol. 2008, 271, 101–122. [Google Scholar] [CrossRef]
  58. Sammut, R.; Huttley, G. Regional context in the alignment of biological sequence pairs. J. Mol. Evol. 2011, 72, 147–159. [Google Scholar] [CrossRef]
  59. Li, Y.; Zhou, J.G.; Chen, X.L.; Cui, Y.X.; Xu, Z.C.; Li, Y.H.; Song, J.Y.; Duan, B.Z.; Yao, H. Gene losses and partial deletion of small single-copy regions of the chloroplast genomes of two hemiparasitic Taxillus species. Sci. Rep. 2017, 7, 12834. [Google Scholar] [CrossRef]
  60. Magee, A.M.; Aspinall, S.; Rice, D.W.; Cusack, B.P.; Sémon, M.; Perry, A.S.; Stefanović, S.; Milbourne, D.; Barth, S.; Palmer, J.D.; et al. Localized hypermutation and associated gene losses in legume chloroplast genomes. Genome Res. 2010, 20, 1700–1710. [Google Scholar] [CrossRef]
  61. McCoy, S.R.; Kuehl, J.V.; Boore, J.L.; Raubeson, L.A. The complete plastid genome sequence of Welwitschia mirabilis: An unusually compact plastome with accelerated divergence rates. BMC Evol. Biol. 2008, 8, 1–16. [Google Scholar] [CrossRef]
  62. Gao, L.; Yi, X.; Yang, Y.-X.; Su, Y.-J.; Wang, T. Complete chloroplast genome sequence of a tree fern Alsophila spinulosa: Insights into evolutionary changes in fern chloroplast genomes. BMC Evol. Biol. 2009, 9, 1–14. [Google Scholar] [CrossRef]
  63. Guisinger, M.M.; Kuehl, J.V.; Boore, J.L.; Jansen, R.K. Extreme reconfiguration of plastid genomes in the angiosperm family Geraniaceae: Rearrangements, repeats, and codon usage. Mol. Biol. Evol. 2011, 28, 583–600. [Google Scholar] [CrossRef] [PubMed]
  64. Guo, H.; Liu, J.; Luo, L.; Wei, X.; Zhang, J.; Qi, Y.; Zhang, B.; Liu, H.; Xiao, P. Complete chloroplast genome sequences of Schisandra chinensis: Genome structure, comparative analysis, and phylogenetic relationship of basal angiosperms. Sci. China Life Sci. 2017, 60, 1286–1290. [Google Scholar] [CrossRef] [PubMed]
  65. Wen, F.; Wu, X.; Li, T.; Jia, M.; Liu, X.; Liao, L. The complete chloroplast genome of Stauntonia chinensis and compared analysis revealed adaptive evolution of subfamily Lardizabaloideae species in China. BMC Genom. 2021, 22, 161. [Google Scholar] [CrossRef] [PubMed]
  66. Ambreen, H.; Kumar, S.; Variath, M.T.; Joshi, G.; Bali, S.; Agarwal, M.; Kumar, A.; Jagannath, A.; Goel, S. Development of genomic microsatellite markers in Carthamus tinctorius L.(safflower) using next generation sequencing and assessment of their cross-species transferability and utility for diversity analysis. PLoS ONE 2015, 10, e0135443. [Google Scholar] [CrossRef] [PubMed]
  67. Martina, M.; Acquadro, A.; Barchi, L.; Gulino, D.; Brusco, F.; Rabaglio, M.; Portis, F.; Portis, E.; Lanteri, S. Genome-wide survey and development of the first microsatellite markers database (AnCorDB) in Anemone coronaria L. Int. J. Mol. Sci. 2022, 23, 3126. [Google Scholar] [CrossRef]
  68. Zhao, H.; Yang, L.; Peng, Z.; Sun, H.; Yue, X.; Lou, Y.; Dong, L.; Wang, L.; Gao, Z. Developing genome-wide microsatellite markers of bamboo and their applications on molecular marker assisted taxonomy for accessions in the genus Phyllostachys. Sci. Rep. 2015, 5, 8018. [Google Scholar] [CrossRef]
  69. Alzahrani, D.A.; Albokhari, E.J.; Yaradua, S.S.; Abba, A. Comparative analysis of chloroplast genomes of four medicinal Capparaceae species: Genome structures, phylogenetic relationships and adaptive evolution. Plants 2021, 10, 1229. [Google Scholar] [CrossRef]
  70. Song, Y.; Wang, S.; Ding, Y.; Xu, J.; Li, M.F.; Zhu, S.; Chen, N. Chloroplast genomic resource of Paris for species discrimination. Sci. Rep. 2017, 7, 3427. [Google Scholar] [CrossRef]
  71. Wiegleb, G.; Bobrov, A.A.; Zalewska-Gałosz, J. A taxonomic account of Ranunculus section Batrachium (Ranunculaceae). Phytotaxa 2017, 319, 1–55. [Google Scholar] [CrossRef]
  72. Liu, H.; He, J.; Ding, C.; Lyu, R.; Pei, L.; Cheng, J.; Xie, L. Comparative analysis of complete chloroplast genomes of Anemoclema, Anemone, Pulsatilla, and Hepatica revealing structural variations among genera in tribe Anemoneae (Ranunculaceae). Front. Plant Sci. 2018, 9, 1097. [Google Scholar] [CrossRef]
  73. Yu, X.-Q.; Drew, B.T.; Yang, J.-B.; Gao, L.-M.; Li, D.-Z. Comparative chloroplast genomes of eleven Schima (Theaceae) species: Insights into DNA barcoding and phylogeny. PLoS ONE 2017, 12, e0178026. [Google Scholar] [CrossRef] [PubMed]
  74. Zhang, T.; Xing, Y.; Xu, L.; Bao, G.; Zhan, Z.; Yang, Y.; Wang, J.; Li, S.; Zhang, D.; Kang, T. Comparative analysis of the complete chloroplast genome sequences of six species of Pulsatilla Miller, Ranunculaceae. Chin. Med. 2019, 14, 1–14. [Google Scholar] [CrossRef] [PubMed]
  75. Doorduin, L.; Gravendeel, B.; Lammers, Y.; Ariyurek, Y.; Chin-A-Woeng, T.; Vrieling, K. The complete chloroplast genome of 17 individuals of pest species Jacobaea vulgaris: SNPs, microsatellites and barcoding markers for population and phylogenetic studies. DNA Res. 2011, 18, 93–105. [Google Scholar] [CrossRef] [PubMed]
  76. Awad, M.; Fahmy, R.M.; Mosa, K.A.; Helmy, M.; El-Feky, F.A. Identification of effective DNA barcodes for Triticum plants through chloroplast genome-wide analysis. Comput. Biol. Chem. 2017, 71, 20–31. [Google Scholar] [CrossRef]
  77. Wang, W.; Chen, S.; Zhang, X. Whole-genome comparison reveals divergent IR borders and mutation hotspots in chloroplast genomes of herbaceous bamboos (Bambusoideae: Olyreae). Molecules 2018, 23, 1537. [Google Scholar] [CrossRef]
  78. Yan, H.-F.; Liu, Y.-J.; Xie, X.-F.; Zhang, C.-Y.; Hu, C.-M.; Hao, G.; Ge, X.J. DNA barcoding evaluation and its taxonomic implications in the species-rich genus Primula L. in China. PLoS ONE 2015, 10, e0122903. [Google Scholar] [CrossRef]
  79. Hudson, G.S.; Mason, J.G. The chloroplast genes encoding subunits of the H+-ATP synthase. Photosynth. Res. 1988, 18, 205–222. [Google Scholar] [CrossRef]
  80. Hajdukiewicz, P.T.; Allison, L.A.; Maliga, P. The two RNA polymerases encoded by the nuclear and the plastid compartments transcribe distinct groups of genes in tobacco plastids. EMBO J. 1997, 16, 4041–4048. [Google Scholar] [CrossRef]
  81. Piot, A.; Hackel, J.; Christin, P.A.; Besnard, G. One-third of the plastid genes evolved under positive selection in PACMAD grasses. Planta 2018, 247, 255–266. [Google Scholar] [CrossRef]
  82. Yu, Q.-B.; Huang, C.; Yang, Z.-N. Nuclear-encoded factors associated with the chloroplast transcription machinery of higher plants. Front. Plant Sci. 2014, 5, 316. [Google Scholar] [CrossRef]
  83. Fromont-Racine, M.; Senger, B.; Saveanu, C.; Fasiolo, F. Ribosome assembly in eukaryotes. Gene 2003, 313, 17–42. [Google Scholar] [CrossRef] [PubMed]
  84. Moin, M.; Bakshi, A.; Madhav, M.S.; Kirti, P.B. Expression profiling of ribosomal protein gene family in dehydration stress responses and characterization of transgenic rice plants overexpressing RPL23A for water-use efficiency and tolerance to drought and salt stresses. Front. Chem. 2017, 5, 97. [Google Scholar] [CrossRef] [PubMed]
  85. Casano, L.M.; Zapata, J.M.; Martı́n, M.; Sabater, B. Chlororespiration and poising of cyclic electron transport: Plastoquinone as electron transporter between thylakoid NADH dehydrogenase and peroxidase. J. Biol. Chem. 2000, 275, 942–948. [Google Scholar] [CrossRef] [PubMed]
  86. Kofer, W.; Koop, H.-U.; Wanner, G.; Steinmüller, K. Mutagenesis of the genes encoding subunits A, C, H, I, J and K of the plastid NAD (P) H-plastoquinone-oxidoreductase in tobacco by polyethylene glycol-mediated plastome transformation. Mol. Gen. Genet. 1998, 258, 166–173. [Google Scholar] [CrossRef]
  87. Sabater, B. On the edge of dispensability, the chloroplast ndh genes. Int. J. Mol. Sci. 2021, 22, 12505. [Google Scholar] [CrossRef] [PubMed]
  88. Martín, M.; Sabater, B. Plastid ndh genes in plant evolution. Plant Physiol. Biochem. 2010, 48, 636–645. [Google Scholar] [CrossRef]
  89. Kulheim, C.; Ågren, J.; Jansson, S. Rapid regulation of light harvesting and plant fitness in the field. Science 2002, 297, 91–93. [Google Scholar] [CrossRef]
  90. Martín, M.; Funk, H.T.; Serrot, P.H.; Poltnigg, P.; Sabater, B. Functional characterization of the thylakoid Ndh complex phosphorylation by site-directed mutations in the ndhF gene. Biochim. Et Biophys. Acta (BBA)-Bioenerg. 2009, 1787, 920–928. [Google Scholar] [CrossRef]
  91. Terashima, I.; Araya, T.; Miyazawa, S.-I.; Sone, K.; Yano, S. Construction and maintenance of the optimal photosynthetic systems of the leaf, herbaceous plant and tree: An eco-developmental treatise. Ann. Bot. 2005, 95, 507–519. [Google Scholar] [CrossRef]
Figure 1. Structure of the complete chloroplast genome of Ranunculus sceleratus from Republic of Korea.
Genes 14 01149 g001
Figure 2. Characteristics of the region adjacent to the contraction and expansion of inverted repeats (*: R. sceleratus from Republic of Korea, **: R. sceleratus from China).
Genes 14 01149 g002
Figure 3. Long repeat type distribution of Ranunculus species.
Genes 14 01149 g003
Figure 4. Distribution of species based on the number of long repeats.
Genes 14 01149 g004
Figure 5. Phylogenetic trees comprising 12 species in the family Ranunculaceae using the maximum likelihood method, based on the chloroplast gene sequence. The numbers above the nodes represent the bootstrap support value for each branch.
Genes 14 01149 g005
Figure 6. Nucleotide diversity in the entire chloroplast genome of 11 species. (a) coding sequence; (b) intergenic region.
Genes 14 01149 g006
Figure 7. Amino acid sites of positive selection in the genus Ranunculus in the family Ranunculaceae. (a), atpF; (b), ndhE; (c), ndhF; (d), rpl23; (e), rpoA; (f), rps4. The red square box represents the variation of amino acid positions in the species of the genus Ranunculus.
Genes 14 01149 g007
Table 1. Chloroplast genome information of Ranunculus sceleratus from Republic of Korea.
Total Reads958,608,148
Percentage of subsampling reads (%)15.0
GC content of total reads (%)41.22
Chloroplast genome length (bp)156,329
Large single-copy length (bp)85,840
Small single-copy length (bp)19,885
Inverted repeat length (bp)25,302
Total number of genes112
Table 2. Sequence matching of the hotspot region markers and tree-based species identification.
No.Region NamePiAlignment Length (bp)ML Tree (%)BLAST (%)Total Identification Rate (%)
1petG-trnW-CCA0.0911757583.379.2
2rpl32-trnL-UAG0.08388583.383.383.3
3rpl16-rps30.07321783.383.383.3
4rps8-rpl140.06933591.791.791.7
5rps16-trnQ-UUG0.067123783.383.383.3
6ndhG-ndhI0.06240983.310091.7
7petN-psbM0.059132791.710095.9
8accD-psaI0.05581983.383.383.3
9trnG-GCC-trnfM-CAU0.05420983.383.383.3
10atpF-atpI0.053195691.710095.9
11trnT-UGU-trnL-UAA0.05299583.383.383.3
12psbZ-trnG-GCC0.05242483.383.383.3
13trnK-UUU-rps160.05156583.383.383.3
14ndhC-trnV-UAC0.0491441100100100.0
15trnT-GGU-psbD0.041158991.710095.9
16psbE-petL0.0401274100100100.0
Table 3. Sequence and tree-based species identification rate of existing barcode markers in the genus Ranunculus.
No.Region NameLength (bp)ML Tree (%)BLAST (%)Total Identification Rate (%)
1matK15278310091.5
2rbcL1428757575
3psbA-trnH-GUG366757575
4trnL-UAA-trnF-GAA418757575
Table 4. Sequence and tree-based species identification rate of existing barcode markers in the genus Ranunculus.
No.Intergenic RegionForward Primer (5′–3′)Reverse Primer (5′–3′)Product Size Range (bp)Annealing
Temperature (°C)
Sequencing Success (%)
1petG-trnW-CCATACAGACGCGGTGATCAGTTGGACCCAAAACCCGATGTCGTAGGTTC200–25058100
2rpl32-trnL-UAGGCAAAATCTATTTCCACCGGGAATGTCTACCGATTTCACCATAGCG800–90058100
3rpl16-rps3CAACGAGTCACACACTAAGCAACTATCTATGGGGCATTAGGAA200–30058100
4rps8-rpl14TCCATGTCAGCATTTCGTATCGGTGCAATCGCTCGAGAGTTGA370–41058100
5rps16-trnQ-UUGCGCACGTTGCTTTCTACCACACGAATCCTTCCGTCCCAGAG1000–120058100
6ndhG-ndhIGGTCGGTTACCAATGTCAGTGAAAGGAGCTGTGCAGCAGCGA600–70058100
7petN-psbMGGCTGCTTTAATGGTAGTCTTTACTCGCATTCATTGCTACTGCACTG1200–130058100
8accD-psaIGAGTGAGTTATTTCAGCTTCACGGGAGGGTAAGTTGAAAGTTGTCAT750–85058100
9trnG-GCC-trnfM-CAUCGATTCCCGCTATCCGCCTAGGTAGCTCGCAAGGCTCATAAC250–30058100
10atpF-atpIGGCCAGTGACCCAAGGAAACTAGGGGAATCCATGGAGGGTCA300–190058100
11trnT-UGU-trnL-UAACGGCTATCGGAATCGAACCGGCGTCTACCAATTTCGCCATATC800–100058100
12psbZ-trnG-GCCCCCGTTGTATTTGCTTCTTCTGACCGCGTCTTCTCCTTGGCAA500–60058100
13trnK-UUU-rps16AGCCGCACTTAAAAGCCGAGTACGATCCCGAAGAGAGGGAAG500–70058100
14ndhC-trnV-UACGAGTTTCTCTGGCCCTTCATTATACCGAGAAGGTCTACGGTTC1300–140058100
15trnT-GGU-psbDGGCGTAAGTCATCGGTTCAAATTCTCCGTAACCAGTCATCCATA1500–160058100
16psbE-petLCGTGCTTCCAGACATGCTGAGCCGTATCTTGCTCAGACCAAT1200–130058100
Disclaimer/Publisher’s Note: The statements, opinions and data contained in all publications are solely those of the individual author(s) and contributor(s) and not of MDPI and/or the editor(s). MDPI and/or the editor(s) disclaim responsibility for any injury to people or property resulting from any ideas, methods, instructions or products referred to in the content.

