Abstract
Hypercholesterolemia was prevalent in 44.9% of The Malaysian Cohort participants, of which 51% were Malay. This study aimed to identify the variants involved in hypercholesterolemia among Malays and to determine the association between genetic and non-genetic risk factors. This nested case–control study included 25 Malay participants with the highest low-density lipoprotein cholesterol (LDL-C, >4.9 mmol/L) and total cholesterol (TC, >7.5 mmol/L) and 25 participants with the lowest LDL-C/TC. Genomic DNA was extracted, and whole-exome sequencing was performed using the Ion ProtonTM system. All variants were annotated, filtered, and cross-referenced against publicly available databases. Forty-five selected variants were genotyped in 677 TMC Malay participants using the MassARRAY® System. The association between genetic and non-genetic risk factors was determined using logistic regression analysis. Age, fasting blood glucose, tobacco use, and family history of hyperlipidemia were significantly associated with hypercholesterolemia. Participants with the novel OSBPL7 (oxysterol-binding protein-like 7) c.651_652del variant had 17 times higher odds for hypercholesterolemia. Type 2 diabetes patients on medication and those with PCSK9 (proprotein convertase subtilisin/kexin type 9) rs151193009 had low odds for hypercholesterolemia. Genetic predisposition can interact with non-genetic factors to increase hypercholesterolemia risk in Malaysian Malays.
1. Introduction
Hypercholesterolemia is one of the risk factors for cardiovascular disease (CVD), the leading cause of mortality and morbidity worldwide [1]. Based on the 2015 Malaysian Ministry of Health report, the overall prevalence of hypercholesterolemia among Malaysian adults was 47.7%, and 38.6% were undiagnosed [2]. A recent publication from The Malaysian Cohort (TMC) project, a multi-ethnic population cohort, showed that hypercholesterolemia was prevalent in 44.9% of the participants, of which 51% were of Malay descent [3]. Hypercholesterolemia is a multi-factorial disease; the primary cause is genetic predisposition, and the secondary causes include unhealthy diet, smoking, and hypothyroidism [4].
The genetic disorder in hypercholesterolemia refers to familial hypercholesterolemia (FH), which causes elevated low-density lipoprotein cholesterol (LDL-C) levels [5]. Currently, the genes involved in FH can be divided into tier 1, 2, and 3 genes based on their involvement in lipid metabolism [5,6,7,8]. The tier 1 genes include that for LDL receptor (LDLR), apolipoprotein B-100 (APOB), and proprotein convertase subtilisin/kexin type 9 (PCSK9), which follow the autosomal dominant mode of inheritance, and LDLR adaptor protein 1 (LDLRAP1), which follows the autosomal recessive mode of inheritance (directly implicated in FH) [5,6]. Tier 2 genes are indirectly implicated in FH, but are associated with regulation of LDL or affects the expression of LDL-regulating genes, whereas tier 3 genes are the other genes implicated in lipid regulation [7,8]. FH is a genetic disease with gene dosage effects, being more severe in homozygous compared to heterozygous patients [9]. Most of the common mutations are reported in the LDLR gene (90%) [10]. However, the majority of patients have polygenic hypercholesterolemia, which results from the interaction of genetic factors with a sedentary lifestyle and increased intake of dietary fats [4].
In Malaysia, the frequency of heterozygous and homozygous FH is one in 500 and one in 1 million, respectively, but the actual frequency may be higher due to underdiagnosis [11]. Thus, several studies have attempted to determine the mutational profiles in Malaysian FH [12,13,14,15]. However, most of these studies are small and focus only on either the LDLR or APOB gene. Lye and colleagues investigated 1536 single-nucleotide polymorphisms (SNPs) in 141 FH patients characterized by the Dutch Lipid Clinic Network criteria, and in 111 unrelated controls, and found that 14 SNPs were significantly associated with FH (high-risk: 11, low-risk: 3) [16]. Even then, causative variants were not detected in about 23.4% of FH patients [16], indicating that FH in these patients was caused by possible unknown genetic variants. Therefore, we aimed to comprehensively identify the mutational profiles of participants with hypercholesterolemia of Malay descent from the TMC study via whole-exome sequencing (WES). Subsequently, we validated the findings via genotyping and determined the genetic and non-genetic factors involved in hypercholesterolemia in these patients.
2. Materials and Methods
2.1. Sampling, Data Collection, and Study Design
Participants were selected from the TMC project, an ongoing nationwide prospective project that has recruited 106,527 Malaysians aged 35–70 years [3]. Sociodemographic and lifestyle information were collected via questionnaires and interviews, together with collection of the relevant biophysical and biochemical measurements. The nested case–control study design was used for the discovery phase (WES). Lipid profiles (total cholesterol (TC), LDL-C, triglyceride (TG), high-density lipoprotein cholesterol (HDL-C)) were determined on a Cobas Integra 800 analyzer (Roche Diagnostics, Germany). Based on the Simon Broome criteria, the cut-off points for hypercholesterolemia were 4.9 mmol/L for LDL-C and 7.5 mmol/L for TC. The LDL-C and TC levels were ranked, and 25 participants with the highest LDL-C/TC levels (denoted as HLDL) were selected as the case group. Twenty-five participants with the lowest levels of TC (<5.2 mmol/L) and LDL-C (2.6–3.4 mmol/L) [17] (denoted as LLDL) were selected. All participants were of Malay descent and could be traced back at least three generations. The other inclusion criteria were: (i) Malaysian citizenship; (ii) age 35–70 years; (iii) without debilitating illnesses at the time of the study; (iv) provided written informed consent. The study was approved by the Universiti Kebangsaan Malaysia (UKM) Research Ethics Committee (Ethics Number: FF-205-2007). The characteristics of the 25 HLDL and 25 LLDL participants are summarized in Supplementary Tables S1 and S2, respectively.
2.2. DNA Isolation and WES
DNA was isolated from 200 µL whole blood using a KingFisher™ Pure DNA Blood Kit (Thermo Fisher Scientific, Waltham, MA, USA) and KingFisher™ Duo system (Thermo Fisher Scientific) according to the manufacturer’s protocols. DNA was quantified with a Qubit™ Broad-Range DNA Quantification Kit (Invitrogen, Carlsbad, CA, USA). High-quality DNA (0.5–1.5 μg) was sheared into 150–250 bp fragments using a Covaris S2 ultrasonicator (American Laboratory Trading, East Lyme, CT, USA). WES was performed using an Ion P1 200 Sequencing Kit (Thermo Fisher Scientific) according to the manufacturer’s protocol. Enriched libraries were sequenced as single-end 150 bp reads on the Ion Proton™ system (Thermo Fisher Scientific).
2.3. Bioinformatics Data Analysis
Torrent Suite v4.0.2 (Thermo Fisher Scientific) was used for quality control metrics, including bead loading percentage, read length, percentage of alignment to the reference hg19, and total usable sequences. Base recalibration and duplicate removal were applied to the raw data sequence. We ensured that the raw data for each sample had at least 30× mean coverage and 20× coverage for at least 70% of the targeted regions. Germline mutations were detected at 50× coverage [18]. Variants were called using the Torrent Variant Caller plugin with default parameters for Germline Proton TargetSeq Low Stringency. All variants for each sample were annotated and filtered using ANNOVAR [19]. Variants were cross-referenced against the publicly available dbSNP 138, 1000 Genomes Project (April 2012 release), and Exome Sequencing Project databases. The variant effect on the protein structure was predicted using PolyPhen-2 [20] and SIFT [21]; all variants with tolerable effects were filtered out. The variants were classified using the knownGene annotation (University of California Santa Cruz); only variants in exonic regions were considered; synonymous SNPs were filtered out, and frameshift and stop-gain/stop-loss variants were shortlisted for downstream priority over non-synonymous SNPs and non-frameshift insertions/deletions (indels). Variants were also filtered based on whether they were in the FH genes. Tier 1 gene (LDLR, APOB, PCSK9, LDLRAP1) [5,6] variants were given higher priority over tier 2 and 3 gene variants [7,8]. All variants were assessed based on frequency in the HLDL and LLDL samples. Variants exclusively present in HLDL samples were identified as causative, whereas variants present only in the LLDL samples were classified as protective. The impact of these variants was assessed using in silico prediction tools: SIFT [21], PolyPhen-2 [20], MutationTaster [22], and FATHMM [23]. The clinical significance of all known variants was confirmed based on the ClinVar database (https://www.ncbi.nlm.nih.gov/clinvar (accessed on 23rd June 2021)). The WES data generated have been submitted to the National Center Biotechnology Information (NCBI) Sequence Read Archive (SRA) under accession number PRJNA607111.
2.4. Internal Validation of 45 Variants
In total, 27 variants that increased risk (Supplementary Table S3) and 18 variants that potentially reduced risk (Supplementary Table S4) were selected for replication in a larger sample size. Sample size was calculated assuming an additive model, perfect linkage disequilibrium between risk and marker, 80% power of study, and 47.7% prevalence of hypercholesterolemia [3]. For a genetic risk ratio of 14.78 (APOB rs12720762, minimum allele frequency [MAF] = 0.0056), the sample size needed was 22, while for genetic risk ratio of 1.77 (LDLR rs2569556, MAF = 0.190), the sample size needed was 184 [17]. We replicated the 45 variants in 677 participants (HLDL: 338, LLDL: 339). Similarly to the discovery phase, the participants were selected via nested case–control study design according to their TC and LDL-C levels. Genotyping was performed using an iPLEX® Gold kit on the MassARRAY® System (Agena Bioscience, San Diego, CA, USA) according to the manufacturer’s instructions. Data were analyzed using MassARRAY® Typer v4.0 (Agena Bioscience). Two researchers manually inspected the genotyping reports for all samples independently. The genotypes of low-intensity variants were confirmed using Sanger sequencing using a BigDye™ Terminator v1.1 Cycle Sequencing Kit (Thermo Fisher Scientific) according to the manufacturer’s recommendations. The sequencing data were analyzed using Basic Local Alignment Search Tool (BLAST, http://blast.ncbi.nlm.nih.gov (accessed on 3 June 2020).
2.5. Statistical Analyses
Descriptive analysis for categorical data is reported as the frequency (n) and percentage (%). Continuous data are described as the mean and standard deviation (SD). Logistic regression modelling was initially performed to identify the association between hypercholesterolemia and individual genes or each environmental risk factor. To produce the most parsimonious model, variables showing no evidence of association (at p < 0.20) were removed, provided that the removal of the variable produced no substantive changes in the model. Predictive utility and gene–environment (i.e., genetic–non-genetic) interaction were assessed using the variables remaining in the final model. Using the final multivariate model, we estimated the increment in variance explained resulting from adding the genetic variants (risk-increasing or -decreasing) to the model that included non-genetic risk factors only. The risk explained by the risk factors was estimated using Nagelkerke’s pseudo R2. Based on the final model for each group, we calculated the area under the receiver operating characteristic (AUROC) curve and its 95% confidence interval (95% CI). These statistics measure logistic models’ predictive power and goodness-of-fit. They represent the accuracy with which a model can differentiate between two outcome categories, and thus measure the model’s potential diagnostic utility. An ideal test has an area under the curve (AUC) of 1, whereas random guessing would produce an AUC of 0.5. AUC ≥ 0.8 are often considered clinically useful. We assessed the multiplicative interaction between individual SNPs and non-genetic risk factors using logistic regression. All statistical analyses were performed with SPSS 20 (SPSS Inc., Chicago, IL, USA).
3. Results
3.1. Demographic Data and Non-Genetic Risk Factors Associated with Hypercholesterolemia
Table 1 shows the univariable analysis results of the clinical factors associated with hypercholesterolemia in Malays. The data were collected from the internal validation phase (n = 677). Age at baseline, fasting blood glucose, ever-use of tobacco products, diabetes mellitus (DM) with medication, and family history of hyperlipidemia were associated with increased hypercholesterolemia risk. The mean age at baseline of the HLDL participants was 53.36 (SD 6.36) years compared to the 51.63 (SD 6.46) years of the LLDL participants (p = 0.001). HLDL participants had higher fasting blood glucose [7.15 (SD 3.62) mg/L)] compared to LLDL participants [6.51 (SD 2.79) mg/L)] (p = 0.012). The use of tobacco products increased hypercholesterolemia risk by 1.66 times (p = 0.005). Interestingly, type 2 DM patients with metformin treatment had 38% reduced hypercholesterolemia risk (p = 0.015). Participants with a family history of hyperlipidemia had 2.44 times increased hypercholesterolemia risk (p = 0.028) compared to participants without a family history of hypercholesterolemia. There were no differences in body mass index (BMI), sex distribution, history of stroke, heart failure, obesity with medication, hypertension with medication, family history of hypertension, hyperlipidemia, heart disease, DM, and CVD between the HLDL and LLDL groups.

Table 1.
Univariable analysis of the clinical factors associated with HLDL versus LLDL from the internal validation cohort.
3.2. WES Identification of Risk-Increasing and -Reducing Variants
The mean depth of WES for the 50 samples sequenced was 79.19×, with 87.64% of the exome covered at ≥20×. Figure 1 shows the statistics for the coverage of each sample. All samples passed the minimum 30× mean coverage, and 70% of the target regions were covered at 20× after we had removed duplicates. We identified five novel variations among the tier 1 genes: four frameshift deletions (LDLR: 1, PCSK9: 1, LDLRAP1: 2) and one non-frameshift substitution in PCSK9. In addition, 11 known variants were identified (non-synonymous mutations: four in APOB (rs376602710, rs1333175181, rs746414462, rs533617), six in LDLR (rs760436036, rs879254597, rs773658037, rs879254424, rs144172724, rs368708058), one in PCSK9 (rs794728683)) (Table 2). These variants were identified only in the HLDL participants, suggesting that hypercholesterolemia in these patients could be due to genetic factors. Impact prediction of non-synonymous single-nucleotide variants at protein level revealed that seven mutations were damaging (APOB: p.A467G, p.T1222I, p.R1599H, p.H1923R; PCSK9: p.R215H; LDLR: p.E58G and p.E101K) and four were possibly damaging or tolerated. Based on the ClinVar database, five variants were pathogenic/likely pathogenic, two variants had conflicting pathogenicity, one variant was of uncertain significance, and one variant was benign/likely benign. Table 2 lists the variants identified in the tier 1 genes. Only 13 of the 25 HLDL participants carried tier 1 variants, and the number of samples per variant was relatively small.
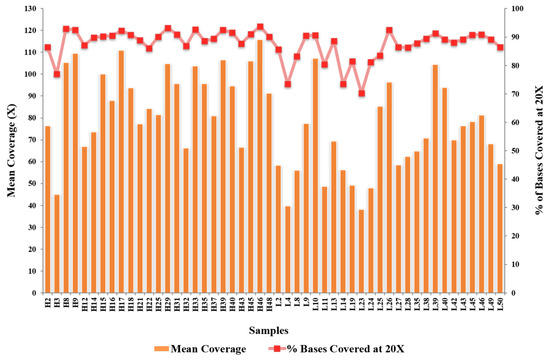
Figure 1.
The statistics for the coverage of each sample.
Table 2.
The tier-1 variants in Malaysian Malays with hypercholesterolemia detected via WES.
We identified 76 risk-increasing variants in 25 tier 2 genes (Supplementary Table S5). In total, there were 65 novel variants and 11 known variants. The most common variants were in the NYNRIN, CELSR2, PARP10, MAF1, and OSBPL7 (oxysterol-binding protein-like 7) genes (Table 3). These tier 2 genes are not directly implicated in FH, but are associated with LDL regulation and can affect the expression of the LDL-regulating genes. Hypercholesterolemia in these patients could be due to polygenic traits with non-genetic risk factor influences. We analyzed the risk-increasing variants among the tier 3 genes. There were 56 high-frequency variants in the HLDL group (>10 individuals/variant, ≥40%; these variants were not observed in the LLDL group) (Supplementary Table S6). Interestingly, 14 variants (novel: 11, known: 3) had very high-frequency samples per variant (15–19 or 60–76%) (Table 4). Similarly to the tier 2 gene variants, hypercholesterolemia in the patients with tier 3 gene variants could be due to polygenic traits with non-genetic risk factor influences.
Table 3.
The most common tier 2 variants.
Table 4.
The most common tier 3 variants identified.
We also identified 108 risk-reducing variants from 40 genes. There were 17 variants (eight novel and nine known tier 1 protective variants: APOB: 9, LDLR: 1, LDLRAP1: 1, PCSK9: 5) (Supplementary Table S7). Sixty-two tier 2 variants (novel: 19, known: 43) were identified in 10 genes: CELSR2, DCPS, GPAA1, LPA, MAF1, NYNRIN, OPLAH, OSBPL7, PARP10, and SPATC1 (Supplementary Table S8). In tier 3 genes, 23 variants (novel: 17, known: 6) were identified in 23 genes (Supplementary Table S9). Figure 2a,b illustrate the circus plot of the risk-increasing and -reducing variants identified through WES.
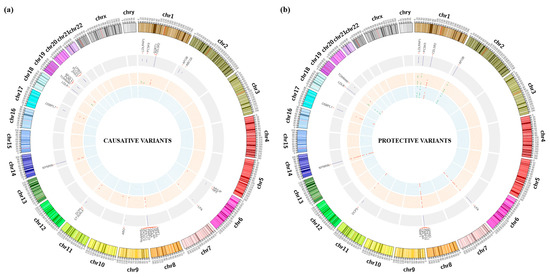
Figure 2.
(a,b) Circus plot of the risk-increasing and -reducing variants identified through WES.
3.3. Variants and Association with Hypercholesterolemia Risk in Malaysian Malays
As both the HLDL and LLDL groups had relatively low prevalence of variants, we performed an internal validation study involving 677 participants. Table 5 shows the significant variants associated with HLDL in Malays. The OSBPL7 variant c.651_652del: p.217_218del was associated with 16.89 times higher odds for hypercholesterolemia (p < 0.001). The PCSK9 rs151193009 (c.C277T: p.R93C) variant was associated with low odds for hypercholesterolemia (p = 0.001).
Table 5.
Univariable analysis of SNPs associated with HLDL versus LLDL.
3.4. Hypercholesterolemia Predictive Models Combining Genetic and Non-Genetic Risk Factors
In all three final models, age, fasting blood glucose, and type 2 diabetes on medication were associated with HLDL (Table 6). Participants who were 5 years older had 1.28–1.34 higher odds (odds ratio (OR): 1.055–1.065) for HLDL compared to participants who were 5 years younger. Participants with fasting blood sugar levels higher by 5 mmol/L had approximately two times higher odds (OR: 1.16–1.18) for HLDL. All three models also estimated that diabetic participants on medication had low odds for HLDL. Model 1, which consisted of the non-genetic factors, only explained 11% of the variation in the outcome of HLDL (Nagelkerke’s R2 = 0.11), with an AUC of 0.68 (95% CI: 0.64, 0.72).
Table 6.
Multiple logistic regression models of factors associated with HLDL.
In Model 2, participants with a family history of hyperlipidemia had three times higher odds for HLDL (OR: 3.30; 95% CI: 1.44, 7.56). Participants with the novel variant OSBPL7: c.651_652del: p.217_218del had almost 17 times higher odds for high HLDL compared to participants with the wild-type genotype. Incorporating this variant in Model 2 increased the ability of the model to explain the variation of having HLDL to 20.3% [AUC = 0.73 (95% CI: 0.69, 0.77)].
In Model 3, participants with the CT genotype in PCSK9 rs151193009 had low odds (OR: 0.12; 95% CI: 0.03, 0.42) for HLDL compared to participants with the C genotype. Combining this variant with the non-genetic risk factors slightly increased the chances of HLDL to 14.3% [AUC = 0.69 (95% CI: 0.65, 0.74)]. There was no evidence of gene–environment (i.e., genetic–non-genetic) interaction between individual SNPs and each non-genetic risk factor.
These risk factors for hypercholesterolemia differ slightly between males and females (Supplementary Table S10). In males, history of tobacco use significantly increased risk of hypercholesterolemia by 1.9 times (OR: 1.90; 95% CI: 1.06, 3.37) while those who had diabetes with medication hade 57% reduced risk of hypercholesterolemia (OR: 0.43; 95% CI: 0.24, 0.79), while in females, the factors that increased risk of hypercholesterolemia were age, fasting blood glucose, history of tobacco use, and hyperlipidemia with medication. Similarly in males, diabetes with medication also reduced the risk of hypercholesterolemia in females. For the genetic risk factors, T2FH_OSBPL7_01 increased risk of hypercholesterolemia, while rs151193009 reduced the risk in both males and females. In addition, T2FH_SPATC1_01 reduced the risk of hypercholesterolemia only in males (Supplementary Table S11).
4. Discussion
In the present study, we identified the genetic and non-genetic risk factors associated with hypercholesterolemia in Malaysian Malays. In total, four of the 18 environmental factors analyzed were associated with increased LDL: age, tobacco use, fasting blood glucose level, and family history of hyperlipidemia, which is consistent with studies on other populations [24]. We identified a novel OSBPL7 (c.651_652del) variant that increased the risk for hypercholesterolemia by 17 times. Patients with type 2 DM on medication and those with the PCSK9 rs151193009 variant showed reduced risk of hypercholesterolemia. The combination of age, tobacco use, fasting blood glucose level, and family history of hyperlipidemia with OSBPL7 c.651_652del increased the hypercholesterolemia risk from 11% to 20.3%. Recent studies showed that Malaysian Malays have the highest prevalence of elevated triglycerides and LDL-C in Malaysia [25], and are the second-ranked ethnicity with a high risk of developing cardiovascular disease (CVD) [26]. Importantly, ethnic Malays are the major contributor to the statistics of familial hypercholesterolemia (FH) [27], suggesting a higher influence of genetics on hypercholesterolemia in Malays. By incorporating the variants specific to Malays, these findings could form the basis for early genetic screening of hypercholesterolemia in Malaysia to reduce the morbidity and mortality from related cardiovascular complications.
We also showed that age, tobacco use, fasting blood glucose level, and family history of hyperlipidemia increased hypercholesterolemia risk in Malays. Older age is often associated with elevated levels of circulating lipids including LDL-C [28]. One explanation is the change in the lipolysis in adipocytes, in which the reduction of catecholamines and hormone-sensitive lipase by aging causes the adipocytes to reduce their uptakes of the circulating lipids for the storage [29]. Another is the aging-related change in the lipid synthesis pathways (lipolysis, lipid metabolism and lipid transport), in which aging reduces the capacity of the skeletal muscles to oxidize and metabolize the circulating lipids for energy [30]. The hepatic lipid metabolism is also shifted due to aging, whereby lipid synthesis is increased, and fatty acid oxidation is decreased, thus accumulating the lipid particles in the organ [31]. These changes in the metabolic rates subsequently cause increased HDL, LDL, and TG levels [24]. Moreover, aging also increases reactive oxidative species and reduces cellular antioxidant capacity, which leads to increased oxidative stress [32]. This activates 3-hydroxy-3-methylglutaryl–coenzyme A (HMG-CoA) reductase, which increases cholesterol synthesis and LDL-C levels by downregulating LDLR synthesis [32]. However, LDL-C levels also decrease at the age of 50–59 years, possibly due to the low ACAT2 (acetyl-CoA acetyltransferase 2) activity that causes lower very-LDL-C (VLDL-C) secretion and LDL-C production [32,33]. In the present study, patients with high fasting blood glucose or diabetes were more likely to have hypercholesterolemia. The presence of insulin resistance contributes to the dysregulation of lipid metabolism [34]. Thus, the use of diabetes medication such as metformin will likely improve LDL-C levels [35]. Metformin intake reduces blood LDL-C levels by activating adenosine monophosphate (AMP)-activated protein kinase and can suppress fatty acid desaturase (FADS) action [35]. Another hypercholesterolemia risk factor is family history of hyperlipidemia, which increases the risk for developing FH [7]. In the present study, only one lifestyle factor, i.e., tobacco consumption, was associated with higher hypercholesterolemia risk. Tobacco smoking is a known CVD risk factor and is associated with higher serum cholesterol, TG, and LDL-C levels [36]. Nicotine stimulates the production of adrenaline and causes higher serum concentrations of free fatty acids, further inducing hepatic regulation and cholesterol, VLDL, and TG production [36]. All of our non-genetic risk factors were also present in the other populations with high prevalence of hypercholesterolemia. For the Singaporean multi-ethnic population with 52.2% prevalence of hypercholesterolemia, the risk factors are the low education ≤6 years, current smokers, and blue-collar jobs or unemployment with greater unawareness of hypercholesterolemia [37]. In this study [37], the ethnic Malays had the highest risk factors, including for the prevalence of diabetes and hypertension. In another study in Thailand, the prevalence of hypercholesterolemia was 66.5% [38,39]. The regression analysis confirmed that the risk factors included older age, history of alcohol consumption, and family history of dyslipidemia [38,39]. In another Malay ethnic-majority country, Indonesia, the prevalence of hypercholesterolemia is 49.5%, and reported risk factors include the inadequate level of physical activity and smoking [40]. From these findings, the Malays in our study had risk factors in concordance with previous publications, and additional fasting blood glucose observed in our study may be due to the additional measurement that was made in our study but was missing in the other publications.
We identified 12 novel risk-increasing variants in tier 1 genes (APOB, LDLR, LDLRAP1, PCSK9). As mutations in FH genes are usually ethnicity-specific, the variants might occur in only Malays, but this observation requires validation in other ethnic groups. Four known variants were also identified: rs376602710, rs533617, rs144172724, and rs368708058 [41]. rs376602710 is a missense mutation with uncertain significance in familial hypobetalipoproteinemia (FHBL) and in FH. rs533617 is a missense variant that has been observed in several conditions, including hypercholesterolemia autosomal dominant type B, FH, and FHBL. Interpretations of its pathogenicity are conflicting; therefore, its role in hypercholesterolemia is unknown. rs144172724 is pathogenic and has been identified in patients with FH in Finland, the Netherlands, and France [42]. rs368708058 has been identified in patients with FH in the UK and the Netherlands [41]. The pathogenicity of this mutation is uncertain.
In the present study, 48% of the participants could be classified as probable/possible FH based on the Simon Broome criteria or as monogenic FH. Surprisingly, 13 participants (52%) did not have mutations in the FH-related tier 1 genes, suggesting polygenic inheritance. Hypercholesterolemia in patients with tier 2 or 3 gene variants could be due to polygenic traits with non-genetic risk factor influences. We identified 76 risk-increasing variants in 25 tier 2 genes, and the most common variants were in the NYNRIN, CELSR2, PARP10, MAF1, and OSBPL7 genes. The tier 3 genes had a high frequency of variants (n = 15–19). Most of the tier 3 variants were novel, and only three variants, i.e., rs11243045, rs71557212, and rs1670534, had been identified previously [43]. However, the association of these tier 3 variants with hypercholesterolemia remains unknown. Despite that, these tier 3 variants were only identified in the HLDL participants and not among the LLDL group; thus, we postulate that they could play an important role in lipid metabolism in Malays with hypercholesterolemia.
Internal validation of the selected 45 variants in 677 Malay participants with hypercholesterolemia showed that a novel variant in OSBPL7 (c.651_652del) increases hypercholesterolemia risk by 17 times. Overexpression of the OSBPL7 gene can affect serum LDL and TG levels and hepatic TG synthesis [44]. This is possible via SREBP1C (sterol regulatory element–binding protein 1C) [44], a major regulator of lipogenesis. This OSBPL7 variant is the first to be associated with hypercholesterolemia, particularly in Malays. Furthermore, the combination of age, tobacco use, fasting blood glucose level, and family history of hyperlipidemia with the presence of OSBPL7 c.651_652del increased the hypercholesterolemia risk by 8.3%. Our study indicates that the OSBPL7 variant might have greater genetic effects on Malay patients. Further studies are needed to understand the role of OSBPL7 in lipid metabolism. The limitation of this study was the validation cohort. We used the same cohort in TMC project because the number of hypercholesterolemia patients in our biobank was insufficient for validation. We are currently recruiting samples of FH patients from the Hospital Chancellor Tuanku Muhriz obesity clinic. We hope to be able to validate these findings in the clinical samples in our future study.
Several variants that can reduce the risk of developing hypercholesterolemia were also identified from the LLDL group. In total, 139 were novel, whereas 120 were known; the most common protective variants were identified in the CELSR2, LPA, NYNRIN, OPLAH, PARP10, PCSK9, and SPATC1 genes. PCSK9 rs151193009 reduced hypercholesterolemia risk in Malays, consistent with previous findings on the protectiveness of this variant against high LDL-C and coronary artery disease risk in Asians only [45,46]. PCSK9 is a serine protease that regulates LDLR levels by degradation, and the rs151193009 variant causes PCSK9 loss of function, which in return increases hepatic LDLR expression. Consequently, there is greater removal of cholesterol-rich LDL particles from the plasma [47].
5. Conclusions
We have identified the genetic variants associated with hypercholesterolemia risk in Malaysian Malays. Non-genetic risk factors such as age, fasting blood glucose level, history of use of tobacco products, and family history of hyperlipidemia are also associated with hypercholesterolemia. A panel of hypercholesterolemia-associated variants in Malays could be developed for early diagnosis of FH and family screening. Identifying the variants associated with hypercholesterolemia may aid individual risk stratification for hypercholesterolemia for early intervention and disease management.
Supplementary Materials
The following supporting information can be downloaded at: https://www.mdpi.com/article/10.3390/genes14030721/s1, Table S1. Summary of the 25 hypercholesterolemic (HLDL) individuals for whole-exome sequencing. Based on the Simon Broome’s criteria, the cut-off point for hypercholesterolemia are the low-density lipoprotein C (LDL-C) level (>4.9 mmol/L and total cholesterol (TC) level (>7.5 mmol/L); Table S2. Summary of the 25 normal (LLDL) individuals for whole-exome sequencing. Based on the Simon Broome’s criteria, the cut-off point for hypercholesterolemia are the low-density lipoprotein C (LDL-C) level (<5.2 mmol/L and total cholesterol (TC) level (2.6–3.4 mmol/L); Table S3. Summary of the 27 causative variants that were chosen for validation in 677 individuals; Table S4. Summary of the 18 protective variants that were chosen for validation in 677 individuals; Table S5. Summary of the 76 causative variants in 25 of tier-2 genes identified from whole-exome sequencing; Table S6. Summary of the 56 causative variants in 54 of tier-3 genes identified from whole-exome sequencing; Table S7. Summary of the 17 protective variants in tier-1 genes identified from whole-exome sequencing; Table S8. Summary of the 62 protective variants in 10 tier-2 genes identified from whole-exome sequencing; Table S9. Summary of the 23 protective variants in 23 tier-3 genes identified from whole-exome sequencing; Table S10. Multiple logistic regression models of non-genetic risk factors associated with HLDL in males and females; Table S11. Multiple logistic regression models of genetic risk factors associated with HLDL in males and females.
Author Contributions
Conceptualization of study, performed genotyping using MassARRAY® System, data analysis of causative and protective variants, and wrote the first draft of the manuscript, N.A.A.M.; performed WES experiment and data analysis, Y.M.N.; assisted in operating the MassARRAY® System for validation, Z.Z.M.R.; performed data analysis on the protective variants genotyping and performed Sanger sequencing for validation, S.A.S.; performed data analysis on the causative variants genotyping, Y.P.C.; performed statistical analysis, N.A. (Noraidatulakma Abdullah); performed statistical analysis and wrote the first draft (results on environmental factors) N.A. (Norfazilah Ahmad); isolated DNA and assessed DNA quality and purity, N.I. and N.A.J.; assisted with the samples and data recruitment and collection, M.A.K.; assisted with the MassARRAY® System for validation and wrote the first draft (discussion of environmental factors), A.A.S.; conceptualization of study, funding acquisition, reviewed and edited the manuscript, R.J. All authors have read and agreed to the published version of the manuscript.
Funding
This work was supported by a top-down grant from the National Biotechnology Division of the MALAYSIAN MINISTRY OF SCIENCE, TECHNOLOGY AND INNOVATION (MOSTI, ER-05-01-02-MEB001). The Malaysia Genome Institute, MOSTI, administers the grant. Additional funding, including infrastructure and utilities, was provided by UKM.
Institutional Review Board Statement
The study was conducted according to the guidelines of the Declaration of Helsinki. This study was approved by the Universiti Kebangsaan Malaysia (UKM) Research Ethics Committee (Ethics Number: FF-205-2007).
Informed Consent Statement
Informed consent was obtained from all subjects involved in the study.
Data Availability Statement
The WES data generated in this study have been submitted to the NCBI SRA under accession number PRJNA607111 (https://www.ncbi.nlm.nih.gov/bioproject/?term=PRJNA607111 (accessed on 17 Feburary 2020).
Acknowledgments
We thank all members of TMC Study Group, UKM Medical Molecular Biology Institute (UMBI) staff, and the participants. We also thank the community leaders and officers from the local authorities who assisted in participant recruitment.
Conflicts of Interest
The authors declare no conflict of interest.
References
- Wong, B.; Kruse, G.; Kutikova, L.; Ray, K.K.; Mata, P.; Bruckert, E. Cardiovascular Disease Risk Associated with Familial Hypercholesterolemia: A Systematic Review of the Literature. Clin. Ther. 2016, 38, 1696–1709. [Google Scholar] [CrossRef] [PubMed]
- Institute for Public Health. National Health & Morbidity Survey 2015 (NHMS 2015); Institute for Public Health: Putrajaya, Malaysia, 2015. [Google Scholar]
- Jamal, R.; Syed Zakaria, S.Z.; Kamaruddin, M.A.; Abd Jalal, N.; Ismail, N.; Mohd Kamil, N.; Abdullah, N.; Baharudin, N.; Hussin, N.H.; Othman, H.; et al. Cohort Profile: The Malaysian Cohort (TMC) Project: A Prospective Study of Non-Communicable Diseases in a Multi-Ethnic Population. Int. J. Epidemiol. 2015, 44, 423–431. [Google Scholar] [CrossRef] [PubMed]
- Karr, S. Epidemiology and Management of Hyperlipidemia. Am. J. Manag. Care 2017, 23, S139–S148. [Google Scholar] [PubMed]
- Sharifi, M.; Futema, M.; Nair, D.; Humphries, S.E. Genetic Architecture of Familial Hypercholesterolaemia. Curr. Cardiol. Rep. 2017, 19, 44. [Google Scholar] [CrossRef]
- Garcia, C.K.; Wilund, K.; Arca, M.; Zuliani, G.; Fellin, R.; Maioli, M.; Calandra, S.; Bertolini, S.; Cossu, F.; Grishin, N.; et al. Autosomal Recessive Hypercholesterolemia Caused by Mutations in a Putative LDL Receptor Adaptor Protein. Science 2001, 292, 1394–1398. [Google Scholar] [CrossRef]
- Teslovich, T.M.; Musunuru, K.; Smith, A.v.; Edmondson, A.C.; Stylianou, I.M.; Koseki, M.; Pirruccello, J.P.; Ripatti, S.; Chasman, D.I.; Willer, C.J.; et al. Biological, Clinical and Population Relevance of 95 Loci for Blood Lipids. Nature 2010, 466, 707–713. [Google Scholar] [CrossRef]
- Willer, C.J.; Schmidt, E.M.; Sengupta, S.; Peloso, G.M.; Gustafsson, S.; Kanoni, S.; Ganna, A.; Chen, J.; Buchkovich, M.L.; Mora, S.; et al. Discovery and Refinement of Loci Associated with Lipid Levels. Nat. Genet. 2013, 45, 1274–1283. [Google Scholar] [CrossRef]
- Soutar, A.K. Rare Genetic Causes of Autosomal Dominant or Recessive Hypercholesterolaemia. IUBMB Life 2010, 62, 125–131. [Google Scholar] [CrossRef]
- Leigh, S.; Futema, M.; Whittall, R.; Taylor-Beadling, A.; Williams, M.; den Dunnen, J.T.; Humphries, S.E. The UCL Low-Density Lipoprotein Receptor Gene Variant Database: Pathogenicity Update. J. Med. Genet. 2017, 54, 217–223. [Google Scholar] [CrossRef]
- Khoo, K.L. Hereditary Hyperlipidemia in Malaysia: A Historical Perspective of Six Decade of Research and Treatment. Med. J. Malays. 2014, 69, 57–59. [Google Scholar]
- Al-Khateeb, A.R.; Sapawi Mohd, M.; Yusof, Z.; Zilfalil, B.A. Molecular Description of Familial Defective APOB-100 in Malaysia. Biochem. Genet. 2013, 51, 811–823. [Google Scholar] [CrossRef]
- Al-Khateeb, A.; Zahri, M.K.; Mohamed, M.S.; Sasongko, T.H.; Ibrahim, S.; Yusof, Z.; Zilfalil, B.A. Analysis of Sequence Variations in Low-Density Lipoprotein Receptor Gene among Malaysian Patients with Familial Hypercholesterolemia. BMC Med. Genet. 2011, 12, 40. [Google Scholar] [CrossRef]
- Azian, M.; Hapizah, M.N.; Khalid, B.A.K.; Khalid, Y.; Rosli, A.; Jamal, R. Use of the Denaturing Gradient Gel Electrophoresis (DGGE) Method for Mutational Screening of Patients with Familial Hypercholesterolaemia (FH) and Familial Defective Apolipoprotein B100 (FDB). Malays. J. Pathol. 2006, 28, 7–15. [Google Scholar]
- Khoo, K.L.; van Acker, P.; Tan, H.; Deslypere, J.P. Genetic Causes of Familial Hypercholesterolaemia in a Malaysian Population. Med. J. Malays. 2000, 55, 409–418. [Google Scholar]
- Lye, S.-H.; Chahil, J.K.; Bagali, P.; Alex, L.; Vadivelu, J.; Ahmad, W.A.W.; Chan, S.-P.; Thong, M.-K.; Zain, S.M.; Mohamed, R. Genetic Polymorphisms in LDLR, APOB, PCSK9 and Other Lipid Related Genes Associated with Familial Hypercholesterolemia in Malaysia. PLoS ONE 2013, 8, e60729. [Google Scholar] [CrossRef]
- National Institues of Health. ATP III At-A-Glance: Quick Desk Reference; National Cholesterol Education Program; NIH Publication: Bethesda, MD, USA, 2001. [Google Scholar]
- Do, R.; Kathiresan, S.; Abecasis, G.R. Exome Sequencing and Complex Disease: Practical Aspects of Rare Variant Association Studies. Hum. Mol. Genet. 2012, 21, R1–R9. [Google Scholar] [CrossRef]
- Wang, K.; Li, M.; Hakonarson, H. ANNOVAR: Functional Annotation of Genetic Variants from High-Throughput Sequencing Data. Nucleic Acids Res. 2010, 38, e164. [Google Scholar] [CrossRef]
- Adzhubei, I.; Jordan, D.M.; Sunyaev, S.R. Predicting Functional Effect of Human Missense Mutations Using PolyPhen-2. Curr. Protoc. Hum. Genet. 2013, 76, 7.20.1–7.20.41. [Google Scholar] [CrossRef]
- Kumar, P.; Henikoff, S.; Ng, P.C. Predicting the Effects of Coding Non-Synonymous Variants on Protein Function Using the SIFT Algorithm. Nat. Protoc. 2009, 4, 1073–1081. [Google Scholar] [CrossRef]
- Schwarz, J.M.; Rödelsperger, C.; Schuelke, M.; Seelow, D. MutationTaster Evaluates Disease-Causing Potential of Sequence Alterations. Nat. Methods 2010, 7, 575–576. [Google Scholar] [CrossRef]
- Shihab, H.A.; Gough, J.; Cooper, D.N.; Stenson, P.D.; Barker, G.L.A.; Edwards, K.J.; Day, I.N.M.; Gaunt, T.R. Predicting the Functional, Molecular, and Phenotypic Consequences of Amino Acid Substitutions Using Hidden Markov Models. Hum. Mutat. 2013, 34, 57–65. [Google Scholar] [CrossRef] [PubMed]
- Uranga, R.M.; Keller, J.N. Diet and Age Interactions with Regards to Cholesterol Regulation and Brain Pathogenesis. Curr. Gerontol. Geriatr. Res. 2010, 2010, 219683. [Google Scholar] [CrossRef] [PubMed]
- Mohamed-Yassin, M.-S.; Baharudin, N.; Daher, A.M.; Abu Bakar, N.; Ramli, A.S.; Abdul-Razak, S.; Mohamed Noor Khan, N.-A.; Mohamad, M.; Yusoff, K. High Prevalence of Dyslipidaemia Subtypes and Their Associated Personal and Clinical Attributes in Malaysian Adults: The REDISCOVER Study. BMC Cardiovasc. Disord. 2021, 21, 149. [Google Scholar] [CrossRef] [PubMed]
- Thangiah, N.; Su, T.T.; Chinna, K.; Jalaludin, M.Y.; Mohamed, M.N.A.; Majid, H.A. Longitudinal Assessment between Lifestyle-Related Risk Factors and a Composite Cardiovascular Disease (CVD) Risk Index among Adolescents in Malaysia. Sci. Rep. 2021, 11, 19135. [Google Scholar] [CrossRef]
- Chua, Y.-A.; Razman, A.Z.; Ramli, A.S.; Mohd Kasim, N.A.; Nawawi, H. Familial Hypercholesterolaemia in the Malaysian Community: Prevalence, Under-Detection and Under-Treatment. J. Atheroscler. Thromb. 2021, 28, 57026. [Google Scholar] [CrossRef]
- Chung, K.W. Advances in Understanding of the Role of Lipid Metabolism in Aging. Cells 2021, 10, 880. [Google Scholar] [CrossRef]
- Spitler, K.M.; Davies, B.S.J. Aging and Plasma Triglyceride Metabolism. J. Lipid Res. 2020, 61, 1161–1167. [Google Scholar] [CrossRef]
- Toth, M.; Tchernof, A. Lipid Metabolism in the Elderly. Eur. J. Clin. Nutr. 2000, 54, S121–S125. [Google Scholar] [CrossRef]
- Kuhla, A.; Blei, T.; Jaster, R.; Vollmar, B. Aging Is Associatedwith a Shift of Fatty Metabolism Toward Lipogenesis. J. Gerontol. A Biol. Sci. Med. Sci. 2011, 66A, 1192–1200. [Google Scholar] [CrossRef]
- Mc Auley, M.T.; Mooney, K.M. LDL-C Levels in Older People: Cholesterol Homeostasis and the Free Radical Theory of Ageing Converge. Med.. Hypotheses 2017, 104, 15–19. [Google Scholar] [CrossRef]
- Ravnskov, U.; Diamond, D.M.; Hama, R.; Hamazaki, T.; Hammarskjöld, B.; Hynes, N.; Kendrick, M.; Langsjoen, P.H.; Malhotra, A.; Mascitelli, L.; et al. Lack of an Association or an Inverse Association between Low-Density-Lipoprotein Cholesterol and Mortality in the Elderly: A Systematic Review. BMJ Open 2016, 6, e010401. [Google Scholar] [CrossRef]
- Vergès, B. Pathophysiology of Diabetic Dyslipidaemia: Where Are We? Diabetologia 2015, 58, 886–899. [Google Scholar] [CrossRef]
- Xu, T.; Brandmaier, S.; Messias, A.C.; Herder, C.; Draisma, H.H.M.; Demirkan, A.; Yu, Z.; Ried, J.S.; Haller, T.; Heier, M.; et al. Effects of Metformin on Metabolite Profiles and LDL Cholesterol in Patients with Type 2 Diabetes. Diabetes Care 2015, 38, 1858–1867. [Google Scholar] [CrossRef]
- Lakshmi, S.A. Effect of Intensity of Cigarette Smoking on Haematological and Lipid Parameters. J. Clin. Diagn. Res. 2014, 8, BC11–BC13. [Google Scholar] [CrossRef]
- Man, R.E.K.; Gan, A.H.W.; Fenwick, E.K.; Gan, A.T.L.; Gupta, P.; Sabanayagam, C.; Tan, N.; Wong, K.H.; Wong, T.Y.; Cheng, C.-Y.; et al. Prevalence, Determinants and Association of Unawareness of Diabetes, Hypertension and Hypercholesterolemia with Poor Disease Control in a Multi-Ethnic Asian Population without Cardiovascular Disease. Popul. Health Metr. 2019, 17, 17. [Google Scholar] [CrossRef]
- Aekplakorn, W.; Taneepanichskul, S.; Kessomboon, P.; Chongsuvivatwong, V.; Putwatana, P.; Sritara, P.; Sangwatanaroj, S.; Chariyalertsak, S. Prevalence of Dyslipidemia and Management in the Thai Population, National Health Examination Survey IV, 2009. J. Lipids 2014, 2014, 249584. [Google Scholar] [CrossRef]
- Le, D.; Garcia, A.; Lohsoonthorn, V.; Williams, M.A. Prevalence and Risk Factors of Hypercholesterolemia among Thai Men and Women Receiving Health Examinations. Southeast Asian J. Trop. Med. Public Health 2006, 37, 1005–1014. [Google Scholar]
- Febriani, D.; Febriani, B. The Effect of Lifestyle on Hypercholesterolemia. Open Public Health J. 2018, 11, 526–532. [Google Scholar] [CrossRef]
- Landrum, M.J.; Lee, J.M.; Riley, G.R.; Jang, W.; Rubinstein, W.S.; Church, D.M.; Maglott, D.R. ClinVar: Public Archive of Relationships among Sequence Variation and Human Phenotype. Nucleic Acids Res. 2014, 42, D980–D985. [Google Scholar] [CrossRef]
- Koivisto, U.M.; Viikari, J.S.; Kontula, K. Molecular Characterization of Minor Gene Rearrangements in Finnish Patients with Heterozygous Familial Hypercholesterolemia: Identification of Two Common Missense Mutations (Gly823-->Asp and Leu380-->His) and Eight Rare Mutations of the LDL Receptor Gene. Am. J. Hum. Genet. 1995, 57, 789–797. [Google Scholar]
- Zerbino, D.R.; Achuthan, P.; Akanni, W.; Amode, M.R.; Barrell, D.; Bhai, J.; Billis, K.; Cummins, C.; Gall, A.; Girón, C.G.; et al. Ensembl 2018. Nucleic Acids Res. 2018, 46, D754–D761. [Google Scholar] [CrossRef] [PubMed]
- Yan, D.; Lehto, M.; Rasilainen, L.; Metso, J.; Ehnholm, C.; Ylaä-Herttuala, S.; Jauhiainen, M.; Olkkonen, V.M. Oxysterol Binding Protein Induces Upregulation of SREBP-1c and Enhances Hepatic Lipogenesis. Arterioscler. Thromb. Vasc. Biol. 2007, 27, 1108–1114. [Google Scholar] [CrossRef] [PubMed]
- Tang, C.S.; Zhang, H.; Cheung, C.Y.Y.; Xu, M.; Ho, J.C.Y.; Zhou, W.; Cherny, S.S.; Zhang, Y.; Holmen, O.; Au, K.-W.; et al. Exome-Wide Association Analysis Reveals Novel Coding Sequence Variants Associated with Lipid Traits in Chinese. Nat. Commun. 2015, 6, 10206. [Google Scholar] [CrossRef]
- Auton, A.; Abecasis, G.R.; Altshuler, D.M.; Durbin, R.M.; Abecasis, G.R.; Bentley, D.R.; Chakravarti, A.; Clark, A.G.; Donnelly, P.; Eichler, E.E.; et al. A Global Reference for Human Genetic Variation. Nature 2015, 526, 68–74. [Google Scholar] [CrossRef] [PubMed]
- Schulz, R.; Schlüter, K.-D.; Laufs, U. Molecular and Cellular Function of the Proprotein Convertase Subtilisin/Kexin Type 9 (PCSK9). Basic Res. Cardiol. 2015, 110, 4. [Google Scholar] [CrossRef] [PubMed]
Disclaimer/Publisher’s Note: The statements, opinions and data contained in all publications are solely those of the individual author(s) and contributor(s) and not of MDPI and/or the editor(s). MDPI and/or the editor(s) disclaim responsibility for any injury to people or property resulting from any ideas, methods, instructions or products referred to in the content. |
© 2023 by the authors. Licensee MDPI, Basel, Switzerland. This article is an open access article distributed under the terms and conditions of the Creative Commons Attribution (CC BY) license (https://creativecommons.org/licenses/by/4.0/).