
Proteome Dynamics Analysis Reveals the Potential Mechanisms of Salinity and Drought Response during Seed Germination and Seedling Growth in Tamarix hispida

 , and
, and 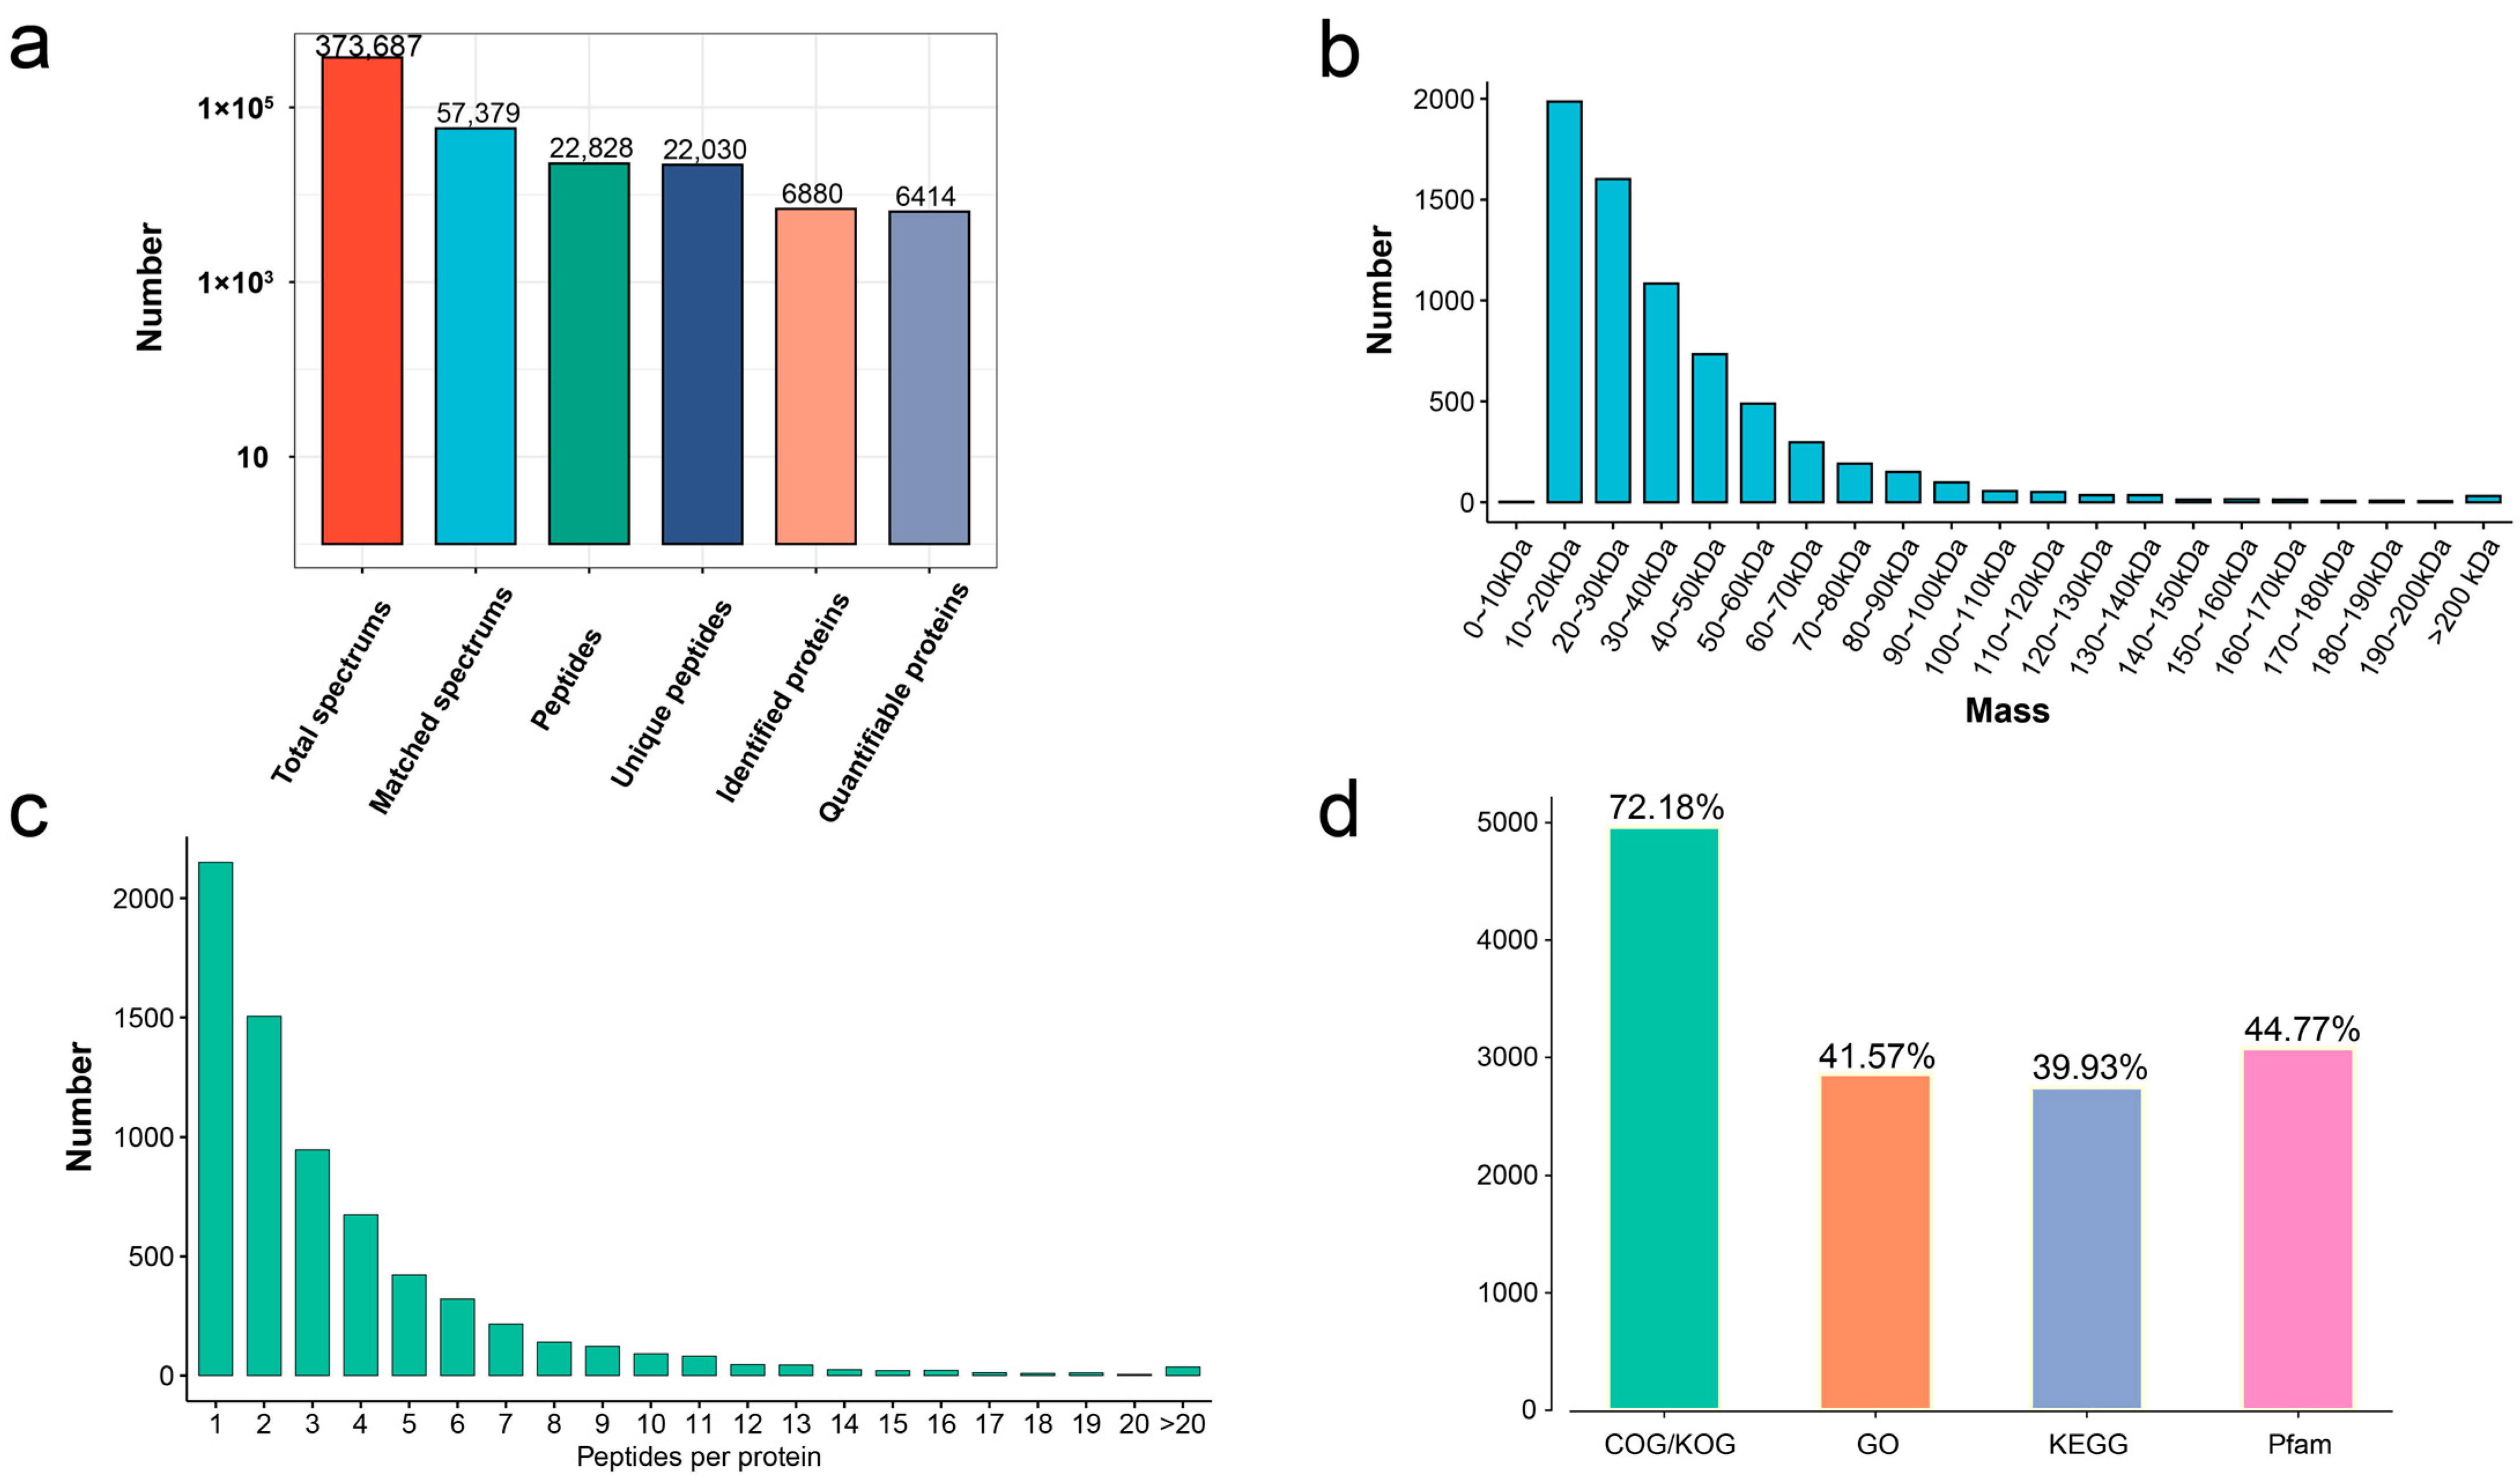
Abstract
1. Introduction
2. Materials and Methods
2.1. Plant Material and Treatments
2.2. Protein Extraction and Trypsin Digestion
2.3. TMT Labeling and HPLC Fractionation
2.4. Mass Spectrometry (MS) Analysis
2.5. Database Search
2.6. Protein Function Annotation
2.7. Differential Analysis of Proteins
2.8. Functional Enrichment
2.9. Protein–Protein Interaction Network
2.10. Transcriptome Analysis
3. Results
3.1. Stage Definition of Seed Germination and Seedling Growth
3.2. Profile of the Proteome in Seed Germination and Seedling Growth
3.3. Comparative Analysis of DAPs and DEGs in Seed Germination and Seedling Growth
3.4. Function Comparative Analysis of DAPs and DEGs in Seed Germination and Seedling Growth
3.5. Dynamic Regulation of Key Proteins in Flavonoid Biosynthesis and Plant-Hormone Signal Transduction during Seed Germination and Seedling Growth
3.6. The Functional Differences of DAPs in Seed Germination and Seedling Growth
3.7. The Abundance-Pattern Analysis of DAPs in Seed Germination and Seedling Growth
4. Discussion
5. Conclusions
Supplementary Materials
Author Contributions
Funding
Institutional Review Board Statement
Informed Consent Statement
Data Availability Statement
Acknowledgments
Conflicts of Interest
References
- Bewley, J.D. Seed Germination and Dormancy. Plant Cell 1997, 9, 1055–1066. [Google Scholar] [CrossRef]
- Ungar, I.A. Seed Germination and Seed-Bank Ecology in Halophytes, in Seed Development and Germination; Routledge: Oxfordshire, UK, 2017; pp. 599–628. [Google Scholar]
- Yadav, P.V.; Maya, K.; Zakwan, A. Seed priming mediated germination improvement and tolerance to subsequent exposure to cold and salt stress in capsicum. Res. J. Seed Sci. 2011, 4, 125–136. [Google Scholar] [CrossRef]
- Mohammadizad, H.A.; Khazaei, I.; Ghafari, M.; Sinehsar, M.F.F.; Barzegar, R. Effect of salt and drought stresses on seed germination and early seedling growth of nepeta persica. Int. J. Farming Allied Sci. 2013, 2, 895–899. [Google Scholar]
- Lutts, S.; Kinet, J.; Bouharmont, J. Changes in plant response to NaCl during development of rice (Oryza sativa L.) varieties differing in salinity resistance. J. Exp. Botany 1995, 46, 1843–1852. [Google Scholar] [CrossRef]
- Chaves, M.M.; Maroco, J.; Pereira, J.S. Understanding plant responses to drought—From genes to the whole plant. Funct. Plant Biol. 2003, 30, 239–264. [Google Scholar] [CrossRef] [PubMed]
- Jenks, M.A.; Hasegawa, P.M.; Jain, S.M.; Foolad, M. Advances in Molecular Breeding toward Drought and Salt Tolerant Crops; Springer: Berlin/Heidelberg, Germany, 2007. [Google Scholar]
- Mut, Z.; Akay, H.; Aydin, N. Effects of seed size and drought stress on germination and seedling growth of some oat genotypes (Avena sativa L.). Afr. J. Agric. Res. 2010, 5, 1101–1107. [Google Scholar]
- Ahmad, S.; Ahmad, R.; Ashraf, M.Y.; Ashraf, M.; Waraich, A. Sunflower (Helianthus annuus L.) response to drought stress at germination and seedling growth stages. Pak. J. Bot. 2009, 41, 647–654. [Google Scholar]
- Gao, J.; Xiao, Q.; Ding, L.; Chen, M.; Yin, L.; Li, J.; Zhou, S.; He, G. Differential responses of lipid peroxidation and antioxidants in Alternanthera philoxeroides and Oryza sativa subjected to drought stress. Plant Growth Regul. 2008, 56, 89–95. [Google Scholar] [CrossRef]
- Chen, K.; Arora, R.J.P.S. Dynamics of the antioxidant system during seed osmopriming, post-priming germination, and seedling establishment in Spinach (Spinacia oleracea). Plant Sci. 2011, 180, 212–220. [Google Scholar] [CrossRef]
- Zhang, T.; Zhao, Y.; Wang, Y.; Liu, Z.; Gao, C. Comprehensive Analysis of MYB Gene Family and Their Expressions Under Abiotic Stresses and Hormone Treatments in Tamarix hispida. Front Plant Sci 2018, 9, 1303. [Google Scholar] [CrossRef] [PubMed]
- Liu, Z.; Xie, Q.; Tang, F.; Wu, J.; Dong, W.; Wang, C.; Gao, C. The ThSOS3 Gene Improves the Salt Tolerance of Transgenic Tamarix hispida and Arabidopsis thaliana. Front. Plant Sci. 2020, 11, 597480. [Google Scholar] [CrossRef]
- Mijiti, M.; Wang, Y.; Wang, L.; Habuding, X. Tamarix hispida NAC Transcription Factor ThNAC4 Confers Salt and Drought Stress Tolerance to Transgenic Tamarix and Arabidopsis. Plants 2022, 11, 2647. [Google Scholar] [CrossRef] [PubMed]
- He, Z.; Li, Z.; Lu, H.; Huo, L.; Wang, Z.; Wang, Y.; Ji, X. The NAC Protein from Tamarix hispida, ThNAC7, Confers Salt and Osmotic Stress Tolerance by Increasing Reactive Oxygen Species Scavenging Capability. Plants 2019, 8, 221. [Google Scholar] [CrossRef] [PubMed]
- Wang, R.; Zhang, Y.; Wang, C.; Wang, Y.-C.; Wang, L.-Q. ThNAC12 from Tamarix hispida directly regulates ThPIP2;5 to enhance salt tolerance by modulating reactive oxygen species. Plant Physiol. Biochem. 2021, 163, 27–35. [Google Scholar] [CrossRef]
- Luan, J.; Dong, J.; Song, X.; Jiang, J.; Li, H. Overexpression of Tamarix hispida ThTrx5 Confers Salt Tolerance to Arabidopsis by Activating Stress Response Signals. Int. J. Mol. Sci. 2020, 21, 1165. [Google Scholar] [CrossRef] [PubMed]
- Miransari, M.; Smith, D.L. Plant hormones and seed germination. Environ. Exp. Bot. 2014, 99, 110–121. [Google Scholar] [CrossRef]
- Penfield, S.; Li, Y.; Gilday, A.D.; Graham, S.; Graham, I.A. Arabidopsis ABA INSENSITIVE4 regulates lipid mobilization in the embryo and reveals repression of seed germination by the endosperm. Plant Cell 2006, 18, 1887–1899. [Google Scholar] [CrossRef] [PubMed]
- Linkies, A.; Leubner-Metzger, G. Beyond gibberellins and abscisic acid: How ethylene and jasmonates control seed germination. Plant Cell Rep. 2012, 31, 253–270. [Google Scholar] [CrossRef]
- Nakabayashi, K.; Okamoto, M.; Koshiba, T.; Kamiya, Y.; Nambara, E. Genome-wide profiling of stored mRNA in Arabidopsis thaliana seed germination: Epigenetic and genetic regulation of transcription in seed. Plant J. 2005, 41, 697–709. [Google Scholar] [CrossRef] [PubMed]
- Carrera, E.; Holman, T.; Medhurst, A.; Dietrich, D.; Footitt, S.; Theodoulou, F.L.; Holdsworth, M.J. Seed after-ripening is a discrete developmental pathway associated with specific gene networks in Arabidopsis. Plant J. 2008, 53, 214–224. [Google Scholar] [CrossRef]
- Fait, A.; Angelovici, R.; Less, H.; Ohad, I.; Urbanczyk-Wochniak, E.; Fernie, A.R.; Galili, G. Arabidopsis seed development and germination is associated with temporally distinct metabolic switches. Plant Physiol. 2006, 142, 839–854. [Google Scholar] [CrossRef]
- Chibani, K.; Ali-Rachedi, S.; Job, C.; Job, D.; Jullien, M.; Grappin, P. Proteomic analysis of seed dormancy in Arabidopsis. Plant Physiol. 2006, 142, 1493–1510. [Google Scholar] [CrossRef] [PubMed]
- Zargar, S.M.; Gupta, N.; Mir, R.A.; Rai, V. Shift from Gel Based to Gel Free Proteomics to Unlock Unknown Regulatory Network in Plants: A Comprehensive Review. J. Adv. Res. Biotechnol. 2016, 1, 15226. [Google Scholar] [CrossRef]
- He, M.; Zhu, C.; Dong, K.; Zhang, T.; Cheng, Z.; Li, J.; Yan, Y. Comparative proteome analysis of embryo and endosperm reveals central differential expression proteins involved in wheat seed germination. BMC Plant Biol. 2015, 15, 97. [Google Scholar] [CrossRef] [PubMed]
- Irar, S.; Brini, F.; Goday, A.; Masmoudi, K.; Pagès, M. Proteomic analysis of wheat embryos with 2-DE and liquid-phase chromatography (ProteomeLab PF-2D)—A wider perspective of the proteome. J. Proteom. 2010, 73, 1707–1721. [Google Scholar] [CrossRef]
- Mak, Y.; Skylas, D.J.; Willows, R.; Connolly, A.; Cordwell, S.J.; Wrigley, C.W.; Sharp, P.J.; Copeland, L. A proteomic approach to the identification and characterisation of protein composition in wheat germ. Funct. Integr. Genom. 2006, 6, 322–337. [Google Scholar] [CrossRef] [PubMed]
- Müller, K.; Job, C.; Belghazi, M.; Job, D.; Leubner-Metzger, G. Proteomics reveal tissue-specific features of the cress (Lepidium sativum L.) endosperm cap proteome and its hormone-induced changes during seed germination. Proteomics 2010, 10, 406–416. [Google Scholar] [CrossRef]
- Yang, P.; Li, X.; Wang, X.; Chen, H.; Chen, F.; Shen, S. Proteomic analysis of rice (Oryza sativa) seeds during germination. Proteomics 2007, 7, 3358–3368. [Google Scholar] [CrossRef]
- He, D.; Han, C.; Yao, J.; Shen, S.; Yang, P. Constructing the metabolic and regulatory pathways in germinating rice seeds through proteomic approach. Proteomics 2011, 11, 2693–2713. [Google Scholar] [CrossRef]
- Finnie, C.; Maeda, K.; Østergaard, O.; Bak-Jensen, K.; Larsen, J.; Svensson, B. Aspects of the barley seed proteome during development and germination. Biochem. Soc. Trans. 2004, 32, 517–519. [Google Scholar] [CrossRef]
- Catusse, J.; Strub, J.M.; Job, C.; Van Dorsselaer, A.; Job, D. Proteome-wide characterization of sugarbeet seed vigor and its tissue specific expression. Proc. Natl. Acad. Sci. USA 2008, 105, 10262–10267. [Google Scholar] [CrossRef] [PubMed]
- Fu, Z.; Jin, X.; Ding, D.; Li, Y.; Fu, Z.; Tang, J. Proteomic analysis of heterosis during maize seed germination. Proteomics 2011, 11, 1462–1472. [Google Scholar] [CrossRef]
- Pang, X.a.; Suo, X.J.; Liu, S.; Xu, J.; Yang, T.g.; Xiang, N.; Wu, Y.; Lu, B.; Qin, R.; Liu, H.; et al. Combined transcriptomic and metabolomic analysis reveals the potential mechanism of seed germination and young seedling growth in Tamarix hispida. BMC Genom. 2022, 23, 109. [Google Scholar] [CrossRef] [PubMed]
- Orsburn, B.C. Proteome Discoverer-A Community Enhanced Data Processing Suite for Protein Informatics. Proteomes 2021, 9, 15. [Google Scholar] [CrossRef] [PubMed]
- Cox, J.; Mann, M. MaxQuant enables high peptide identification rates, individualized p.p.b.-range mass accuracies and proteome-wide protein quantification. Nat. Biotechnol. 2008, 26, 1367–1372. [Google Scholar] [CrossRef]
- Kanehisa, M.; Goto, S. KEGG: Kyoto encyclopedia of genes and genomes. Nucleic Acids Res. 2000, 28, 27–30. [Google Scholar] [CrossRef]
- Kanehisa, M. Toward understanding the origin and evolution of cellular organisms. Protein Sci. 2019, 28, 1947–1951. [Google Scholar] [CrossRef]
- Kanehisa, M.; Furumichi, M.; Sato, Y.; Ishiguro-Watanabe, M.; Tanabe, M. KEGG: Integrating viruses and cellular organisms. Nucleic Acids Res. 2021, 49, D545–D551. [Google Scholar] [CrossRef]
- Warnes, G.R.; Bolker, B.; Bonebakker, L.; Gentleman, R.; Huber, W.; Liaw, A.; Lumley, T.; Maechler, M.; Magnusson, A.; Moeller, S. gplots: Various R programming tools for plotting data. R Package Version 2009, 2, 1. [Google Scholar]
- Shannon, P.; Markiel, A.; Ozier, O.; Baliga, N.S.; Wang, J.T.; Ramage, D.; Amin, N.; Schwikowski, B.; Ideker, T. Cytoscape: A software environment for integrated models of biomolecular interaction networks. Genome Res. 2003, 13, 2498–2504. [Google Scholar] [CrossRef]
- Xu, W.; Dubos, C.; Lepiniec, L. Transcriptional control of flavonoid biosynthesis by MYB–bHLH–WDR complexes. Trends Plant Sci. 2015, 20, 176–185. [Google Scholar] [CrossRef] [PubMed]
- Chakraborty, K.; Sairam, R.K.; Bhattacharya, R.C. Salinity-induced expression of pyrrolline-5-carboxylate synthetase determine salinity tolerance in Brassica spp. Acta Physiol. Plant. 2012, 34, 1935–1941. [Google Scholar] [CrossRef]
- Igarashi, Y.; Sanada, Y.; Yamaguchi-Shinozaki, K.; Wada, K.; Shinozaki, K. Characterization of the gene for Δ1-pyrroline-5-carboxylate synthetase and correlation between the expression of the gene and salt tolerance in Oryza sativa L. Plant Mol. Biol. 1997, 33, 857–865. [Google Scholar] [CrossRef] [PubMed]
- Bandurska, H.; Niedziela, J.; Pietrowska-Borek, M.; Nuc, K.; Chadzinikolau, T.; Radzikowska, D. Regulation of proline biosynthesis and resistance to drought stress in two barley (Hordeum vulgare L.) genotypes of different origin. Plant Physiol. Biochem. 2017, 118, 427–437. [Google Scholar] [CrossRef]
- Saito, K.; Yonekura-Sakakibara, K.; Nakabayashi, R.; Higashi, Y.; Yamazaki, M.; Tohge, T.; Fernie, A.R. The flavonoid biosynthetic pathway in Arabidopsis: Structural and genetic diversity. Plant Physiol. Biochem. 2013, 72, 21–34. [Google Scholar] [CrossRef]
- Grotewold, E. THE GENETICS AND BIOCHEMISTRY OF FLORAL PIGMENTS. Annu. Rev. Plant Biol. 2006, 57, 761–780. [Google Scholar] [CrossRef]
- Szabados, L.; Savouré, A. Proline: A multifunctional amino acid. Trends Plant Sci. 2010, 15, 89–97. [Google Scholar] [CrossRef]
- Kim, Y.-H.; Kim, C.Y.; Song, W.-K.; Park, D.-S.; Kwon, S.-Y.; Lee, H.-S.; Bang, J.-W.; Kwak, S.-S. Overexpression of sweetpotato swpa4 peroxidase results in increased hydrogen peroxide production and enhances stress tolerance in tobacco. Planta 2008, 227, 867–881. [Google Scholar] [CrossRef] [PubMed]
- Yu, J.-Q.; Wang, J.-H.; Sun, C.-H.; Zhang, Q.-Y.; Hu, D.-G.; Hao, Y.-J. Ectopic expression of the apple nucleus-encoded thylakoid protein MdY3IP1 triggers early-flowering and enhanced salt-tolerance in Arabidopsis thaliana. BMC Plant Biol. 2018, 18, 18. [Google Scholar] [CrossRef]
- Hardiman, G.J. Introduction to proteomics: Tools for the new biology. Sci. Bus. Media 2004, 1, 9–10. [Google Scholar] [CrossRef]
- Mora, L.; Bramley, P.; Fraser, P. Development and optimisation of a label-free quantitative proteomic procedure and its application in the assessment of genetically modified tomato fruit. Proteomics 2013, 13, 2016–2030. [Google Scholar] [CrossRef]
- Wang, F.; Kong, W.; Wong, G.; Fu, L.; Peng, R.; Li, Z.; Yao, Q. AtMYB12 regulates flavonoids accumulation and abiotic stress tolerance in transgenic Arabidopsis thaliana. Mol. Genet. Genom. 2016, 291, 1545–1559. [Google Scholar] [CrossRef]
- Li, B.; Fan, R.; Guo, S.; Wang, P.; Zhu, X.; Fan, Y.; Chen, Y.; He, K.; Kumar, A.; Shi, J.; et al. The Arabidopsis MYB transcription factor, MYB111 modulates salt responses by regulating flavonoid biosynthesis. Environ. Exp. Bot. 2019, 166, 103807. [Google Scholar] [CrossRef]
- Li, B.; Fan, R.; Sun, G.; Sun, T.; Fan, Y.; Bai, S.; Guo, S.; Huang, S.; Liu, J.; Zhang, H.; et al. Flavonoids improve drought tolerance of maize seedlings by regulating the homeostasis of reactive oxygen species. Plant Soil. 2021, 461, 389–405. [Google Scholar] [CrossRef]
- Ji, X.; Liu, G.; Liu, Y.; Zheng, L.; Nie, X.; Wang, Y. The bZIP protein from Tamarix hispida, ThbZIP1, is ACGT elements binding factor that enhances abiotic stress signaling in transgenic Arabidopsis. BMC Plant Biol. 2013, 13, 151. [Google Scholar] [CrossRef] [PubMed]
- Yang, G.; Yu, L.; Zhang, K.; Zhao, Y.; Guo, Y.; Gao, C. A ThDREB gene from Tamarix hispida improved the salt and drought tolerance of transgenic tobacco and T. hispida. Plant Physiol. Biochem. 2017, 113, 187–197. [Google Scholar] [CrossRef] [PubMed]
- Guo, X.H.; Jiang, J.; Lin, S.J.; Wang, B.C.; Wang, Y.C.; Liu, G.F.; Yang, C.P. A ThCAP gene from Tamarix hispida confers cold tolerance in transgenic Populus (P. davidiana x P. bolleana). Biotechnol. Lett. 2009, 31, 1079–1087. [Google Scholar] [CrossRef]
- Ebeed, H.T.; Hassan, N.M.; Keshta, M.M.; Hassanin, O. Comparative analysis of seed yield and biochemical attributes in different sunflower genotypes under different levels of irrigation and salinity. Egypt. J. Bot. 2019, 59, 339–355. [Google Scholar] [CrossRef]
- Hu, C.A.; Delauney, A.J.; Verma, D.P. A bifunctional enzyme (delta 1-pyrroline-5-carboxylate synthetase) catalyzes the first two steps in proline biosynthesis in plants. Proc. Natl. Acad. Sci. USA 1992, 89, 9354–9358. [Google Scholar] [CrossRef] [PubMed]


Disclaimer/Publisher’s Note: The statements, opinions and data contained in all publications are solely those of the individual author(s) and contributor(s) and not of MDPI and/or the editor(s). MDPI and/or the editor(s) disclaim responsibility for any injury to people or property resulting from any ideas, methods, instructions or products referred to in the content. |
© 2023 by the authors. Licensee MDPI, Basel, Switzerland. This article is an open access article distributed under the terms and conditions of the Creative Commons Attribution (CC BY) license (https://creativecommons.org/licenses/by/4.0/).
Share and Cite
Pang, X.; Liu, S.; Suo, J.; Yang, T.; Hasan, S.; Hassan, A.; Xu, J.; Lu, S.; Mi, S.; Liu, H.; et al. Proteome Dynamics Analysis Reveals the Potential Mechanisms of Salinity and Drought Response during Seed Germination and Seedling Growth in Tamarix hispida. Genes 2023, 14, 656. https://doi.org/10.3390/genes14030656
Pang X, Liu S, Suo J, Yang T, Hasan S, Hassan A, Xu J, Lu S, Mi S, Liu H, et al. Proteome Dynamics Analysis Reveals the Potential Mechanisms of Salinity and Drought Response during Seed Germination and Seedling Growth in Tamarix hispida. Genes. 2023; 14(3):656. https://doi.org/10.3390/genes14030656
Chicago/Turabian StylePang, Xin’an, Shuo Liu, Jiangtao Suo, Tiange Yang, Samira Hasan, Ali Hassan, Jindong Xu, Sushuangqing Lu, Sisi Mi, Hong Liu, and et al. 2023. "Proteome Dynamics Analysis Reveals the Potential Mechanisms of Salinity and Drought Response during Seed Germination and Seedling Growth in Tamarix hispida" Genes 14, no. 3: 656. https://doi.org/10.3390/genes14030656
APA StylePang, X., Liu, S., Suo, J., Yang, T., Hasan, S., Hassan, A., Xu, J., Lu, S., Mi, S., Liu, H., & Yao, J. (2023). Proteome Dynamics Analysis Reveals the Potential Mechanisms of Salinity and Drought Response during Seed Germination and Seedling Growth in Tamarix hispida. Genes, 14(3), 656. https://doi.org/10.3390/genes14030656