
Small RNA Sequencing Reveals a Distinct MicroRNA Signature between Glucocorticoid Responder and Glucocorticoid Non-Responder Primary Human Trabecular Meshwork Cells after Dexamethasone Treatment

 , ,
, ,  and
and
Abstract
:1. Introduction
2. Materials and Methods
2.1. Human Donor Eyes
2.2. Primary Human Trabecular Meshwork (HTM) Cells with Known GC Responsiveness
2.3. Total RNA Extraction
2.4. Library Preparation and miRNA Sequencing
2.5. Differential Expression Analysis of miRNAs
2.6. Validation of DEMirs by Real-Time PCR
2.7. Prediction of the Target mRNA with Their Enriched Pathways and Biological Processes
2.8. Statistical Analysis
3. Results
3.1. Establishment of GC-R and GC-NR HTM Cells
3.2. miRNA-Seq Data Quality
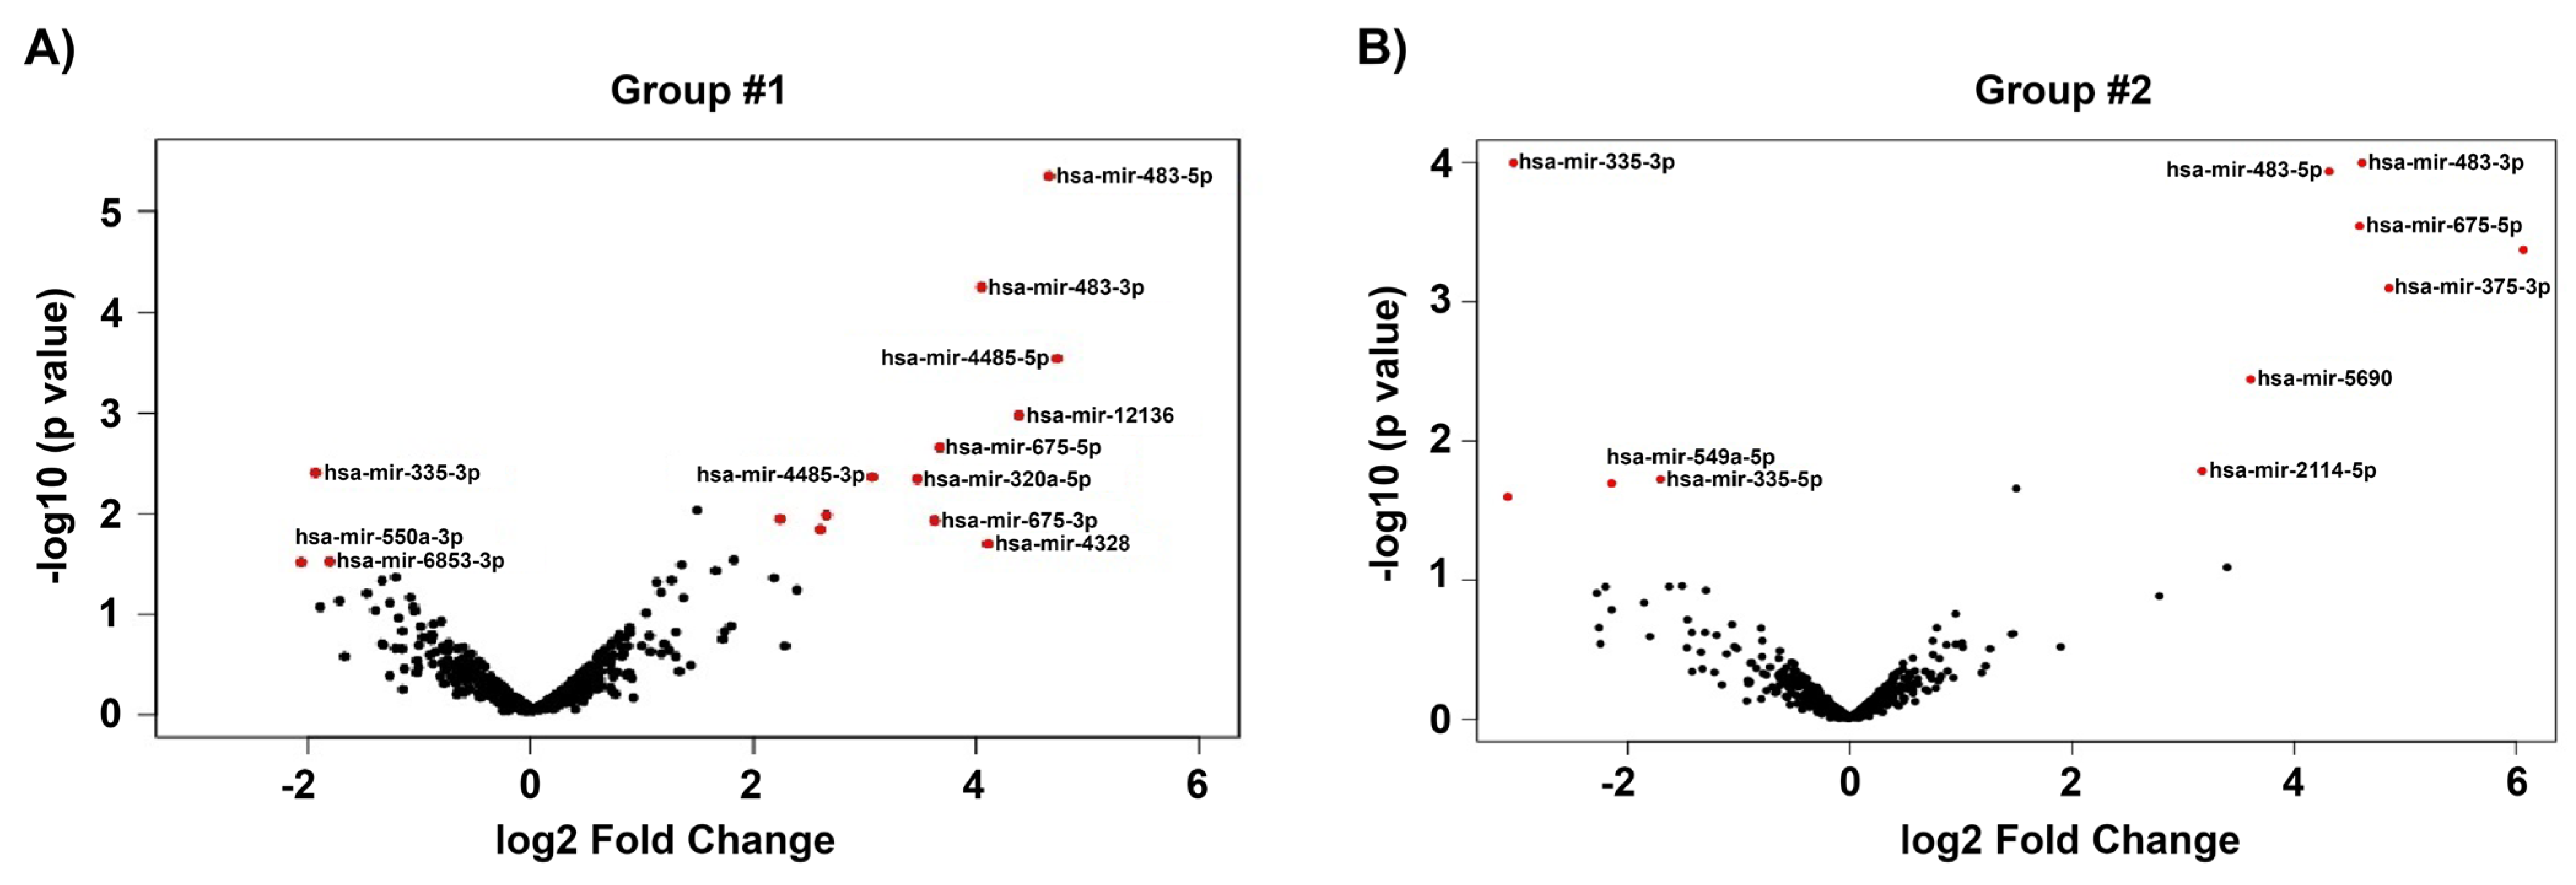
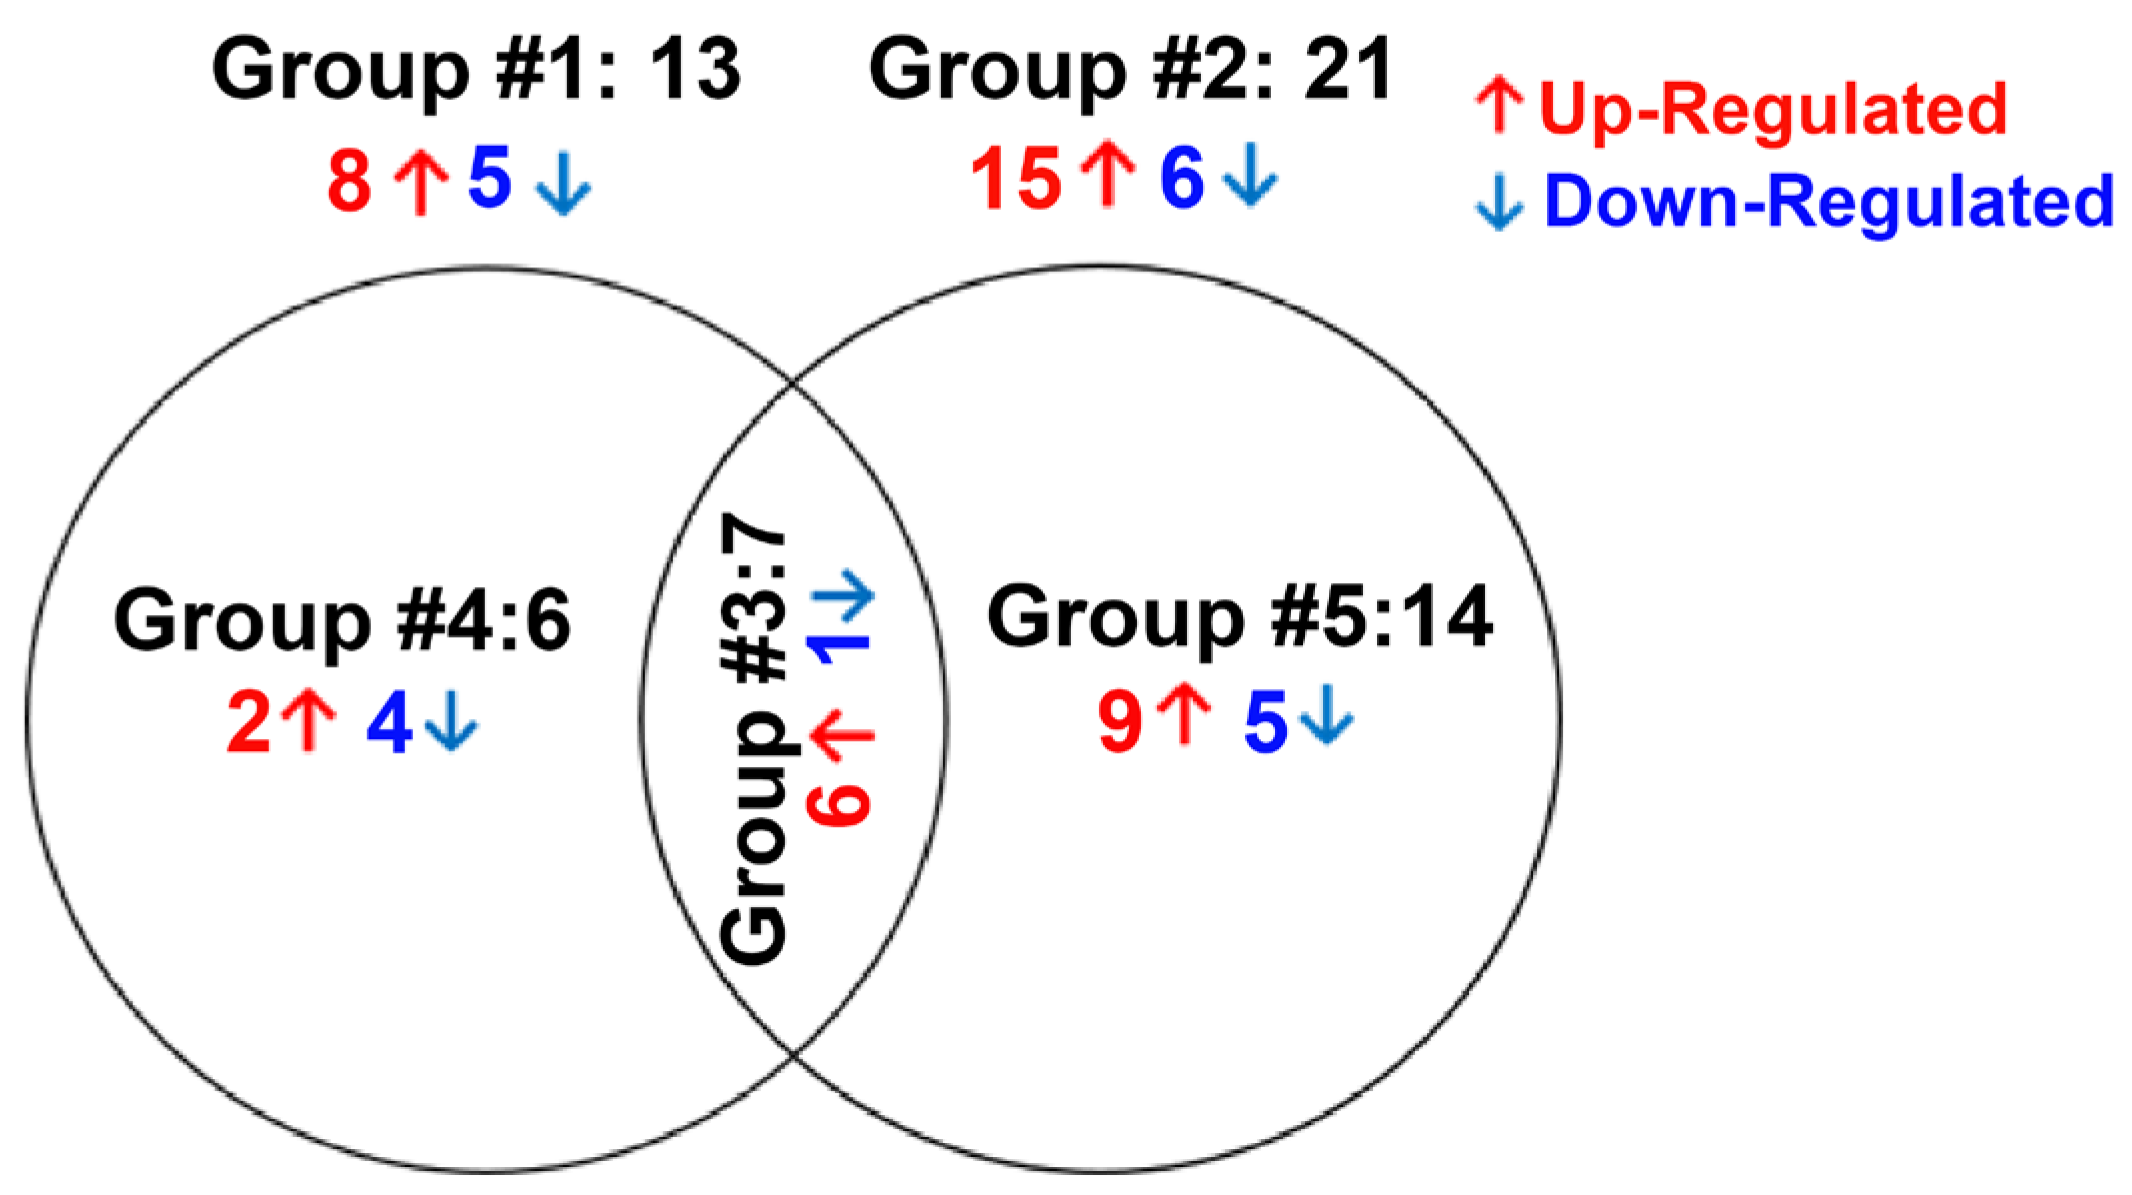
3.3. Differentially Expressed Genes of GC-R and GC-NR HTM Cells
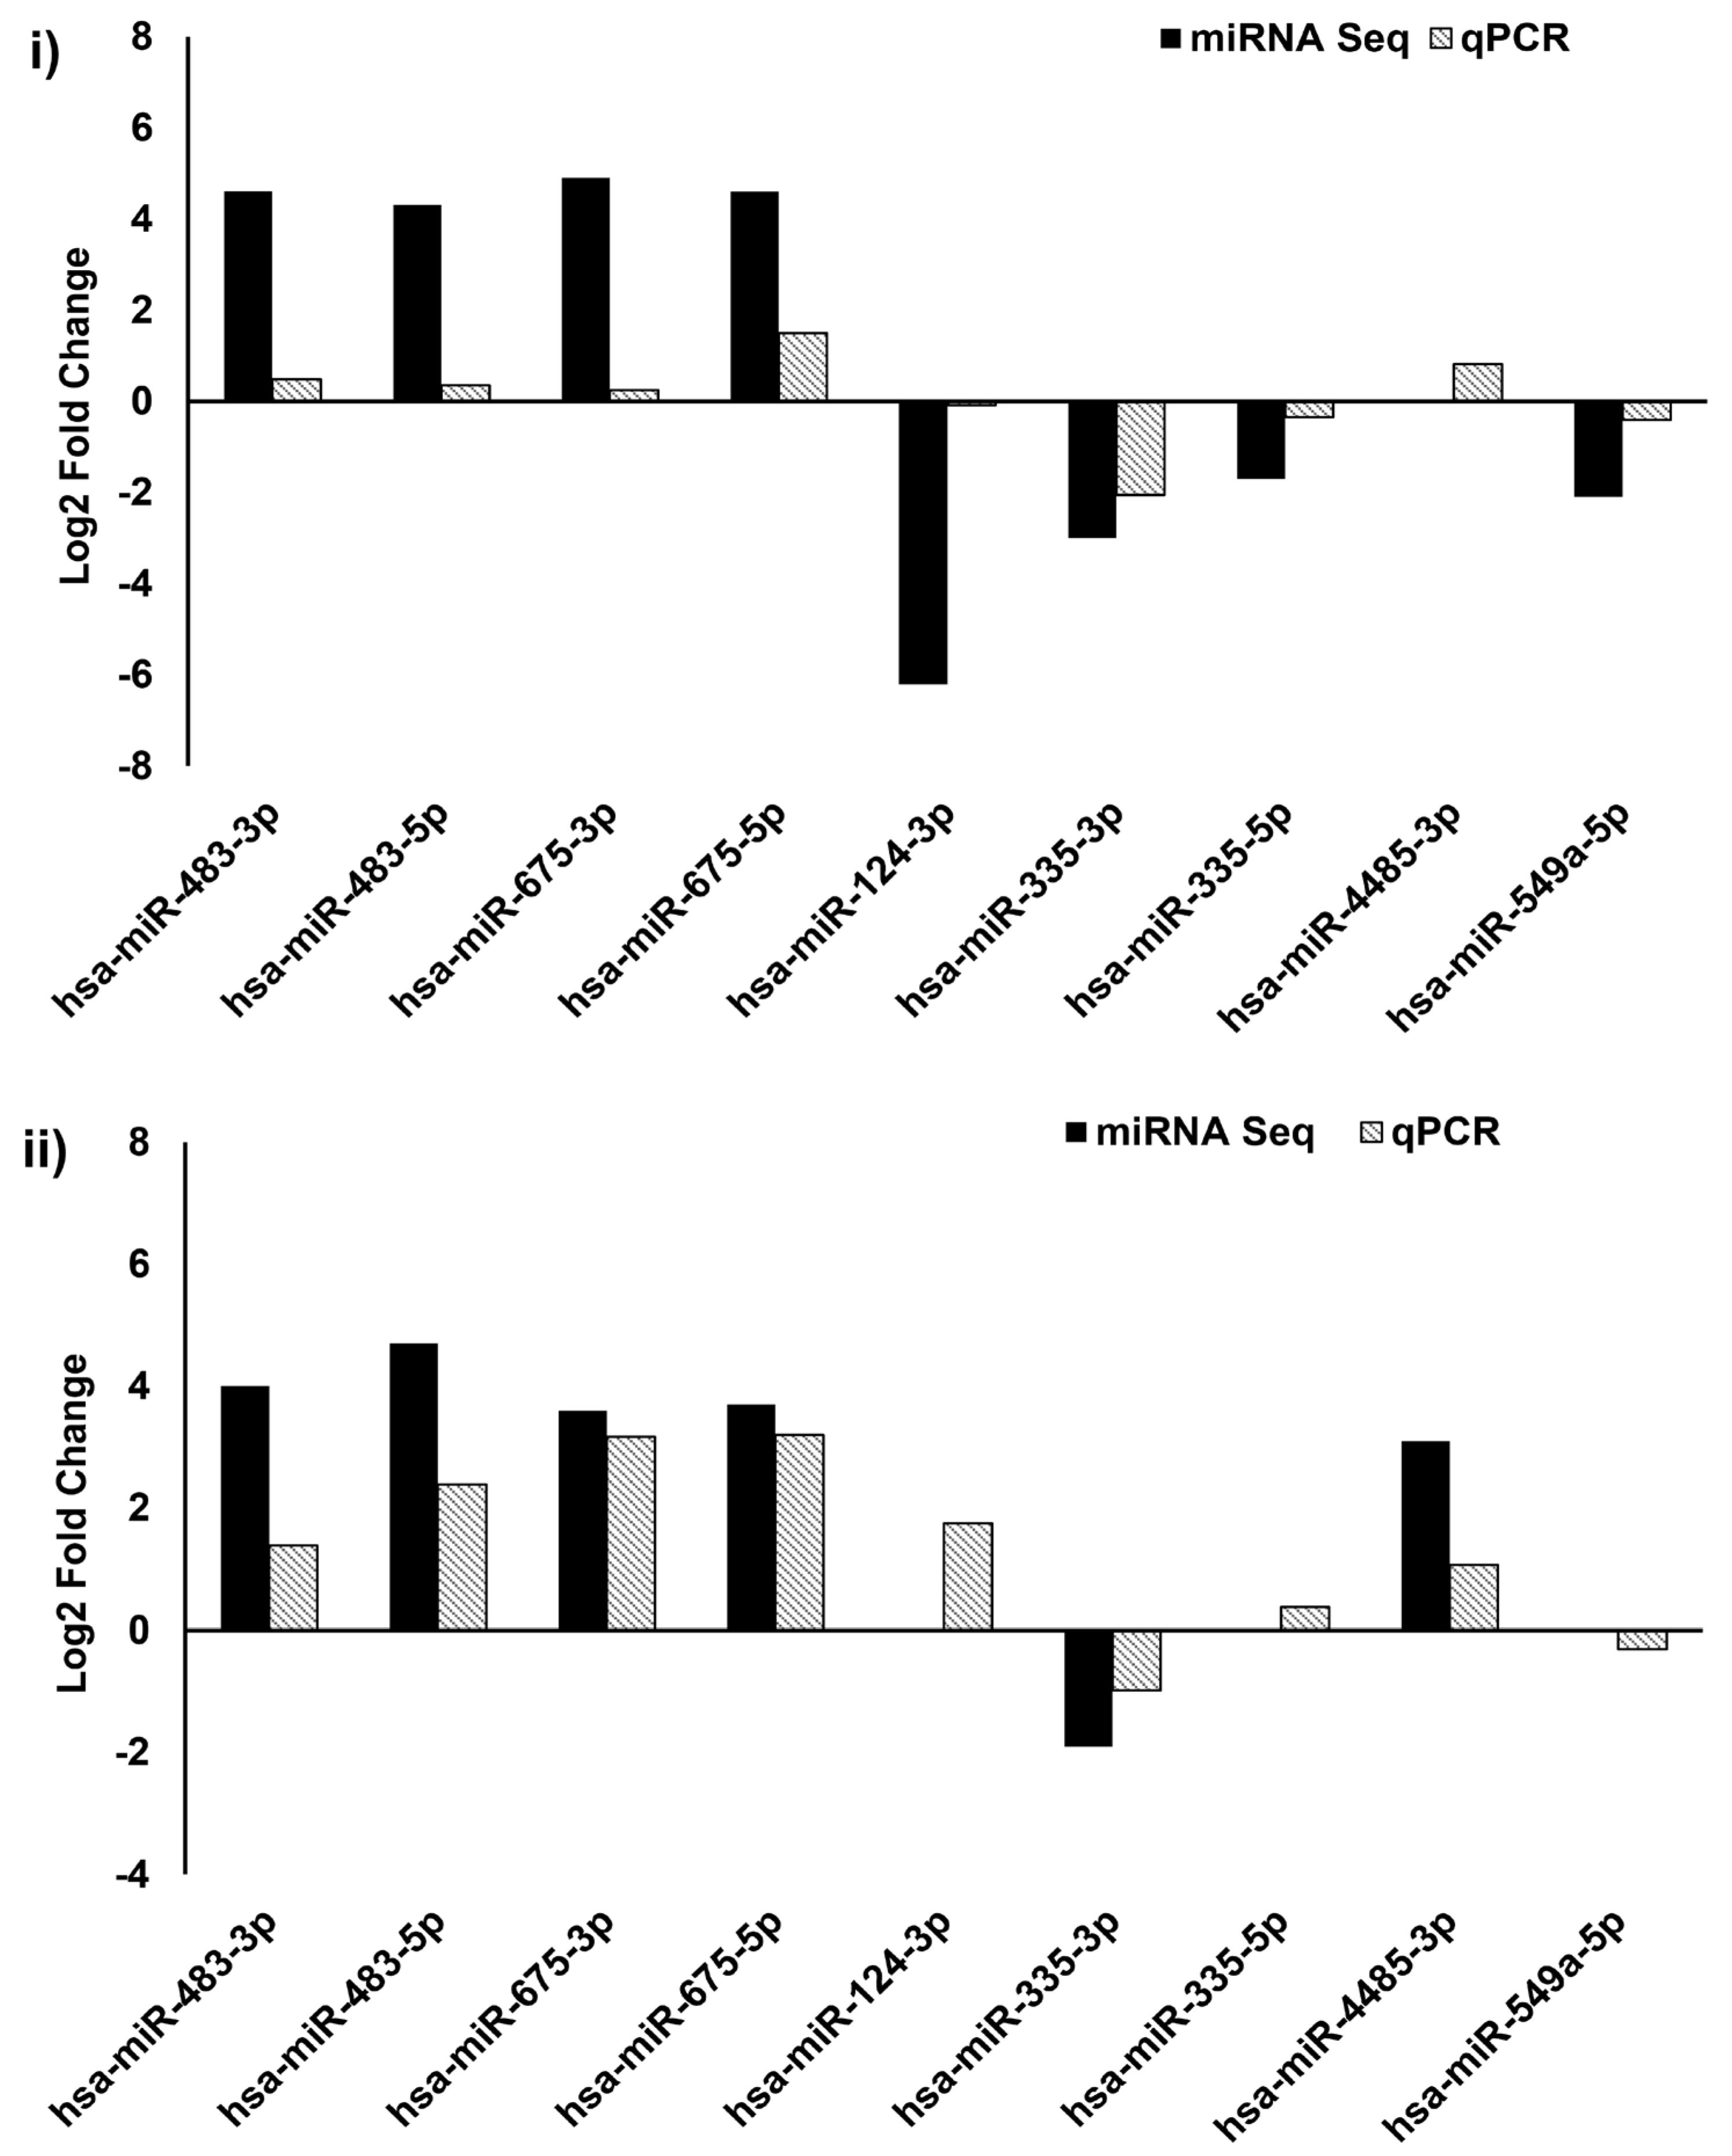
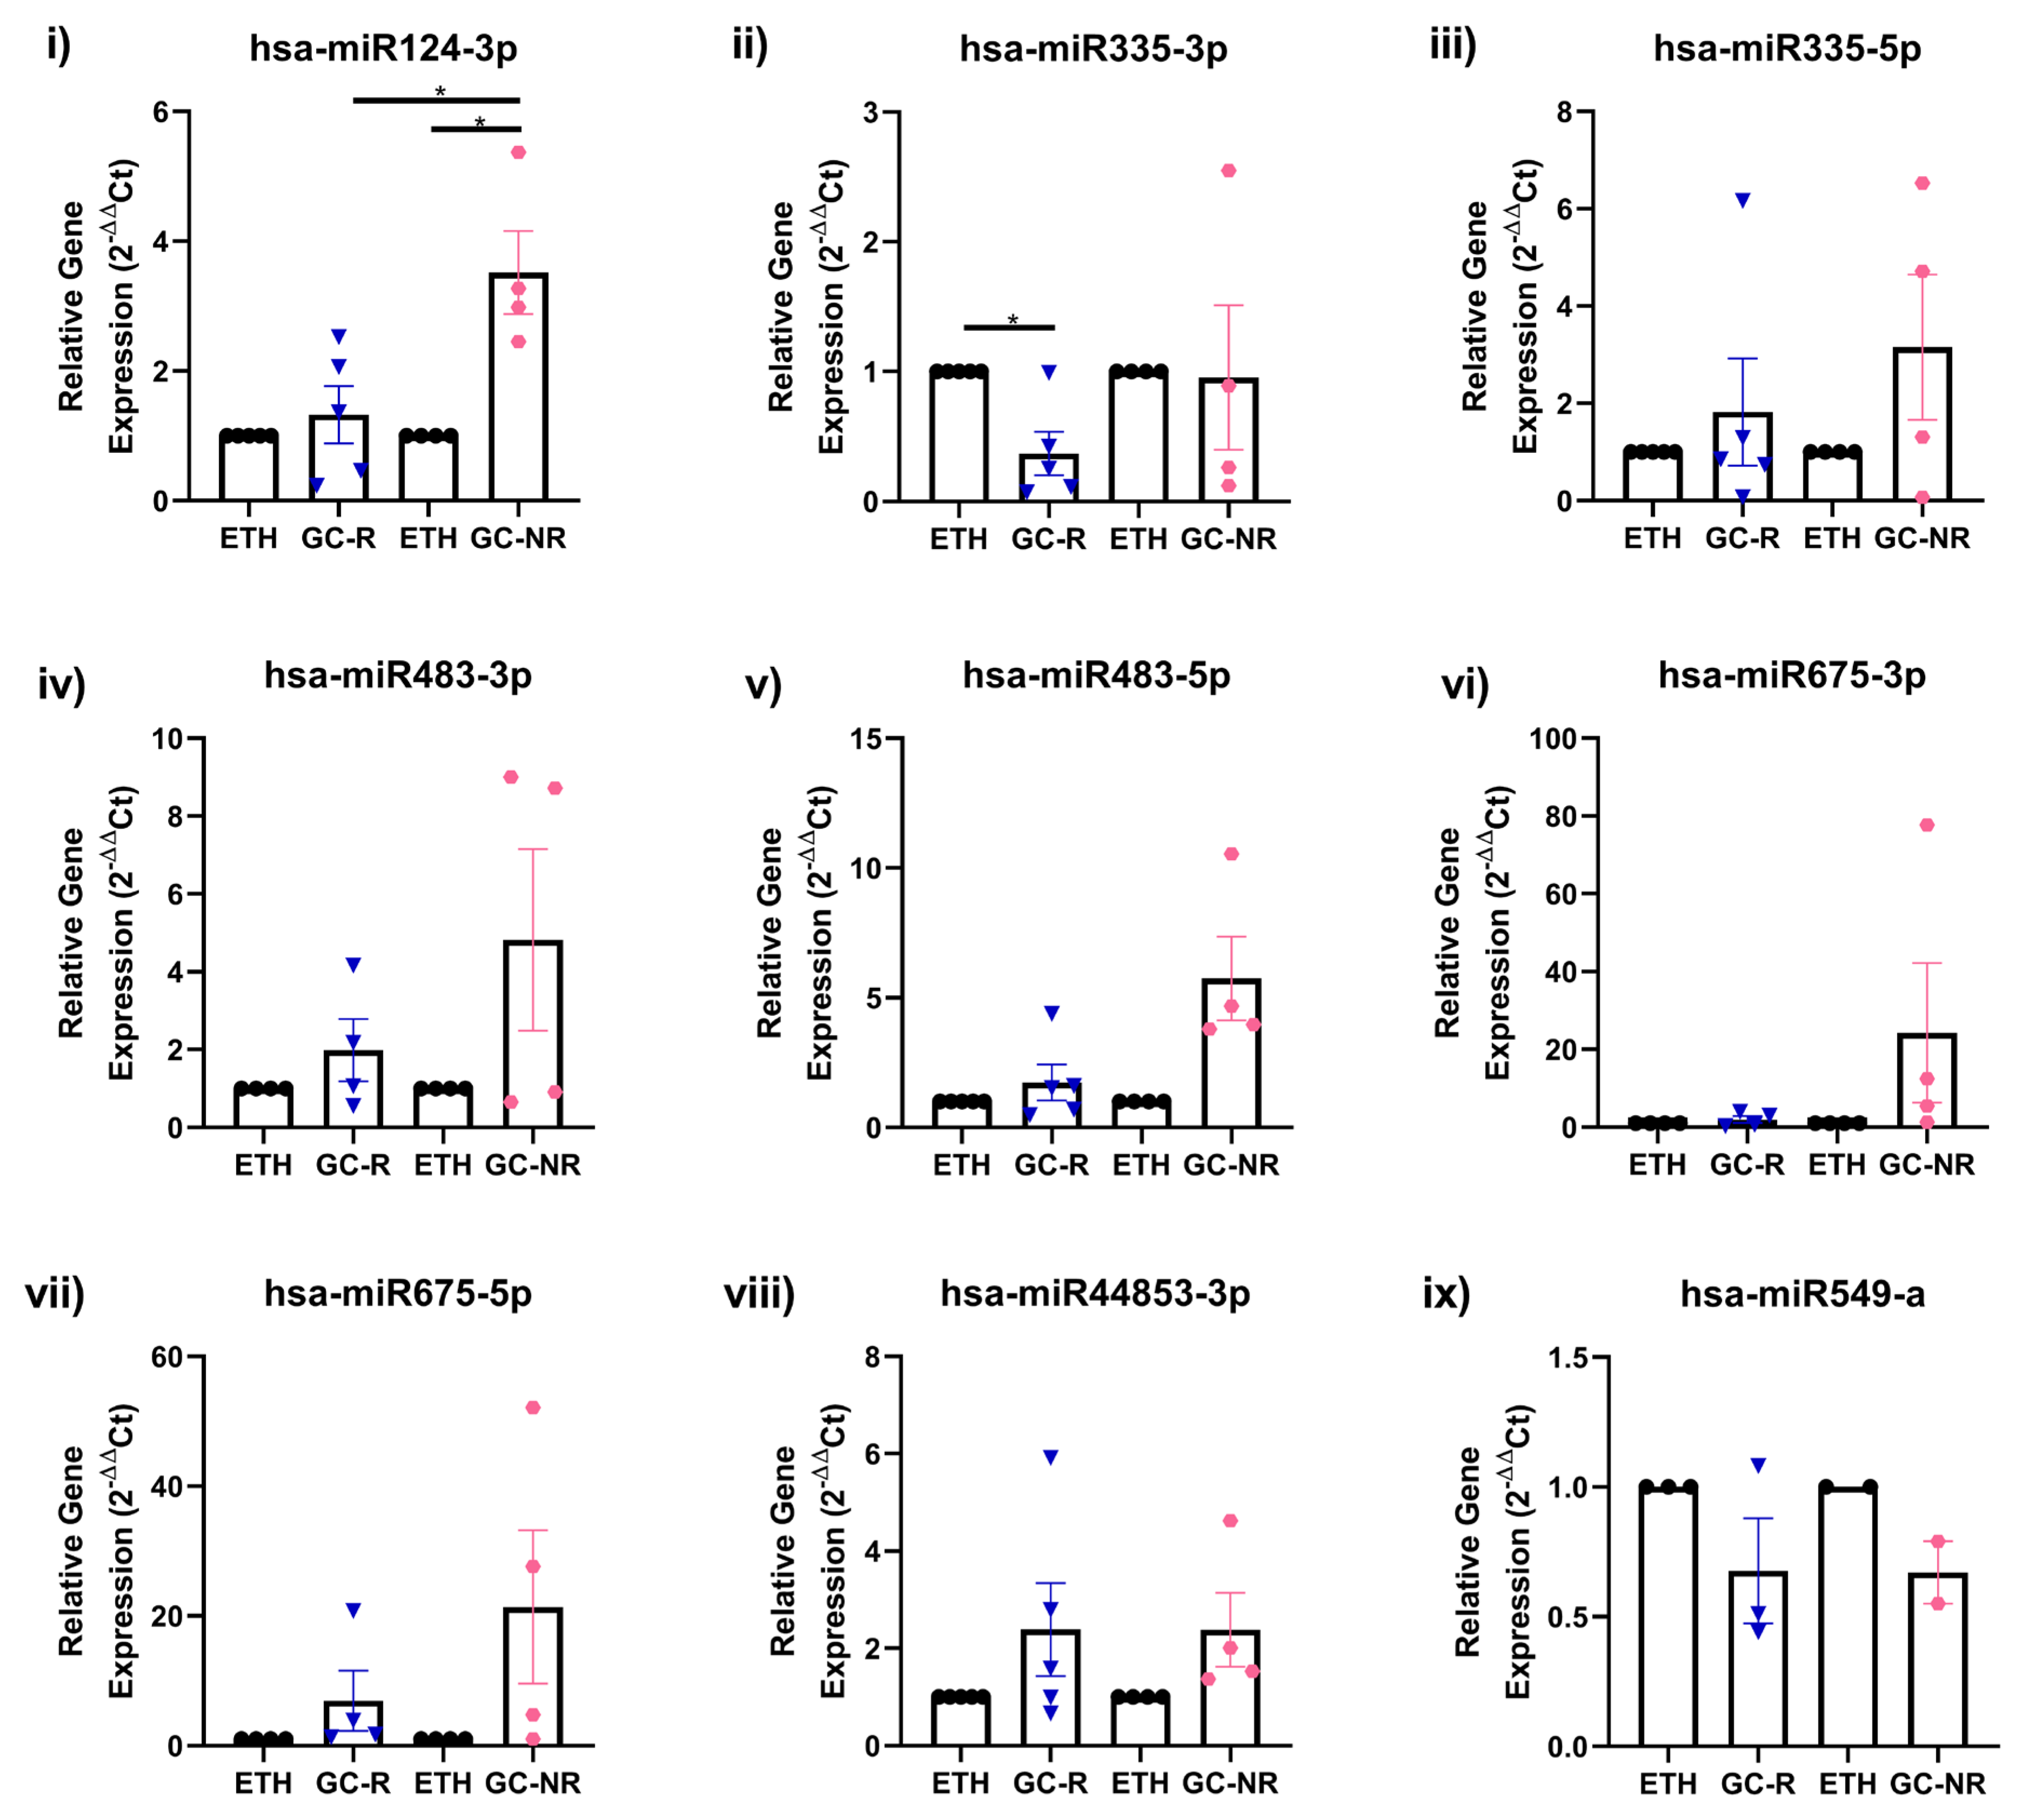
3.4. Validation of DE-miRNAs by qPCR
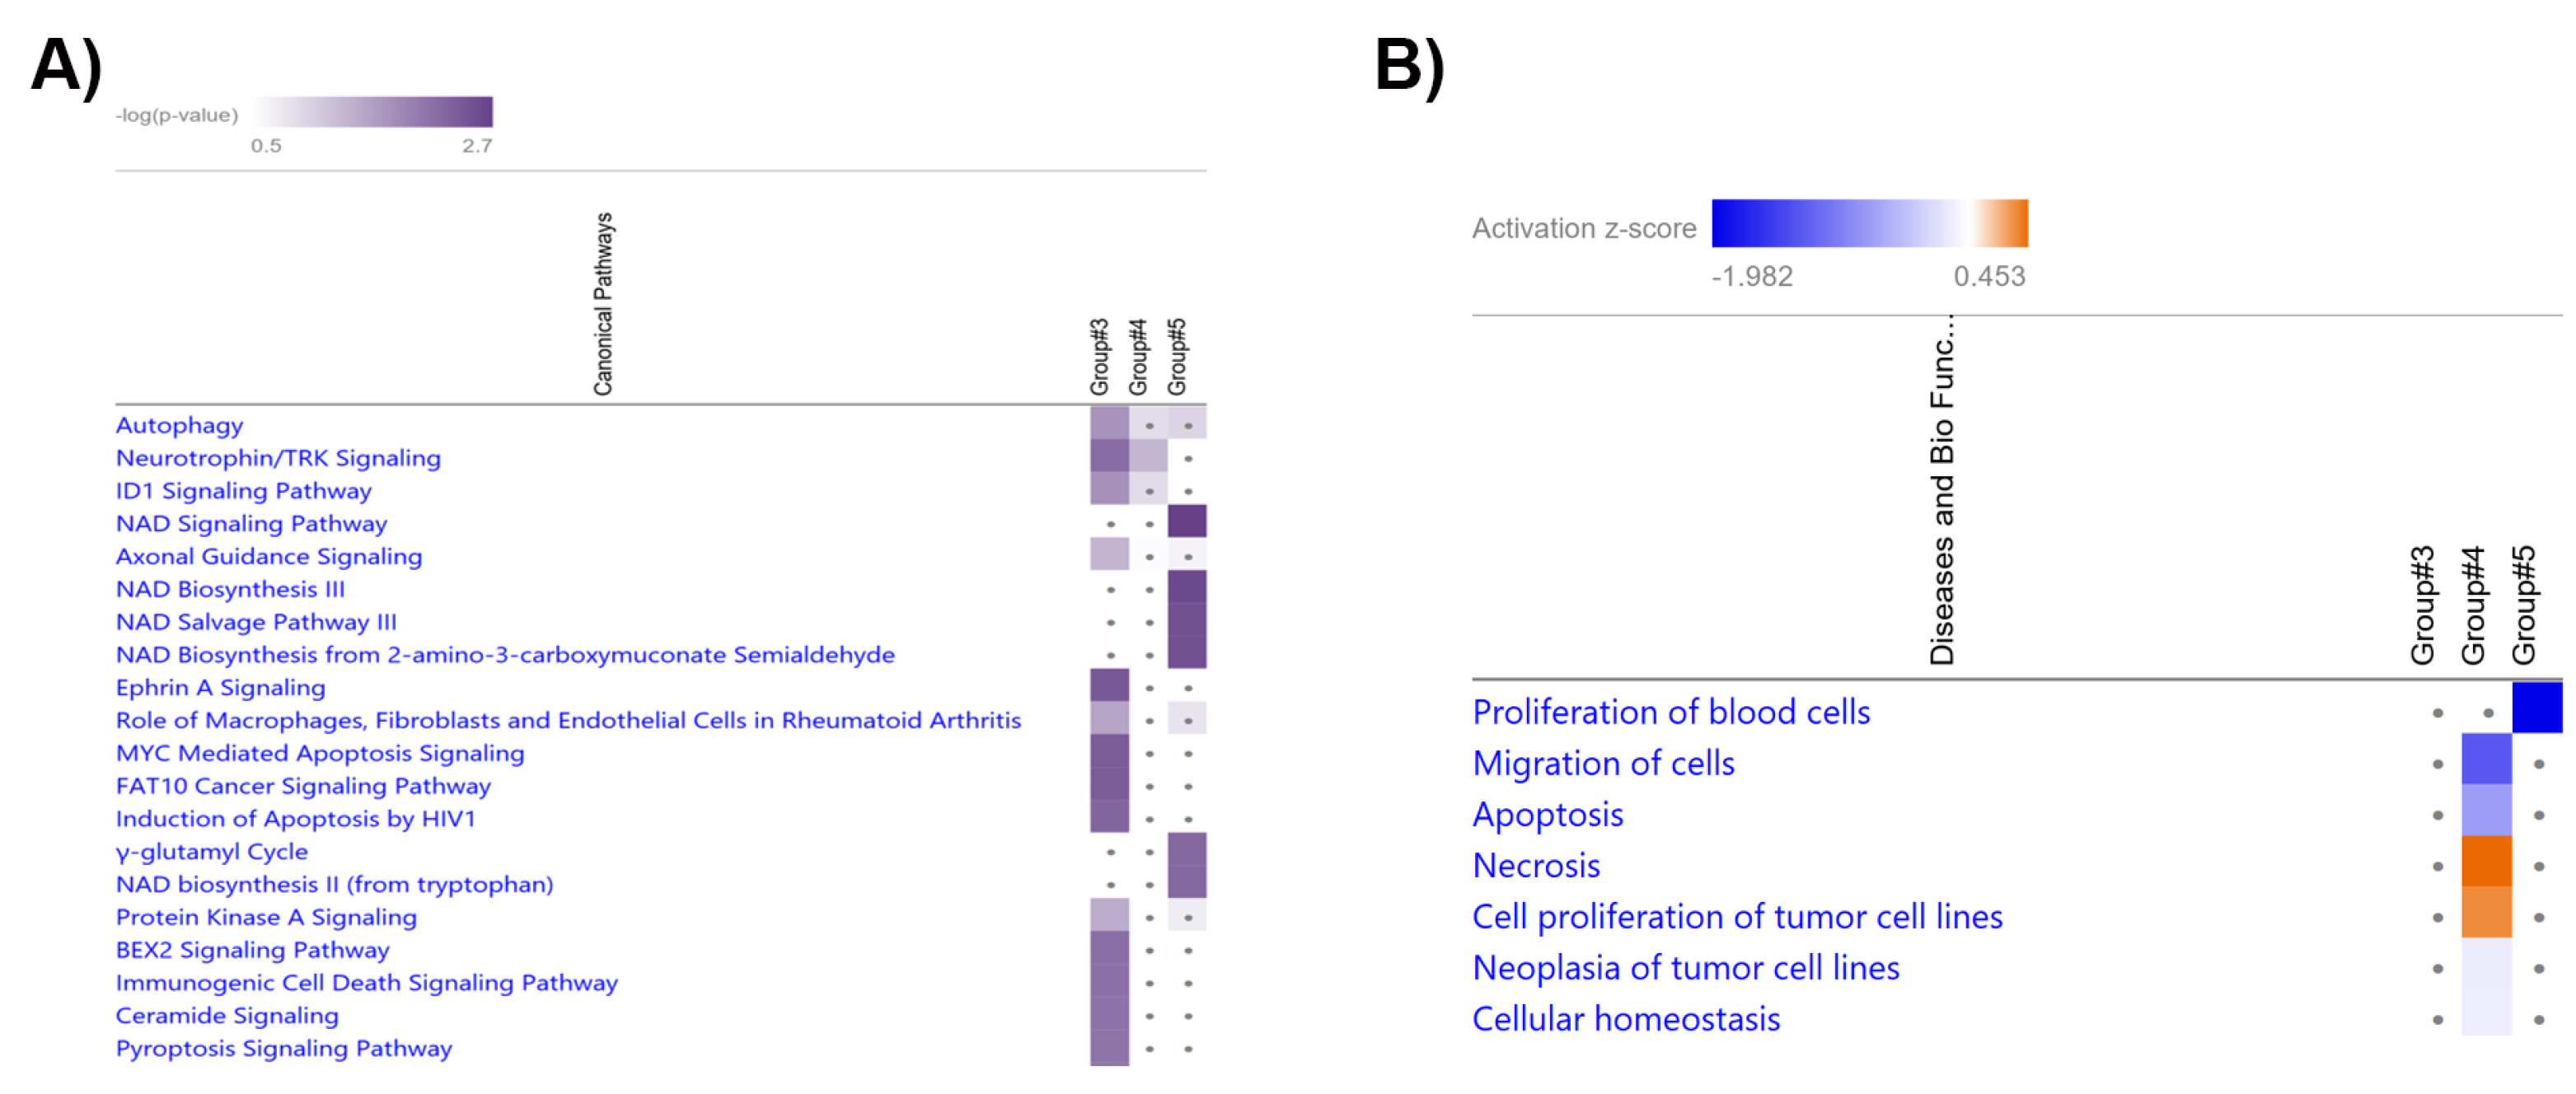
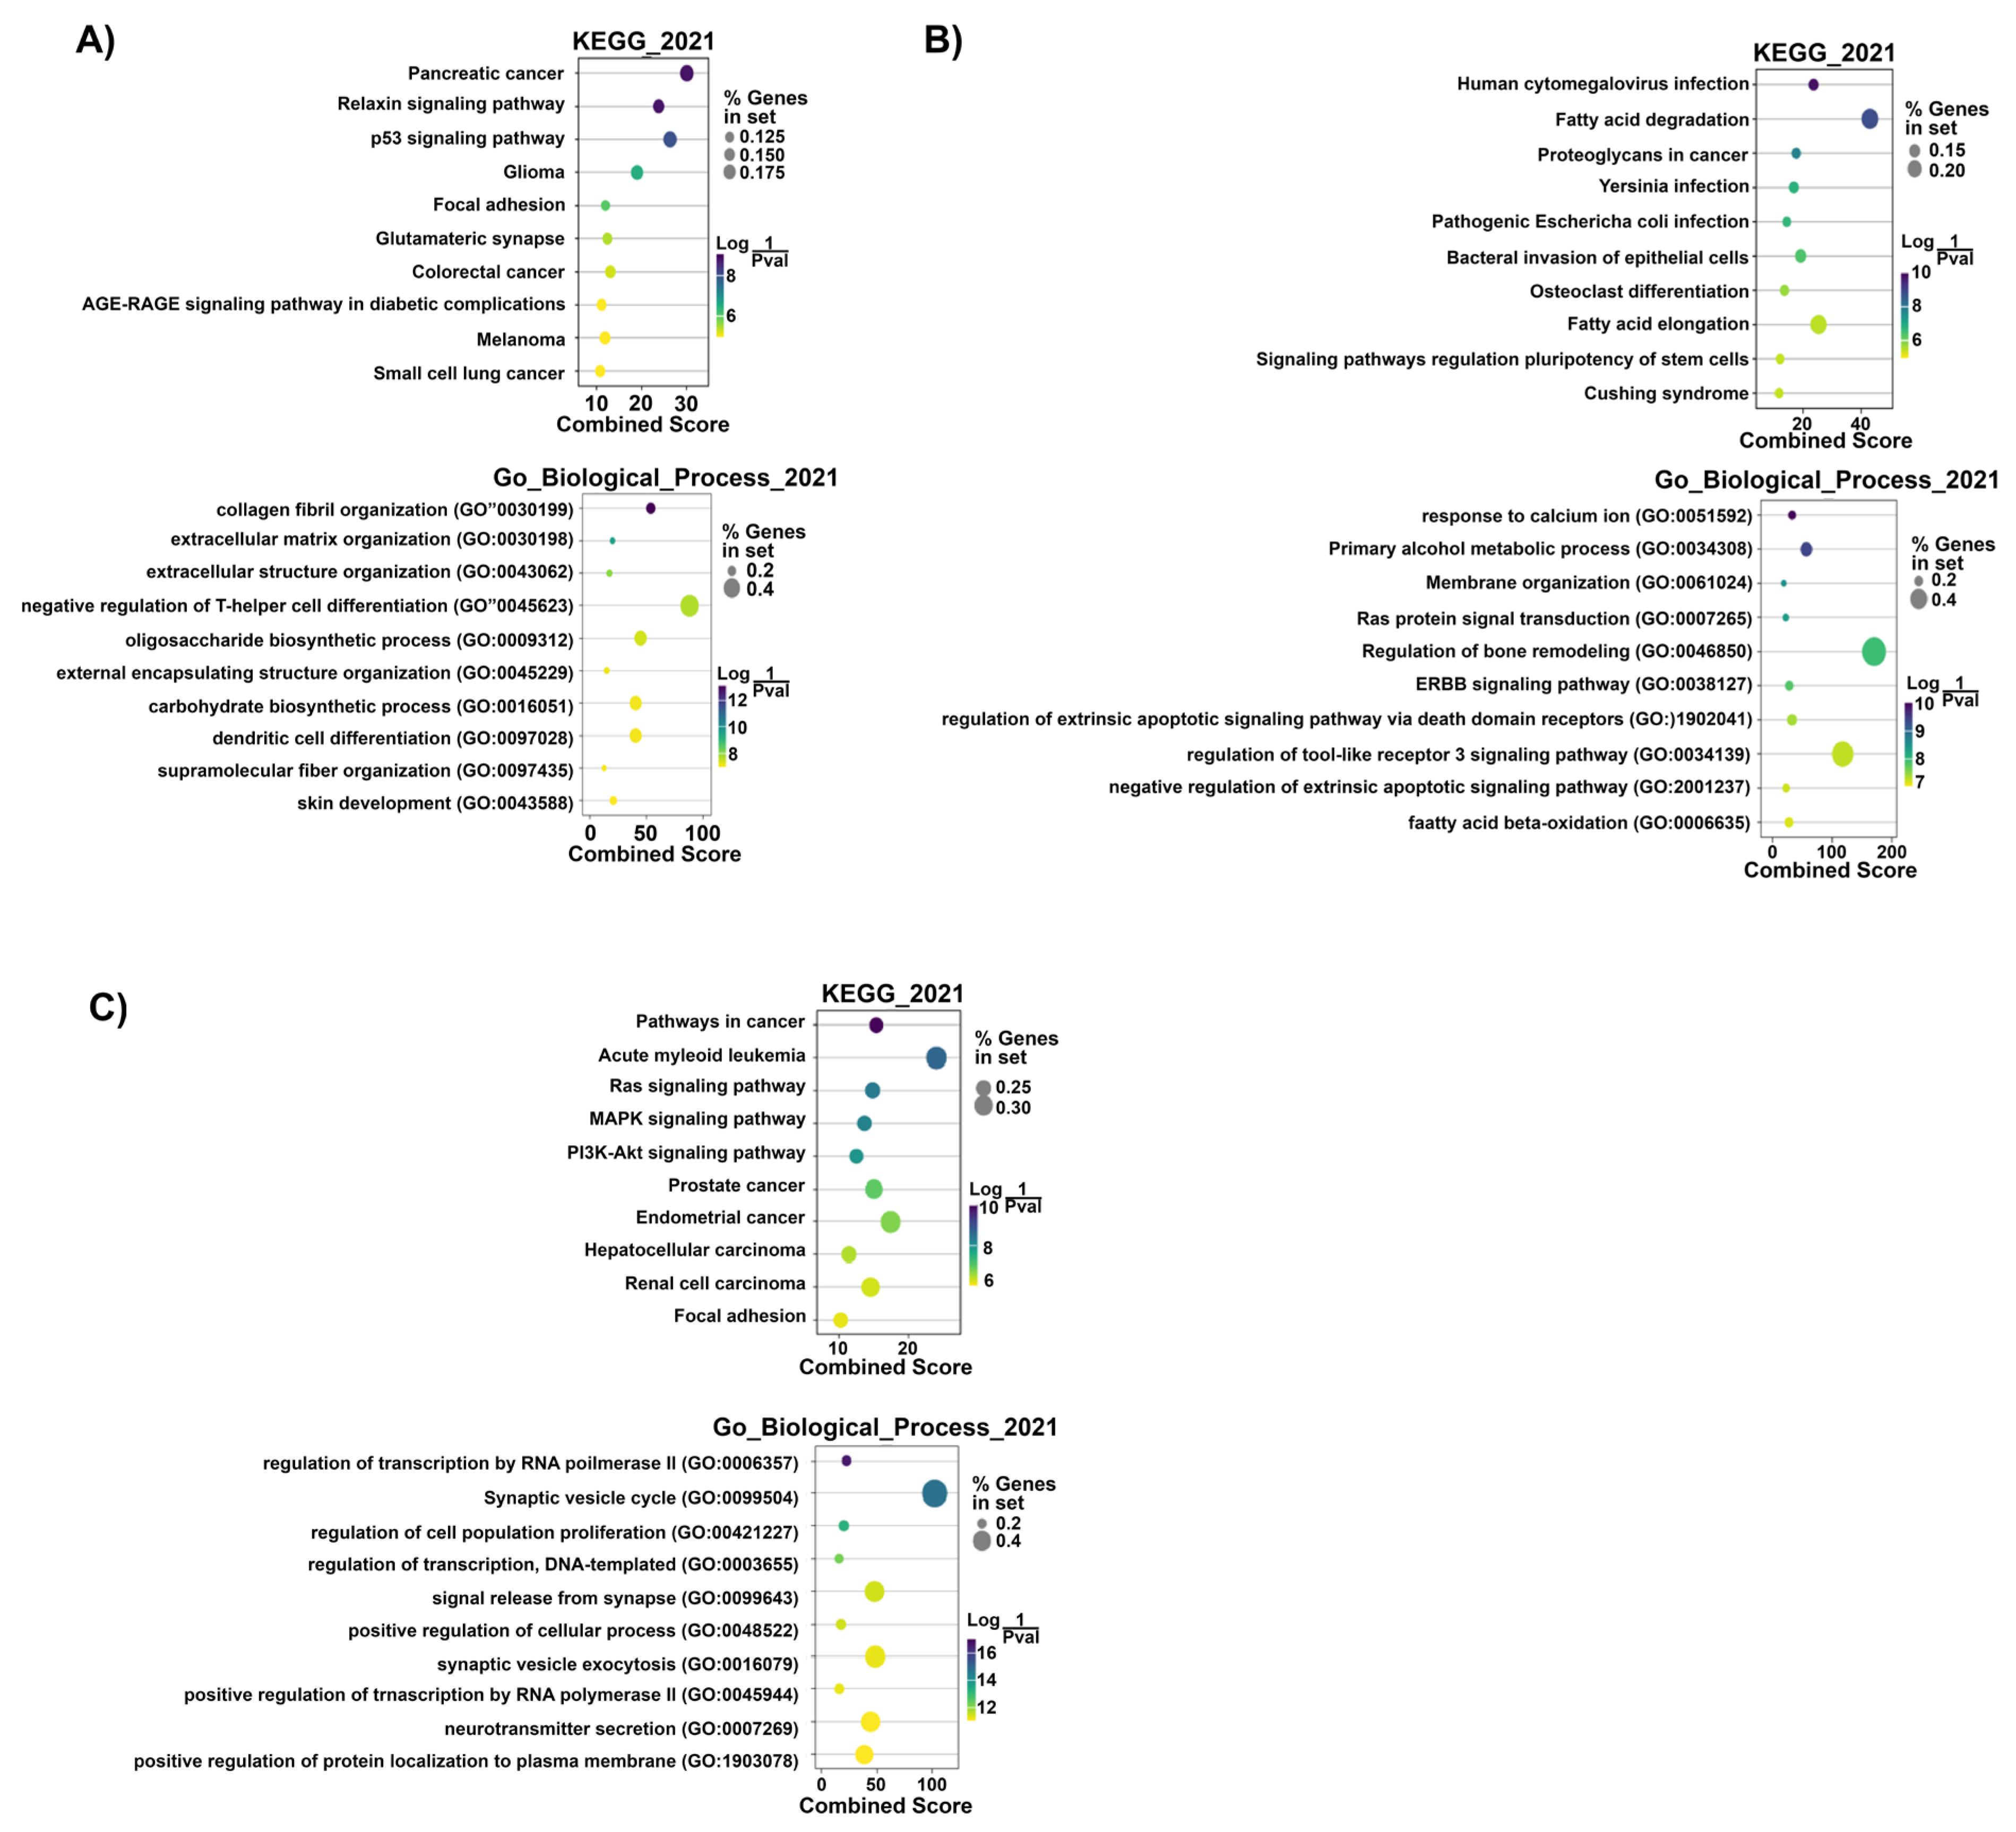
Prediction of Target mRNAs and Pathways Analysis
- (A)
- Prediction of target mRNAs and pathways in silico analysis- ‘Target MRNA List 1’
- (B) Prediction of target mRNAs that negatively correlated with DEMirs, their pathways and biological processes in experimental analysis—‘Target MRNA List 2’
4. Discussion
Supplementary Materials
Author Contributions
Funding
Institutional Review Board Statement
Informed Consent Statement
Data Availability Statement
Acknowledgments
Conflicts of Interest
References
- Gordon, D.M. Hormonal-steroid therapy in ocular inflammations. Seminar 1955, 17, 11–14. [Google Scholar] [PubMed]
- Vajaranant, T.S.; Price, M.O.; Price, F.W.; Gao, W.; Wilensky, J.T.; Edward, D.P. Visual acuity and intraocular pressure after Descemet’s stripping endothelial keratoplasty in eyes with and without preexisting glaucoma. Ophthalmology 2009, 116, 1644–1650. [Google Scholar] [CrossRef] [PubMed]
- Jonas, J.B.; Akkoyun, I.; Kreissig, I.; Degenring, R.F. Diffuse diabetic macular oedema treated by intravitreal triamcinolone acetonide: A comparative, non-randomised study. Br. J. Ophthalmol. 2005, 89, 321. [Google Scholar] [CrossRef] [PubMed]
- Gregori, N.Z.; Rosenfeld, P.J.; Puliafito, C.A.; Flynn, H.W.; Lee, J.E.; Mavrofrides, E.C.; Smiddy, W.E.; Murray, T.G.; Berrocal, A.M.; Scott, I.U.; et al. One-year safety and efficacy of intravitreal triamcinolone acetonide for the management of macular edema secondary to central retinal vein occlusion. Retina 2006, 26, 889–895. [Google Scholar] [CrossRef]
- Schwartz, S.G.; Flynn, H.W.; Beer, P. Intravitreal Triamcinolone Acetonide Use in Diabetic Macular Edema: Illustrative Cases. Ophthalmic Surg. Lasers Imaging 2010, 41, 1–6. [Google Scholar] [CrossRef]
- Lowder, C.; Belfort, R.; Lightman, S.; Foster, C.S.; Robinson, M.R.; Schiffman, R.M.; Li, X.Y.; Cui, H.; Whitcup, S.M. Dexamethasone intravitreal implant for noninfectious intermediate or posterior uveitis. Arch. Ophthalmol. 2011, 129, 545–553. [Google Scholar] [CrossRef]
- Aref, A.A.; Scott, I.U.; Oden, N.L.; Ip, M.S.; Blodi, B.A.; Van Veldhuisen, P.C. Incidence, Risk Factors, and Timing of Elevated Intraocular Pressure After Intravitreal Triamcinolone Acetonide Injection for Macular Edema Secondary to Retinal Vein Occlusion: SCORE Study Report 15. JAMA Ophthalmol. 2015, 133, 1022–1029. [Google Scholar] [CrossRef]
- Kiddee, W.; Trope, G.E.; Sheng, L.; Beltran-Agullo, L.; Smith, M.; Strungaru, M.H.; Baath, J.; Buys, Y.M. Intraocular pressure monitoring post intravitreal steroids: A systematic review. Surv. Ophthalmol. 2013, 58, 291–310. [Google Scholar] [CrossRef]
- Campochiaro, P.A.; Brown, D.M.; Pearson, A.; Chen, S.; Boyer, D.; Ruiz-Moreno, J.; Garretson, B.; Gupta, A.; Hariprasad, S.M.; Bailey, C.; et al. Sustained delivery fluocinolone acetonide vitreous inserts provide benefit for at least 3 years in patients with diabetic macular edema. Ophthalmology 2012, 119, 2125–2132. [Google Scholar] [CrossRef]
- Chin, E.K.; Almeida, D.R.P.; Velez, G.; Xu, K.; Peraire, M.; Corbella, M.; Elshatory, Y.M.; Kwon, Y.H.; Gehrs, K.M.; Boldt, H.C.; et al. Ocular Hypertension after Intravitreal Dexamethasone (OZURDEX) Sustained-Release implant. Retina 2017, 37, 1345–1351. [Google Scholar] [CrossRef]
- Becker, B.; Mills, D.W. Corticosteroids and Intraocular Pressure. Arch. Ophthalmol. 1963, 70, 500–507. [Google Scholar] [CrossRef] [PubMed]
- Bartlett, J.D.; Woolley, T.W.; Adams, C.M. Identification of High Intraocular Pressure Responders to Topical Ophthalmic Corticosteroids. J. Ocul. Pharmacol. Ther. 1993, 9, 35–45. [Google Scholar] [CrossRef] [PubMed]
- Lewis, J.M.; Priddy, T.; Judd, J.; Gordon, M.O.; Kass, M.A.; Kolker, A.E.; Becker, B. Intraocular Pressure Response to Topical Dexamethasone as a Predictor for the Development of Primary Open-Angle Glaucoma. Am. J. Ophthalmol. 1988, 106, 607–612. [Google Scholar] [CrossRef] [PubMed]
- Armaly, M.F. Effect of Corticosteroids on Intraocular Pressure and Fluid Dynamics: I. The Effect of Dexamethasone in the Normal Eye. Arch. Ophthalmol. 1963, 70, 482–491. [Google Scholar] [CrossRef] [PubMed]
- Becker, B. Intraocular Pressure Response to Topical Corticosteroids. Investig. Ophthalmol. Vis. Sci. 1965, 4, 198–205. [Google Scholar]
- Feroze, K.B.; Zeppieri, M.; Khazaeni, L. Steroid-Induced Glaucoma. In StatPearls; National Library of Medicine: Bethesda, MD, USA, 2023. [Google Scholar]
- Gerzenstein, S.M.; Pletcher, M.T.; Cervino, A.C.L.; Tsinoremas, N.F.; Young, B.; Puliafito, C.A.; Fini, M.E.; Schwartz, S.G. Glucocorticoid Receptor Polymorphisms and Intraocular Pressure Response to Intravitreal Triamcinolone Acetonide. Ophthalmic Genet. 2008, 29, 166–170. [Google Scholar] [CrossRef]
- Fingert, J.H.; Alward, W.L.; Wang, K.; Yorio, T.; Clark, A.F. Assessment of SNPs associated with the human glucocorticoid receptor in primary open-angle glaucoma and steroid responders. Mol. Vis. 2010, 16, 596. [Google Scholar]
- Haribalaganesh, R.; Gowri Priya, C.; Sharmila, R.; Krishnadas, S.; Muthukkaruppan, V.; Willoughby, C.E.; Senthilkumari, S. Assessment of differential intraocular pressure response to dexamethasone treatment in perfusion cultured Indian cadaveric eyes. Sci. Rep. 2021, 11, 605. [Google Scholar] [CrossRef]
- Kathirvel, K.; Haribalaganesh, R.; Krishnadas, R.; Muthukkaruppan, V.; Willoughby, C.E.; Bharanidharan, D.; Senthilkumari, S. A Comparative Genome-Wide Transcriptome Analysis of Glucocorticoid Responder and Non-Responder Primary Human Trabecular Meshwork Cells. Genes 2022, 13, 882. [Google Scholar] [CrossRef]
- Guo, H.; Ingolia, N.T.; Weissman, J.S.; Bartel, D.P. Mammalian microRNAs predominantly act to decrease target mRNA levels. Nature 2010, 466, 835–840. [Google Scholar] [CrossRef]
- Mitchell, P.S.; Parkin, R.K.; Kroh, E.M.; Fritz, B.R.; Wyman, S.K.; Pogosova-Agadjanyan, E.L.; Peterson, A.; Noteboom, J.; O’Briant, K.C.; Allen, A.; et al. Circulating microRNAs as stable blood-based markers for cancer detection. Proc. Natl. Acad. Sci. USA 2008, 105, 10513–10518. [Google Scholar] [CrossRef] [PubMed]
- Kumar, S.; Reddy, P.H. MicroRNA-455-3p as a potential biomarker for Alzheimer’s disease: An update. Front. Aging Neurosci. 2018, 10, 41. [Google Scholar] [CrossRef] [PubMed]
- Liu, C.; Marioni, R.E.; Hedman, A.K.; Pfeiffer, L.; Tsai, P.C.; Reynolds, L.M.; Just, A.C.; Duan, Q.; Boer, C.G.; Tanaka, T.; et al. A DNA methylation biomarker of alcohol consumption. Mol. Psychiatry 2018, 23, 422–433. [Google Scholar] [CrossRef]
- Kim, M.; Zhang, X. The Profiling and Role of miRNAs in Diabetes Mellitus. J. Diabetes Clin. Res. 2019, 1, 5. [Google Scholar] [CrossRef] [PubMed]
- Hackler, L.; Wan, J.; Swaroop, A.; Qian, J.; Zack, D.J. MicroRNA profile of the developing mouse retina. Investig. Ophthalmol. Vis. Sci. 2010, 51, 1823–1831. [Google Scholar] [CrossRef]
- Busskamp, V.; Krol, J.; Nelidova, D.; Daum, J.; Szikra, T.; Tsuda, B.; Jüttner, J.; Farrow, K.; Scherf, B.G.; Alvarez, C.P.P.; et al. MiRNAs 182 and 183 Are Necessary to Maintain Adult Cone Photoreceptor Outer Segments and Visual Function. Neuron 2014, 83, 586–600. [Google Scholar] [CrossRef]
- Tanaka, Y.; Tsuda, S.; Kunikata, H.; Sato, J.; Kokubun, T.; Yasuda, M.; Nishiguchi, K.M.; Inada, T.; Nakazawa, T. Profiles of extracellular miRNAs in the aqueous humor of glaucoma patients assessed with a microarray system. Sci. Rep. 2014, 4, 5089. [Google Scholar] [CrossRef]
- Jayaram, H.; Phillips, J.I.; Lozano, D.C.; Choe, T.E.; Cepurna, W.O.; Johnson, E.C.; Morrison, J.C.; Gattey, D.M.; Saugstad, J.A.; Keller, K.E. Comparison of microRNA expression in aqueous humor of normal and primary open-angle glaucoma patients using PCR arrays: A pilot study. Investig. Ophthalmol. Vis. Sci. 2017, 58, 2884–2890. [Google Scholar] [CrossRef]
- Hubens, W.H.G.; Krauskopf, J.; Beckers, H.J.M.; Kleinjans, J.C.S.; Webers, C.A.B.; Gorgels, T.G.M.F. Small RNA sequencing of aqueous humor and plasma in patients with primary open-angle glaucoma. Investig. Ophthalmol. Vis. Sci. 2021, 62, 24. [Google Scholar] [CrossRef]
- Kosior-Jarecka, E.; Czop, M.; Gasińska, K.; Wróbel-Dudzińska, D.; Zalewski, D.P.; Bogucka-Kocka, A.; Kocki, J.; Żarnowski, T. MicroRNAs in the aqueous humor of patients with different types of glaucoma. Graefe’s Arch. Clin. Exp. Ophthalmol. 2021, 259, 2337–2349. [Google Scholar] [CrossRef]
- Polansky, J.R.; Kurtz, R.M.; Fauss, D.J.; Kim, R.Y.; Bloom, E. In Vitro Correlates of Glucocorticoid Effects on Intraocular Pressure. In Glaucoma Update IV; Springer: Berlin/Heidelberg, Germany, 1991; pp. 20–29. [Google Scholar]
- Li, G.; Luna, C.; Qiu, J.; Epstein, D.L.; Gonzalez, P. Modulation of inflammatory markers by miR-146a during replicative senescence in trabecular meshwork cells. Investig. Ophthalmol. Vis. Sci. 2010, 51, 2976–2985. [Google Scholar] [CrossRef] [PubMed]
- Zhao, J.; Du, X.; Wang, M.; Yang, P.; Zhang, J. Salidroside mitigates hydrogen peroxide-induced injury by enhancement of microRNA-27a in human trabecular meshwork cells. Artif. Cells, Nanomed. Biotechnol. 2019, 47, 1758–1765. [Google Scholar] [CrossRef] [PubMed]
- Shen, W.; Wang, C.; Huang, B. Oxidative Stress-Induced circHBEGF Promotes Extracellular Matrix Production via Regulating miR-646/EGFR in Human Trabecular Meshwork Cells. Oxid. Med. Cell. Longev. 2020, 2020, 4692034. [Google Scholar] [CrossRef] [PubMed]
- Youngblood, H.; Cai, J.; Drewry, M.D.; Helwa, I.; Hu, E.; Liu, S.; Yu, H.; Mu, H.; Hu, Y.; Perkumas, K.; et al. Expression of mRNAs, miRNAs, and lncRNAs in human trabecular meshwork cells upon mechanical stretch. Investig. Ophthalmol. Vis. Sci. 2020, 61, 2. [Google Scholar] [CrossRef] [PubMed]
- Clayton, S.A.; Jones, S.W.; Kurowska-Stolarska, M.; Clark, A.R. The role of microRNAs in glucocorticoid action. J. Biol. Chem. 2018, 293, 1865–1874. [Google Scholar] [CrossRef]
- Yemanyi, F.; Vranka, J.; Raghunathan, V.K. Glucocorticoid-induced cell-derived matrix modulates transforming growth factor β2 signaling in human trabecular meshwork cells. Sci. Rep. 2020, 10, 15641. [Google Scholar] [CrossRef]
- Whirledge, S.; DeFranco, D.B. Glucocorticoid signaling in health and disease: Insights from tissue-Specific GR knockout mice. Endocrinology 2018, 159, 46–61. [Google Scholar] [CrossRef]
- Kathirvel, K.; Karen, L.; Haribalaganesh, R.; Krishnadas, R.; Muthukkaruppan, V.; Lane, B.; Simpson, D.A.; Goljanek-Whysall, K.; Sheridan, C.; Bharanidharan, D.; et al. Short and long-term effect of dexamethasone on the transcriptome profile of primary human trabecular meshwork cells in vitro. Sci. Rep. 2022, 12, 8299. [Google Scholar] [CrossRef]
- Stamer, W.D.; Seftor, R.E.B.; Williams, S.K.; Samaha, H.A.M.; Snyder, R.W. Isolation and culture of human trabecular meshwork cells by extracellular matrix digestion. Curr. Eye Res. 1995, 14, 611–617. [Google Scholar] [CrossRef]
- Ashwinbalaji, S.; Senthilkumari, S.; Gowripriya, C.; Krishnadas, S.; Gabelt, B.A.T.; Kaufman, P.L.; Muthukkaruppan, V. SB772077B, A New Rho Kinase Inhibitor Enhances Aqueous Humour Outflow Facility in Human Eyes. Sci. Rep. 2018, 8, 15472. [Google Scholar] [CrossRef]
- Keller, K.E.; Bhattacharya, S.K.; Borrás, T.; Brunner, T.M.; Chansangpetch, S.; Clark, A.F.; Dismuke, W.M.; Du, Y.; Elliott, M.H.; Ethier, C.R.; et al. Consensus recommendations for trabecular meshwork cell isolation, characterization and culture. Exp. Eye Res. 2018, 171, 164–173. [Google Scholar] [CrossRef] [PubMed]
- Fang, Z.; Liu, X.; Peltz, G. GSEApy: A comprehensive package for performing gene set enrichment analysis in Python. Bioinformatics 2023, 39, btac757. [Google Scholar] [CrossRef] [PubMed]
- Fini, M.E.; Schwartz, S.G.; Gao, X.; Jeong, S.; Patel, N.; Itakura, T.; Price, M.O.; Price, F.W.; Varma, R.; Stamer, W.D. Steroid-induced ocular hypertension/glaucoma: Focus on pharmacogenomics and implications for precision medicine. Prog. Retin. Eye Res. 2017, 56, 58–83. [Google Scholar] [CrossRef] [PubMed]
- Clark, A.F.; Wordinger, R.J. The role of steroids in outflow resistance. Exp. Eye Res. 2009, 88, 752–759. [Google Scholar] [CrossRef] [PubMed]
- Liesenborghs, I.; Eijssen, L.M.T.; Kutmon, M.; Gorgels, T.G.M.F.; Evelo, C.T.; Beckers, H.J.M.; Webers, C.A.B.; Schouten, J.S.A.G. The Molecular Processes in the Trabecular Meshwork After Exposure to Corticosteroids and in Corticosteroid-Induced Ocular Hypertension. Investig. Opthalmol. Vis. Sci. 2020, 61, 24. [Google Scholar] [CrossRef]
- Li, G.; Luna, C.; Qiu, J.; Epstein, D.L.; Gonzalez, P. Alterations in microRNA expression in stress-induced cellular senescence. Mech. Ageing Dev. 2009, 130, 731–741. [Google Scholar] [CrossRef]
- Clark, A.F.; Wilson, K.; McCartney, M.D.; Miggans, S.T.; Kunkle, M.; Howe, W. Glucocorticoid-induced formation of cross-linked actin networks in cultured human trabecular meshwork cells. Investig. Ophthalmol. Vis. Sci. 1994, 35, 281–294. [Google Scholar]
- Clark, A.F.; Wilson, K.; De Kater, A.W.; Allingham, R.R.; McCartney, M.D. Dexamethasone-induced ocular hypertension in perfusion-cultured human eyes. Investig. Ophthalmol. Vis. Sci. 1995, 36, 478–489. [Google Scholar]
- Wordinger, R.J.; Clark, A.F.; Agarwal, R.; Lambert, W.; Wilson, S.E. Expression of alternatively spliced growth factor receptor isoforms in the human trabecular meshwork. Investig. Ophthalmol. Vis. Sci. 1999, 40, 242–247. [Google Scholar]
- Zhou, L.; Li, Y.; Yue, B.Y. Glucocorticoid effects on extracellular matrix proteins and integrins in bovine trabecular meshwork cells in relation to glaucoma. Int. J. Mol. Med. 1998, 1, 339–346. [Google Scholar] [CrossRef]
- Tane, N.; Dhar, S.; Roy, S.; Pinheiro, A.; Ohira, A.; Roy, S. Effect of excess synthesis of extracellular matrix components by trabecular meshwork cells: Possible consequence on aqueous outflow. Exp. Eye Res. 2007, 84, 832–842. [Google Scholar] [CrossRef] [PubMed]
- Zhang, X.; Ognibene, C.M.; Clark, A.F.; Yorio, T. Dexamethasone inhibition of trabecular meshwork cell phagocytosis and its modulation by glucocorticoid receptor β. Exp. Eye Res. 2007, 84, 275–284. [Google Scholar] [CrossRef] [PubMed]
- Stamer, W.D.; Clark, A.F. The many faces of the trabecular meshwork cell. Exp. Eye Res. 2017, 158, 112–123. [Google Scholar] [CrossRef] [PubMed]
- Drewry, M.D.; Challa, P.; Kuchtey, J.G.; Navarro, I.; Helwa, I.; Hu, Y.; Mu, H.; Stamer, W.D.; Kuchtey, R.W.; Liu, Y. Differentially expressed microRNAs in the aqueous humor of patients with exfoliation glaucoma or primary open-angle glaucoma. Hum. Mol. Genet. 2018, 27, 1263–1275. [Google Scholar] [CrossRef] [PubMed]
- Shen, W.; Han, Y.; Huang, B.; Qi, Y.; Xu, L.; Guo, R.; Wang, X.; Wang, J. MicroRNA-483-3p inhibits extracellular matrix production by targeting smad4 in human trabecular meshwork cells. Investig. Ophthalmol. Vis. Sci. 2015, 56, 8419–8427. [Google Scholar] [CrossRef]
- Pepe, F.; Visone, R.; Veronese, A. The Glucose-Regulated MiR-483-3p Influences Key Signaling Pathways in Cancer. Cancers 2018, 10, 181. [Google Scholar] [CrossRef]
- Vreugdenhil, E.; Verissimo, C.S.L.; Mariman, R.; Kamphorst, J.T.; Barbosa, J.S.; Zweers, T.; Champagne, D.L.; Schouten, T.; Meijer, O.C.; De Ron Kloet, E.; et al. MicroRNA 18 and 124a down-regulate the glucocorticoid receptor: Implications for glucocorticoid responsiveness in the brain. Endocrinology 2009, 150, 2220–2228. [Google Scholar] [CrossRef]
- Wang, S.S.; Mu, R.H.; Li, C.F.; Dong, S.Q.; Geng, D.; Liu, Q.; Yi, L.T. microRNA-124 targets glucocorticoid receptor and is involved in depression-like behaviors. Prog. Neuro-Psychopharmacol. Biol. Psychiatry 2017, 79, 417–425. [Google Scholar] [CrossRef]
- Liu, K.; Zhang, X.; Wei, W.; Liu, X.; Tian, Y.; Han, H.; Zhang, L.; Wu, W.; Chen, J. Myostatin/smad4 signaling-mediated regulation of mir-124-3p represses glucocorticoid receptor expression and inhibits adipocyte differentiation. Am. J. Physiol. Endocrinol. Metab. 2019, 316, E635–E645. [Google Scholar] [CrossRef]
- Kim, J.; Jeong, D.; Nam, J.; Aung, T.N.; Gim, J.A.; Park, K.U.; Kim, S.W. MicroRNA-124 regulates glucocorticoid sensitivity by targeting phosphodiesterase 4B in diffuse large B cell lymphoma. Gene 2015, 558, 173–180. [Google Scholar] [CrossRef]
- Xu, J.; Wang, R.; Liu, Y.; Liu, D.; Jiang, H.; Pan, F. FKBP5 and specific microRNAs via glucocorticoid receptor in the basolateral amygdala involved in the susceptibility to depressive disorder in early adolescent stressed rats. J. Psychiatr. Res. 2017, 95, 102–113. [Google Scholar] [CrossRef] [PubMed]
- Rauz, S.; Cheung, C.M.G.; Wood, P.J.; Coca-Prados, M.; Walker, E.A.; Murray, P.I.; Stewart, P.M. Inhibition of 11β-hydroxysteroid dehydrogenase type of 1 lowers intraocular pressure in patients with ocular hypertension. QJM-Mon. J. Assoc. Physicians 2003, 96, 481–490. [Google Scholar] [CrossRef]
- Choi, K.J.; Na, Y.J.; Park, S.B.; Jung, W.H.; Sung, H.R.; Kim, K.Y. Carbenoxolone prevents chemical eye ischemia-reperfusion-induced cell death via 11β-hydroxysteroid dehydrogenase type 1 inhibition. Pharmacol. Res. 2017, 123, 62–72. [Google Scholar] [CrossRef] [PubMed]
- Choi, K.J.; Na, Y.J.; Jung, W.H.; Park, S.B.; Kang, S.; Nam, H.J.; Ahn, J.H.; Kim, K.Y. Protective effect of a novel selective 11β-HSD1 inhibitor on eye ischemia-reperfusion induced glaucoma. Biochem. Pharmacol. 2019, 169, 113632. [Google Scholar] [CrossRef] [PubMed]
- McEwen, B.S.; De Kloet, E.R.; Rostene, W. Adrenal steroid receptors and actions in the nervous system. Physiol. Rev. 1986, 66, 1121–1188. [Google Scholar] [CrossRef]
- Gould, E.; Tanapat, P. Stress and hippocampal neurogenesis. In Proceedings of the Biological Psychiatry. Biol. Psychiatry 1999, 46, 1472–1479. [Google Scholar] [CrossRef]
- Glick, R.D.; Medary, I.; Aronson, D.C.; Scotto, K.W.; Swendeman, S.L.; La Quaglia, M.P. The effects of serum depletion and dexamethasone on growth and differentiation of human neuroblastoma cell lines. J. Pediatr. Surg. 2000, 35, 465–472. [Google Scholar] [CrossRef]
- Wang, W.Y.; Pan, L.; Su, S.C.; Quinn, E.J.; Sasaki, M.; Jimenez, J.C.; MacKenzie, I.R.A.; Huang, E.J.; Tsai, L.H. Interaction of FUS and HDAC1 regulates DNA damage response and repair in neurons. Nat. Neurosci. 2013, 16, 1383–1391. [Google Scholar] [CrossRef]
- Zloto, O.; Skaat, A.; Fabian, I.D.; Rosner, M.; Ziv, H.; Leshno, A.; Melamed, S. The distribution of relaxin receptors in the anterior segment of primary open-angle glaucoma patients. Indian J. Ophthalmol. 2020, 68, 2117–2120. [Google Scholar] [CrossRef]
- Hisaw, F.L. Experimental relaxation of the pubic ligament of the guinea pig. Proc. Soc. Exp. Biol. Med. 1926, 23, 661–663. [Google Scholar] [CrossRef]
- Bathgate, R.; Dschietzig, T.; Gundlach, A.L.; Halls, M.; Summers, R. Relaxin family peptide receptors in GtoPdb v.2021.3. IUPHAR/BPS Guide Pharmacol. CITE 2021, 2021. [Google Scholar] [CrossRef]
- Paterson, G.D.; Miller, S.J. Hormonal influence in simple Glaucoma. A Preliminary report. Br. J. Ophthalmol. 1963, 47, 129–137. [Google Scholar] [CrossRef] [PubMed]
- Chen, T.Y.; Li, X.; Hung, C.H.; Bahudhanapati, H.; Tan, J.; Kass, D.J.; Zhang, Y. The relaxin family peptide receptor 1 (RXFP1): An emerging player in human health and disease. Mol. Genet. Genom. Med. 2020, 8, e1194. [Google Scholar] [CrossRef] [PubMed]
- Ng, H.H.; Shen, M.; Samuel, C.S.; Schlossmann, J.; Bennett, R.G. Relaxin and extracellular matrix remodeling: Mechanisms and signaling pathways. Mol. Cell. Endocrinol. 2019, 487, 59–65. [Google Scholar] [CrossRef] [PubMed]


| List of Overlapping miRNAs from Group #3 | |||||||
| miRNA | Group #1 | Group #2 | |||||
| logFC | logCPM | p-Value | logFC | logCPM | p-Value | ||
| hsa-miR-675-3p | 4.86 | 0.11 | 8.01 × 10⁻⁴ | 3.63 | 2.61 | 0.01 | |
| hsa-miR-483-3p | 4.61 | 2.88 | 1.01 × 10⁻⁴ | 4.05 | 3.36 | 5.60 × 10⁻⁵ | |
| hsa-miR-675-5p | 4.59 | 1.20 | 2.88 × 10⁻⁴ | 3.67 | 3.14 | 0.00 | |
| hsa-miR-483-5p | 4.31 | 0.82 | 1.16 × 10⁻⁴ | 4.65 | 1.20 | 4.42 × 10⁻⁶ | |
| hsa-miR-5690 | 3.61 | −1.26 | 0.00 | 2.15 | −0.79 | 0.02 | |
| hsa-miR-6842-3p | 1.50 | 1.33 | 0.02 | 1.50 | 2.08 | 0.01 | |
| hsa-miR-335-3p | −3.03 | 8.41 | 1.01 × 10⁻⁴ | −1.93 | 8.56 | 0.00 | |
| List of Up/Down-regulated miRNAs from Group #4 | |||||||
| Up-regulated miRNAs | Down-regulated miRNAs | ||||||
| miRNA | logFC | logCPM | p-Value | miRNA | logFC | logCPM | p-Value |
| hsa-miR-2114-3p | 6.07 | −1.16 | 4.25 × 10⁻⁴ | hsa-miR-335-5p | −1.71 | 6.75 | 0.02 |
| hsa-miR-2114-5p | 3.17 | −0.83 | 0.02 | hsa-miR-549a-5p | −2.15 | 0.89 | 0.02 |
| hsa-miR-7151-3p | −3.08 | −0.31 | 0.03 | ||||
| hsa-miR-124-3p | −6.21 | −0.81 | 0.01 | ||||
| List of Up/Down-regulated miRNAs from Group #5 | |||||||
| Up-regulated miRNAs | Down-regulated miRNAs | ||||||
| miRNA | logFC | logCPM | p-Value | miRNA | logFC | logCPM | p-Value |
| hsa-miR-4485-5p | 4.73 | 1.01 | 2.89 × 10⁻⁴ | hsa-miR-181b-2-3p | −1.21 | 0.85 | 0.04 |
| hsa-miR-12136 | 4.39 | 7.32 | 0.00 | hsa-miR-486-3p | −1.34 | 2.38 | 0.05 |
| hsa-miR-4328 | 4.11 | −0.38 | 0.02 | hsa-miR-6853-3p | −1.80 | −0.69 | 0.03 |
| hsa-miR-320a-5p | 3.47 | 1.78 | 0.00 | hsa-miR-550a-3p | −2.06 | −0.14 | 0.03 |
| hsa-miR-4485-3p | 3.07 | 3.57 | 0.00 | hsa-miR-9-3p | −4.88 | −1.33 | 0.02 |
| hsa-miR-10396b-5p | 2.66 | −0.69 | 0.01 | ||||
| hsa-miR-10396a-5p | 2.60 | −0.72 | 0.01 | ||||
| hsa-miR-3195 | 2.44 | −0.73 | 0.04 | ||||
| hsa-miR-1246 | 2.24 | 1.01 | 0.01 | ||||
| ||
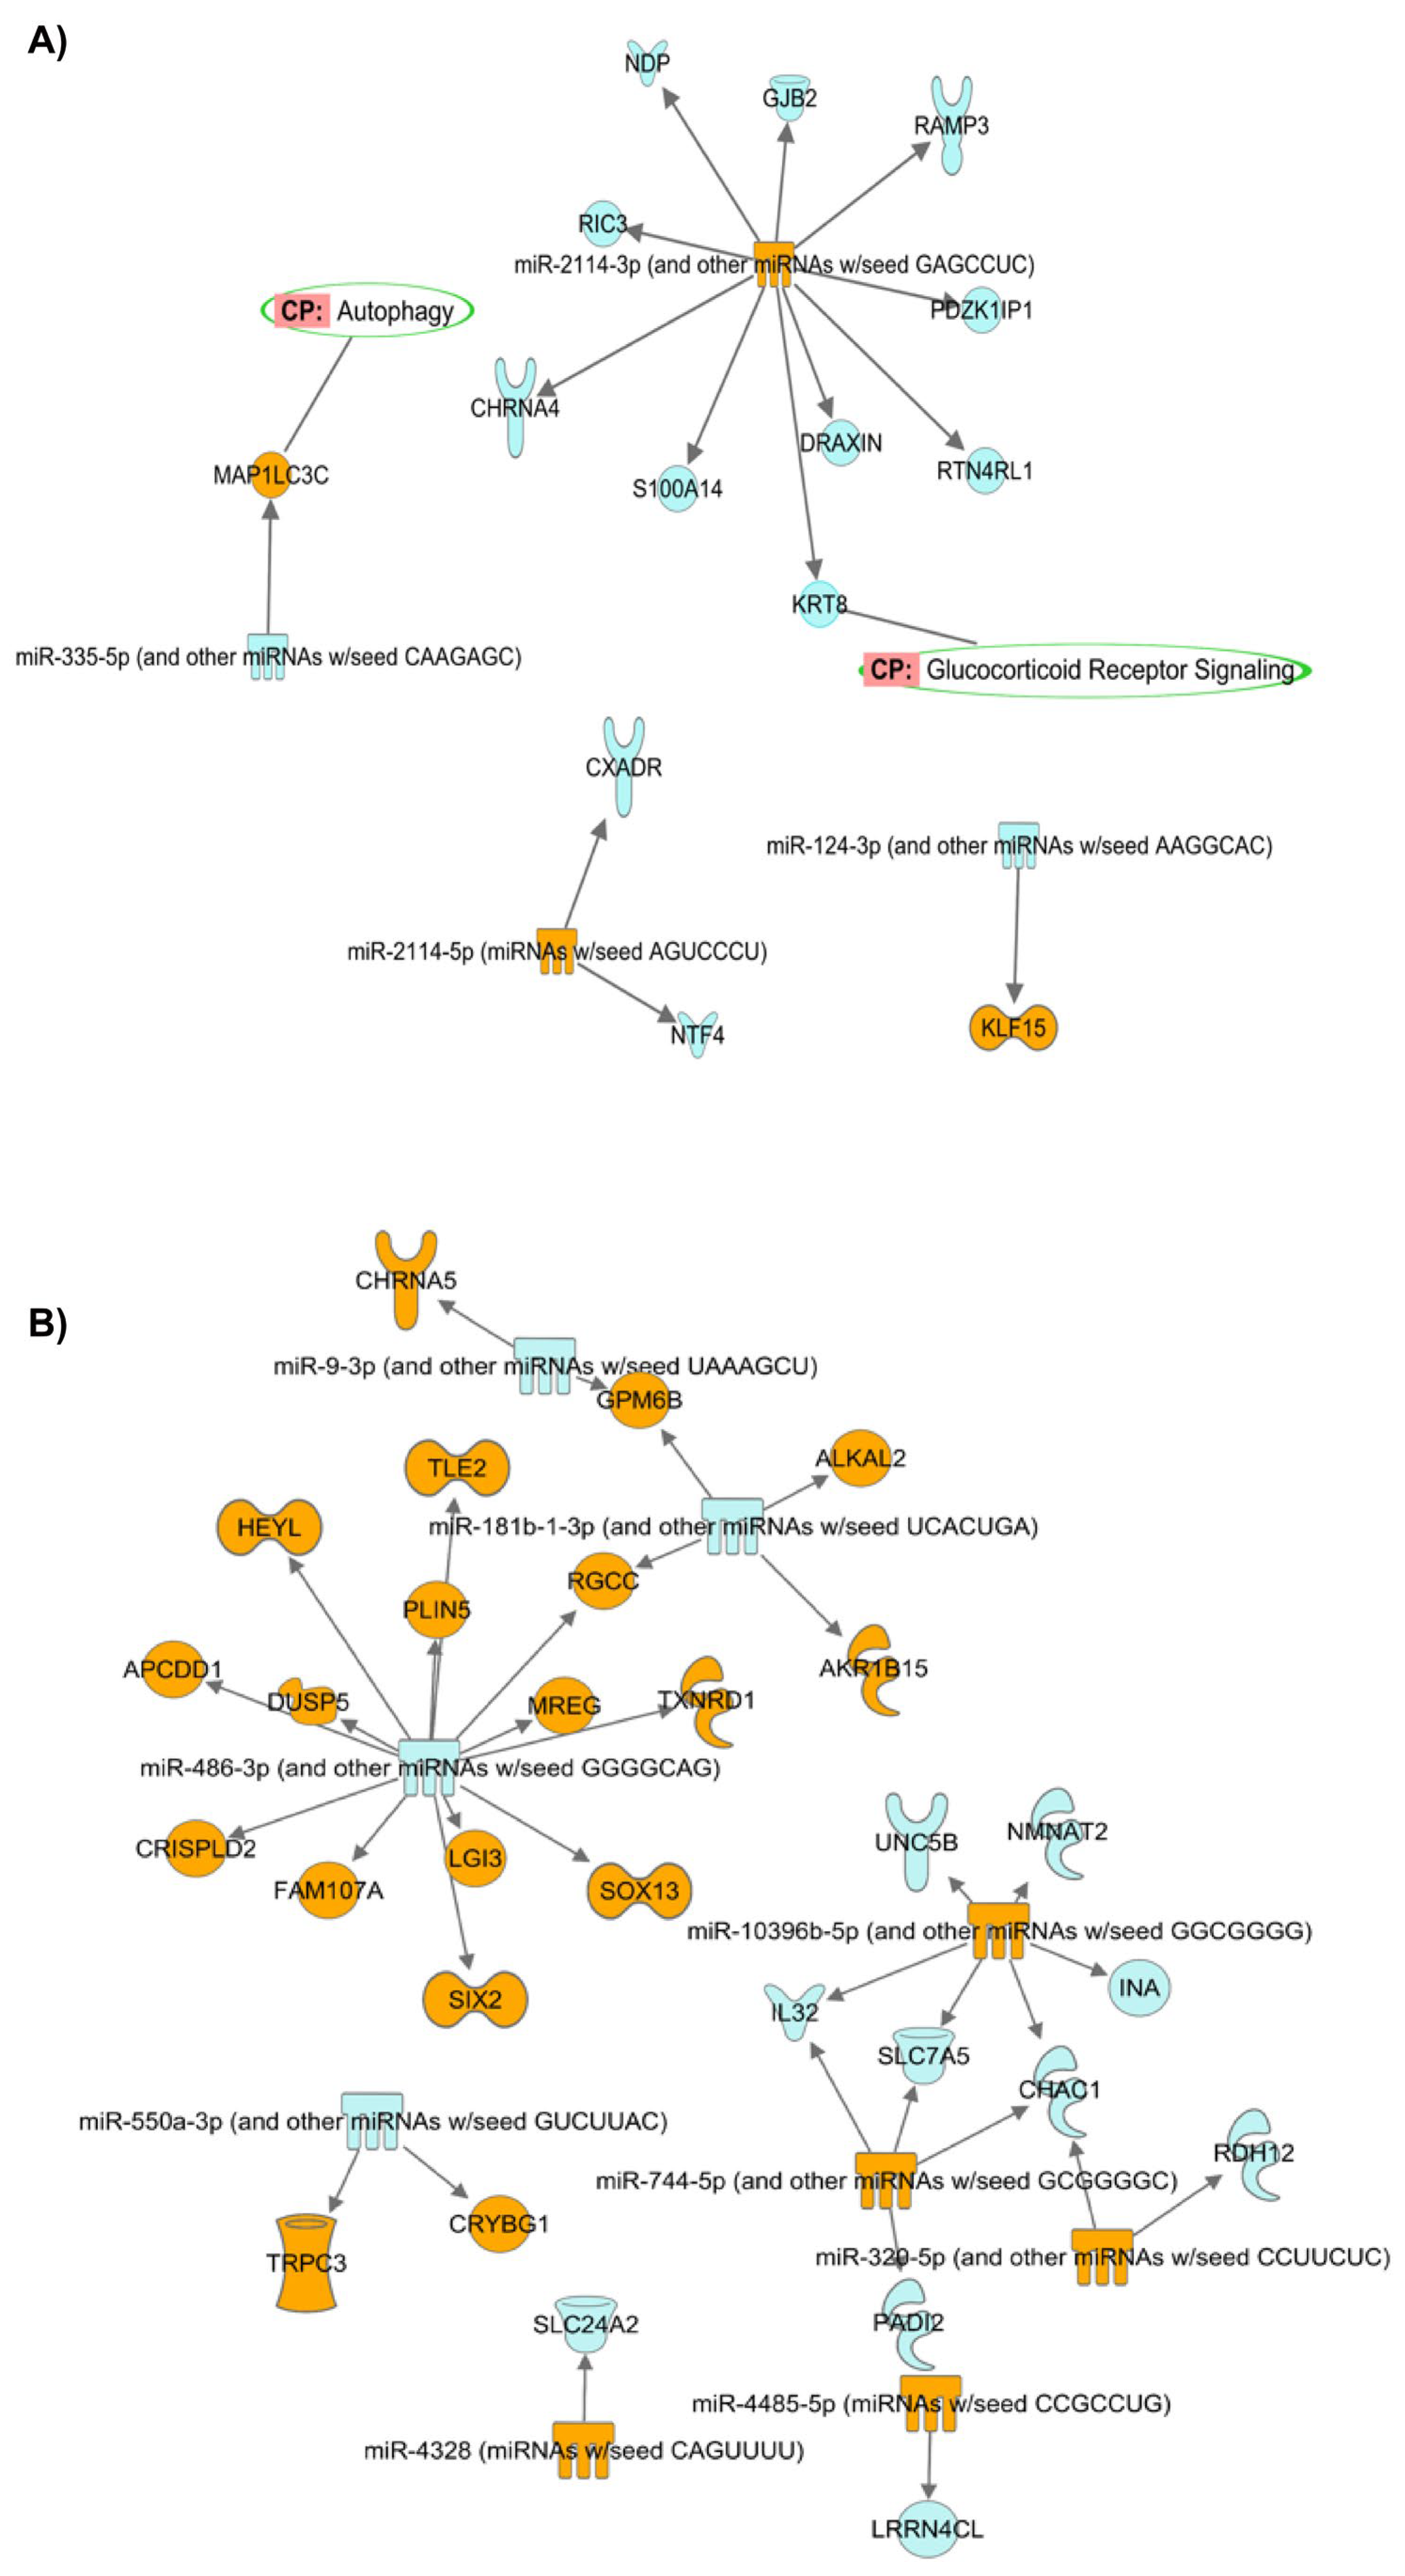
| ID of DEMIRs | Count of Target mRNAs | ID of Target mRNAs |
| hsa-miR-483-5p | 1 | RGS16 |
| hsa-miR-6842-3p | 1 | NGFR |
| ||
| hsa-miR-124-3p | 1 | KLF15 |
| hsa-miR-2114-3p | 11 | CHRNA4, DRAXIN, GJB2, JCHAIN, KRT8, NDP, PDZK1IP1, RAMP3, RIC3, RTN4RL1, S100A14 |
| hsa-miR-2114-5p | 2 | CXADR, NTF4 |
| hsa-miR-335-5p | 1 | MAP1LC3C |
| ||
| hsa-miR-10396b-5p | 4 | CHAC1, INA, NMNAT2, UNC5B |
| hsa-miR-181b-2-3p | 1 | ALKAL2 |
| hsa-miR-320a-5p | 1 | CHAC1 |
| hsa-miR-4328 | 1 | SLC24A2 |
| hsa-miR-486-3p | 4 | DUSP5, LGI3, MREG, SOX13 |
| hsa-miR-10396a-5p | 3 | CHAC1, IL32, SLC7A5 |
Disclaimer/Publisher’s Note: The statements, opinions and data contained in all publications are solely those of the individual author(s) and contributor(s) and not of MDPI and/or the editor(s). MDPI and/or the editor(s) disclaim responsibility for any injury to people or property resulting from any ideas, methods, instructions or products referred to in the content. |
© 2023 by the authors. Licensee MDPI, Basel, Switzerland. This article is an open access article distributed under the terms and conditions of the Creative Commons Attribution (CC BY) license (https://creativecommons.org/licenses/by/4.0/).
Share and Cite
Kathirvel, K.; Fan, X.; Haribalaganesh, R.; Bharanidharan, D.; Sharmila, R.; Krishnadas, R.; Muthukkaruppan, V.; Willoughby, C.E.; Senthilkumari, S. Small RNA Sequencing Reveals a Distinct MicroRNA Signature between Glucocorticoid Responder and Glucocorticoid Non-Responder Primary Human Trabecular Meshwork Cells after Dexamethasone Treatment. Genes 2023, 14, 2012. https://doi.org/10.3390/genes14112012
Kathirvel K, Fan X, Haribalaganesh R, Bharanidharan D, Sharmila R, Krishnadas R, Muthukkaruppan V, Willoughby CE, Senthilkumari S. Small RNA Sequencing Reveals a Distinct MicroRNA Signature between Glucocorticoid Responder and Glucocorticoid Non-Responder Primary Human Trabecular Meshwork Cells after Dexamethasone Treatment. Genes. 2023; 14(11):2012. https://doi.org/10.3390/genes14112012
Chicago/Turabian StyleKathirvel, Kandasamy, Xiaochen Fan, Ravinarayanan Haribalaganesh, Devarajan Bharanidharan, Rajendrababu Sharmila, Ramasamy Krishnadas, Veerappan Muthukkaruppan, Colin E. Willoughby, and Srinivasan Senthilkumari. 2023. "Small RNA Sequencing Reveals a Distinct MicroRNA Signature between Glucocorticoid Responder and Glucocorticoid Non-Responder Primary Human Trabecular Meshwork Cells after Dexamethasone Treatment" Genes 14, no. 11: 2012. https://doi.org/10.3390/genes14112012
APA StyleKathirvel, K., Fan, X., Haribalaganesh, R., Bharanidharan, D., Sharmila, R., Krishnadas, R., Muthukkaruppan, V., Willoughby, C. E., & Senthilkumari, S. (2023). Small RNA Sequencing Reveals a Distinct MicroRNA Signature between Glucocorticoid Responder and Glucocorticoid Non-Responder Primary Human Trabecular Meshwork Cells after Dexamethasone Treatment. Genes, 14(11), 2012. https://doi.org/10.3390/genes14112012