
Survival and Enrichment Analysis of Epithelial–Mesenchymal Transition Genes in Bladder Urothelial Carcinoma

Abstract
1. Introduction
2. Materials and Methods
2.1. Selection of Genes
2.2. Survival Analysis
2.3. Expression Analysis
2.4. Network & Enrichment Analysis
2.5. Tumor Immune Microenvironment Analysis
3. Results
3.1. Survival Analysis
3.2. Expression Analysis
3.3. Identification of Further Gene Interactions and Enriched Biological Processes
3.3.1. Network Analysis
3.3.2. Enrichment Analysis
3.4. Correlation to Inflammation Mediators
3.4.1. Immunomodulator, Cytokine
3.4.2. Immune Cell Infiltrate
4. Discussion
Supplementary Materials
Author Contributions
Funding
Institutional Review Board Statement
Informed Consent Statement
Data Availability Statement
Conflicts of Interest
Appendix A

| Immunomodulators | Chemokines | Chemokines |
|---|---|---|
| ADORA2A | CCL1 | CX3CL1 |
| BTLA | CCL2 | CXCL1 |
| CD160 | CCL3 | CXCL2 |
| CD244 | CCL4 | CXCL3 |
| CD274 | CCL5 | CXCL5 |
| CD96 | CCL7 | CXCL6 |
| CSF1R | CCL8 | CXCL8 |
| CTLA4 | CCL11 | CXCL9 |
| HAVCR2 | CCL13 | CXCL10 |
| IDO1 | CCL14 | CXCL11 |
| IL10 | CCL15 | CXCL12 |
| IL10RB | CCL16 | CXCL13 |
| KDR | CCL17 | CXCL14 |
| KIR2DL1 | CCL18 | CXCL16 |
| KIR2DL3 | CCL19 | CXCL17 |
| LAG3 | CCL20 | XCL1 |
| LGALS9 | CCL21 | XCL2 |
| PDCD1 | CCL22 | |
| PDCD1LG2 | CCL23 | |
| PVRL2 | CCL24 | |
| TGFB1 | CCL25 | |
| TGFBR1 | CCL26 | |
| TIGIT | CCL27 | |
| VTCN1 | CCL28 |
| Gene of Interest | Immunomodulator Gene | rho |
|---|---|---|
| TBX3 | ||
| CXCL16 | −0.434 | |
| CXCL13 | −0.401 | |
| CXCL11 | −0.482 | |
| CXCL10 | −0.512 | |
| CXCL9 | −0.458 | |
| CXCL5 | −0.474 | |
| CXCL3 | −0.470 | |
| CXCL2 | −0.453 | |
| CXCL1 | −0.424 | |
| CCL26 | −0.489 | |
| CCL23 | −0.415 | |
| CCL18 | −0.469 | |
| CCL15 | 0.474 | |
| CCL13 | −0.411 | |
| CCL8 | −0.535 | |
| CCL7 | −0.544 | |
| CCL5 | −0.443 | |
| CCL4 | −0.570 | |
| CCL3 | −0.571 | |
| TIGIT | −0.416 | |
| TGFBR1 | −0.45 | |
| PDCD1LG2 | −0.654 | |
| PDCD1 | −0.4 | |
| LAG3 | −0.528 | |
| IL10 | −0.449 | |
| IDO1 | −0.464 | |
| HAVCR2 | −0.570 | |
| CTLA4 | −0.423 | |
| CSF1R | −0.562 | |
| CD274 | −0.507 | |
| NRP2 | ||
| CXCL13 | 0.454 | |
| CXCL12 | 0.647 | |
| CXCL11 | 0.426 | |
| CXCL10 | 0.453 | |
| CXCL9 | 0.490 | |
| CXCL2 | 0.408 | |
| CCL26 | 0.579 | |
| CCL23 | 0.461 | |
| CCL21 | 0.57 | |
| CCL19 | 0.426 | |
| CCL18 | 0.519 | |
| CCL13 | 0.488 | |
| CCL11 | 0.479 | |
| CCL8 | 0.525 | |
| CCL7 | 0.531 | |
| CCL5 | 0.432 | |
| CCL4 | 0.507 | |
| CCL3 | 0.501 | |
| CCL2 | 0.553 | |
| LAG3 | 0.434 | |
| TIGIT | 0.435 | |
| TGFBR1 | 0.550 | |
| PDCD1LG2 | 0.676 | |
| PDCD1 | 0.438 | |
| IL10 | 0.633 | |
| HAVCR2 | 0.633 | |
| CTLA4 | 0.460 | |
| CSF1R | 0.679 | |
| BTLA | 0.433 | |
| ADORA2A | 0.402 | |
| FOXA1 | ||
| CXCL12 | −0.419 | |
| CXCL11 | −0.401 | |
| CXCL10 | −0.446 | |
| CXCL9 | −0.415 | |
| CXCL5 | −0.450 | |
| CXCL3 | −0.425 | |
| CXCL2 | −0.471 | |
| CCL26 | −0.555 | |
| CCL23 | −0.426 | |
| CCL21 | −0.408 | |
| CCL18 | −0.474 | |
| CCL15 | 0.467 | |
| CCL13 | −0.469 | |
| CCL8 | −0.581 | |
| CCL7 | −0.589 | |
| CCL5 | −0.461 | |
| CCL4 | −0.547 | |
| CCL3 | −0.594 | |
| CCL2 | −0.498 | |
| TGFBR1 | −0.442 | |
| TGFB1 | −0.414 | |
| PDCD1LG2 | −0.687 | |
| LAG3 | −0.518 | |
| IL10 | −0.520 | |
| HAVCR2 | −0.572 | |
| CTLA4 | −0.425 | |
| CSF1R | −0.599 | |
| CD274 | −0.492 | |
| FN1 | ||
| TGFBR1 | 0.570 | |
| TGFB1 | 0.410 | |
| PDCD1LG2 | 0.716 | |
| LAG3 | 0.431 | |
| IL10 | 0.648 | |
| HAVCR2 | 0.620 | |
| CSF1R | 0.657 | |
| CD274 | 0.416 | |
| CXCL13 | 0.415 | |
| CXCL12 | 0.625 | |
| CXCL11 | 0.404 | |
| CXCL10 | 0.448 | |
| CXCL9 | 0.458 | |
| CXCL5 | 0.418 | |
| CXCL2 | 0.401 | |
| CCL26 | 0.554 | |
| CCL23 | 0.459 | |
| CCL21 | 0.539 | |
| CCL18 | 0.551 | |
| CCL13 | 0.522 | |
| CCL11 | 0.561 | |
| CCL7 | 0.540 | |
| CCL5 | 0.462 | |
| CCL4 | 0.505 | |
| CCL3 | 0.511 | |
| CCL2 | 0.524 | |
| FBP1 | ||
| CCL15 | 0.592 | |
| CCL4 | −0.404 | |
| TGFBR1 | −0.455 | |
| PDCD1LG2 | −0.491 | |
| CD274 | −0.474 | |
| ANXA1 | ||
| PDCD1LG2 | 0.504 | |
| CD274 | 0.451 | |
| CCL15 | −0.414 | |
| CCL7 | 0.407 | |
| LAMC2 | ||
| CXCL8 | 0.440 | |
| CXCL1 | 0.422 | |
| TGFB1 | 0.433 | |
| HOOK1 | ||
| TGFB1 | −0.423 | |
| CSF1R | −0.410 | |
| CCL23 | −0.403 | |
| NES | ||
| CXCL12 | 0.423 | |
| KDR | 0.405 | |
| SPRR2A | ||
| CXCL1 | 0.423 | |
| CXCL8 | 0.412 | |
| PTPN6 | ||
| LGALS9 | 0.422 | |
| RUNX2 | ||
| PDCD1LG2 | 0.451 |
References
- Bladder cancer statistics| World Cancer Research Fund International. Available online: https://www.wcrf.org/cancer-trends/bladder-cancer-statistics/ (accessed on 7 June 2023).
- Thompson, D.B.; Siref, L.E.; Feloney, M.P.; Hauke, R.J.; Agrawal, D.K. Immunological basis in the pathogenesis and treatment of bladder cancer. Expert. Rev. Clin. Immunol. 2015, 11, 265–279. [Google Scholar] [CrossRef] [PubMed]
- Ploeg, M.; Aben, K.K.H.; Kiemeney, L.A. The present and future burden of urinary bladder cancer in the world. World J. Urol. 2009, 27, 289. [Google Scholar] [CrossRef] [PubMed]
- Wong, M.C.S.; Fung, F.D.H.; Leung, C.; Cheung, W.W.L.; Goggins, W.B.; Ng, C.F. The global epidemiology of bladder cancer: A joinpoint regression analysis of its incidence and mortality trends and projection. Sci. Rep. 2018, 8, 1129. [Google Scholar] [CrossRef] [PubMed]
- Purdue, M.P.; Hutchings, S.J.; Rushton, L.; Silverman, D.T. The proportion of cancer attributable to occupational exposures. Ann. Epidemiol. 2015, 25, 188. [Google Scholar] [CrossRef]
- Cumberbatch, M.G.; Windsor-Shellard, B.; Catto, J.W.F. The contemporary landscape of occupational bladder cancer within the United Kingdom: A meta-analysis of risks over the last 80 years. BJU Int. 2017, 119, 100–109. [Google Scholar] [CrossRef]
- Figueroa, J.D.; Ye, Y.; Siddiq, A.; Garcia-Closas, M.; Chatterjee, N.; Prokunina-olsson, L.; Cortessis, V.K.; Kooperberg, C.; Cussenot, O.; Benhamou, S.; et al. Genome-wide association study identifies multiple loci associated with bladder cancer risk. Human Mol. Genet. 2014, 23, 1387–1398. [Google Scholar] [CrossRef]
- Garcia-Closas, M.; Rothman, N.; Figueroa, J.D.; Prokunina-Olsson, L.; Han, S.S.; Baris, D.; Jacobs, E.J.; Malats, N.; De Vivo, I.; Albanes, D.; et al. Common genetic polymorphisms modify the effect of smoking on absolute risk of bladder cancer. Cancer Res. 2013, 73, 2211–2220. [Google Scholar] [CrossRef]
- Engel, L.S.; Taioli, E.; Pfeiffer, R.; Garcia-Closas, M.; Marcus, P.M.; Lan, Q.; Boffetta, P.; Vineis, P.; Autrup, H.; Bell, D.A.; et al. Pooled analysis and meta-analysis of glutathione S-transferase M1 and bladder cancer: A HuGE review. Am. J. Epidemiol. 2002, 156, 95–109. [Google Scholar] [CrossRef]
- Figueroa, J.D.; Koutros, S.; Colt, J.S.; Kogevinas, M.; Garcia-Closas, M.; Real, F.X.; Friesen, M.C.; Baris, D.; Stewart, P.; Schwenn, M.; et al. Modification of Occupational Exposures on Bladder Cancer Risk by Common Genetic Polymorphisms. JNCI J. Natl. Cancer Inst. 2015, 107, 223. [Google Scholar] [CrossRef]
- Carlo, M.I.; Ravichandran, V.; Srinavasan, P.; Bandlamudi, C.; Kemel, Y.; Ceyhan-Birsoy, O.; Mukherjee, S.; Mandelker, D.; Chaim, J.; Knezevic, A.; et al. Cancer Susceptibility Mutations in Patients with Urothelial Malignancies. J. Clin. Oncol. Off. J. Am. Soc. Clin. Oncol. 2020, 38, 406–414. [Google Scholar] [CrossRef]
- Malats, N.; Bustos, A.; Nascimento, C.M.; Fernandez, F.; Rivas, M.; Puente, D.; Kogevinas, M.; Real, F.X. P53 as a prognostic marker for bladder cancer: A meta-analysis and review. Lancet Oncol. 2005, 6, 678–686. [Google Scholar] [CrossRef] [PubMed]
- Shariat, S.F.; Tokunaga, H.; Zhou, J.H.; Kim, J.H.; Ayala, G.E.; Benedict, W.F.; Lerner, S.P. p53, p21, pRB, and p16 expression predict clinical outcome in cystectomy with bladder cancer. J. Clin. Oncol. Off. J. Am. Soc. Clin. Oncol. 2004, 22, 1014–1024. [Google Scholar] [CrossRef] [PubMed]
- Benedict, W.F.; Lerner, S.P.; Zhou, J.; Shen, X.; Tokunaga, H.; Czerniak, B. Level of retinoblastoma protein expression correlates with p16 (MTS-1/INK4A/CDKN2) status in bladder cancer. Oncogene 1999, 18, 1197–1203. [Google Scholar] [CrossRef]
- Kader, A.K.; Shao, L.; Dinney, C.P.; Schabath, M.B.; Wang, Y.; Liu, J.; Gu, J.; Grossman, H.B.; Wu, X. Matrix metalloproteinase polymorphisms and bladder cancer risk. Cancer Res. 2006, 66, 11644–11648. [Google Scholar] [CrossRef] [PubMed]
- Lin, J.; Spitz, M.R.; Wang, Y.; Schabath, M.B.; Gorlov, I.P.; Hernandez, L.M.; Pillow, P.C.; Grossman, H.B.; Wu, X. Polymorphisms of folate metabolic genes and susceptibility to bladder cancer: A case-control study. Carcinogenesis 2004, 25, 1639–1647. [Google Scholar] [CrossRef]
- Kaderlik, K.R.; Kadlubar, F.F. Metabolic polymorphisms and carcinogen-DNA adduct formation in human populations. Pharmacogenetics 1995, 5, S108–S117. [Google Scholar] [CrossRef]
- Dobruch, J.; Oszczudłowski, M. Bladder Cancer: Current Challenges and Future Directions. Medicina 2021, 57, 749. [Google Scholar] [CrossRef]
- Advanced Bladder Cancer Meta-analysis Collaboration. Neo-adjuvant chemotherapy for invasive bladder cancer. Cochrane Database Syst. Rev. 2004, 2004. [Google Scholar] [CrossRef]
- Pham, A.; Ballas, L.K. Trimodality therapy for bladder cancer: Modern management and future directions. Curr. Opin. Urol. 2019, 29, 210–215. [Google Scholar] [CrossRef]
- Ott, P.A.; Hu-Lieskovan, S.; Chmielowski, B.; Govindan, R.; Naing, A.; Bhardwaj, N.; Margolin, K.; Awad, M.M.; Hellmann, M.D.; Lin, J.J.; et al. A Phase Ib Trial of Personalized Neoantigen Therapy Plus Anti-PD-1 in Patients with Advanced Melanoma, Non-small Cell Lung Cancer, or Bladder Cancer. Cell 2020, 183, 347–362.e324. [Google Scholar] [CrossRef]
- Magers, M.J.; Lopez-Beltran, A.; Montironi, R.; Williamson, S.R.; Kaimakliotis, H.Z.; Cheng, L. Staging of bladder cancer. Histopathology 2019, 74, 112–134. [Google Scholar] [CrossRef] [PubMed]
- Langbein, S.; Szakacs, O.; Wilhelm, M.; Sukosd, F.; Weber, S.; Jauch, A.; Lopez Beltran, A.; Alken, P.; Kälble, T.; Kovacs, G. Alteration of the LRP1B gene region is associated with high grade of urothelial cancer. Lab. Investig. 2002, 82, 639–643. [Google Scholar] [CrossRef] [PubMed][Green Version]
- Damrauer, J.S.; Beckabir, W.; Klomp, J.; Zhou, M.; Plimack, E.R.; Galsky, M.D.; Grivas, P.; Hahn, N.M.; O’Donnell, P.H.; Iyer, G.; et al. Collaborative study from the Bladder Cancer Advocacy Network for the genomic analysis of metastatic urothelial cancer. Nat. Commun. 2022, 13, 6658. [Google Scholar] [CrossRef]
- Habuchi, T.; Takahashi, R.; Yamada, H.; Ogawa, O.; Kakehi, Y.; Ogura, K.; Hamazaki, S.; Toguchida, J.; Ishizaki, K.; Fujita, J.; et al. Influence of cigarette smoking and schistosomiasis on p53 gene mutation in urothelial cancer. Cancer Res. 1993, 53, 3795–3799. [Google Scholar]
- Hou, R.; Kong, X.; Yang, B.; Xie, Y.; Chen, G. SLC14A1: A novel target for human urothelial cancer. Clin. Transl. Oncol. 2017, 19, 1438–1446. [Google Scholar] [CrossRef]
- Zlotta, A.R.; Roumeguere, T.; Kuk, C.; Alkhateeb, S.; Rorive, S.; Lemy, A.; Van Der Kwast, T.H.; Fleshner, N.E.; Jewett, M.A.S.; Finelli, A.; et al. Select screening in a specific high-risk population of patients suggests a stage migration toward detection of non-muscle-invasive bladder cancer. Eur. Urol. 2011, 59, 1026–1031. [Google Scholar] [CrossRef] [PubMed]
- PubMed Health. A service of the National Library of Medicine, N.I.o.H. In Bladder Cancer Treatment (PDQ®). Available online: https://www.ncbi.nlm.nih.gov/books/NBK65962/ (accessed on 7 June 2023).
- Sylvester, R.J.; Van Der Meijden, A.P.M.; Oosterlinck, W.; Witjes, J.A.; Bouffioux, C.; Denis, L.; Newling, D.W.W.; Kurth, K. Predicting recurrence and progression in individual patients with stage Ta T1 bladder cancer using EORTC risk tables: A combined analysis of 2596 patients from seven EORTC trials. Eur. Urol. 2006, 49, 466–477. [Google Scholar] [CrossRef]
- Friedl, P.; Mayor, R. Tuning Collective Cell Migration by Cell-Cell Junction Regulation. Cold Spring Harb. Perspect. Biol. 2017, 9, a029199. [Google Scholar] [CrossRef]
- Nieto, M.A.; Huang, R.Y.; Jackson, R.A.; Thiery, J.P. EMT: 2016. Cell 2016, 166, 21–45. [Google Scholar] [CrossRef]
- Friedl, P. Prespecification and plasticity: Shifting mechanisms of cell migration. Curr. Opin. Cell Biol. 2004, 16, 14–23. [Google Scholar] [CrossRef]
- Ramesh, V.; Brabletz, T.; Ceppi, P. Targeting EMT in Cancer with Repurposed Metabolic Inhibitors. Trends Cancer 2020, 6, 942–950. [Google Scholar] [CrossRef] [PubMed]
- Micalizzi, D.S.; Farabaugh, S.M.; Ford, H.L. Epithelial-mesenchymal transition in cancer: Parallels between normal development and tumor progression. J. Mammary Gland. Biol. Neoplasia 2010, 15, 117–134. [Google Scholar] [CrossRef] [PubMed]
- Zhu, W.; Leber, B.; Andrews, D.W. Cytoplasmic O-glycosylation prevents cell surface transport of E-cadherin during apoptosis. EMBO J. 2001, 20, 5999–6007. [Google Scholar] [CrossRef]
- Parsana, P.; Amend, S.R.; Hernandez, J.; Pienta, K.J.; Battle, A. Identifying global expression patterns and key regulators in epithelial to mesenchymal transition through multi-study integration. BMC Cancer 2017, 17, 447. [Google Scholar] [CrossRef]
- Sahib, A.S.; Fawzi, A.; Zabibah, R.S.; Koka, N.A.; Khudair, S.A.; Muhammad, F.A.; Hamad, D.A. miRNA/epithelial-mesenchymal axis (EMT) axis as a key player in cancer progression and metastasis: A focus on gastric and bladder cancers. Cell Signal. 2023, 110881. [Google Scholar] [CrossRef]
- Yin, X.; Teng, X.; Ma, T.; Yang, T.; Zhang, J.; Huo, M.; Liu, W.; Yang, Y.; Yuan, B.; Yu, H.; et al. RUNX2 recruits the NuRD(MTA1)/CRL4B complex to promote breast cancer progression and bone metastasis. Cell Death Differ. 2022, 29, 2203–2217. [Google Scholar] [CrossRef] [PubMed]
- Pranavkrishna, S.; Sanjeev, G.; Akshaya, R.L.; Rohini, M.; Selvamurugan, N. Regulation of Runx2 and Its Signaling Pathways by MicroRNAs in Breast Cancer Metastasis. Curr. Protein Pept. Sci. 2021, 22, 534–547. [Google Scholar] [CrossRef]
- Amin, A.; Bukhari, S.; Mokhdomi, T.A.; Anjum, N.; Wafai, A.H.; Wani, Z.; Manzoor, S.; Koul, A.M.; Amin, B.; Ain, Q.U.; et al. Comparative proteomics and global genome-wide expression data implicate role of ARMC8 in lung cancer. Asian Pac. J. Cancer Prev. 2015, 16, 3691–3696. [Google Scholar] [CrossRef]
- Xie, C.; Jiang, G.; Fan, C.; Zhang, X.; Zhang, Y.; Miao, Y.; Lin, X.; Wu, J.; Wang, L.; Liu, Y.; et al. ARMC8α promotes proliferation and invasion of non-small cell lung cancer cells by activating the canonical Wnt signaling pathway. Tumour Biol. 2014, 35, 8903–8911. [Google Scholar] [CrossRef]
- Li, X.; Zhang, C.; Yuan, Y.; Wang, Y.; Lu, S.; Zhou, Z.; Zhen, P.; Zhou, M. Downregulation of ARMC8 promotes tumorigenesis through activating Wnt/β-catenin pathway and EMT in cutaneous squamous cell carcinomas. J. Dermatol. Sci. 2021, 102, 184–192. [Google Scholar] [CrossRef]
- Domanegg, K.; Sleeman, J.P.; Schmaus, A. CEMIP, a Promising Biomarker That Promotes the Progression and Metastasis of Colorectal and Other Types of Cancer. Cancers 2022, 14, 5093. [Google Scholar] [CrossRef] [PubMed]
- Hua, Q.; Zhang, B.; Xu, G.; Wang, L.; Wang, H.; Lin, Z.; Yu, D.; Ren, J.; Zhang, D.; Zhao, L.; et al. CEMIP, a novel adaptor protein of OGT, promotes colorectal cancer metastasis through glutamine metabolic reprogramming via reciprocal regulation of β-catenin. Oncogene 2021, 40, 6443–6455. [Google Scholar] [CrossRef] [PubMed]
- Rodrigues, G.; Hoshino, A.; Kenific, C.M.; Matei, I.R.; Steiner, L.; Freitas, D.; Kim, H.S.; Oxley, P.R.; Scandariato, I.; Casanova-Salas, I.; et al. Tumour exosomal CEMIP protein promotes cancer cell colonization in brain metastasis. Nat. Cell Biol. 2019, 21, 1403–1412. [Google Scholar] [CrossRef] [PubMed]
- Liu, H.; Paddock, M.N.; Wang, H.; Murphy, C.J.; Geck, R.C.; Navarro, A.J.; Wulf, G.M.; Elemento, O.; Haucke, V.; Cantley, L.C.; et al. The INPP4B Tumor Suppressor Modulates EGFR Trafficking and Promotes Triple-Negative Breast Cancer. Cancer Discov. 2020, 10, 1226–1239. [Google Scholar] [CrossRef] [PubMed]
- Arruabarrena-Aristorena, A.; Maag, J.L.V.; Kittane, S.; Cai, Y.; Karthaus, W.R.; Ladewig, E.; Park, J.; Kannan, S.; Ferrando, L.; Cocco, E.; et al. FOXA1 Mutations Reveal Distinct Chromatin Profiles and Influence Therapeutic Response in Breast Cancer. Cancer Cell 2020, 38, 534–550.e539. [Google Scholar] [CrossRef] [PubMed]
- Jägle, S.; Busch, H.; Freihen, V.; Beyes, S.; Schrempp, M.; Boerries, M.; Hecht, A. SNAIL1-mediated downregulation of FOXA proteins facilitates the inactivation of transcriptional enhancer elements at key epithelial genes in colorectal cancer cells. PLoS Genet. 2017, 13, e1007109. [Google Scholar] [CrossRef] [PubMed]
- Dong, L.; Lyu, X.; Faleti, O.D.; He, M.L. The special stemness functions of Tbx3 in stem cells and cancer development. Semin. Cancer Biol. 2019, 57, 105–110. [Google Scholar] [CrossRef]
- Khan, S.F.; Burmeister, C.A.; Scott, D.J.; Sinkala, M.; Ramburan, A.; Wu, H.T.; Schäfer, G.; Katz, A.A.; Prince, S. TBX3 Promotes Cervical Cancer Proliferation and Migration via HPV E6 and E7 Signaling. Mol. Cancer Res. 2023, 21, 345–358. [Google Scholar] [CrossRef]
- Liang, B.; Zhou, Y.; Qian, M.; Xu, M.; Wang, J.; Zhang, Y.; Song, X.; Wang, H.; Lin, S.; Ren, C.; et al. TBX3 functions as a tumor suppressor downstream of activated CTNNB1 mutants during hepatocarcinogenesis. J. Hepatol. 2021, 75, 120–131. [Google Scholar] [CrossRef]
- Shen, C.; Liu, J.; Wang, J.; Yang, X.; Niu, H.; Wang, Y. The Analysis of PTPN6 for Bladder Cancer: An Exploratory Study Based on TCGA. Dis. Markers 2020, 2020, 4312629. [Google Scholar] [CrossRef]
- Liu, G.; Zhang, Y.; Huang, Y.; Yuan, X.; Cao, Z.; Zhao, Z. PTPN6-EGFR Protein Complex: A Novel Target for Colon Cancer Metastasis. J. Oncol. 2022, 2022, 7391069. [Google Scholar] [CrossRef] [PubMed]
- Zhu, X.; Zhou, L.; Li, R.; Shen, Q.; Cheng, H.; Shen, Z.; Zhu, H. AGER promotes proliferation and migration in cervical cancer. Biosci. Rep. 2018, 38, BSR20171329. [Google Scholar] [CrossRef] [PubMed]
- Tang, Y.; Li, M.; Wang, Y.L.; Threadgill, M.D.; Xiao, M.; Mou, C.F.; Song, G.L.; Kuang, J.; Yang, X.; Yang, L.; et al. ART1 promotes starvation-induced autophagy: A possible protective role in the development of colon carcinoma. Am. J. Cancer Res. 2015, 5, 498–513. [Google Scholar] [PubMed]
- Melincovici, C.S.; Boşca, A.B.; Şuşman, S.; Mărginean, M.; Mihu, C.; Istrate, M.; Moldovan, I.M.; Roman, A.L.; Mihu, C.M. Vascular endothelial growth factor (VEGF)-key factor in normal and pathological angiogenesis. Rom. J. Morphol. Embryol. 2018, 59, 455–467. [Google Scholar] [PubMed]
- Xu, K.; Wu, C.L.; Wang, Z.X.; Wang, H.J.; Yin, F.J.; Li, W.D.; Liu, C.C.; Fan, H.N. VEGF Family Gene Expression as Prognostic Biomarkers for Alzheimer’s Disease and Primary Liver Cancer. Comput. Math. Methods Med. 2021, 2021, 3422393. [Google Scholar] [CrossRef]
- Taha, F.M.; Zeeneldin, A.A.; Helal, A.M.; Gaber, A.A.; Sallam, Y.A.; Ramadan, H.; Moneer, M.M. Prognostic value of serum vascular endothelial growth factor in Egyptian females with metastatic triple negative breast cancer. Clin. Biochem. 2009, 42, 1420–1426. [Google Scholar] [CrossRef]
- Charles Jacob, H.K.; Signorelli, R.; Charles Richard, J.L.; Kashuv, T.; Lavania, S.; Middleton, A.; Gomez, B.A.; Ferrantella, A.; Amirian, H.; Tao, J.; et al. Identification of novel early pancreatic cancer biomarkers KIF5B and SFRP2 from “first contact” interactions in the tumor microenvironment. J. Exp. Clin. Cancer Res. 2022, 41, 258. [Google Scholar] [CrossRef]
- Müller, D.; Győrffy, B. DNA methylation-based diagnostic, prognostic, and predictive biomarkers in colorectal cancer. Biochim. Biophys. Acta Rev. Cancer 2022, 1877, 188722. [Google Scholar] [CrossRef]
- Goetz, J.G.; Lajoie, P.; Wiseman, S.M.; Nabi, I.R. Caveolin-1 in tumor progression: The good, the bad and the ugly. Cancer Metastasis Rev. 2008, 27, 715–735. [Google Scholar] [CrossRef]
- Kretzschmar, M.; Doody, J.; Timokhina, I.; Massagué, J. A mechanism of repression of TGFbeta/ Smad signaling by oncogenic Ras. Genes Dev. 1999, 13, 804–816. [Google Scholar] [CrossRef]
- Ranganathan, P.; Agrawal, A.; Bhushan, R.; Chavalmane, A.K.; Kalathur, R.K.; Takahashi, T.; Kondaiah, P. Expression profiling of genes regulated by TGF-beta: Differential regulation in normal and tumour cells. BMC Genom. 2007, 8, 98. [Google Scholar] [CrossRef] [PubMed]
- Murga-Zamalloa, C.; Rolland, D.C.M.; Polk, A.; Wolfe, A.; Dewar, H.; Chowdhury, P.; Onder, O.; Dewar, R.; Brown, N.A.; Bailey, N.G.; et al. Colony-Stimulating Factor 1 Receptor (CSF1R) Activates AKT/mTOR Signaling and Promotes T-Cell Lymphoma Viability. Clin. Cancer Res. 2020, 26, 690–703. [Google Scholar] [CrossRef] [PubMed]
- Wen, J.; Wang, S.; Guo, R.; Liu, D. CSF1R inhibitors are emerging immunotherapeutic drugs for cancer treatment. Eur. J. Med. Chem. 2023, 245, 114884. [Google Scholar] [CrossRef] [PubMed]
- Gao, Y.; Zhou, Z.; Lu, S.; Huang, X.; Zhang, C.; Jiang, R.; Yao, A.; Sun, B.; Wang, X. Chemokine CCL15 Mediates Migration of Human Bone Marrow-Derived Mesenchymal Stem Cells Toward Hepatocellular Carcinoma. Stem Cells 2016, 34, 1112–1122. [Google Scholar] [CrossRef]
- Yin, X.; Han, S.; Song, C.; Zou, H.; Wei, Z.; Xu, W.; Ran, J.; Tang, C.; Wang, Y.; Cai, Y.; et al. Metformin enhances gefitinib efficacy by interfering with interactions between tumor-associated macrophages and head and neck squamous cell carcinoma cells. Cell Oncol. 2019, 42, 459–475. [Google Scholar] [CrossRef]
- Azzaoui, I.; Yahia, S.A.; Chang, Y.; Vorng, H.; Morales, O.; Fan, Y.; Delhem, N.; Ple, C.; Tonnel, A.B.; Wallaert, B.; et al. CCL18 differentiates dendritic cells in tolerogenic cells able to prime regulatory T cells in healthy subjects. Blood 2011, 118, 3549–3558. [Google Scholar] [CrossRef]
- Martinez, F.O.; Gordon, S.; Locati, M.; Mantovani, A. Transcriptional profiling of the human monocyte-to-macrophage differentiation and polarization: New molecules and patterns of gene expression. J. Immunol. 2006, 177, 7303–7311. [Google Scholar] [CrossRef]
- Ben Khelil, M.; Godet, Y.; Abdeljaoued, S.; Borg, C.; Adotévi, O.; Loyon, R. Harnessing Antitumor CD4(+) T Cells for Cancer Immunotherapy. Cancers 2022, 14, 260. [Google Scholar] [CrossRef]


| Gene | p-Value | Expression in Worse Prognosis |
|---|---|---|
| ADAM17 | 8.65 × 10⁻⁶ | low |
| AGER | 4.13 × 10⁻⁷ | high |
| ANXA1 | 1.80 × 10⁻⁶ | low |
| ARMC8 | 3.99 × 10⁻⁸ | low |
| ART1 | 1.36 × 10⁻³ | high |
| BBC3 | 5.28 × 10⁻⁶ | high |
| CEMIP | 1.83 × 10⁻⁵ | low |
| ELSPBP1 | 1.65 × 10⁻³ | high |
| FBP1 | 3.43 × 10⁻⁵ | high |
| FN1 | 1.11 × 10⁻⁵ | low |
| FOXA1 | 8.51 × 10⁻⁵ | high |
| HOOK1 | 4.71 × 10⁻¹² | high |
| HTN1 | 1.02 × 10⁻³ | high |
| IL22 | 4.18 × 10⁻⁴ | high |
| INPP4B | 2.37 × 10⁻⁵ | high |
| LAMC2 | 1.98 × 10⁻⁹ | low |
| LYPD3 | 3.33 × 10⁻⁵ | low |
| MAP2K1 | 3.73 × 10⁻⁷ | low |
| NES | 2.91 × 10⁻⁹ | low |
| NR2F2 | 1.34 × 10⁻⁶ | low |
| NRP2 | 5.85 × 10⁻⁵ | low |
| PDCD6IP | 1.31 × 10⁻⁵ | low |
| PEBP4 | 2.16 × 10⁻⁴ | high |
| PRKCI | 2.65 × 10⁻⁴ | low |
| PTPN6 | 2.03 × 10⁻⁷ | high |
| RUNX2 | 7.19 × 10⁻⁸ | low |
| SCEL | 2.27 × 10⁻⁷ | low |
| SLC9A3R1 | 3.78 × 10⁻⁴ | low |
| SOX3 | 3.92 × 10⁻⁴ | high |
| SPRR2A | 1.17 × 10⁻⁵ | low |
| STIM2 | 2.11 × 10⁻¹¹ | high |
| TBX3 | 2.50 × 10⁻⁴ | high |
| Gene | p-Value |
|---|---|
| ADAM17 | 0.0182 |
| ANXA1 | 0.0433 |
| ARMC8 | 0.0009 |
| CEMIP | 0.0300 |
| FN1 | 0.0443 |
| LAMC2 | 0.0050 |
| LYPD3 | 0.0461 |
| MAP2K1 | 0.0419 |
| NES | 0.0413 |
| NR2F2 | 0.0495 |
| NRP2 | 0.0481 |
| PDCD6IP | 0.0311 |
| PRKCI | 0.0457 |
| RUNX2 | 0.0007 |
| SCEL | 0.0018 |
| SLC9A3R1 | 0.0467 |
| SPRR2A | 0.0342 |
| Gene | p-Value |
|---|---|
| AGER | 0.0441 |
| ART1 | 0.0446 |
| BBC3 | 0.0317 |
| ELSPBP1 | 0.0486 |
| FBP1 | 0.0359 |
| FOXA1 | 0.0356 |
| HOOK1 | 0.0011 |
| HTN1 | 0.0478 |
| IL22 | 0.0389 |
| INPP4B | 0.0314 |
| PEBP4 | 0.0322 |
| PTPN6 | 0.0137 |
| SOX3 | 0.0324 |
| STIM2 | 0.0500 |
| TBX3 | 0.0482 |
| Gene | p-Value | Higher Expression |
|---|---|---|
| ADAM17 | 8.31 × 10⁻⁴ | Primary tumor |
| AGER | 2.77 × 10⁻² | Primary tumor |
| ANXA1 | 1.41 × 10⁻² | Normal tissue |
| ARMC8 | 2.35 × 10⁻⁴ | Normal tissue |
| ART1 | 1.73 × 10⁻¹ | Normal tissue |
| BBC3 | 5.39 × 10⁻⁵ | Primary tumor |
| CEMIP/KIAA1199 | 1.93 × 10⁻³ | Primary tumor |
| ELSPBP1 | 2.52 × 10⁻¹ | Normal tissue |
| FBP1 | 7.76 × 10⁻¹ | Normal tissue |
| FN1 | 3.88 × 10⁻¹ | Primary tumor |
| FOXA1 | 1.64 × 10⁻¹ | Primary tumor |
| HOOK1 | 5.13 × 10⁻³ | Primary tumor |
| IL22 | 9.30 × 10⁻² | Normal tissue |
| INPP4B | 2.06 × 10⁻² | Primary tumor |
| LAMC2 | 1.05 × 10⁻⁴ | Primary tumor |
| LYPD3 | 3.03 × 10⁻¹ | Primary tumor |
| MAP2K1 | 2.88 × 10⁻³ | Primary tumor |
| NES | 8.36 × 10⁻⁸ | Normal tissue |
| NR2F2 | 3.04 × 10⁻¹ | Normal tissue |
| NRP2 | 1.24 × 10⁻⁴ | Normal tissue |
| PDCD6IP | 3.67 × 10⁻¹ | Primary tumor |
| PEBP4 | 2.17 × 10⁻⁴ | Normal tissue |
| PRKCI | 4.31 × 10⁻³ | Primary tumor |
| PTPN6 | 3.14 × 10⁻³ | Primary tumor |
| RUNX2 | 1.90 × 10⁻² | Primary tumor |
| SCEL | 2.05 × 10⁻¹ | Primary tumor |
| SLC9A3R1 | 8.95 × 10⁻³ | Primary tumor |
| SOX3 | 3.35 × 10⁻² | Normal tissue |
| SPRR2A | 2.77 × 10⁻¹ | Primary tumor |
| STIM2 | 8.06 × 10⁻¹ | Normal tissue |
| TBX3 | 7.13 × 10⁻¹ | Primary tumor |
| Gene | p-Value |
|---|---|
| ADAM17 | 0.0008 |
| ARMC8 | 0.0002 |
| BBC3 | 0.0001 |
| CEMIP | 0.0019 |
| LAMC2 | 0.0001 |
| MAP2K1 | 0.0029 |
| NES | <0.0001 |
| NRP2 | 0.0001 |
| PEBP4 | 0.0002 |
| PTPN6 | 0.0031 |
| Gene | p-Value |
|---|---|
| HOOK1 | 0.0051 |
| HTN1 | 0.0069 |
| SLC9A3R1 | 0.0090 |
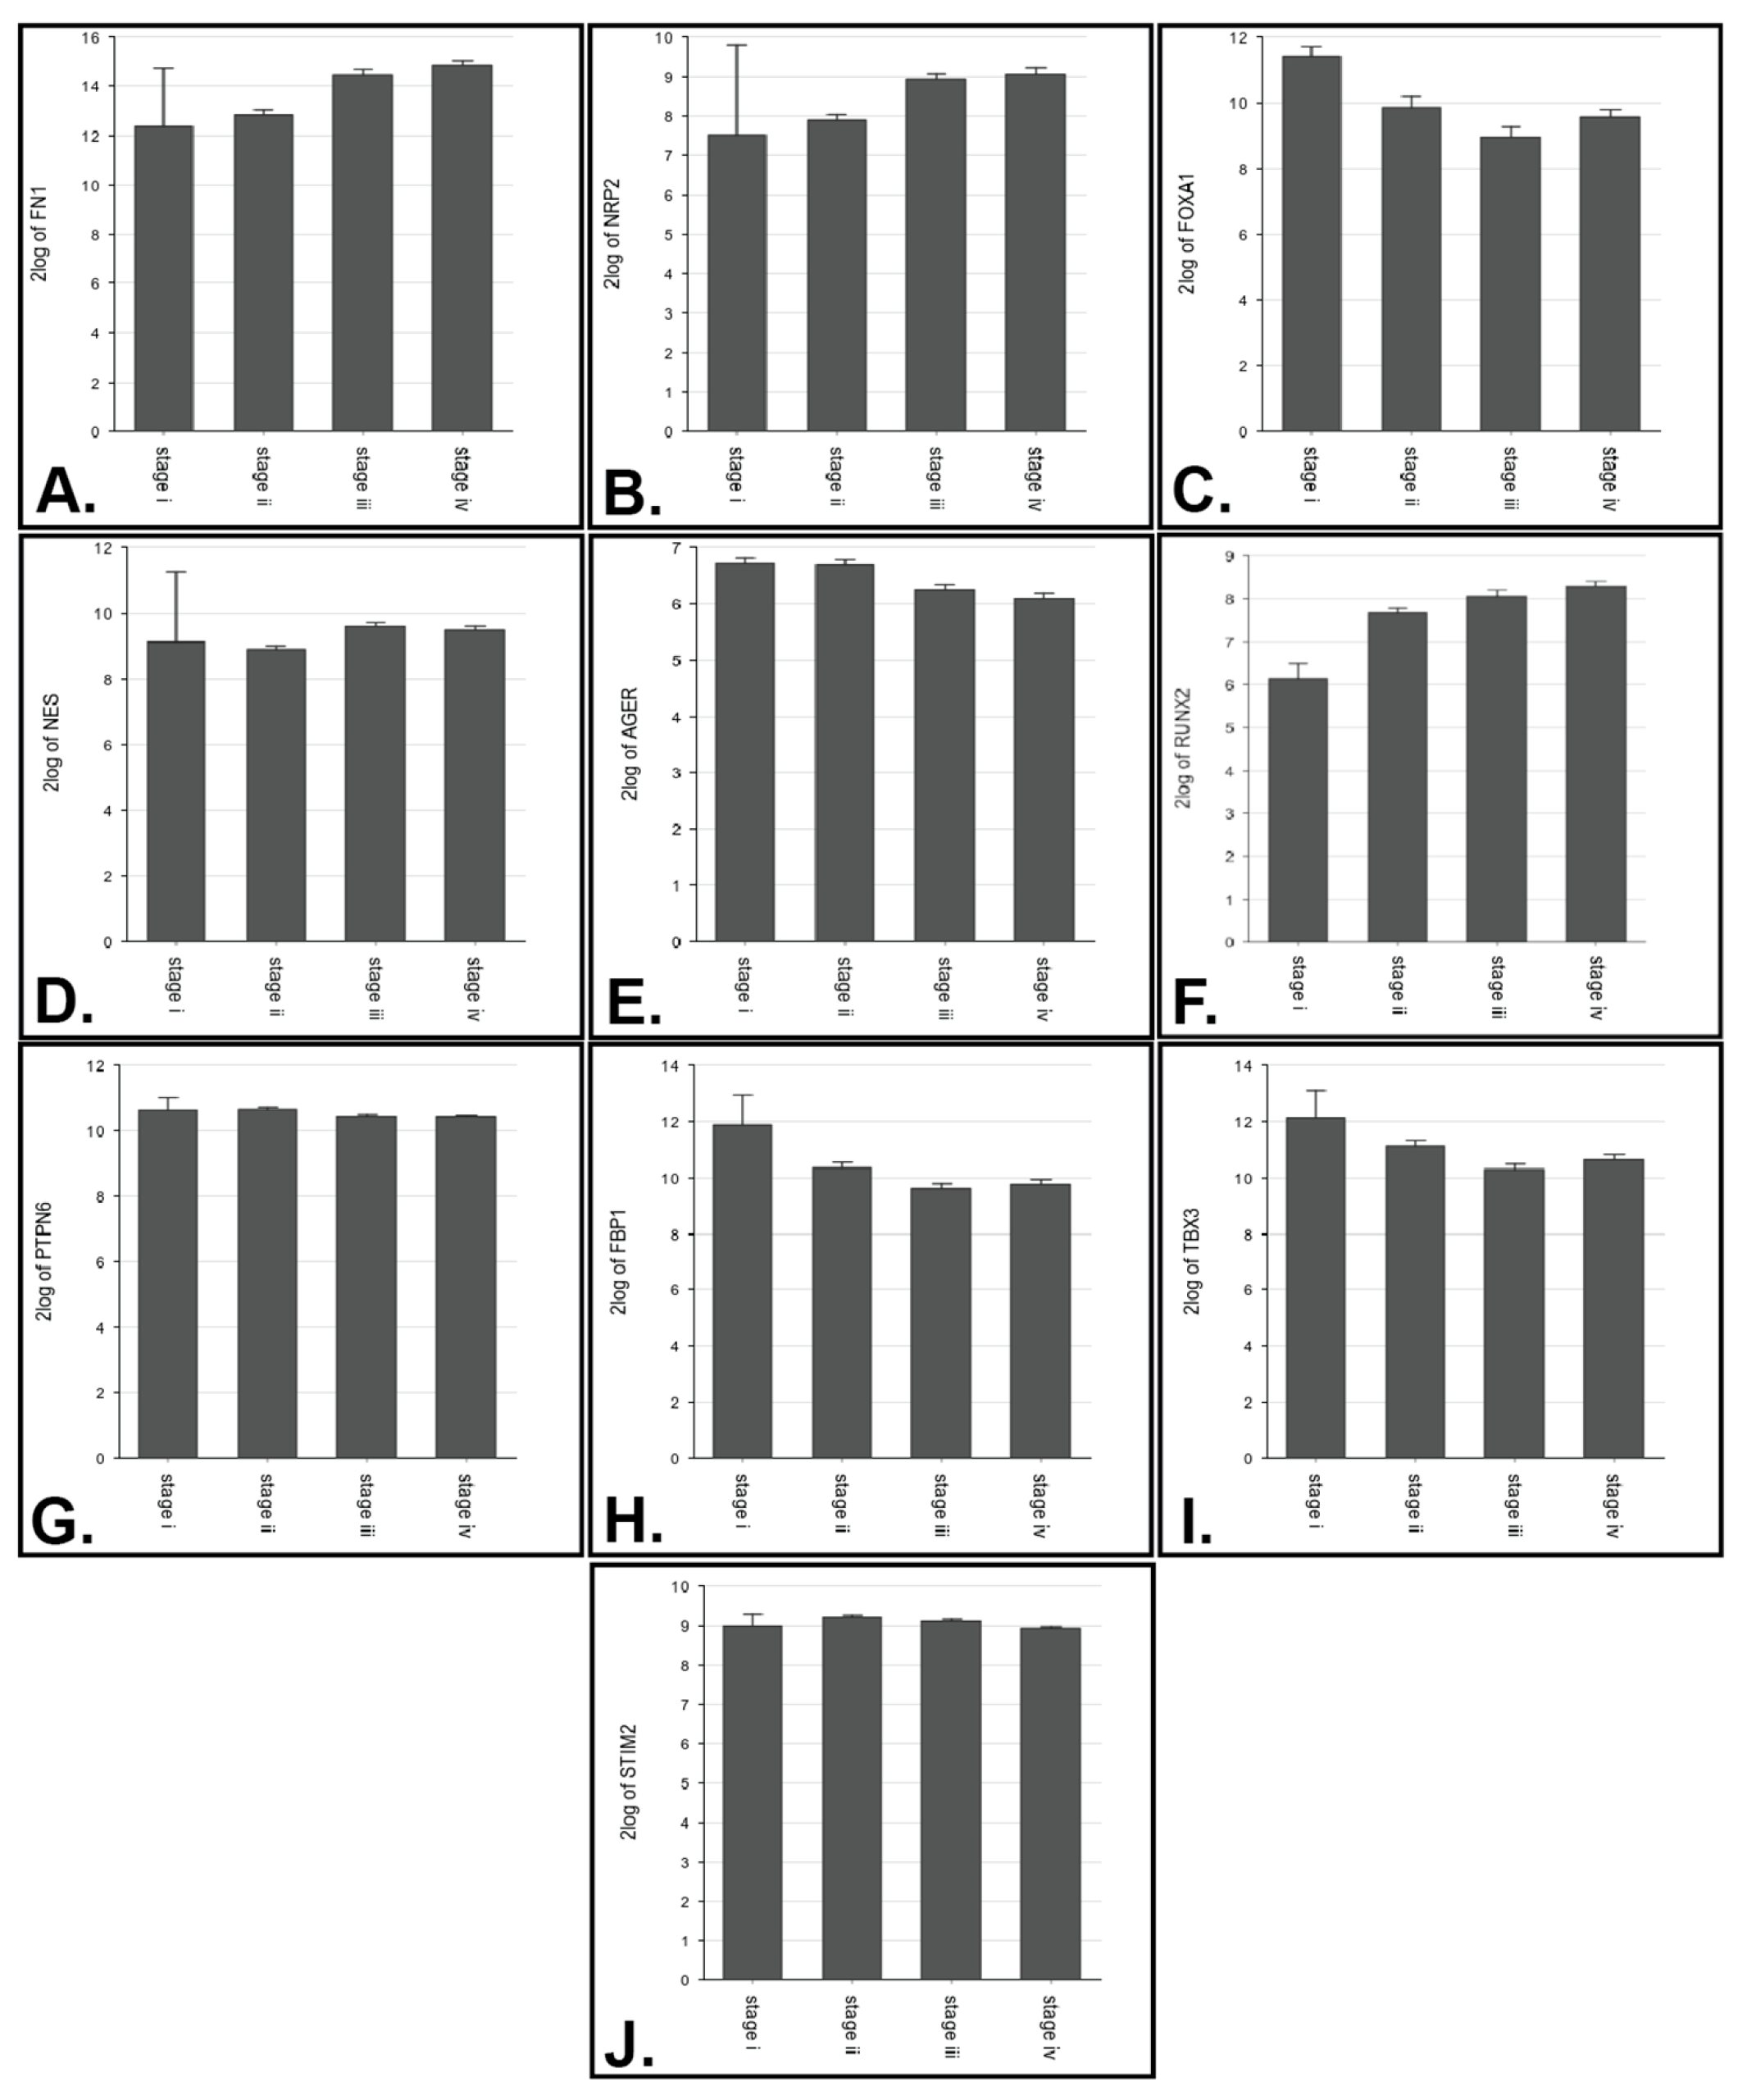
| Gene | Different Stages |
|---|---|
| FN1 | 2 vs. 3 (p = 1.22 × 10⁻⁸), 2 vs. 4 (4.20 × 10⁻¹²) |
| NRP2 | 2 vs. 4 (p = 2.10 × 10⁻⁸) |
| FOXA1 | 1 vs. 3 (p = 5.08 × 10⁻³) |
| NES | 2 vs. 3 (p = 1.71 × 10⁻⁵) |
| AGER | 2 vs. 3 (p = 2.00 × 10⁻³), 2 vs. 4 (p = 2.39 × 10⁻⁵) |
| RUNX2 | 2 vs. 4 (p = 2.99 × 10⁻⁴) |
| PTPN6 | 2 vs. 4 (p = 7.24 × 10⁻³) |
| FBP1 | 2 vs. 3 (p = 5.65 × 10⁻³) |
| TBX3 | 2 vs. 3 (p = 3.56 × 10⁻³) |
| STIM2 | 2 vs. 4 (p = 3.97 × 10⁻⁵) |
| Gene | Immunomodulator (Positive Correlation) | Immunomodulator (Negative Correlation) |
|---|---|---|
| TBX3 | CXCL16, CXCL13, CXCL11, CXCL10, CXCL9, CXCL5, CXCL3, CXCL2, CXCL1, CCL26, CCL23, CCL18, CCL13, CCL8, CCL7, CCL5, CCL4, CCL3, TIGIT, TGFBR1, PDCD1LG2, PDCD1, LAG3, IL10, IDO1, HAVCR2, CTLA4, CSF1R, CD274 | |
| NRP2 | CXCL13, CXCL12, CXCL11, CXCL10, CXCL9, CXCL2, CCL26, CCL23, CCL21, CCL19, CCL18, CCL13, CCL11, CCL8, CCL7, CCL5, CCL4, CCL3, CCL2, LAG3, TIGIT, TGFBR1, PDCD1LG2, PDCD1, IL10, HAVCR2, CTLA4, CSF1R, BTLA, ADORA2A | |
| FN1 | TGFBR1, TGFB1, PDCD1LG2, LAG3, IL10, HAVCR2, CSF1R, CD274, CXCL13, CXCL12, CXCL11, CXCL10, CXCL9, CXCL5, CXCL2, CCL26, CCL23, CCL21, CCL18, CCL13, CCL11, CCL7, CCL5, CCL4, CCL3, CCL2 | |
| FOXA1 | CCL15 | CXCL12, CXCL11, CXCL10, CXCL9, CXCL5, CXCL3, CXCL2, CCL26, CCL23, CCL21, CCL18, CCL13, CCL8, CCL7, CCL5, CCL4, CCL3, CCL2, TGFBR1, TGFB1, PDCD1LG2, LAG3, IL10, HAVCR2, CTLA4, CSF1R, CD274 |
| FBP1 | CCL15 | CCL4, TGFBR1, PDCD1LG2, CD274 |
| ANXA1 | PDCD1LG2, CD274, CCL7 | |
| SPRR2A | CXCL8, TGFB1 | |
| LAMC2 | CXCL8, CXCL1, TGFB1 | |
| HOOK1 | TGFB1, CSF1R, CCL23 | |
| NES | CXCL12, KDR | |
| PTPN6 | LGAGLS9 | |
| RUNX2 | PDCD1LG2 |
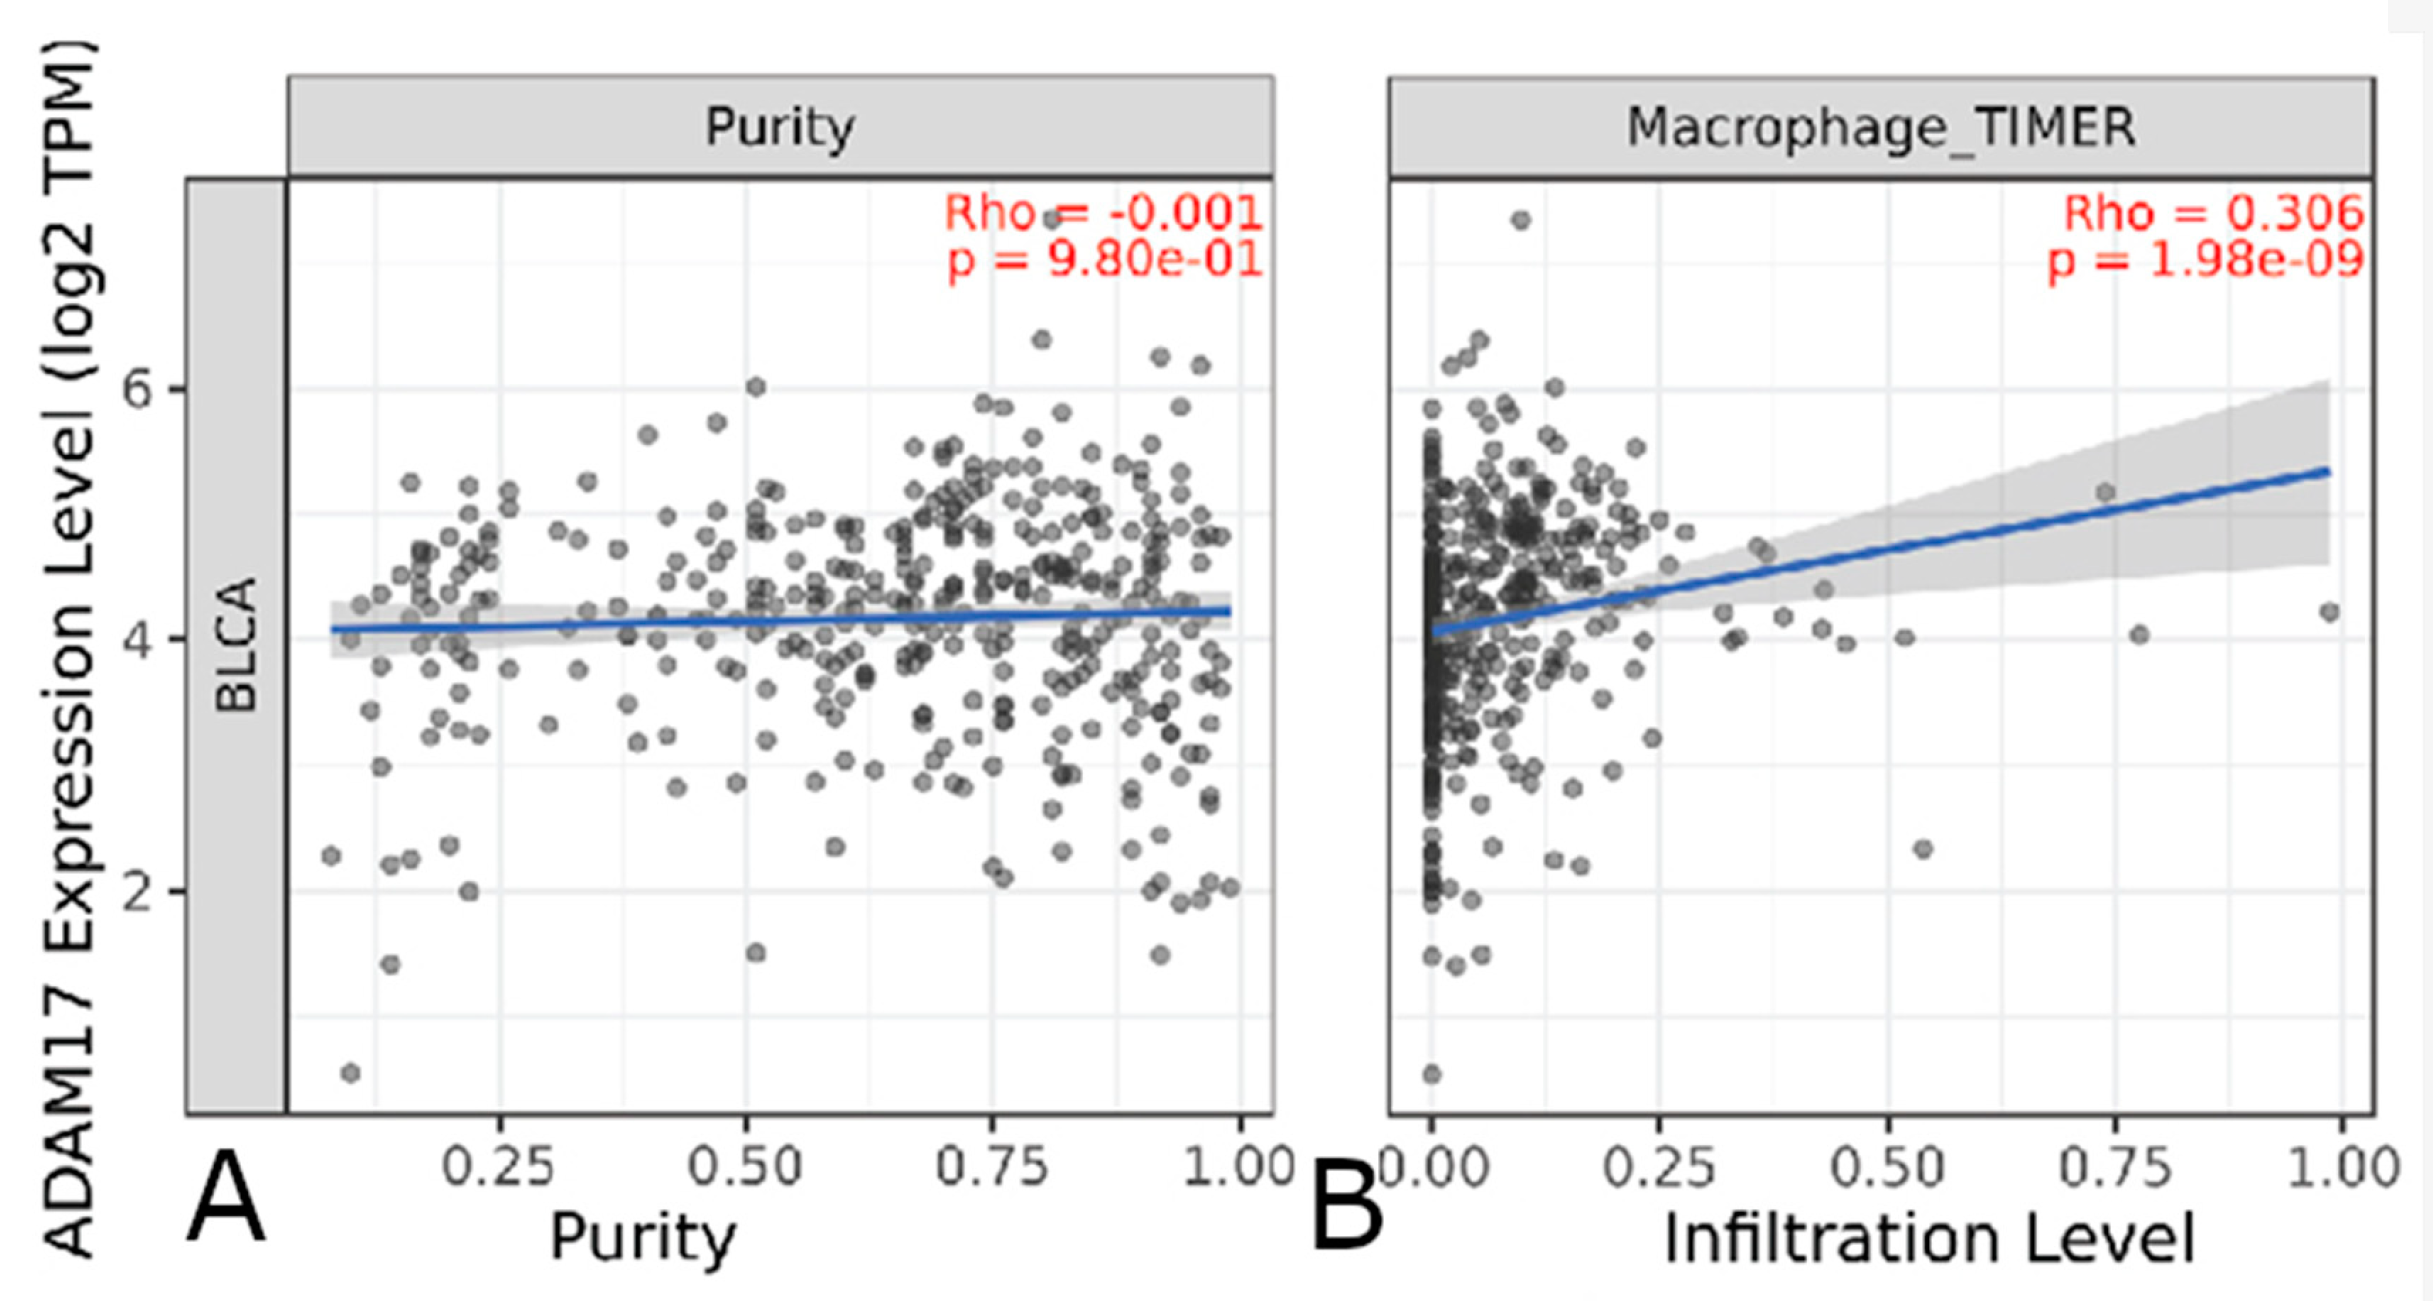
| Gene | Immune Infiltrates (Positive Correlation) | Immune Infiltrates (Negative Correlation) |
|---|---|---|
| ADAM17 | Macrophage, Neutrophil | |
| AGER | T cell CD8+ | |
| ANX1 | T cell CD8+, Neutrophil, Myeloid dendritic cell | |
| ARMC8 | Macrophage | |
| FBP1 | T cell CD8+, Neutrophil, Myeloid dendritic cell | |
| FN1 | T cell CD4+, T cell CD8+, Macrophage, Myeloid dendritic cell | |
| FOXA1 | T cell CD4+ | T cell CD8+, Myeloid dendritic cell |
| LAMC2 | T cell CD8+, Neutrophil, Myeloid dendritic cell | |
| MAP2K1 | T cell CD8+, Neutrophil | |
| NRP2 | T cell CD8+, Macrophage, Myeloid dendritic cell | |
| PTPN6 | B cell | |
| RUNX2 | T cell CD8+, Myeloid dendritic cell | |
| STIM2 | T cell CD4+ | |
| TBX3 | T cell CD8+, T cell CD4+, Neutrophil, Myeloid dendritic cell |
Disclaimer/Publisher’s Note: The statements, opinions and data contained in all publications are solely those of the individual author(s) and contributor(s) and not of MDPI and/or the editor(s). MDPI and/or the editor(s) disclaim responsibility for any injury to people or property resulting from any ideas, methods, instructions or products referred to in the content. |
© 2023 by the authors. Licensee MDPI, Basel, Switzerland. This article is an open access article distributed under the terms and conditions of the Creative Commons Attribution (CC BY) license (https://creativecommons.org/licenses/by/4.0/).
Share and Cite
Ali, W.; Xiao, W.; Jacobs, D.; Kajdacsy-Balla, A. Survival and Enrichment Analysis of Epithelial–Mesenchymal Transition Genes in Bladder Urothelial Carcinoma. Genes 2023, 14, 1899. https://doi.org/10.3390/genes14101899
Ali W, Xiao W, Jacobs D, Kajdacsy-Balla A. Survival and Enrichment Analysis of Epithelial–Mesenchymal Transition Genes in Bladder Urothelial Carcinoma. Genes. 2023; 14(10):1899. https://doi.org/10.3390/genes14101899
Chicago/Turabian StyleAli, Waleed, Weirui Xiao, Daniel Jacobs, and Andre Kajdacsy-Balla. 2023. "Survival and Enrichment Analysis of Epithelial–Mesenchymal Transition Genes in Bladder Urothelial Carcinoma" Genes 14, no. 10: 1899. https://doi.org/10.3390/genes14101899
APA StyleAli, W., Xiao, W., Jacobs, D., & Kajdacsy-Balla, A. (2023). Survival and Enrichment Analysis of Epithelial–Mesenchymal Transition Genes in Bladder Urothelial Carcinoma. Genes, 14(10), 1899. https://doi.org/10.3390/genes14101899