Highlights
What are the main findings?
- We investigated the cytotoxicity and potential toxicological effects of AFB1 on HCT116 cells.
- The toxicological mechanism by which AFB1 induces intestinal structural damage and dysfunction may be associated with the m6A modification of mRNA.
What is the implication of the main finding?
- Our study provides evidence that elucidates the intestinal toxic mechanism of AFB1 and the potential epigenetic regulation of mRNA via m6A modification.
Abstract
Aflatoxin B1 (AFB1) is widely prevalent in foods and animal feeds and is one of the most toxic and carcinogenic aflatoxin subtypes. Existing studies have proved that the intestine is targeted by AFB1, and adverse organic effects have been observed. This study aimed to investigate the relationship between AFB1-induced intestinal toxicity and N6-methyladenosine (m6A) RNA methylation, which involves the post-transcriptional regulation of mRNA expression. The transcriptome-wide m6A methylome and transcriptome profiles in human intestinal cells treated with AFB1 are presented. Methylated RNA immunoprecipitation sequencing and mRNA sequencing were carried out to determine the distinctions in m6A methylation and different genes expressed in AFB1-induced intestinal toxicity. The results showed that there were 2289 overlapping genes of the differentially expressed mRNAs and differentially m6A-methylation-modified mRNAs. After enrichment of the signaling pathways and biological processes, these genes participated in the terms of the cell cycle, endoplasmic reticulum, tight junction, and mitophagy. In conclusion, the study demonstrated that AFB1-induced HCT116 injury was related to the disruptions to the levels of m6A methylation modifications of target genes and the abnormal expression of m6A regulators.
1. Introduction
Aflatoxins (AFTs) are natural toxins produced by fungi such as Aspergillus flavus and Aspergillus parasiticus and they are widely present in the production and preservation of tree nuts, cereal crops, spices, and animal feed [1]. The concentration of AFTs in cereal products intended for human consumption should not exceed 20 μg/kg according to U.S. food supervision system, while the maximum limited dosage was 4 μg/kg for cereals foods in the European Union [2]. According to global mycotoxin occurrence data, in the 74,821 feed samples collected from 100 countries, 23% of them were positive for AFTs, with the positive samples showing a median concentration of 4 µg/kg. Among the regions where aflatoxin B1 (AFB1) concentrations exceed 20 µg/kg, south Asia, sub-Saharan Africa, and southeast Asia have reported the highest positivity ratios of 41.1%, 38.5%, and 20.9%, respectively [3]. The worldwide AFB1 occurrence in highly used food commodities during 2008 to 2018 was reported, and sorghum, spices, and rice had the highest frequencies of 67.3%, 64.4%, and 54.5%, respectively; among the positive samples, the concentration ranges were 0.2–83.6, 0.2–25.4, and 0.76–73.2 µg/kg, respectively [4]. AFB1 can be transferred to offspring during pregnancy or lactation or spread in foods such as milk, eggs, and meat, thus indirectly endangering the health of humans and animals [1]. AFB1 remains a considerable socioeconomic and health problem worldwide.
More than 20 subtypes of AFTs have been isolated, including B1, B2, G1, G2, M1, and M2. These are structurally similar compounds composed of a dihydrofuran ring and a coumarin. Among these subtypes, AFB1 is the most harmful and carcinogenic. It has been proven that AFB1 is carcinogenic to humans, so it is categorized as the first-grade carcinogen [5]. The carcinogenicity of AFB1 mainly results from the activation of cytochrome P450 in the liver, which is the main toxicological mechanism in the liver [6]. The understanding of the toxicity of AFB1 is gradually deepening, and target organs besides the liver have been reported. Harrison et al. reported that colorectal tumor tissue had higher levels of adducts than normal tissue from the same patients with histories of AFB1 exposure [7]. However, how AFB1 exerts toxicity in the intestine remains unknown, and few studies have been devoted to elucidating this.
It has been proven that aflatoxin-induced toxicity is associated with m6A methylation modifications. AFB1 could trigger the reactive oxygen species (ROS) accumulation, followed by an increased abundance of m6A modifications, and result in hepatotoxicity in mice [8]. So far, various RNA modification types have been reported [9], including N1-methyladenosine [10], 5-methylcytosine [11], N6-methyladenosine (m6A) [12], and 7-methyl guanosine [13]. Among them, m6A is considered to be the most pervasive and abundant modification in eukaryotes. About 25% of mRNA has at least one m6A modification site [14]. The m6A modification regulates the translation, stability, transportation, and decay of mRNA in the post-transcriptional level, thus playing a critical role in biological processes and functions, such as the DNA damage response, embryo development, and primary miRNA processing [15,16]. In general, RNA m6A modifications are regulated by three enzymes [17]. Initially, RNA m6A modifications are mediated by methyltransferases. However, methylation can be removed by demethylases. The high-throughput methylated RNA immunoprecipitation sequencing (MeRIP-seq) technology has deepened the investigation of RNA modifications [18]. The m6A modifications typically occur in specific sites of RNA and have a preferred base sequence.
In the present study, the HCT116 cell line was selected as the intestinal experimental model, and MeRIP-seq was performed to provide a genome-wide overview of the toxicological responses of HCT116 cells treated with AFB1. The underlying toxicological mechanisms were explored based on bioinformatic analysis.
2. Materials and Methods
2.1. Chemical Reagent and Cell Culture
The chemical structure of AFB1 (C17H12O6) was identified by nuclear magnetic resonance (Figure 1A). The purity of the AFB1 was 98.275%. The human intestinal cell lines HCT116 and SW480 were grown in DMEM (BasalMedia, Shanghai, China), containing 10% fetal bovine serum (Gibco, New York, NY, USA) and antibiotics. They were maintained with 5% CO2 at 37 °C. AFB1 in dimethyl sulfoxide (DMSO) was used for further experiments. The concentration of DMSO contained did not exceed 1%.
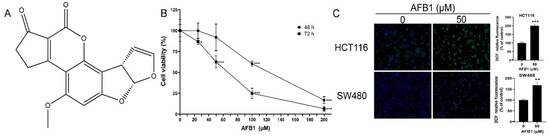
Figure 1.
(A) The chemical structure of AFB1; (B) cell viability of HCT116 cells treated with AFB1; (C) representative fluorescence images of ROS accumulation and quantification analysis of fluorescence intensity. * p < 0.05, ** p < 0.01 or *** p < 0.001 indicates statistically significant difference.
2.2. Cell Viability
The HCT116 cells were treated with 0, 25, 50, 100, and 200 μM AFB1 for 48 or 72 h. The cell viability was measured using the CCK-8 assay. In brief, after treatment of AFB1, the CCK-8 solution was added for incubation at 37 °C for 2 h and followed by the measurement of absorbance at 450 nm of a microplate reader (BioTek, Santa Clara, CA, USA).
2.3. RNA Preparation and m6A MeRIP-Seq of HCT116
After treatment with 50 μM AFB1 for 72 h, the HCT116 cells were lysed by TRIzol (Invitrogen, Carlsbad, CA, USA). The total RNA was extracted, and the concentration and integrity were quantified. The enrichment of RNAs with m6A methylation modifications and sequencing were performed by Seqhealth (Wuhan, China). Briefly, polyadenylated RNA enrichment was conducted by beads from 10 μg of total RNA. Then, mRNA was cleaved into fragments of 100–200 nt. The 0.5 mg/mL m6A antibody (Synaptic Systems, Goettingen, Germany) was used for m6A IP. Consequently, the RNA library was constructed for sequencing in DNBSEQ-T7 (MGI Technology Co., Ltd., Shenzhen, China).
2.4. Bioinformatic Analysis
The data were analyzed in Trim Galore and mapped to hg19 genome [19] with default parameters. The RNA expression level and the differential expression were analyzed by StringTie (Baltimore, MD, USA) [20] and DEseq [21], respectively. The m6A peak calling were identified using exomepeak2 [22,23]. STREME [24] was applied to identify the m6A motif sequences. The position weight matrix Markov model was integrated in the STREME algorithm. MetaTX [25] (Suzhou, China) was utilized to visualize the distribution of the epitranscriptome profiles. The m6A genes of the healthy human colon were obtained from m6A-TSHub [26]. The GO annotations and KEGG analysis were performed using the DAVID database (Frederick, MD, USA) [27]. The result of m6A conservation and disease association were obtained from ConsRM and RMDisease (Suzhou, China) [28,29]. The substrates of m6A regulators were obtained using starBase v2.0 (Guangzhou, China) [30].
2.5. Molecular Docking
Molecular docking was performed in SYBYL (Tripos, St Louis, MO, USA) to explore whether differentially expressed m6A regulators could interact with AFB1. The structures of human proteins were obtained from AlphaFold (DeepMind, London, UK) [31] and PDB and were preprocessed by applying SYBYL to extract ligand substructures, add hydrogen atoms, remove heteroatoms and water molecules, and carry out termini treatment [32]. The AFB1 structure was retrieved from PubChem, then converted to 3D structures using Chem3D (Waltham, MA, USA) and saved as a mol2 file. The AFB1 structure was set in an energy-minimized status [33]. The proteins were docked using the semi-flexible docking method in Surflex-Dock Geom mode. When the total score was higher than 5, the interaction between proteins and molecules was considered a stable model [34].
2.6. Intracellular ROS Accumulation
The intracellular ROS was evaluated after cells were treated with 50 μM AFB1 for 72 h. Briefly, the cells were incubated with DCFH-DA probe then washed with PBS to remove probes which did not enter the cells, followed by Hoechst 33342 for nuclear staining. The fluorescence images were analyzed in ImageJ to quantify the level of intracellular ROS.
2.7. Quantitative Real-Time PCR
The total RNA was extracted and reverse transcribed into cDNA. The AriaMx (Agilent, Palo Alto, CA, USA) provided quantitative detection and data analysis of mRNA expression levels. The human IGF2BP3 primers sequences used in RT-qPCR were as follows (5′-3′): forward GAGGCGCTTTCAGGTAAAATAG, reverse AATGAGGCGGGATATTTCGTAT.
2.8. Western Blotting
Cells were lysed with RIPA and the protein concentrations were measured by bicinchoninic acid. Then the proteins were separated and transferred onto the membranes. After blocking with skimmed milk, the membranes were incubated with primary and secondary antibodies (Proteintech and Abclonal, Wuhan, China), and then exposed with ECL reagents (Advansta, San Jose, CA, USA).
2.9. Statistical Analysis
The data analysis was conducted by SPSS (IBM, New York, NY, USA). One-way analysis of variance was performed. Difference of p < 0.05 was considered statistically significant. At least three independent experiments were performed in each assay.
3. Results
3.1. Cell Viability and ROS Accumulation
The cytotoxic effects of AFB1 on HCT116 cells were measured. As shown in Figure 1B, the AFB1-induced inhibition of cell viability was shown to be dose- and time-dependent. At 72 h, the cell viability was 62.4% in the 50 μM AFB1 group. The effect of ROS accumulation on HCT116 and SW480 cells induced by AFB1 was measured by using a DCFH-DA fluorescent probe. ROS accumulations were significantly increased in the AFB1 groups (Figure 1C).
3.2. Transcriptome-Wide MeRIP-Seq Reveals m6A Modification Pattern after AFB1 Treatment of HCT116 Cells
The summary of reads in MeRIP-seq were shown in Table S1. A total of 104,794 peaks were found in 12,848 genes of the control group, and 94,622 m6A peaks were found in 12,214 m6A genes of the AFB1 group. In the analysis of m6A-TSHub, 6222 m6A genes were reported in the healthy human colon (Figure 2A–C). The STREME was used to define the conserved sequence of RRACH, and the results in both the control and AFB1 groups showed the classical motifs (Figure 2D). To identify the distribution of m6A modifications throughout the transcriptome, the m6A-methylated transcripts were quantified in each gene, and it was found that more than 4000 genes contained 1–2 m6A peaks in each group (Figure 2E).
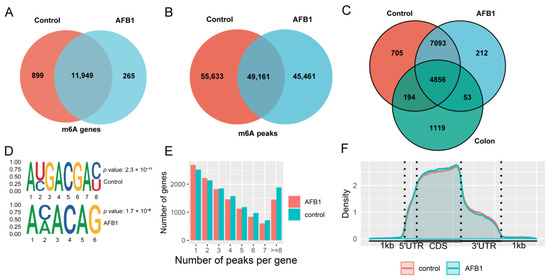
Figure 2.
Venn diagram showing the (A) m6A genes and (B) peaks; (C) Venn diagram showing the m6A genes from the HCT116 control group, AFB1 group, and the healthy human colon data obtained by m6A-TSHub; (D) the motifs enriched from identified m6A peaks based on STREME; (E) the m6A-modified peaks number in genes; (F) the density of m6A-modified peaks in mRNA transcripts.
3.3. Analysis of m6A Modification Distribution
The distribution pattern of m6A methylation was analyzed in the control and AFB1 groups. As a result, the m6A peaks density were increased between 5′ untranslated regions (5′-UTRs) and the start codon region and remained high in the coding sequences (CDS) region (Figure 2F).
3.4. Differentially Expressed Genes (DEGs) and Differentially Methylated Genes
A total of 5487 DEGs were identified through the RNA-seq data and 5312 differentially m6A-modified mRNAs were identified between the control and AFB1 groups after the analysis of the MeRIP-seq data (p < 0.05). A total of 2289 genes were repeatedly detected as overlapping (Figure 3A). When the statistical threshold was adjusted to fold change > 2 and p < 0.05, a total of 248 mRNAs were up-regulated and 432 mRNAs were down-regulated (Figure 3B).
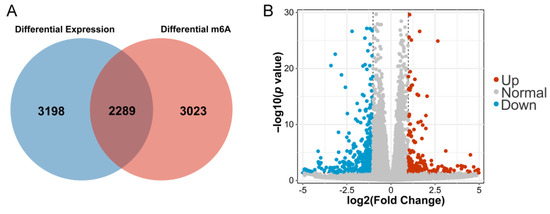
Figure 3.
(A) DEGs and differentially m6A-modified mRNAs between cells with or without AFB1 treatment; (B) the volcano plot of 680 DEGs.
3.5. Biological Pathways of DEGs and Differentially m6A-Modified mRNAs
KEGG and GO enrichment was performed using the DAVID bioinformatic database. The GO enrichment analysis contained subtypes of biological process (BP), cellular component (CC), and molecular function (MF). KEGG of 2289 overlapping genes was involved in the cell cycle, endoplasmic reticulum (ER), autophagy, tight junction, mitophagy, and apoptosis (Figure 4A). The BP terms were cell cycle, autophagy, and response to ER stress. The CC terms included focal adhesion, cell junction, mitochondrion, and ER lumen. The MF terms contained cadherin binding (Figure 4B).
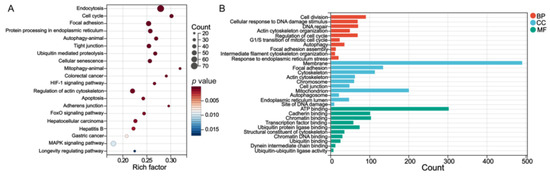
Figure 4.
(A) The KEGG enrichment pathways and (B) GO terms of 2289 overlapped genes of DEGs and differentially m6A-methylated mRNAs.
3.6. Conservation and Disease Association of m6A-Modified Genes
The conservation of m6A sites and disease association were explored in the 2289 overlapping genes. The result showed that 92.4% of the m6A-methylation-modified sites were non-conserved, and 43.5% genes and 37.5% peaks were diseased-associated (Figure 5).
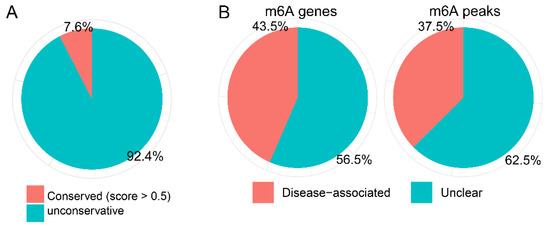
Figure 5.
The (A) conservation of m6A sites and (B) disease association of the 2289 overlapping genes.
3.7. Genes Expression and Their Potential m6A Regulators
After the AFB1 treatment in HCT116 cells, the mRNA expression levels related to cell cycle (MYC, CCNB1, CDC25C, ATM, and CHEK2), protein processing in ER (PDIA3, HSPA5, P4HB, HSP90B1, and CANX), tight junction (MYH9, ACTB, ACTG1, ACTR2, and SRC), and mitophagy (BECN1, MFN2, GABARAPL1, MAP1LC3B, and SQSTM1) were abnormal. (Table 1). The m6A regulators were identified using the CLIP technique, including several writers and readers.

Table 1.
The mRNA expression and their potential substrates of m6A regulators.
3.8. Proteins Expression Levels
In the Western blotting assay, tight junction and mitophagy biomarkers were detected. As shown in Figure 6, after treatment of AFB1, the CLDN3 was decreased in HCT116 cells, and ZO-1, BECN1, LC3-II and SQSTM1 were increased. The CLDN3, ZO-1 and SQSTM1 were decreased, and BECN1 and LC3-II were increased in SW480 cells. The OCLN was not altered by AFB1 in HCT116 and SW480 cells.
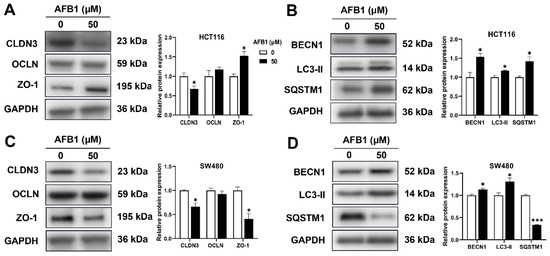
Figure 6.
The proteins expression of CLDN3, OCLN, ZO-1, BECN1, LC3-II, and SQSTM1 in AFB1-treated HCT116 (A,B) and SW480 cells (C,D). * p < 0.05 or *** p < 0.001 indicates statistically significant difference.
3.9. Potential RNA m6A Regulators of Differentially Methylated Genes
Through the analysis of mRNA-seq data, a total of 23 mRNA of m6A regulators were differentially expressed (Table S2 and Figure 7). The writers VIRMA, METTL5, RBM15B, and ZC3H13 were upregulated, and the reader IGF2BP3 was downregulated (Figure 7). The mRNA expression of IGF2BP3 has been verified by RT-qPCR in AFB1-treated HCT116 and SW480 cells (Figure S1).
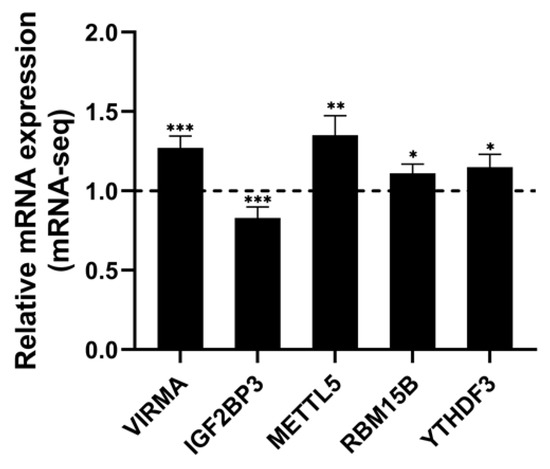
Figure 7.
The significantly differential expressed m6A regulators in HCT116 with or without AFB1 treatment. Data were expressed as means ± SD. * p < 0.05, ** p < 0.01, *** p < 0.001 or p < 0.0001 versus the control.
The GO and KEGG terms were enriched in cell cycle, ER, tight junction, and mitophagy. We collected the genes that were enriched in the mentioned terms and explored the regulatory relationship between differentially expressed m6A regulators and these target genes by STRING to perform protein–protein interactions network analysis. As shown in Figure 8, the top five genes in cell cycle terms were CCNB1, MYC, CDC25C, ATM, and CHEK2, with the degrees of 33, 31, 29, 28, and 28 (Figure 8A); in terms of protein processing in ER, the top five genes were HSPA5, CANX, P4HB, HSP90B1, and PDIA3, with the degrees of 30, 25, 23, 21, and 21 (Figure 8B); in the tight junction terms, the top five genes were ACTB, SRC, ACTG1, MYH9, and ACTR23, with the degrees of 27, 21, 20, 19, and 18 (Figure 8C); in the mitophagy terms, the top five genes were BECN1, SQSTM1, GABARAPL1, MAP1LC3B, and MFN2, with the degrees of 16, 16, 13, 13, and 12 (Figure 8D). The gene set enrichment analysis of these four terms in HCT116 cells treated with AFB1 were shown in Figure S2.
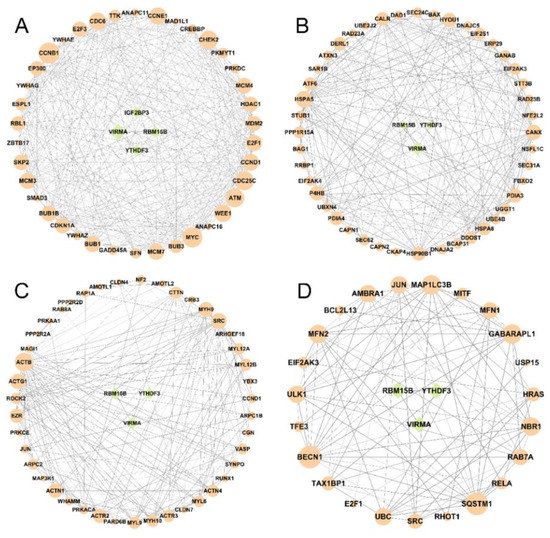
Figure 8.
The interactions between m6A regulators (green circle) and the genes (orange circle) from the KEGG enrichment pathways of (A) cell cycle, (B) ER, (C) tight junction, and (D) mitophagy.
To detect the substrates of m6A methylation regulators, the writers RBM15B, VIRMA, METTL5, and ZC3H13 and the readers YTHDC2, YTHDC1, YTHDF3, and IGF2BP3 were selected as well as the cell cycle genes CCNB1, MYC, CDC25C, ATM, and CHEK2 (Figure 9A); the genes of protein processing in ER HSPA5, CANX, P4HB, HSP90B1, and PDIA3 (Figure 9B); the tight junction genes ACTB, SRC, ACTG1, MYH9, and ACTR2 (Figure 9C); and the mitophagy genes BECN1, SQSTM1, GABARAPL1, MAP1LC3B, and MFN2 (Figure 9D). The m6A methylation levels of transcripts were observed by IGV and shown in Figure 9E.
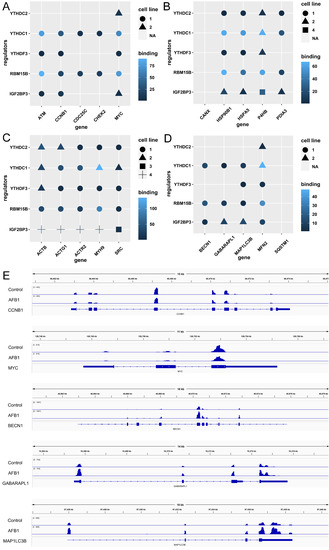
Figure 9.
The substrates of m6A regulators: (A) cell cycle, (B) ER, (C) tight junction, and (D) mitophagy pathways enriched in the KEGG analysis. The cell lines including HeLa, Huh7, HEK293, HepG2, Panc1, PL45, etc. were from the starBase v2.0. (E) depicts the levels of m6A methylation on CCNB1, MYC, BECN1, GABARAPL1, and MAP1LC3B mRNA transcripts.
3.10. Interactions between AFB1 and m6A Regulators
The interactions between AFB1 and m6A regulators were predicted and shown in Table 2 and Figure 10. Theoretically, AFB1 bound to regulators by hydrogen bonds and hydrophobic contacts. All the total scores except ZC3H13 were higher than 5, indicating that most of these proteins could form stable and direct interactions with AFB1.
Table 2.
The predicted interactions between AFB1 and m6A regulators.
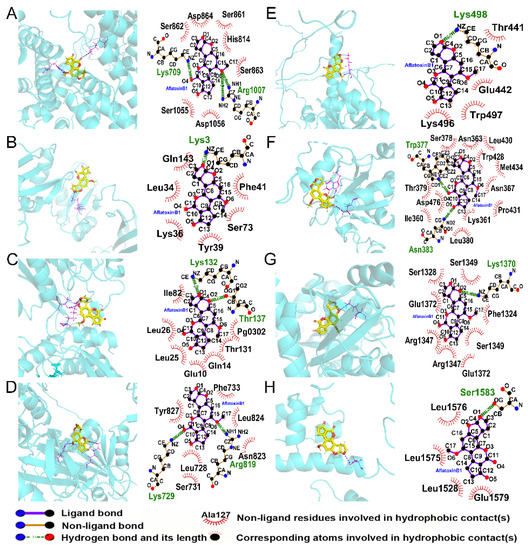
Figure 10.
The interactions between AFB1 and m6A regulators of (A) VIRMA, (B) IGF2BP3, (C) METTL5, (D) RBM15B, (E) YTHDF3, (F) YTHDC1, (G) YTHDC2, and (H) ZC3H13.
4. Discussion
Generally, the digestive system represents the first barrier against exposure to foods contaminated with AFB1, so the biological interaction between the intestine and AFB1 is an important issue to be clearly elucidated. To date, most studies related to the toxicity of AFB1 have focused on the metabolic process and hepatotoxicity. The liver and hepatocytes are the main experimental models in toxicological research. However, the liver is not the sole toxicity target of AFB1, and the intestine injury induced by AFB1 merits more attention. In this study, human intestinal cells were exposed to AFB1, and the alterations of m6A modifications and the mRNA expression levels were analyzed through MeRIP-seq.
According to the present sequencing data, the m6A-modified transcripts were mainly enriched near the stop codons, which were consistent with the topology of human RNA m6A methylomes [35]. Additionally, by exploring the distribution of m6A-modified peaks, it was found that most genes contain one or two m6A peaks, which was consistent with a previous description [15].
The KEGG enrichments reported terms of cell cycle, focal adhesion, protein processing in ER, autophagy, mitophagy, hepatitis B, etc. Many vital terms were enriched based on GO analysis. The cell cycle, autophagy, and ER stress were enriched in BP; the actin cytoskeleton, mitochondrion, autophagosome, and ER lumen were enriched in CC; and ATP binding, cadherin binding, and ubiquitin protein ligase binding were enriched in MF. The intestine is particularly susceptible to xenobiotic compounds. When the intestine is exposed to mycotoxins, the intestinal epithelial barrier, which consists of various cellular junctions, is regarded as a mechanical barrier to the toxins [36]. The tight junction, focal adhesion, and adherens junction are important components of cellular junctions. The mycotoxins can affect tight junction proteins, thus compromising the integrity of the intestinal barrier [37]. In this study, the cellular junctions and actin cytoskeleton were damaged in HCT116 cells, which may have resulted in abnormal intestinal permeability, absorption, and efflux.
The toxicity of AFB1 is involved in ROS production, which is one of the main factors in the toxicity toward organs [38]. It has been proven that AFB1-induced oxidative stress can activate ER stress (ERS) [39]. The ER is the major membrane-bound organelle for intracellular calcium storage and protein synthesis, folding, and transport. ROS can initiate ERS and mediate the unfolded protein response, resulting in calcium imbalance [40]. Existing studies have reported that ERS could block the cell cycle to prevent daughter cell generation [41]. Previous studies also demonstrated that exposure to AFB1 could induce cell cycle arrest at different phases among diverse cells, such as arrest at the G0/G1 or S phases in human liver cells [42,43,44]. After the GO and KEGG enrichment in the present study, AFB1 was found to arrest cell cycle at G1/S transition, as shown in Figure 4B. In addition, the ER and mitochondria are highly interconnected organelles, since the ER membrane and the outer mitochondrial membrane are tightly connected to each other, and this region is called the mitochondria-associated ER membrane (MAM) [45]. ERS is associated with mitochondrial dysfunction. When the ER homeostasis is disrupted, calcium ions are released from the ER into the mitochondria, leading to the production of large amounts of ROS in the mitochondria, and mitochondrial bioenergetics are regulated by effecting the MAM. In turn, ER failure is accelerated, and mitochondrial damage is aggravated [46]. Then, autophagy is triggered to selectively identify and eliminate damaged mitochondria [47].
RNA m6A methylation involves in the post-transcriptional modification and affects diverse, fundamental biological processes and functions of mRNA, such as stability, translation, and decay. RNA m6A methylation is regulated by methyltransferases, demethylases, and methylation recognition proteins [48,49,50]. In this study, eight regulators were abnormally expressed. Among them, IGF2BP3 was the m6A-methylation-recognition protein that enhanced mRNA stability. As determined using computational prediction technology, AFB1 was able to bind stably to m6A regulators excluding ZC3H13. Then, this study explored the endpoint effects of the differentially expressed m6A regulator genes on the enriched pathways of cell cycle, mitophagy, and protein processing in the ER and tight junction. For example, in the term of cell cycle, cyclin B1 (CCNB1) and MYC promote the progression of the cell cycle [51,52]. For the term of mitophagy, BECN1 and GABA type A receptor-associated protein such as 1 (GABARAPL1) are involved in the formation of mature autophagosome membranes [53,54]. Once autophagy occurs, light chain 3 (LC3) acts as a biomarker, and the lipidation of LC3-I to LC3-II is observed during autophagosome formation [55]. For the term of protein processing in the ER, the heat shock proteins are essential molecular chaperones for regulating protein homeostasis both under normal physiological conditions and in ERS [56,57]. In this study, the m6A methylation levels of CCNB1 and MYC were reduced in the AFB1 group, along with decreased binding to IGF2BP3; conversely, the m6A methylation levels of BECN1, GABARAPL1, and MAP1LC3B were elevated, along with increased binding to IGF2BP3. As a result, the stability of CCNB1 and MYC mRNA was destroyed, leading to decreased mRNA expression and translation. On the contrary, the mRNAs of BECN1, GABARAPL1, and MAP1LC3B were highly expressed and translated.
5. Conclusions
In this study, the cytotoxicity of AFB1 toward HCT116 cells was observed. The potential intestinal toxicological effects of AFB1, and the GO and KEGG enriched terms of cell cycle, mitophagy, protein processing in ER, and tight junction, are reported. These injuries result in structural abnormalities and dysfunction of the intestine. This study suggests that the underlying molecular toxicological mechanisms are associated with mRNA m6A methylation; namely, AFB1 might decrease CCNB1 and MYC mRNA expression by reducing the levels of mRNA m6A methylation, resulting in cell cycle arrest. On the other hand, AFB1 induced mitophagy, probably by elevating the level of m6A methylation modifications, mRNA expression, and translation of BECN1, GABARAPL1, and MAP1LC3B. This study provides evidence of AFB1-induced intestinal cytotoxicity and a potential m6A epigenetic regulation mechanism for mRNA.
Supplementary Materials
The following supporting information can be downloaded at: https://www.mdpi.com/article/10.3390/genes14010079/s1, Figure S1: The mRNA expression levels of IGF2BP3 in AFB1-treated HCT116 and SW480 cells; Figure S2: The GSEA of (A) cell cycle, (B) protein processing in endoplasmic reticulum, (C) tight junction, and (D) mitophagy-animal in HCT116 cells treated with AFB1; Table S1: Summary of reads of MeRIP-seq and mRNA-seq in HCT116 cells with or without AFB1 treatment; Table S2: The mRNA expression levels of m6A regulators in AFB1-treated HCT116 cells.
Author Contributions
Conceptualization, A.Z.; methodology, Y.W.; performed the experiments, Y.W., W.B. and J.R.; data curation, Y.W.; formal analysis, W.B., C.L., M.C. and D.Z.; visualization, W.B., C.L., M.C. and D.Z.; writing—original draft, Y.W. and W.B.; writing—review and editing, A.Z.; supervision, A.Z.; funding acquisition, A.Z. All authors have read and agreed to the published version of the manuscript.
Funding
The work is supported by the National Natural Science Foundation of China (82104520), Natural Science Foundation of Fujian Province (2021J05045), Fujian Medical University High-level Talent Research Startup Funding Project (XRCZX2020014), Open Research Fund of Key Laboratory of Gastrointestinal Cancer (Fujian Medical University), Ministry of Education (FMUGIC-202101).
Institutional Review Board Statement
Not applicable.
Informed Consent Statement
Not applicable.
Data Availability Statement
All data are included in this manuscript.
Conflicts of Interest
The authors declare no conflict of interest.
References
- Marchese, S.; Polo, A.; Ariano, A.; Velotto, S.; Costantini, S.; Severino, L. Aflatoxin B1 and M1: Biological Properties and Their Involvement in Cancer Development. Toxins 2018, 10, 214. [Google Scholar] [CrossRef] [PubMed]
- Ismail, A.; Gonçalves, B.L.; de Neeff, D.V.; Ponzilacqua, B.; Coppa, C.; Hintzsche, H.; Sajid, M.; Cruz, A.G.; Corassin, C.H.; Oliveira, C.A.F. Aflatoxin in foodstuffs: Occurrence and recent advances in decontamination. Food Res. Int. 2018, 113, 74–85. [Google Scholar] [CrossRef] [PubMed]
- Gruber-Dorninger, C.; Jenkins, T.; Schatzmayr, G. Global Mycotoxin Occurrence in Feed: A Ten-Year Survey. Toxins 2019, 11, 375. [Google Scholar] [CrossRef] [PubMed]
- Rushing, B.R.; Selim, M.I. Aflatoxin B1: A review on metabolism, toxicity, occurrence in food, occupational exposure, and detoxification methods. Food. Chem. Toxicol. 2019, 124, 81–100. [Google Scholar] [CrossRef] [PubMed]
- Marin, S.; Ramos, A.J.; Cano-Sancho, G.; Sanchis, V. Mycotoxins: Occurrence, toxicology, and exposure assessment. Food. Chem. Toxicol. 2013, 60, 218–237. [Google Scholar] [CrossRef]
- Neal, G.E.; Eaton, D.L.; Judah, D.J.; Verma, A. Metabolism and toxicity of aflatoxins M1 and B1 in human-derived in vitro systems. Toxicol. Appl. Pharmacol. 1998, 151, 152–158. [Google Scholar] [CrossRef] [PubMed]
- Harrison, J.C.; Carvajal, M.; Garner, R.C. Does aflatoxin exposure in the United Kingdom constitute a cancer risk? Environ. Health Perspect. 1993, 99, 99–105. [Google Scholar] [CrossRef]
- Wu, J.M.; Gan, Z.D.; Zhuo, R.H.; Zhang, L.L.; Wang, T.; Zhong, X. Resveratrol Attenuates Aflatoxin B(1)-Induced ROS Formation and Increase of m(6)A RNA Methylation. Animals 2020, 10, 677. [Google Scholar] [CrossRef]
- Zhang, Y.X.; Huang, D.Y.; Wei, Z.; Chen, K.Q. Primary sequence-assisted prediction of m(6)A RNA methylation sites from Oxford nanopore direct RNA sequencing data. Methods 2022, 203, 62–69. [Google Scholar] [CrossRef]
- Xiong, X.S.; Li, X.Y.; Yi, C.Q. N(1)-methyladenosine methylome in messenger RNA and non-coding RNA. Curr. Opin. Chem. Biol. 2018, 45, 179–186. [Google Scholar] [CrossRef]
- Ma, J.J.; Song, B.W.; Wei, Z.; Huang, D.Y.; Zhang, Y.X.; Su, J.L.; de Magalhães, J.P.; Rigden, D.J.; Meng, J.; Chen, K.Q. m5C-Atlas: A comprehensive database for decoding and annotating the 5-methylcytosine (m5C) epitranscriptome. Nucleic Acids Res. 2022, 50, D196–D203. [Google Scholar] [CrossRef] [PubMed]
- Adams, J.M.; Cory, S. Modified nucleosides and bizarre 5’-termini in mouse myeloma mRNA. Nature 1975, 255, 28–33. [Google Scholar] [CrossRef] [PubMed]
- Song, B.W.; Tang, Y.J.; Chen, K.Q.; Wei, Z.; Rong, R.; Lu, Z.L.; Su, J.L.; de Magalhães, J.P.; Rigden, D.J.; Meng, J. m7GHub: Deciphering the location, regulation and pathogenesis of internal mRNA N7-methylguanosine (m7G) sites in human. Bioinformatics 2020, 36, 3528–3536. [Google Scholar] [CrossRef] [PubMed]
- Xie, S.S.; Chen, W.W.; Chen, K.H.; Chang, Y.X.; Yang, F.; Lin, A.F.; Shu, Q.; Zhou, T.H.; Yan, X.Y. Emerging roles of RNA methylation in gastrointestinal cancers. Cancer Cell Int. 2020, 20, 585. [Google Scholar] [CrossRef] [PubMed]
- Chen, Y.M.; Zhou, C.X.; Sun, Y.Y.; He, X.Z.; Xue, D. m(6)A RNA modification modulates gene expression and cancer-related pathways in clear cell renal cell carcinoma. Epigenomics 2020, 12, 87–99. [Google Scholar] [CrossRef]
- Wu, Y.J.; Chen, X.Y.; Bao, W.Q.; Hong, X.Y.; Li, C.T.; Lu, J.T.; Zhang, D.C.; Zhu, A. Effect of humantenine on mRNA m6A modification and expression in human colon cancer cell line HCT116. Genes 2022, 13, 781. [Google Scholar] [CrossRef] [PubMed]
- Paramasivam, A.; Priyadharsini, J.V. Epigenetic modifications of RNA and their implications in antiviral immunity. Epigenetics 2020, 12, 1673–1675. [Google Scholar] [CrossRef] [PubMed]
- Meyer, K.D.; Saletore, Y.; Zumbo, P.; Elemento, O.; Mason, C.E.; Jaffrey, S.R. Comprehensive analysis of mRNA methylation reveals enrichment in 3’ UTRs and near stop codons. Cell 2012, 149, 1635–1646. [Google Scholar] [CrossRef]
- Kim, D.; Paggi, J.M.; Park, C.; Bennett, C.; Salzberg, S.L. Graph-based genome alignment and genotyping with HISAT2 and HISAT-genotype. Nat. Biotechnol. 2019, 37, 907–915. [Google Scholar] [CrossRef]
- Pertea, M.; Kim, D.; Pertea, G.M.; Leek, J.T.; Salzberg, S.L. Transcript-level expression analysis of RNA-seq experiments with HISAT, StringTie and Ballgown. Nat. Protoc. 2016, 11, 1650–1667. [Google Scholar] [CrossRef]
- Love, M.I.; Huber, W.; Anders, S. Moderated estimation of fold change and dispersion for RNA-seq data with DESeq2. Genome Biol. 2014, 15, 550. [Google Scholar] [CrossRef] [PubMed]
- Meng, J.; Cui, X.D.; Rao, M.K.; Chen, Y.D.; Huang, Y.F. Exome-based analysis for RNA epigenome sequencing data. Bioinformatics 2013, 29, 1565–1567. [Google Scholar] [CrossRef] [PubMed]
- Tang, Y.J.; Chen, K.Q.; Song, B.W.; Ma, J.M.; Wu, X.Y.; Xu, Q.R.; Wei, Z.; Su, J.L.; Liu, G.; Rong, R.; et al. m6A-Atlas: A comprehensive knowledgebase for unraveling the N6-methyladenosine (m6A) epitranscriptome. Nucleic Acids Res. 2021, 49, D134–D143. [Google Scholar] [CrossRef] [PubMed]
- Bailey, T.L. STREME: Accurate and versatile sequence motif discovery. Bioinformatics 2021, 37, 2834–2840. [Google Scholar] [CrossRef]
- Wang, Y.; Chen, K.Q.; Wei, Z.; Coenen, F.; Su, J.; Meng, J. MetaTX: Deciphering the distribution of mRNA-related features in the presence of isoform ambiguity, with applications in epitranscriptome analysis. Bioinformatics 2021, 37, 1285–1291. [Google Scholar] [CrossRef]
- Song, B.W.; Huang, D.Y.; Zhang, Y.X.; Wei, Z.; Su, J.L.; Pedro de Magalhães, J.; Rigden, D.J.; Meng, J.; Chen, K.Q. m6A-TSHub: Unveiling the Context-specific m(6)A Methylation and m6A-affecting Mutations in 23 Human Tissues. Genom. Proteom. Bioinf. 2022, S1672-0229, 00114-0. [Google Scholar] [CrossRef]
- Jiao, X.L.; Sherman, B.T.; da Huang, W.; Stephens, R.; Baseler, M.W.; Lane, H.C.; Lempicki, R.A. DAVID-WS: A stateful web service to facilitate gene/protein list analysis. Bioinformatics 2012, 28, 1805–1806. [Google Scholar] [CrossRef]
- Song, B.W.; Chen, K.Q.; Tang, Y.J.; Wei, Z.; Su, J.L.; de Magalhães, J.P.; Rigden, D.J.; Meng, J. ConsRM: Collection and large-scale prediction of the evolutionarily conserved RNA methylation sites, with implications for the functional epitranscriptome. Brief. Bioinform. 2021, 22, bbab088. [Google Scholar] [CrossRef]
- Song, B.W.; Wang, X.; Liang, Z.M.; Ma, J.M.; Huang, D.Y.; Wang, Y.; de Magalhães, J.P.; Rigden, D.J.; Meng, J.; Liu, G.; et al. RMDisease V2.0: An updated database of genetic variants that affect RNA modifications with disease and trait implication. Nucleic Acids Res. 2022, gkac750. [Google Scholar] [CrossRef]
- Li, J.H.; Liu, S.; Zhou, H.; Qu, L.H.; Yang, J.H. starBase v2.0: Decoding miRNA-ceRNA, miRNA-ncRNA and protein-RNA interaction networks from large-scale CLIP-Seq data. Nucleic Acids Res. 2014, 42, D92–D97. [Google Scholar] [CrossRef]
- Jumper, J.; Evans, R.; Pritzel, A.; Green, T.; Figurnov, M.; Ronneberger, O.; Tunyasuvunakool, K.; Bates, R.; Žídek, A.; Potapenko, A.; et al. Highly accurate protein structure prediction with AlphaFold. Nature 2021, 596, 583–589. [Google Scholar] [CrossRef] [PubMed]
- Gao, H.; Zhang, L.; Zhu, A.; Liu, X.Y.; Wang, T.X.; Wan, M.Q.; Yang, X.W.; Zhang, Y.T.; Zhang, Y.B. Metabolic Profiling of Nuciferine In Vivo and In Vitro. J. Agr. Food Chem. 2020, 68, 14135–14147. [Google Scholar] [CrossRef] [PubMed]
- Sun, Y.Q.; Zhang, X.; Shen, X.F.; Wang, S.; Wang, Q.; Yang, X.W. Computational and experimental characterization of isomers of escin-induced renal cytotoxicity by inhibiting heat shock proteins. Eur. J. Pharmacol. 2021, 908, 174372. [Google Scholar] [CrossRef] [PubMed]
- Zhu, A.; Sun, Y.Q.; Zhong, Q.W.; Yang, J.L.; Zhang, T.; Zhao, J.W.; Wang, Q. Effect of euphorbia factor L1 on oxidative stress, apoptosis, and autophagy in human gastric epithelial cells. Phytomedicine 2019, 64, 152929. [Google Scholar] [CrossRef]
- Dominissini, D.; Moshitch-Moshkovitz, S.; Schwartz, S.; Salmon-Divon, M.; Ungar, L.; Osenberg, S.; Cesarkas, K.; Jacob-Hirsch, J.; Amariglio, N.; Kupiec, M.; et al. Topology of the human and mouse m6A RNA methylomes revealed by m6A-seq. Nature 2012, 485, 201–206. [Google Scholar] [CrossRef]
- Wu, C.Q.; Gao, Y.N.; Li, S.L.; Huang, X.; Bao, X.Y.; Wang, J.Q.; Zheng, N. Modulation of intestinal epithelial permeability and mucin mRNA (MUC2, MUC5AC, and MUC5B) expression and protein secretion in Caco-2/HT29-MTX co-cultures exposed to aflatoxin M1, ochratoxin A, and zearalenone individually or collectively. Toxicol. Lett. 2019, 309, 1–9. [Google Scholar] [CrossRef]
- Akbari, P.; Braber, S.; Varasteh, S.; Alizadeh, A.; Garssen, J.; Fink-Gremmels, J. The intestinal barrier as an emerging target in the toxicological assessment of mycotoxins. Arch. Toxicol. 2017, 91, 1007–1029. [Google Scholar] [CrossRef]
- Wang, W.J.; Xu, Z.L.; Yu, C.; Xu, X.H. Effects of aflatoxin B1 on mitochondrial respiration, ROS generation and apoptosis in broiler cardiomyocytes. Anim. Sci. J. 2017, 88, 1561–1568. [Google Scholar] [CrossRef]
- Yuan, S.B.; Wu, B.Y.; Yu, Z.Q.; Fang, J.; Liang, N.; Zhou, M.Q.; Huang, C.; Peng, X. The mitochondrial and endoplasmic reticulum pathways involved in the apoptosis of bursa of Fabricius cells in broilers exposed to dietary aflatoxin B1. Oncotarget 2016, 7, 65295–65306. [Google Scholar] [CrossRef]
- Paschen, W.; Frandsen, A. Endoplasmic reticulum dysfunction--a common denominator for cell injury in acute and degenerative diseases of the brain? J. Neurochem. 2001, 79, 719–725. [Google Scholar] [CrossRef]
- Niwa, M. A cell cycle checkpoint for the endoplasmic reticulum. BBA Mol. Cell Res. 2020, 1867, 118825. [Google Scholar] [CrossRef] [PubMed]
- Yin, H.; Jiang, M.; Peng, X.; Cui, H.M.; Zhou, Y.; He, M.; Zuo, Z.C.; Ouyang, P.; Fan, J.; Fang, J. The molecular mechanism of G2M cell cycle arrest induced by AFB1 in the jejunum. Oncotarget 2016, 7, 35592–35606. [Google Scholar] [CrossRef] [PubMed]
- Li, H.; Guan, K.; Zuo, Z.C.; Wang, F.Y.; Peng, X.; Fang, J.; Cui, H.M.; Zhou, Y.; Ouyang, P.; Su, G.; et al. Effects of aflatoxin B(1) on the cell cycle distribution of splenocytes in chickens. J. Toxicol. Pathol. 2019, 32, 27–36. [Google Scholar] [CrossRef] [PubMed]
- Liu, Y.; Du, M.; Zhang, G.Y. Proapoptotic activity of aflatoxin B(1) and sterigmatocystin in HepG2 cells. Toxicol. Rep. 2014, 1, 1076–1086. [Google Scholar] [CrossRef]
- Bravo-Sagua, R.; Rodriguez, A.E.; Kuzmicic, J.; Gutierrez, T.; Lopez-Crisosto, C.; Quiroga, C.; Díaz-Elizondo, J.; Chiong, M.; Gillette, T.G.; Rothermel, B.A.; et al. Cell death and survival through the endoplasmic reticulum-mitochondrial axis. Curr. Mol. Med. 2013, 13, 317–329. [Google Scholar] [CrossRef]
- Dlamini, M.B.; Gao, Z.Y.; Hasenbilige; Jiang, L.; Geng, C.Y.; Li, Q.J.; Shi, X.X.; Liu, Y.; Cao, J. The crosstalk between mitochondrial dysfunction and endoplasmic reticulum stress promoted ATF4-mediated mitophagy induced by hexavalent chromium. Environ. Toxicol. 2021, 36, 1162–1172. [Google Scholar] [CrossRef] [PubMed]
- Liu, H.; Wang, Z.; Nowicki, M.J. Caspase-12 mediates carbon tetrachloride-induced hepatocyte apoptosis in mice. World J. Gastroenterol. 2014, 20, 18189–18198. [Google Scholar] [CrossRef]
- Wu, R.F.; Jiang, D.H.; Wang, Y.Z.; Wang, X.X. N (6)-Methyladenosine (m(6)A) Methylation in mRNA with A Dynamic and Reversible Epigenetic Modification. Mol. Biotechnol. 2016, 58, 450–459. [Google Scholar] [CrossRef]
- Huang, D.Y.; Chen, K.Q.; Song, B.W.; Wei, Z.; Su, J.L.; Coenen, F.; de Magalhães, J.P.; Rigden, D.J.; Meng, J. Geographic encoding of transcripts enabled high-accuracy and isoform-aware deep learning of RNA methylation. Nucleic Acids Res. 2022, 50, 10290–10310. [Google Scholar] [CrossRef]
- Zhang, Y.X.; Jiang, J.; Ma, J.M.; Wei, Z.; Wang, Y.; Song, B.W.; Meng, J.; Jia, G.F.; de Magalhães, J.P.; Rigden, D.J.; et al. DirectRMDB: A database of post-transcriptional RNA modifications unveiled from direct RNA sequencing technology. Nucleic Acids Res. 2022, gkac1061. [Google Scholar] [CrossRef]
- Vermeulen, K.; Berneman, Z.N.; Van Bockstaele, D.R. Cell cycle and apoptosis. Cell Prolif. 2003, 36, 165–175. [Google Scholar] [CrossRef] [PubMed]
- Zhang, H.; Zhang, X.; Li, X.; Meng, W.B.; Bai, Z.T.; Rui, S.Z.; Wang, Z.F.; Zhou, W.C.; Jin, X.D. Effect of CCNB1 silencing on cell cycle, senescence, and apoptosis through the p53 signaling pathway in pancreatic cancer. J. Cell. Physiol. 2018, 234, 619–631. [Google Scholar] [CrossRef] [PubMed]
- Kruse, R.; Vind, B.F.; Petersson, S.J.; Kristensen, J.M.; Højlund, K. Markers of autophagy are adapted to hyperglycaemia in skeletal muscle in type 2 diabetes. Diabetologia 2015, 58, 2087–2095. [Google Scholar] [CrossRef]
- Le Grand, J.N.; Chakrama, F.Z.; Seguin-Py, S.; Fraichard, A.; Delage-Mourroux, R.; Jouvenot, M.; Boyer-Guittaut, M. GABARAPL1 (GEC1): Original or copycat? Autophagy 2011, 7, 1098–1107. [Google Scholar] [CrossRef] [PubMed]
- Mizushima, N.; Yoshimori, T. How to interpret LC3 immunoblotting. Autophagy 2007, 3, 542–545. [Google Scholar] [CrossRef]
- Guzel, E.; Basar, M.; Ocak, N.; Arici, A.; Kayisli, U.A. Bidirectional interaction between unfolded-protein-response key protein HSPA5 and estrogen signaling in human endometrium. Biol. Reprod. 2011, 85, 121–127. [Google Scholar] [CrossRef]
- Li, P.P.; Zhang, M.H.; Zou, Y.; Sun, Z.L.; Sun, C.; Geng, Z.M.; Xu, W.M.; Wang, D.Y. Interaction of heat shock protein 90 B1 (Hsp90B1) with liposome reveals its potential role in protection the integrity of lipid membranes. Int. J. Biol. Macromol. 2018, 106, 1250–1257. [Google Scholar] [CrossRef]
Disclaimer/Publisher’s Note: The statements, opinions and data contained in all publications are solely those of the individual author(s) and contributor(s) and not of MDPI and/or the editor(s). MDPI and/or the editor(s) disclaim responsibility for any injury to people or property resulting from any ideas, methods, instructions or products referred to in the content. |
© 2022 by the authors. Licensee MDPI, Basel, Switzerland. This article is an open access article distributed under the terms and conditions of the Creative Commons Attribution (CC BY) license (https://creativecommons.org/licenses/by/4.0/).