Abstract
As the quality of beef products has received increasing attention, it is essential to explore the underlying transcriptional and epigenetic mechanisms of meat traits. Our project uses Qinchuan cattle as the research subject. First, we examined the spatiotemporal expression pattern of the CFL1 gene in a panel of fetal bovine, calf, and adult cattle samples. Then, we performed DNA methylation experiments of CFL1 on myogenesis and muscle maturation using the BSP amplification and COBRA sequencing techniques and found that high DNA methylation levels showed low expression levels. Next, we performed an assay between bta-miR-182 and the CFL1 gene and demonstrated that miR-182 could promote bovine primary myoblast differentiation by negatively regulated the expression of CFL1. Finally, we constructed an adenovirus overexpression and interference vector and found that CFL1 could suppress the differentiation of bovine primary myoblasts. In summary, our experiment comprehensively analyzes the epigenetic regulation mechanisms of the CFL1 gene in the development and differentiation of bovine primary myoblasts. This has far-reaching significance for improving the meat production and meat quality of Qinchuan cattle. This can provide reliable data support and a theoretical research basis for the rapid and efficient breeding selection of local yellow cattle and the genetic improvement of meat quality.
1. Introduction
Epigenetics has recently evolved from a collection of diverse phenomena to a defined and far-reaching field of study [1]. The growth and development of skeletal muscle is the primary factor in agricultural meat production and meat quality. Therefore, it is important to research the molecular regulation mechanism of meat traits from the angle of genetics and epigenetics [2]. As the quality of beef products has received increasing attention, studies have shown that the structure of muscle composition and the histological characteristics of muscle fibers are closely related to meat quality. Moreover, the cofilin gene is believed to function as an actin assembly regulator in muscle tissue, playing a key role in the function and regeneration of normal muscles. Cofilin-1 is ubiquitously expressed in most cell types throughout development and adulthood, and it plays an important role in cell migration, proliferation, phagocytosis, and the development of various types of cancers [3].
In mammals, cofilin-1 is also named N-cofilin (non-muscle type cofilin, NM-type cofilin, cofilin-1, CFL1) [4]. The cofilin-1 gene is located on chromosome 11q13 and is mainly expressed in various non-muscle tissues, especially in the liver and brain [5,6]. Studies have shown that mammalian homologous cofilin-ineffective yeast cells cannot survive autonomously; however, the expression of mammalian CFL1 can rescue these mutant cells [7,8].
Studies have shown that the expression of cofilin changes with the growth and development of healthy mouse muscle cells and can gradually transition from the initial NM-type CFL1 to the late M-type (muscle type) CFL2 [4]. The CFL1 gene and the expression of the CFL2 gene can be detected in skeletal muscle during embryonic development, but with the development of muscle growth, the CFL2 gene gradually replaces the expression of the CFL1 gene, until the expression of the CFL1 gene disappears [9]. Therefore, in adult skeletal muscle, the main detection is CFL2 (wherein 30~50% is phosphorylated) gene expression, and almost no detection of CFL1 gene expression. However, taking mouse embryos as the research object, ADF-/- knockout embryos have no effect on the survival of mouse embryos and can complete the following embryonic development function normally [10]. However, the CFL1-/- knockout embryo was unable to complete normal embryo development [11]. For brain-specific CFL1-/- knockout mice, the cell cycle and cell migration of the cerebral cortex are affected to different degrees, indicating that CFL1 plays an important role in regulating the migration of cerebral cortical neurons during the development of mouse embryos [12]. In a study of the mechanism by which CFL1 regulates the development of cancer, CFL1 can induce epithelial interstitial transformation in gastric cancer cells through skeletal recombination, and silencing CFL1 can inhibit tumor metastasis [13].
However, it is not clear how the CFL1 gene is involved in the growth and development of myoblasts. Therefore, our project takes local Qinchuan (QC) cattle as the research subject. We examined the spatiotemporal expression pattern of the CFL1 gene and performed DNA methylation experiments of CFL1 on myogenesis and muscle maturation, and performed an assay between bta-miR-182 and the CFL1 gene, and studied the function of the CFL1 gene on the differentiation of bovine primary myoblasts. This work comprehensively analyzes the mechanism of the CFL1 gene from the point of view of genetics and epigenetics and further studies the molecular genetic regulation network of the CFL1 gene. This has far-reaching significance to improve the meat production and meat quality of QC cattle and can provide reliable data support and a theoretical research basis for the rapid and efficient breeding of local yellow cattle and the genetic improvement of meat quality.
2. Materials and Methods
2.1. Ethics Approval and Consent to Participate
All animal experiments were carried out in accordance with the guidelines of the Institutional Administrative Committee and Ethics Committee of Laboratory Animals (license number: SYXK [Su] 2017-0044) and were approved by the Yangzhou University Institutional Animal Care and Use Committee.
2.2. Tissue Preparation and Cell Culture
Samples of seven tissues (heart, liver, spleen, lung, kidney, fat, and muscle) from nine individuals (three individuals per stage) were harvested for RNA isolation (Figure S1) within 10 min after slaughter at three key stages of myogenesis and muscle maturation: 90 days at embryo (fetal bovine, FB), 1 month after birth (calf), and 24 months old (adult bovine, AB).
The HEK293 and C2C12 cell lines were provided by our laboratory. Bovine primary myoblasts were isolated and cultured from bovine longissimus muscle as previously described [14]. The cell lines were cultured in high-glucose Dulbecco’s modified Eagle’s medium (DMEM, HyClone, Logan, UT, USA) containing 10% fetal bovine serum (FBS, Gibco, Carlsbad, CA, USA). Bovine primary myoblasts were generated using high-glucose DMEM with 20% FBS (Gibco, Carlsbad, CA, USA). All cells were cultured at 37 °C containing 5% CO2 (Figure S2).
2.3. Vector Construction
For overexpression of the bovine CFL1 gene, we designed and synthesized CFL1 primers containing KpnI and HindIII (TaKaRa, Dalian, China) restriction sites, and the primer sequences are shown in Table 1 (CFL1-CMV-F and CFL1-CMV-R). The cDNA of the bovine CFL1 gene was cloned from QC cattle longissimus muscle. The coding sequences of CFL1 were subcloned into the pAdTrack-CMV plasmid vector to construct the recombinant shuttle vector pAdTrack/CMV-CFL1. Then, this vector was homologously recombined with plasmid pAdEasy-1 to generate an adenoviral plasmid in BJ5183 cells. The adenoviral plasmids linearized by PacI (TaKaRa, Dalian, China) were transfected into HEK293 cells to generate the adenovirus pAdEasy-1/pAdtrack-CMV-CFL1 (CFL1-CMV).

Table 1.
Primer information for vector construction.
For interference with the bovine CFL1 gene, the BlockiT shRNA interference system was used. We designed and synthesized two pairs of primers for the CFL1 gene (shCFL1-1F, shCFL1-1R, shCFL1-2F, shCFL1-2R) and one pair of primers for the negative control (NC, shRNA-NC-F, and shRNA-NC-R). All primer sequences contacting the BamHI and HindIII (TaKaRa, Dalian, China) restriction sites are shown in Table 1. The oligonucleotides were cloned into the pENTR/CMV-GFP/U6 vector to construct shuttle vectors pENTR/CMV-GFP/U6-shCFL1-1 and pENTR/CMV-GFP/U6-shCFL1-2 and then recombined with the adenovirus backbone vector pAD/PL-DEST to produce recombinant vectors pAD/PL-DEST/CMV-GFP/U6-shCFL-1 (shCFL1-1) and pAD/PL-DEST/CMV-GFP/U6-shCFL-2 (shCFL1-2). After detection of the interference efficiency of shCFL1-1 and shCFL1-2, fifth-generation recombinant adenovirus particles (shCFL1-2) were produced and further amplified by transfecting HEK293 cells. The titer of adenovirus reached 1.58 × 10⁹ PFU/mL, as determined by TCID50 assays. The entire process for adenovirus generation and proliferation was performed as previously described [15]. Myoblasts at approximately 80% confluence were transfected with adenovirus supernatant at a multiplicity of infection (MOI) = 200.
The CFL1 3′UTR sequence including the miR-182 binding site was amplified using a forward primer and reverse primer (CFL1-wild-F and CFL1-wild-R shown in Table 2). An 8-base deletion in the miR-182 binding site of the CFL1 3′UTR was generated with a pair of mutagenic primers (CFL1-mut-F and CFL1-mut-R shown in Table 2). The two fragments were ligated into the 3′-end of the Renilla gene in the psiCHECK-2 dual-luciferase reporter vector (Promega, Madison, WI, USA) using restriction enzymes XhoI and NotI (TaKaRa, Dalian, China) and then ligated by T4 DNA ligase (TaKaRa, Dalian, China) to produce the vectors psiCHECK-2-CFL1-wild (CFL1-Luc) and psiCHECK-2-CFL1-mutated (CFL1-del Luc). The miR-182 mimic and inhibitor were obtained from GenePharma (Shanghai, China).
Table 2.
Primer information for dual luciferase report assay.
2.4. Cell Treatment
To detect the transfection efficiency of the recombinant vector, CFL1-CMV, shCFL1-1 or shCFL1-2 was transfected into HEK293 cells. To investigate myocyte differentiation, the growth medium (GM) was changed to differentiation medium (DM, 2% horse serum (HyClone, Logan, UT, USA) instead of 10% or 20% FBS) after cell confluence reached approximately 80%. The C2C12 cell lines were cultured for 1, 2, 4, 6, and 8 days prior to RNA extraction. Meanwhile, CFL1-CMV, pAdTrack-CMV vector (control, CTRL), shCFL1-2 or siRNA negative control (NC) was transfected into bovine primary myoblasts using Lipofectamine 2000 (Invitrogen, Carlsbad, CA, USA) to confirm the regulatory mechanism of the CFL1 gene on myoblast differentiation. Cells were harvested for RNA and protein extraction at 1, 3, 5, and 7 days. The miR-182 mimic or inhibitor was also transfected into primary myoblasts using Lipofectamine 2000 (Invitrogen, Carlsbad, CA, USA) to confirm the effect of miR-182 on myoblast differentiation. The cells were cultured in DM for 4 days.
2.5. Dual Luciferase Reporter Assay
Cells were cultured in 48-well plates until the cell growth reached approximately 80% confluence. The miR-182 (bta-miR-182, Bos taurus miR-182) mimic and CFL1-Luc or CFL1-del Luc were co-transfected into cells by Lipofectamine 2000 (Invitrogen, Carlsbad, CA, USA). The transfection reagent was replaced with fresh GM 4~6 h after transfection. Next, the cells were washed with PBS and harvested using 200 mL passive lysis buffer (PLB) 24 h post-transfection and rocked for 30 min at room temperature. Firefly and Renilla luciferase activities were measured using the Dual-Luciferase Reporter (DLR) Assay System (Promega, Madison, WI, USA). Both reporter activities were quantitated within the same sample of lysate prepared from cells co-transfected with psiCHECK-2 control vector and pRL-SV40 vector (Promega, Madison, WI, USA). The firefly luciferase activities were normalized to the Renilla luciferase activities in each well. Firefly luciferase luminescence was quenched by greater than 5 orders of magnitude.
2.6. Quantitative Real-Time PCR (qRT-PCR) and Western Blot
Total RNA was extracted from tissues or cells, and then 500 ng total RNA was converted to cDNA using the PrimeScript RT regent Kit (TaKaRa, Dalian, China). Random primers, oligo (dT) or miRNA-specific stem-loop primers were designed and used for reverse-transcribed cDNA (Table 3). Gene-specific primers for CFL1 genes were designed based on published mRNA sequences using Primer Premier 5.0 software (PREMIER Biosoft International, Palo Alto, CA, USA). Transcription levels were normalized to the levels of the housekeeping genes GAPDH and U6. The primers are listed in Table 3.
Table 3.
Primer information for qRT-PCR.
Total proteins were extracted from cells using RIPA protein lysis buffer containing 1 mM PMSF (Solarbio; Beijing, China), and probed with monoclonal rabbit anti-CFL1 (ab131519; Abcam, Cambridge, UK) and anti-GAPDH (ab9485; Abcam, Cambridge, UK). Anti-immune rabbit IgG-HRP (LK2001; Sungene Biotech, Tianjin, China) was used as secondary antibody, antibody-reacting bands were detected using ECL luminous fluid (Solarbio, Beijing, China).
2.7. Bisulfite Sequencing Polymerase Chain Reaction (BSP) and COBRA
Longissimus dorsi DNA was harvested from eight male individuals (four individuals per stage) within 10 min after slaughter at two key stages of myogenesis and muscle maturation: 90-day embryo (fetal bovine, FB) and 24 months old (adult bovine, AB). The BSP primers were designed by the online MethPrimer software [16]. The details of BSP-amplified nucleotide sequences of CFL1 DMR (differentially methylated region) are shown in Table 4. Three independent amplification experiments were performed for the CFL1 gene in each sample. We sequenced five clones from each independent amplification and cloning set; hence, there were 15 clones for the CFL1 DMR in each sample.
Table 4.
Primer information for BSP.
The COBRA (Combined bisulfite restriction analysis) technique is a variation of bisulfite sequencing and combines bisulfite conversion-based polymerase chain reaction with restriction digestion. The PCR products hold a natural TaqI endonuclease restriction site (T^CGA) when the CpG dinucleotides are methylated; otherwise, the site cannot be digested if one or more CpG dinucleotides within its recognition sequence are unmethylated. Therefore, in the mixed population of resulting PCR fragments, the ratio of band intensity of the digested fraction to the combined intensities of both the digested and undigested fractions reflected the levels of DNA methylation on the restriction sites.
2.8. Statistical Analysis
All data are presented as the mean ± SE of n = 3 independent experiments, each performed in triplicate. If the one-way ANOVA results were significant, Duncan’s multiple-range test was performed for multiple comparisons, with values of p < 0.05 and p < 0.01 accepted as statistically significant and highly significant, respectively. They were all analyzed by SPSS software (version 18.0). The relative gene expression levels were determined using the 2−ΔΔCt method [17]. GraphPad Prism V8.0 software was used for generating figures.
The final sequence results of BSP were processed by the online software QUMA [18] or BiQ Analyzer [19]. The DNA methylation levels of the BSP sequencing results are output in circles. The significance test of differences in methylation levels was analyzed by SPSS software (version 18.0, SPSS Inc., Chicago, IL, USA).
3. Results
3.1. Spatiotemporal Expression Patterns of the CFL1 Gene
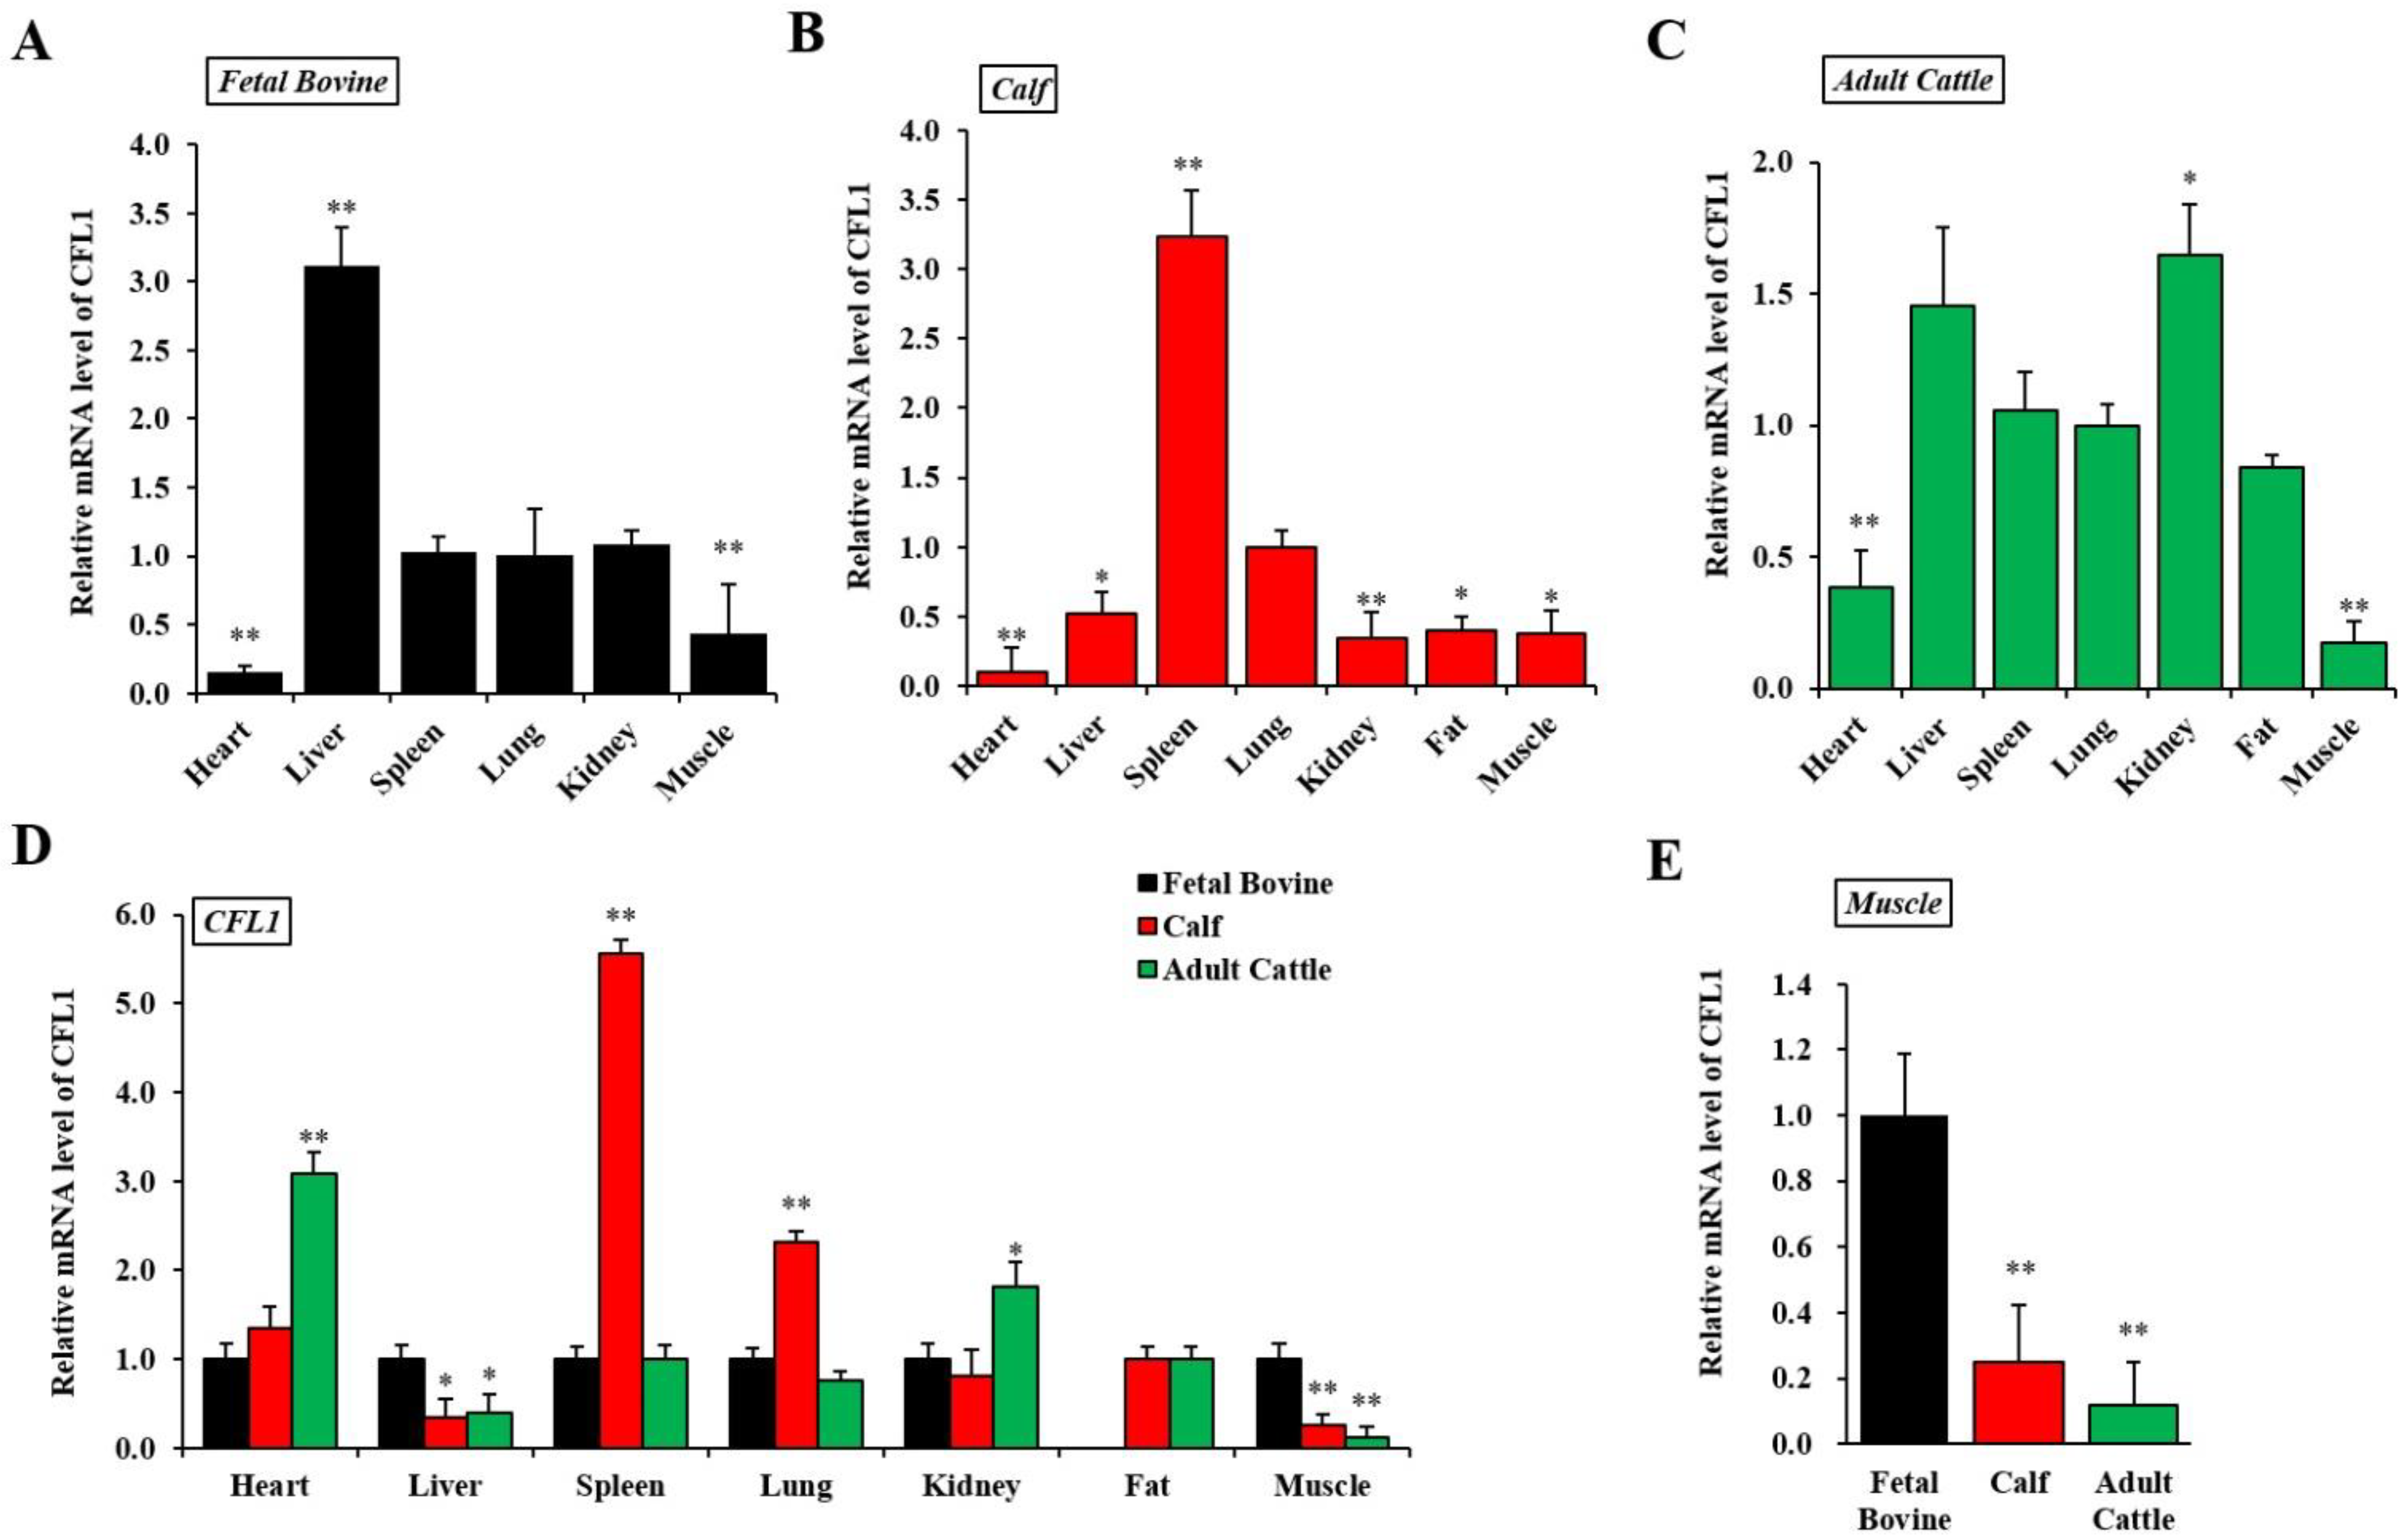
To understand CFL1 function, we first examined the expression pattern of CFL1 in a panel of fetal bovine, calf, and adult cattle samples using qRT-PCR. We calculated the relative mRNA expression level of the CFL1 gene in seven tissues in three developmental stages in QC cattle, and the average Ct value of lung tissue was used as a benchmark.
In fetal bovine, the CFL1 gene was most highly expressed in liver tissue (3.11 ± 0.29), significantly higher than that of other tissues (p < 0.01) and was lowest in the heart (0.15 ± 0.06). The expression level among spleen, lung and kidney tissues were not significantly different (p > 0.05) (Figure 1A). In the seven tissues from calves, the CFL1 gene was most highly expressed in spleen tissue (3.23 ± 0.34), significantly higher than other tissues (p < 0.01) and was lowest in the heart (0.10 ± 0.18). The expression levels among liver, kidney, fat, and muscle tissues were not significantly different (p > 0.05) (Figure 1B). In the seven adult bovine tissues, the CFL1 gene was most highly expressed in kidney tissue (1.65 ± 0.19) and was lowest in muscle (0.17 ± 0.08). The expression levels among liver, spleen, lung, and fat tissues were not significantly different (p > 0.05) (Figure 1C).
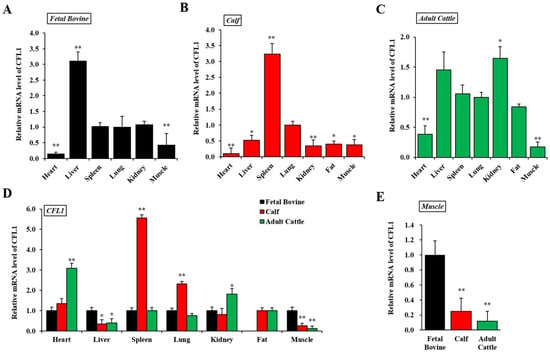
Figure 1.
Spatiotemporal expression patterns of the CFL1 gene in Qinchuan cattle. Relative spatial expression level was analyzed by qRT-PCR in different tissues of three growth and development stages: Qinchuan fetal bovine (A), Qinchuan calf (B), Qinchuan adult cattle (C). The expression levels of lung tissues were considered as 1. Temporal expression patterns of the CFL1 gene in different tissues of Qinchuan cattle. Relative temporal expression levels in three periods and seven tissues of Qinchuan cattle were investigated using qRT-PCR (D,E). The expression levels of all tissues in fetal bovine were considered as 1. The mRNA expression level of CFL1 was normalized to GAPDH. Data are means ± SE of n = 3 independent experiments, each performed in triplicate. *, p < 0.05 and **, p < 0.01, two-tailed t test.
Using the average Ct value of fetal bovine tissues as a benchmark, we further calculated the relative mRNA expression level of the CFL1 gene in the same tissues in three stages of development in QC cattle, as shown in Figure 1D. In heart tissues, the CFL1 gene showed the lowest expression level in fetal bovines and the highest in adult bovines.
In liver tissue, the expression level of the CFL1 gene in the calf and adult bovine stages showed a decreasing trend compared with that of fetal bovine (p < 0.05), with the lowest expression level in the calf stage, and the difference of expression level between the calf and adult bovine stage was not significant (p > 0.05). In kidney tissue, the expression level of the CFL1 gene was highest in the adult cattle stage and lowest in the calf stage, and the expression level of the CFL1 gene showed an overall weak upward trend with growth stage. Compared to the level of expression in embryos and adult bovines, CFL1 RNA was dramatically upregulated in spleen and lung tissues in calves (p < 0.01). In fat samples, because fetal bovines lacked fat deposition, we only detected expression in calves and adult bovines, and the expression levels of the CFL1 gene were not significantly different between calves and adult bovines (p > 0.05). In muscle tissue, the expression level of the CFL1 gene was the highest in the fetal bovine stage, and the expression level was the lowest in the adult cattle stage, which showed a significant decrease in expression level with age (p < 0.01) (Figure 1E).
3.2. Study on DNA Methylation Level of CFL1 Gene Promoter
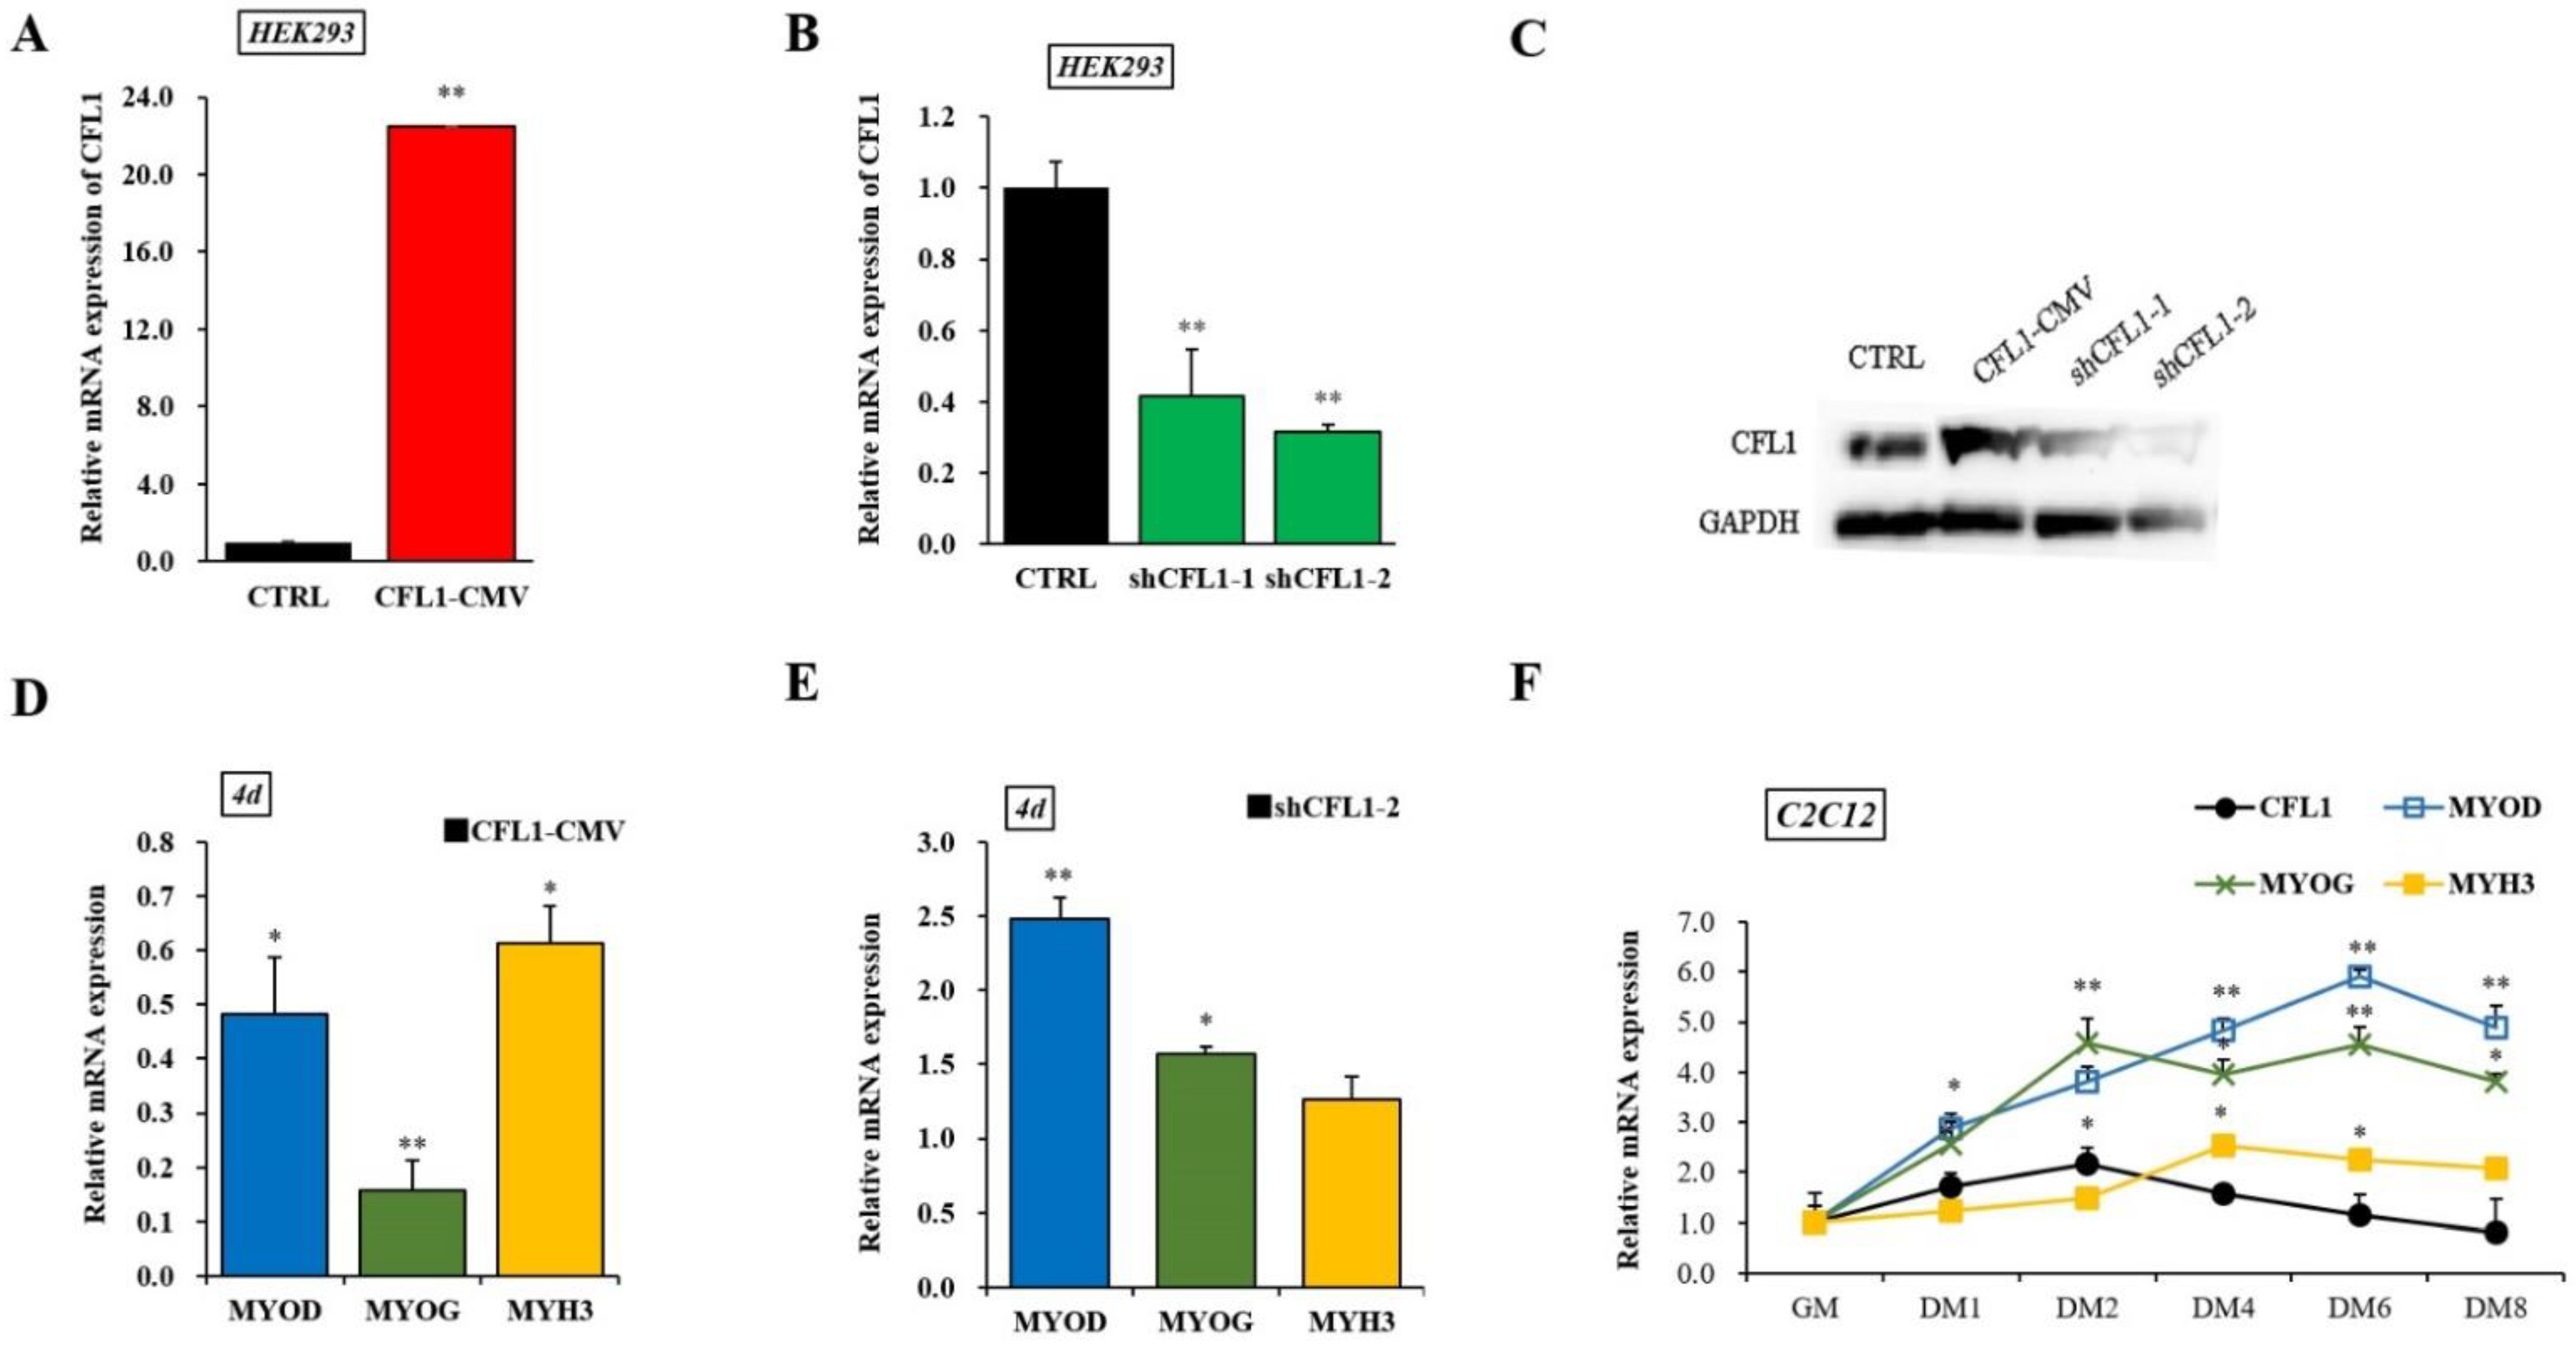
To confirm the effect of epigenetic modification of the CFL1 gene on myoblast differentiation, we performed DNA methylation experiments on myogenesis and muscle maturation. The CpG islands located in the CFL1 DMR were predicted using online software. We found one CpG island in the promoter region of the CFL1 gene as our research target (Figure 2A). The methylation patterns of the CpG islands were determined using bisulfite-assisted sequencing. The DNA methylation pattern of CFL1 promoter DMR in the bovine muscle tissues analyzed by BSP is shown in Figure 2B.
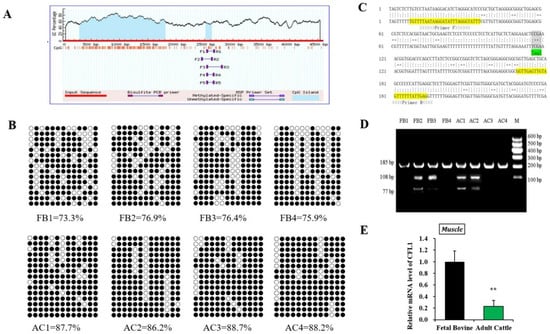
Figure 2.
Study on DNA methylation level of CFL1 gene promoter. Schematic representation of the proximal promoter region (+1 to −4580 base pairs) of the bovine CFL1 gene (modified output of MethPrimer program) to predict regions of high GC content. The 185 bp CpG islands in that promoter are evident in the 5′ part of the gene (A). DNA methylation patterns of muscle tissue in the fetal bovine group and adult bovine group analyzed by BSP. Each line represents one individual bacterial clone, and each circle one single CpG dinucleotide. Open circles show unmethylated CpG’s and black circles methylated CpG’s (B). Nucleotide sequences for a 185 bp CFL1 DMR (total 13 CpG islands) fragment (upper strands) and its bisulfite-converted version (lower strands). Primers sequences are marked with arrows. Squared nucleotides (CpG sites) contain Taq I (“TCGA”) (7th CpG site) restriction sites for COBRA analyses (C). DNA methylation patterns of muscle tissues in the fetal bovine group (FB, n = 4) and adult bovine (AB, n = 4) group analyzed by COBRA (D). Relative mRNA expression pattern of the CFL1 gene was analyzed in muscle tissues, the mRNA expression level of CFL1 was normalized to GAPDH (E). The data represented the mean ± SE based on three independent experiments (**, p < 0.01). M: Marker I.
Methylation data from BSP sequencing were analyzed by computing the percentage of methylated CpGs of the total number of CpGs using QUMA software. The BSP-amplified sequences of the promoter DMR (185 bp) have 13 CpGs, and we sequenced 15 clones in each muscle sample. Hence, there were 195 CpGs of CFL1 DMR in each muscle sample, and the percentages of methylated CpGs in the FB group were 73.3%, 76.9%, 76.4% and 75.9%, respectively. The DNA methylation level values in the AC group were 87.7%, 86.2%, 88.7% and 88.2%, respectively. Statistical results showed high DNA methylation levels in the FB group and AC group, whereas the AC group (mean 87.7%) had significantly higher DNA methylation levels than the FB group (mean 75.6%).
To confirm that the BSP sequencing results reflect the overall methylation status, we further performed COBRA analysis using the restriction enzyme TaqI (“TCGA”) for CFL1 promoter DMR (Figure 2C) on the same bisulfite-treated PCR amplification products that were used for the BSP sequencing. The BSP amplified nucleotide sequences, and a cleavage CpG site of the CFL1 promoter DMR is shown in Figure 2D. At the 7th CpG site, digestion of the 185 bp PCR fragment of CFL1 DMR with TaqI resulted in fragment lengths of 185, 108 and 77 bp bands by COBRA. During sodium bisulfite treatment, unmethylated cytosine residues were converted to “T”, whereas methylated cytosine residues were retained as “C”. The results were consistent with the BSP sequencing results, which confirmed that the BSP sequencing results were reliable. Therefore, in the mixed population of resulting PCR fragments, the fraction that has a cleaved or retained restriction site reflects the percentage DNA methylation in the original genomic DNA.
To further confirm whether the methylation status of the CFL1 gene affects its level of expression in muscle tissue, we detected the expression level of the CFL1 gene in the FB group and AC group. The expression level of the CFL1 gene in the FB group was significantly higher than that in the AC group (p < 0.01) (Figure 2E). Combined with the above results, high DNA methylation levels showed low expression levels.
3.3. Target Regulation of the CFL1 Gene by microRNA
To further determine the effect of epigenetic modification of the CFL1 gene on myoblast differentiation, we performed a dual-luciferase reporter assay between the miR-182 and CFL1 genes. First, we predicted the potential miRNAs of the CFL1 gene using TargetScan7.1, DIANA and miRBase tools and found that miR-182 has a highly conserved binding site in the CFL1 3′-UTR. Thus, we inferred that miR-182 might affect the transcription of CFL1. To verify this hypothesis, we examined the changes in CFL1 mRNA expression after transfection with the miR-182 mimic or inhibitor for 48 h. The qRT-PCR assays showed that the expression level of mature miR-182 was significantly higher or lower after transfection of the miR-182 mimic or inhibitor in C2C12 cell lines (p < 0.01 or p < 0.05) (Figure 3A). The qRT-PCR and western blot analysis indicated that the CFL1 expression level was significantly downregulated or upregulated after transfection of the miR-182 mimic or inhibitor in bovine primary myoblasts (p < 0.05) (Figure 3B,C). These results indicated that miR-182 negatively regulated the expression of CFL1. The Renilla luciferase activity of bovine primary myoblasts co-transfected with miR-182 mimic and CFL1-Luc was significantly decreased compared to the cells containing only the negative control vector (p < 0.01), while luciferase activity was recovered in cells co-transfected with miR-182 mimic and CFL1-del Luc (p > 0.05) (Figure 3E). These results demonstrated that miR-182 directly targets CFL1 by binding to its 3′-UTR.
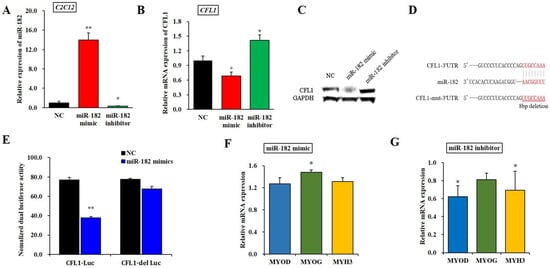
Figure 3.
Regulatory relationship between miR-182 and the CFL1 gene. Expression efficiency of miR-182 was detected by qRT-PCR in C2C12 cells after being transfected with miR-182 mimic and inhibitor for 48 h (A). CFL1 mRNA (B) and protein (C) expression in bovine primary myoblasts were detected by qRT-PCR and western blot after being transfected with miR-182 mimic, miR-182 inhibitor and NC for 48 h. Sequence of miR-182 and its predicted binding site in CFL1 3′UTR and mutation 3′UTR (D). The miR-182 mimic or NC co-transfected with CFL1-Luc and CFL1-del Luc into bovine primary myoblasts individually, and Renilla luciferase activity was normalized to the firefly luciferase activity (E). The expression of myoblast differentiation marker genes MYOD, MYOG, and MYH3 were detected by qRT-PCR after being transfected with miR-182 mimic or inhibitor into C2C12 cells and induced for 4-day by 2% horse serum (F,G). The expression level of miR-182 was normalized to U6, the mRNA expression levels of CFL1, MYOD, MYOG, and MYH3 were normalized to GAPDH. Data are means ± SE of n = 3 independent experiments, each performed in triplicate. *, p < 0.05 and **, p < 0.01, two-tailed t test. NC, Negative Control; means.
To determine whether miR-182 affects cell differentiation, C2C12 cells transfected with miR-182 mimic or inhibitor were induced to differentiate for 4 days, and the myoblast differentiation marker genes MYOD, MYOG, and MYH3 were detected by qRT-PCR. We found that the expression of MYOD and MYH3 was significantly downregulated after transfection with the miR-182 mimic (p < 0.05), whereas the change in MYOG expression level was not significant (p > 0.05). Interestingly, the expression of MYOG was significantly upregulated after transfection with the miR-182 inhibitor (p < 0.05), while the expression levels of MYOD and MYH3 were not significantly changed (p > 0.05) (Figure 3F–G). Taken together, these results revealed that miR-182 could promote bovine primary myoblast differentiation.
3.4. Effects of the CFL1 Gene on the Differentiation of Myoblasts
To establish the involvement of CFL1 in myoblast differentiation, we constructed an adenovirus overexpression and interference vector. The qRT-PCR and western blot assays showed that the expression level of CFL1 was significantly increased or decreased after transfection of CFL1-CMV or shCFL1 in HEK293 cells (p < 0.01), and shCFL1-2 had a greater interference effect than shCFL1-1 (Figure 4A–C). We transfected CFL1-CMV or shCFL1-2 into C2C12 cells to induce differentiation for 4 days, and the myoblast differentiation marker genes MYOD, MYOG, and MYH3 were detected by qRT-PCR. We found that the expression of MYOD, MYOG and MYH3 was significantly downregulated after transfection with CFL1-CMV (p < 0.05 or p < 0.01), and the expression of MYOG was significantly decreased compared with MYOD and MYH3. Interestingly, the expression of MYOD was significantly upregulated after transfection with shCFL1-2 (p < 0.01), while the expression level of MYH3 was not significantly changed (p > 0.05) (Figure 4D,E). Then, the expression of CFL1 was quantified in C2C12 cells after differentiation had been induced for 0, 1, 2, 4, 6 and 8 days. We found that CFL1 was gradually downregulated during myoblast differentiation compared with the level in growth medium (GM), with a slight increase after differentiation Day 2 (DM2). Three marker genes were upregulated during myoblast differentiation. The peak values of MYOD, MYOG and MYH3 occurred at DM6, DM2 and DM4 after induction, and expression decreased after DM6 (Figure 4F).

Figure 4.
Construction of adenovirus overexpression and interference vectors of the CFL1 gene. Expression efficiency of CFL1 was detected by qRT-PCR (A,B) and western blot (C) in HEK293 cells after being transfected with adenovirus overexpression (CFL1-CMV) and interference (shCFL1-1 and shCFL1-2) vectors for 48 h. The C2C12 cells were induced to differentiate for 4 days after being transfected with CFL1-CMV or shCFL1-2, and the relative expression of myoblast differentiation marker genes MYOD, MYOG, and MYH3 were detected by qRT-PCR (D,E). Expression trends of the CFL1 gene and myogenesis factors were detected in C2C12 cells after differentiation had been induced for 1, 2, 4, 6 and 8 days by 2% horse serum (F). The mRNA expression level was normalized to GAPDH. Data are means ± SE of n = 3 independent experiments, each performed in triplicate. *, p < 0.05 and **, p < 0.01, two-tailed t test. CTRL, Control. GM, growth medium. DM, differentiation medium.
Bovine primary myoblasts are an excellent model system for studying muscle cell differentiation in vitro. After transfection with CFL1-CMV, we found that CFL1 was significantly upregulated at 1 d, 3 d and 7 d (p < 0.05 or p < 0.01) (Figure 5A). However, the expression levels of MYOD, MYOG and MYH3 were not significantly different in the treatment group (p > 0.05) (Figure 5B–D). After transfection with shCFL1-2, CFL1 was significantly downregulated at 5 d and 7 d (p < 0.05) (Figure 5E), and MYH3 was significantly upregulated at 3 d (p < 0.05) (Figure 5H). Meanwhile, the expression levels of MYOD and MYOG were significantly upregulated on each day of myoblast differentiation (p < 0.05 or p < 0.01) (Figure 5F,G).

Figure 5.
Effects of the CFL1 gene on the differentiation of bovine primary myoblasts. Expression of CFL1, MYOD, MYOG and MYH3 were detected by qRT-PCR after being transfected with CFL1-CMV into bovine primary myoblasts and induced for 1, 3, 5, 7 days by 2% horse serum (A–D). Expression of CFL1, MYOD, MYOG and MYH3 was detected by qRT-PCR after being transfected with shCFL1-2 into bovine primary myoblasts and induced for 1, 3, 5, 7 days by 2% horse serum (E–H). Expression trends of CFL1 gene and myogenesis factors were detected by qRT-PCR after being transfected with CFL1-CMV or shCFL1-2 into bovine primary myoblasts and induced for 1, 3, 5, 7 days by 2% horse serum, the expression levels of four genes in GM were considered as 1 (I,J). The mRNA expression level was normalized to GAPDH. Data are means ± SE of n = 3 independent experiments, each performed in triplicate. *, p < 0.05 and **, p < 0.01, two-tailed t test. CTRL, Control. GM, growth medium.
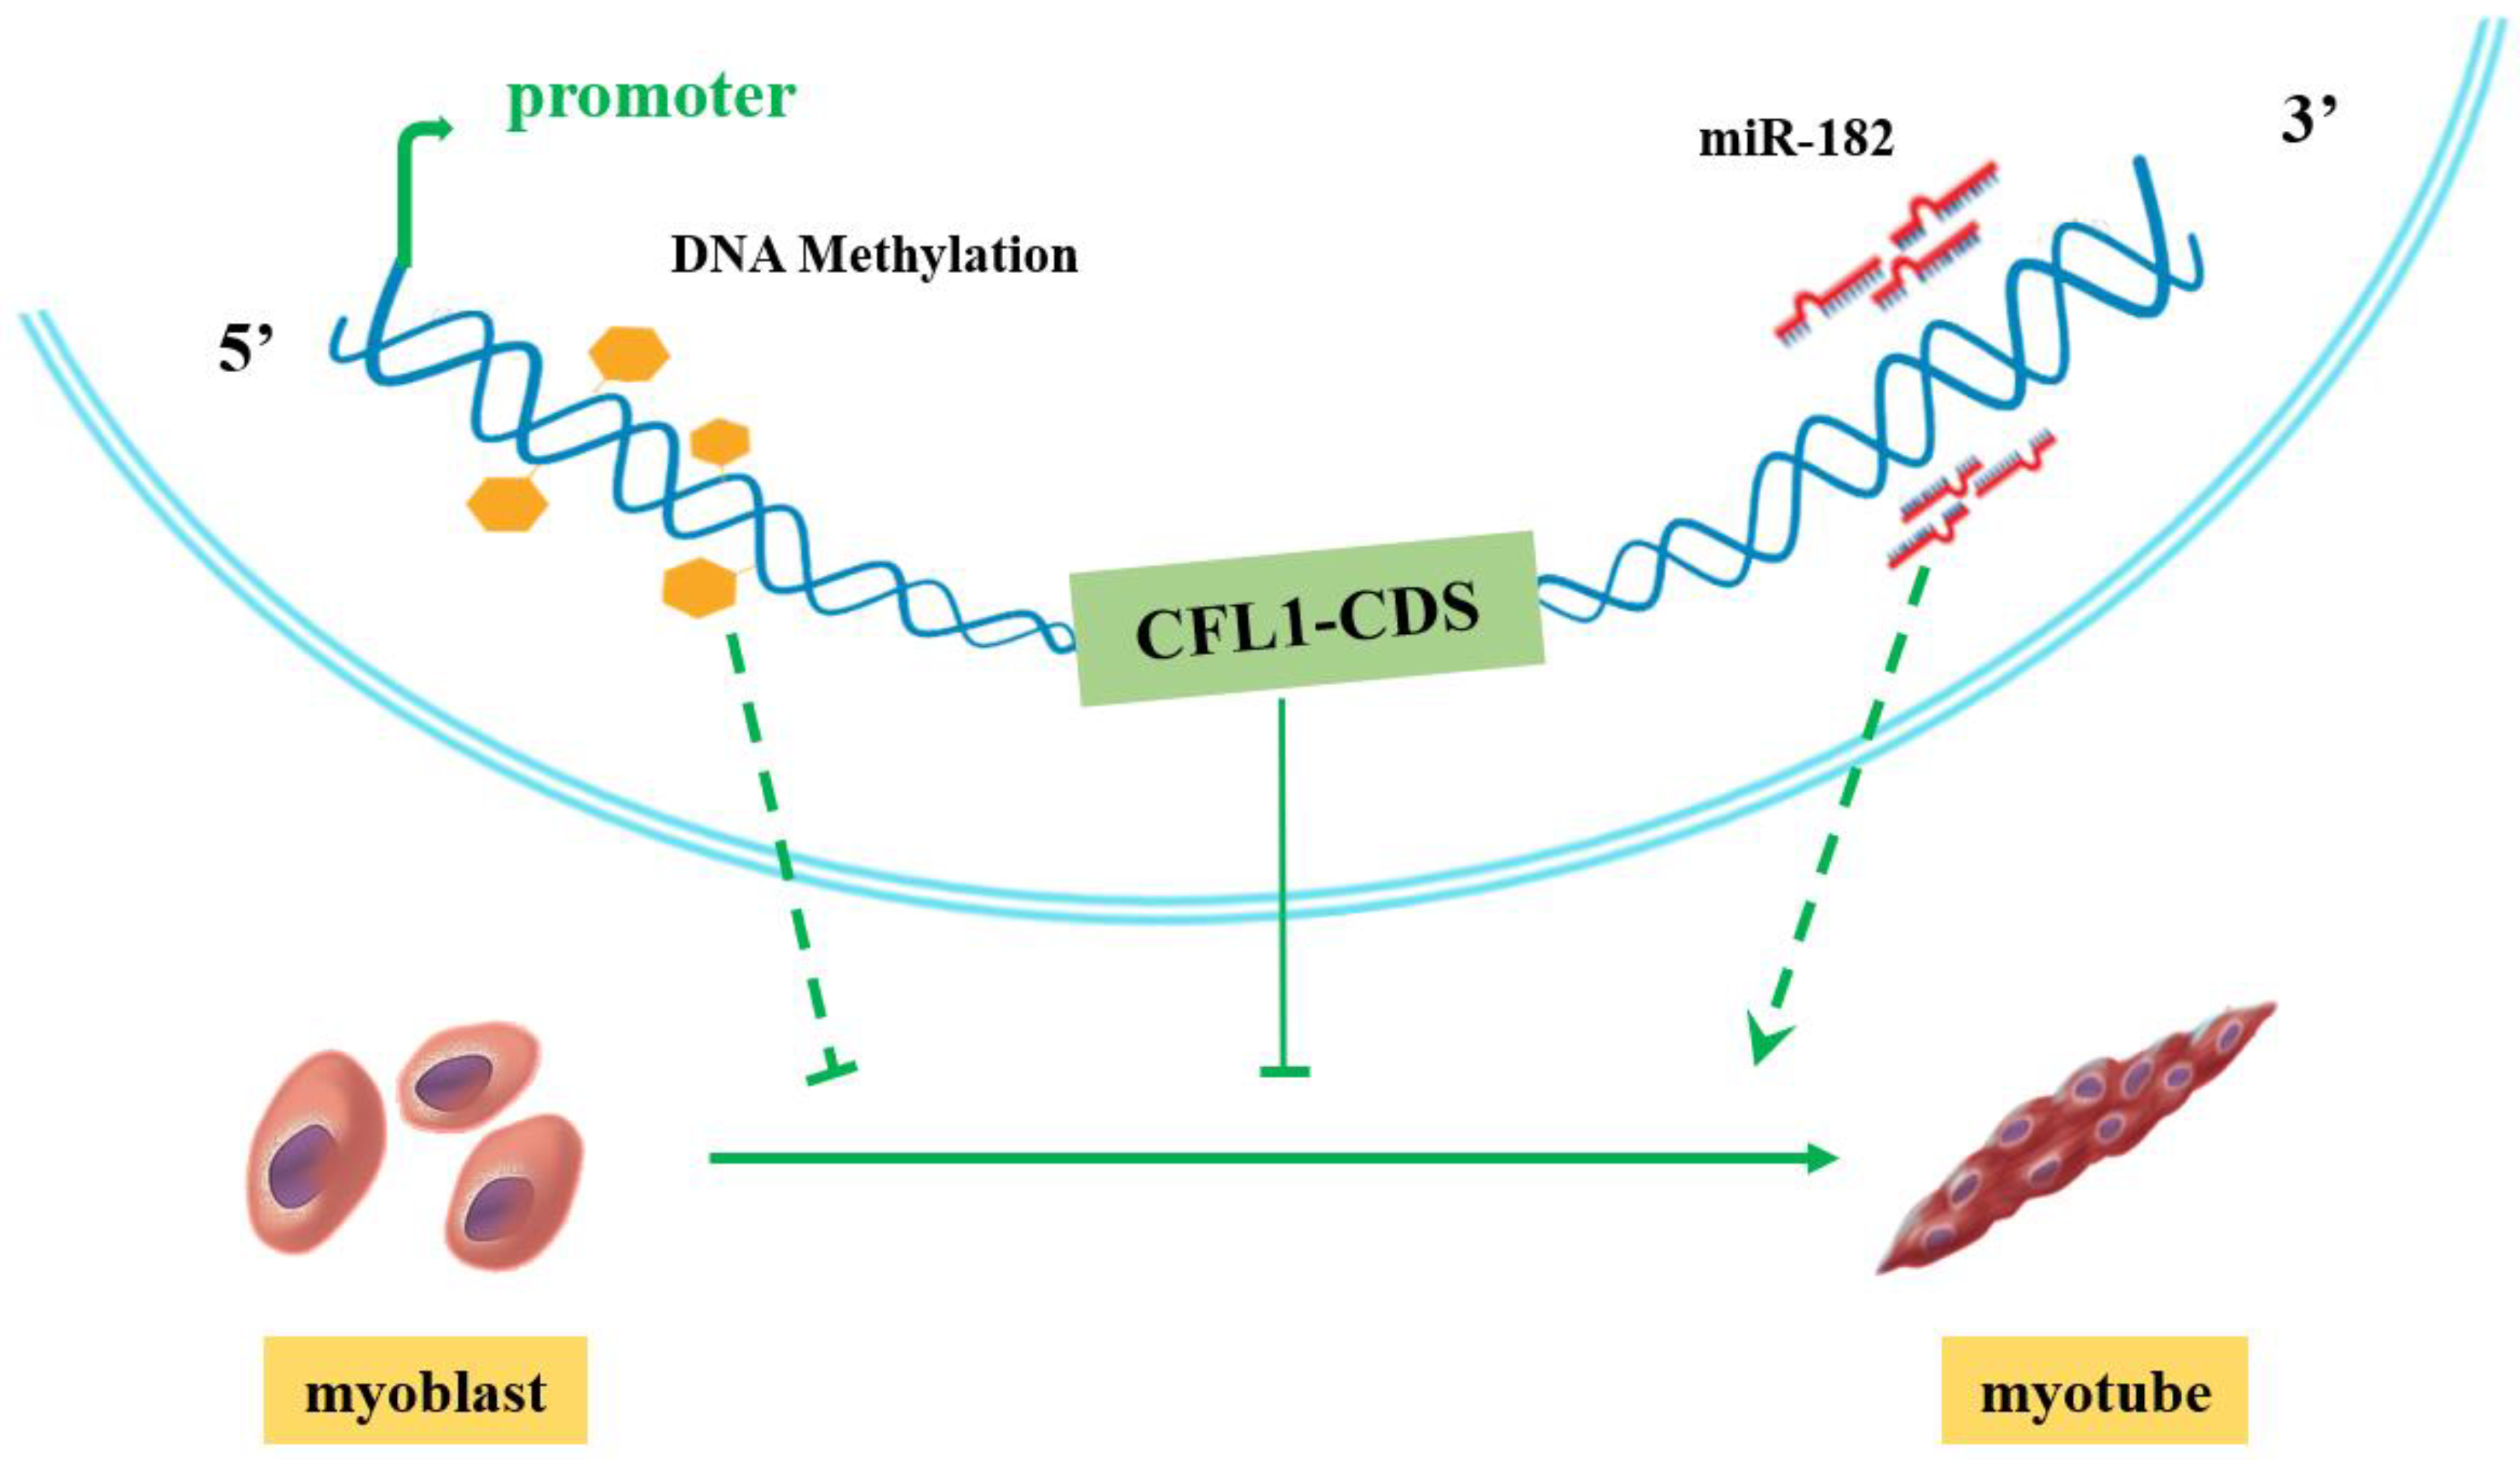
After transfection with CFL1-CMV, the expression of CFL1 was gradually upregulated during myoblast differentiation, and the peak values occurred at 5 d after induction (p < 0.01). The expression of MYOD, MYOG and MYH3 showed a downward trend (Figure 5I). After transfection with shCFL1-2, the expression of CFL1 slightly decreased during myoblast differentiation. The expression of MYOD and MYOG was significantly upregulated, and MYH3 showed a slight increase during myoblast differentiation (p < 0.05 or p < 0.01). The peak values of MYOG and MYH3 both occurred at 3 d after induction, and MYOD occurred at 5 d after induction (Figure 5J). Our experiment comprehensively analyzes the epigenetic regulation mechanisms of CFL1 gene in the development and differentiation of bovine primary myoblasts (Figure 6).
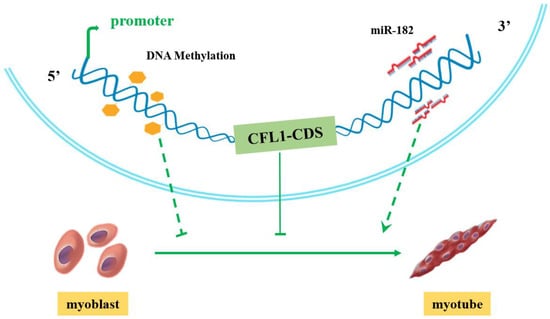
Figure 6.
Proposed model of how the CFL1 gene regulates the differentiation of bovine primary myoblasts.
4. Discussion
Muscle is an important factor that affects animal growth and development, and it is one of the crucial indicators to measure meat quality. For cattle, meat quality is an important quantitative characteristic that is regulated by the expression of a series of related genes, and its phenotypes have special regulatory mechanisms and a complex genetic basis. Regulation of gene expression can occur at the level of transcription or translation, affecting the mRNA level and the protein level [20]. Bovine primary myoblasts serve as an excellent model system for studying muscle cell differentiation in vitro. The differentiation of myoblast cells into myocytes or myotubes can be stimulated by changing the serum supplements. Therefore, it is particularly important to further study the molecular genetic regulation network of these genes that regulate muscle growth and development from the perspective of genetics and epigenetics.
Analysis of CFL1 gene cDNA sequences indicated that CFL1 has a wide tissue expression spectrum. This observation implies that the CFL1 gene may have various biological functions in different tissues of the organism. In the same tissues, the expression trend of the CFL1 gene was revealed at different developmental stages, and the effect of CFL1 gene expression may vary at three developmental stages. Our results showed that the CFL1 gene has abnormally high expression in spleen tissues during the calf stage. The spleen is the largest immune organ, and the data indicated that the CFL1 gene may be involved in mammalian cellular immunity and affect the development of tumors. This result is consistent with a previous report that the CFL1 gene can participate in cancer development [21,22]. However, the expression level of the CFL1 gene in adipose tissues was almost unchanged between calf and adult cattle, and the results suggested that the CFL1 gene was not involved in the regulatory mechanism of growth and differentiation during cattle adipose tissue development. In muscle tissues, the CFL1 gene showed a low expression pattern in the three developmental stages, and the expression level showed a significant decreasing trend with muscle growth and development. The results further confirmed that the expression of cofilin can gradually transition from the initial non-muscle CFL1 to muscle CFL2 with the growth and development of muscle cells [4,23]. However, our data showed that the expression level of the CFL1 gene was reduced approximately 10 times in adult cattle compared with fetal bovine cattle, and the CFL1 gene did not completely disappear in the muscle tissues of adult cattle. This result indicated that the CFL1 gene also plays an indispensable role in muscle growth and development, and the expression change was likely related to the regulatory role of external epigenetics.
Usually, DNA methylation that occurs in the gene promoter region can participate in establishing patterns of gene repression during muscle development and play an important role in the regulation of gene expression. The DNA methylation and expression in adipose and muscle tissues were examined in the differentially methylated region (DMR) of SERPINA3. The data showed that DNA methylation patterns had a significant influence on mRNA levels [24,25], and a study has shown that some methylated genes were identified as candidate biomarkers for beef tenderness [26]. In our previous research, IGF2 expression levels were negatively associated with the methylation status of IGF2 DMR in heart, spleen, lung and muscle tissues during fetal bovine and adult cattle stages [27]. In this experiment, the expression level of the CFL1 gene in the AC group was significantly lower than that in the FB group, and the AC group exhibited a significantly higher DNA methylation level than the FB group. There is a noticeable trend for high DNA methylation to reduce gene expression, and more data are required to reveal the exact influence of this tendency. In fetal bovine and adult cattle, the extent of DNA methylation and the expression level of complementary genes in the whole genome and the status of other epigenetic modifications are still unknown. Therefore, additional studies are needed to elucidate the significance of these unknown epigenetic variations in muscle growth and development.
The MiRNAs most likely function independently of other epigenetic mechanisms, and the regulatory mechanisms of epigenetics are mainly combined with specific seed sequences of target genes [28,29]. Studies have shown that miRNAs can be involved in the proliferation and differentiation of skeletal muscle by regulating approximately 1/3 of the genes in the human genome [30]. Due to the numerous miR-182 target genes, the mechanisms of miR-182 involved in the differentiation of skeletal muscle are quite complex and even inconsistent. Some studies have demonstrated that miR-182 may act on the proliferation, migration, and invasion of many cancers through suppression of FOXO1 [31,32,33]. Our previous experimental results showed that the FOXO1 gene plays an important role in the differentiation of bovine myoblasts [20]. Recent works have shown that cofilin-1 is a direct target of miR-182-5p in human bladder cancer, and loss of miR-182-5p in bladder cancer can promote cofilin-1 expression [34]. Our research showed that miR-182 can negatively regulate the CFL1 gene and confirmed the binding site between CFL1 and miR-182 by dual luciferase assay. After, we found that miR-182 may promote the differentiation of bovine primary myoblasts. This finding provided a basis for studying the function of miR-182 and further exploring whether miR-182 is involved in myoblast differentiation by regulating the role of CFL1.
The structure of muscle and the histological characteristics of muscle fibers are closely related to the quality of meat products, and the differentiation of muscle cells plays an important role in promoting the formation of muscle fibers and the development of muscle. In our experimental studies, we confirmed the positive regulatory role of miR-182 in myoblast differentiation, and we preliminarily determined the expression of the CFL1 gene in myoblast differentiation through the study of the CFL1 gene and related marker genes in C2C12 cells at different differentiation days.
Muscle differentiation is a multistage process involving cell cycle withdrawal, expression, activation of muscle-specific genes and proteins, and the fusion of mononucleated myocytes into multinucleated myofibers [35]. The peak values of MYOD, MYOG and MYH3 appeared at different time points, but then the expression levels all decreased after DM6. Therefore, we can deduce that MYOD, MYOG and MYH3 were activated in different stages after myoblast differentiation. There are no reported significant effects of the MYH3 gene after induction in primary bovine skeletal muscle cells. Many published studies have reported that CFL1 attenuates differentiation in the C2C12 cell line [36,37]. In our study, CFL1 was gradually downregulated during the differentiation of C2C12 cells, with a slight increase in DM2, when myotubes were completely formed, indicating that CFL1 tends to suppress the differentiation of myocytes. After, the overexpression and interference vector of the CFL1 gene was transfected into bovine primary myoblasts to further determine the specific regulatory mechanism of CFL1 in myoblast differentiation.
Previous studies have shown that the cofilin gene can regulate the function and regeneration of normal muscle. Therefore, as a subtype of cofilin, non-muscle CFL1 plays a particularly important role in muscle growth and development. Studies have shown that the expression of cofilin changes with the growth and development of healthy mouse muscle cells. In embryonic skeletal muscle, the CFL1 and CFL2 genes can be expressed simultaneously. However, with the growth and development of muscle, the CFL1 gene is gradually replaced by the CFL2 gene at the end of myocyte differentiation [4,9]. The MYOD, MYOG and MYH3 are members of the myogenic regulatory factor MRF family, which can activate muscle gene transcription and drive the transformation of non-muscular cells into muscle cells. The MRFs regulate the occurrence and development of whole muscle, play an important role in myoblast differentiation, and can be used as marker genes in the process of myoblast differentiation to reflect the degree of myoblast differentiation. Our research has showed that the overexpression of the CFL1 gene had no significant effect on the expression of MYOD, MYOG and MYH3, indicating that increasing the expression of the CFL1 gene did not play a significant role in the differentiation of bovine primary myoblasts. However, knocking down the expression of the CFL1 gene increased the expression of MYOD, MYOG and MYH3 during the differentiation of bovine primary myoblasts, revealing that CFL1 could suppress myoblast differentiation. This fact may be related to the gradual disappearance of CFL1 at the end of muscle fiber differentiation. CFL1 gain-of-function is associated with impaired myoblast differentiation, but loss-of-function can partly restore the inhibition of differentiation by wortmannin [38].
5. Conclusions
Our research showed that CFL1 could suppress the differentiation of bovine primary myoblasts and illustrated the epigenetic regulation mechanisms of the CFL1 gene in the development and differentiation of bovine primary myoblasts. This study has far-reaching significance to improve the meat production and meat quality of Qinchuan cattle. It can provide reliable data to support and a theoretical research basis for the rapid and efficient breeding selection of local yellow cattle and the genetic improvement of meat quality.
Supplementary Materials
The following supporting information can be downloaded at https://www.mdpi.com/article/10.3390/genes13050723/s1. Figure S1: Agarose gel of electrophoresis pattern of total RNA; Figure S2: Bovine primary myoblasts (×100).
Author Contributions
Conceptualization, Y.S.; validation, Y.M. (Yaoyao Ma); formal analysis, Y.S.; investigation, Y.M. (Yaoyao Ma) and T.Z.; data curation, T.Z.; writing—original draft preparation, Y.S.; writing—review and editing, Y.M. (Yongjiang Mao); supervision, Z.Y.; project administration, M.L.; funding acquisition, Y.S. and Z.Y. All authors have read and agreed to the published version of the manuscript.
Funding
This work was supported by the National Natural Science Foundation of China (grants No. 31902147, 31872324).
Institutional Review Board Statement
All animal experiments were carried out in accordance with the guidelines of the Institutional Administrative Committee and Ethics Committee of Laboratory Animals (license number: SYXK [Su] 2017-0044) and were approved by the Yangzhou University Institutional Animal Care and Use Committee.
Informed Consent Statement
Not applicable.
Data Availability Statement
Not applicable.
Acknowledgments
We are grateful to Hong Chen team (Northwest A&F University) for their samples and technical support.
Conflicts of Interest
The authors declare no conflict of interest.
References
- Goldberg, A.D.; Allis, C.; Bernstein, E.J.C. Epigenetics: A Landscape Takes Shape. Cell 2007, 128, 635–638. [Google Scholar] [CrossRef] [PubMed] [Green Version]
- Pas, M.T.; Keuning, E.; Hulsegge, B.; Hoving-Bolink, A.H.; Evans, G.; Mulder, H.A. Longissimus muscle transcriptome profiles related to carcass and meat quality traits in fresh meat Pietrain carcasses. J. Anim. Sci. 2010, 88, 4044–4055. [Google Scholar] [CrossRef] [PubMed]
- Hotulainen, P.; Paunola, E.; Vartiainen, M.K.; Lappalainen, P. Actin-depolymerizing Factor and Cofilin-1 Play Overlapping Roles in Promoting Rapid F-Actin Depolymerization in Mammalian Nonmuscle Cells. Mol. Biol. Cell 2005, 16, 649. [Google Scholar] [CrossRef] [PubMed]
- Ono, S.; Minami, N.; Abe, H.; Obinata, T. Characterization of a novel cofilin isoform that is predominantly expressed in mammalian skeletal muscle. J. Biol. Chem. 1994, 269, 15280–15286. [Google Scholar] [CrossRef]
- Rust, M.B. Novel functions for ADF/cofilin in excitatory synapses—Lessons from gene-targeted mice. Commun. Integr. Biol. 2015, 8, e1114194. [Google Scholar] [CrossRef] [PubMed] [Green Version]
- Kuramitsu, Y.; Wang, Y.; Okada, F.; Baron, B.; Tokuda, K.; Kitagawa, T.; Akada, J.; Nakamura, K. Malignant progressive tumor cell clone exhibits significant up-regulation of cofilin-2 and 27-kDa modified form of cofilin-1 compared to regressive clone. Anticancer Res. 2013, 33, 3661. [Google Scholar]
- Moon, A.L.; Janmey, P.A.; Louie, K.A.; Drubin, D.G. Cofilin is an essential component of the yeast cortical cytoskeleton. J. Cell Biol. 1993, 120, 421–435. [Google Scholar] [CrossRef]
- Kazuko, I.; Kenji, M.; Seiji, M.; Hiroshi, K.; Eisuke, N.; Ichiro, Y. Isolation of a yeast essential gene, COF1, that encodes a homologue of mammalian cofilin, a low-Mr actin-binding and depolymerizing protein. Gene 1993, 124, 115–120. [Google Scholar] [CrossRef]
- Mohri, K.; Takano-Ohmuro, H.; Nakashima, H.; Hayakawa, K.; Endo, T.; Hanaoka, K.; Obinata, T. Expression of cofilin isoforms during development of mouse striated muscles. J. Muscle Res. Cell Motil. 2000, 21, 49–57. [Google Scholar] [CrossRef]
- Ikeda, S.; Cunningham, L.A.; Boggess, D.; Hawes, N.; Hobson, C.D.; Sundberg, J.P.; Naggert, J.K.; Smith, R.S.; Nishina, P.M. Aberrant actin cytoskeleton leads to accelerated proliferation of corneal epithelial cells in mice deficient for destrin (actin depolymerizing factor). Hum. Mol. Genet. 2003, 12, 1029–1037. [Google Scholar] [CrossRef]
- Gurniak, C.B.; Perlas, E.; Witke, W. The actin depolymerizing factor n-cofilin is essential for neural tube morphogenesis and neural crest cell migration. Dev. Biol. 2005, 278, 231–241. [Google Scholar] [CrossRef] [PubMed] [Green Version]
- Bellenchi, G.C.; Gurniak, C.B.; Perlas, E.; Middei, S.; Ammassariteule, M.; Witke, W. N-Cofilin Is Associated with Neuronal Migration Disorders and Cell Cycle Control in the Cerebral Cortex. Genes Dev. 2007, 21, 2347–2357. [Google Scholar] [CrossRef] [PubMed] [Green Version]
- Haibo, W.; Lide, T.; Feng, J.; Hao, G.; Xiaojun, D.; Tengyang, N.; Jun, F.; Yanbing, D.; Weiming, X.; Yayun, Q. Cofilin 1 induces the epithelial-mesenchymal transition of gastric cancer cells by promoting cytoskeletal rearrangement. Oncotarget 2017, 8, 39131. [Google Scholar]
- Miyake, M.; Takahashi, H.; Kitagawa, E.; Watanabe, H.; Sakurada, T.; Aso, H.; Yamaguchi, T.J.C.; Research, T. AMPK activation by AICAR inhibits myogenic differentiation and myostatin expression in cattle. Cell Tissue Res. 2012, 349, 615–623. [Google Scholar] [CrossRef]
- Luo, J.; Deng, Z.L.; Luo, X.; Tang, N.; Song, W.X.; Chen, J.; Sharff, K.A.; Luu, H.H.; Haydon, R.C.; Kinzler, K.W.; et al. A protocol for rapid generation of recombinant adenoviruses using the AdEasy system. Nat. Protoc. 2007, 2, 1236. [Google Scholar] [CrossRef] [Green Version]
- Li, L.C.; Dahiya, R. MethPrimer: Designing primers for methylation PCRs. Bioinformatics 2002, 18, 1427–1431. [Google Scholar] [CrossRef] [Green Version]
- Schmittgen, T.D.; Livak, K.J. Analyzing real-time PCR data by the comparative CT method. Nat. Protoc. 2008, 3, 1101–1108. [Google Scholar] [CrossRef]
- Kumaki, Y.; Oda, M.; Okano, M. QUMA: Quantification tool for methylation analysis. Nucleic Acids Res. 2008, 36, 170–175. [Google Scholar] [CrossRef]
- Bock, C.; Reither, S.; Mikeska, T.; Paulsen, M.; Walter, J.; Lengauer, T. BiQ Analyzer: Visualization and quality control for DNA methylation data from bisulfite sequencing. Bioinformatics 2005, 21, 4067–4068. [Google Scholar] [CrossRef]
- Sun, Y.; Liu, K.; Huang, Y.; Lan, X.; Chen, H. Differential expression of FOXO1 during development and myoblast differentiation of Qinchuan cattle and its association analysis with growth traits. Sci. China Life Sci. 2018, 61, 826–835. [Google Scholar] [CrossRef]
- Werle, S.D.; Schwab, J.D.; Tatura, M.; Kirchhoff, S.; Kestler, H.A. Unraveling the Molecular Tumor-Promoting Regulation of Cofilin-1 in Pancreatic Cancer. Cancers 2021, 13, 725. [Google Scholar] [CrossRef] [PubMed]
- Kakurina, G.; Cheremisina, O.V.; Sereda, E.E.; Kolegova, E.S.; Choinzonov, E. The Level of Cytoskeleton Remodeling Proteins in the Blood Serum and the Expression of Their mRNA in the Tumor Tissue in Metastasis of the Larynx and Hypopharynx Cancer. Mol. Biol. Rep. 2021, 48, 5135–5142. [Google Scholar] [CrossRef] [PubMed]
- Gillett, G.T.; Fox, M.F.; Rowe, P.; Casimir, C.M.; Povey, S. Mapping of human non-muscle type cofilin (CFL1) to chromosome 11q13 and muscle-type cofilin (CFL2) to chromosome 14. Ann. Hum. Genet. 2012, 60, 201–211. [Google Scholar] [CrossRef] [PubMed]
- Cedar, H.; Bergman, Y. Linking DNA methylation and histone modification: Patterns and paradigms. Nat. Rev. Genet. 2009, 10, 295–304. [Google Scholar] [CrossRef] [PubMed]
- Wang, D.; Wen, Y.; Zhang, Z.; Yang, S.; Liu, X.; Cai, C.; An, Q.; Lyu, S.; He, H.; Xie, J.; et al. DNA methylation status of SERPINA3 gene involved in mRNA expression in three cattle breeds. Anim. Biotechnol. 2021, 1–7. [Google Scholar] [CrossRef]
- Zhao, C.; Ji, G.; Carrillo, J.A.; Li, Y.; Tian, F.; Baldwin, R.L., VI; Zan, L.; Song, J. The Profiling of DNA Methylation and Its Regulation on Divergent Tenderness in Angus Beef Cattle. Front. Genet. 2020, 11, 939. [Google Scholar] [CrossRef]
- Huang, Y.Z.; Zhan, Z.Y.; Sun, Y.J.; Cao, X.K.; Li, M.X.; Wang, J.; Lan, X.Y.; Lei, C.Z.; Zhang, C.L.; Chen, H. Intragenic DNA methylation status down-regulates bovine IGF2 gene expression in different developmental stages. Gene 2014, 534, 356–361. [Google Scholar] [CrossRef]
- Shabalina, S.A.; Spiridonov, N.A. The mammalian transcriptome and the function of non-coding DNA sequences. Genome Biol. 2004, 5, 105. [Google Scholar] [CrossRef] [Green Version]
- Clifford, R.L.; Singer, C.A.; John, A.E. Therapeutics. Epigenetics and miRNA emerge as key regulators of smooth muscle cell phenotype and function. Pulm. Pharmacol. Ther. 2013, 26, 75–85. [Google Scholar] [CrossRef] [Green Version]
- Meyer, S.U.; Thirion, C.; Polesskaya, A.; Bauersachs, S.; Kaiser, S.; Krause, S.; Pfaffl, M.W. TNF-α and IGF1 modify the microRNA signature in skeletal muscle cell differentiation. Cell Commun. Signal. 2015, 13, 4. [Google Scholar] [CrossRef] [Green Version]
- Guttilla, I.K.; White, B.A. Coordinate Regulation of FOXO1 by miR-27a, miR-96, and miR-182 in Breast Cancer Cells. J. Biol. Chem. 2009, 284, 23204–23216. [Google Scholar] [CrossRef] [PubMed] [Green Version]
- Dcab, C.; Mxab, C.; Ygab, C.; Ling, X.; Tzab, C.; Yao, H.; Mzab, C.; Lxab, C.; Jie, L.; Jsab, C.J.B. LIPUS promotes FOXO1 accumulation by downregulating miR-182 to enhance osteogenic differentiation in hPDLCs. Biochimie 2019, 165, 219–228. [Google Scholar]
- Wallis, C.J.D.; Gordanpour, A.; Bendavid, J.S.; Sugar, L.; Nam, R.K.; Seth, A. MiR-182 Is Associated with Growth, Migration and Invasion in Prostate Cancer via Suppression of FOXO1. J. Cancer 2015, 6, 1295–1305. [Google Scholar] [CrossRef] [PubMed] [Green Version]
- Wang, F.; Wu, D.; Xu, Z.; Chen, J.; Zhang, J.; Li, X.; Chen, S.; He, F.; Xu, J.; Su, L.; et al. miR-182-5p affects human bladder cancer cell proliferation, migration and invasion through regulating Cofilin 1. Cancer Cell Int. 2019, 19, 42. [Google Scholar] [CrossRef] [PubMed] [Green Version]
- Casadei, L.; Vallorani, L.; Gioacchini, A.M.; Guescini, M.; Burattini, S.; D’Emilio, A.; Biagiotti, L.; Falcieri, E.; Stocchi, V. Proteomics-based investigation in C2C12 myoblast differentiation. Eur. J. Histochem. 2009, 53, e31. [Google Scholar] [CrossRef] [PubMed] [Green Version]
- Hitomi, K.; Murase, M.; Kawamura, T.; Maki, M.J.C. Constant expression of mouse calpastatin isoforms during differentiation in myoblast cell line, C2C12. Cytotechnology 2000, 33, 63. [Google Scholar] [CrossRef]
- Tian, X.; Lin, X.J.C.; Biology, I. Matricellular protein Cfl1 regulates cell differentiation. Commun. Integr. Biol. 2013, 6, e26444. [Google Scholar] [CrossRef]
- Hirayama, A.; Adachi, R.; Otani, S.; Kasahara, T.; Suzuki, K. Cofilin plays a critical role in IL-8-dependent chemotaxis of neutrophilic HL-60 cells through changes in phosphorylation. J. Leukoc. Biol. 2007, 81, 720–728. [Google Scholar] [CrossRef]


Publisher’s Note: MDPI stays neutral with regard to jurisdictional claims in published maps and institutional affiliations. |
© 2022 by the authors. Licensee MDPI, Basel, Switzerland. This article is an open access article distributed under the terms and conditions of the Creative Commons Attribution (CC BY) license (https://creativecommons.org/licenses/by/4.0/).