Next Article in Journal
Differences in Ovarian and Other Cancers Risks by Population and BRCA Mutation Location
Previous Article in Journal
A Reassessment of Copy Number Variations in Congenital Heart Defects: Picturing the Whole Genome
Previous Article in Special Issue
Genetic Variant c.245A>G (p.Asn82Ser) in GIPC3 Gene Is a Frequent Cause of Hereditary Nonsyndromic Sensorineural Hearing Loss in Chuvash Population
 
 
genes-logo
Article Menu
Article

Transcriptome-Wide Association Study of Blood Cell Traits in African Ancestry and Hispanic/Latino Populations

by Jia Wen 1,†, Munan Xie 1,†, Bryce Rowland 2, Jonathan D. Rosen 2, Quan Sun 2, Jiawen Chen 2, Amanda L. Tapia 2, Huijun Qian 3, Madeline H. Kowalski 2, Yue Shan 2, Kristin L. Young 4, Marielisa Graff 4, Maria Argos 5, Christy L. Avery 4, Stephanie A. Bien 6, Steve Buyske 7, Jie Yin 8, Hélène Choquet 8, Myriam Fornage 9, Chani J. Hodonsky 10, Eric Jorgenson 11, Charles Kooperberg 6, Ruth J. F. Loos 12, Yongmei Liu 13, Jee-Young Moon 14, Kari E. North 4, Stephen S. Rich 10, Jerome I. Rotter 15, Jennifer A. Smith 16, Wei Zhao 16, Lulu Shang 17, Tao Wang 14, Xiang Zhou 17, Alexander P. Reiner 18, Laura M. Raffield 1 and Yun Li 1,2,*add Show full author list remove Hide full author list
1
Department of Genetics, University of North Carolina at Chapel Hill, Chapel Hill, NC 27514, USA
2
Department of Biostatistics, University of North Carolina at Chapel Hill, Chapel Hill, NC 27599, USA
3
Department of Statistics and Operations Research, University of North Carolina at Chapel Hill, Chapel Hill, NC 27599, USA
4
Department of Epidemiology, University of North Carolina at Chapel Hill, Chapel Hill, NC 27516, USA
5
Division of Epidemiology and Biostatistics, University of Illinois at Chicago, Chicago, IL 60612, USA
6
Division of Public Health Sciences, Fred Hutchinson Cancer Research Center, Seattle, WA 98109, USA
7
Department of Statistics, Rutgers University, Piscataway, NJ 08854, USA
8
Division of Research, Kaiser Permanente Northern California, Oakland, CA 94612, USA
9
Institute of Molecular Medicine, McGovern Medical School, The University of Texas Health Science Center, Houston, TX 77030, USA
10
Center for Public Health Genomics, University of Virginia, Charlottesville, VA 22908, USA
11
Regeneron Genetics Center, Tarrytown, NY 10591, USA
12
The Charles Bronfman Institute for Personalized Medicine, Icahn School of Medicine at Mount Sinai, New York, NY 10029, USA
13
Molecular Physiology Institute, Duke University, Durham, NC 27701, USA
14
Department of Epidemiology & Population Health, Albert Einstein College of Medicine, Bronx, NY 10461, USA
15
The Institute for Translational Genomics and Population Sciences, Department of Pediatrics, The Lundquist Institute for Biomedical Innovation at Harbor-UCLA Medical Center, Torrance, CA 90502, USA
16
Department of Epidemiology, School of Public Health, University of Michigan, Ann Arbor, MI 48109, USA
17
Department of Biostatistics, School of Public Health, University of Michigan, Ann Arbor, MI 48109, USA
18
Department of Epidemiology, University of Washington, Seattle, WA 98195, USA
*
Author to whom correspondence should be addressed.
These authors contributed equally.
Genes 2021, 12(7), 1049; https://doi.org/10.3390/genes12071049
Submission received: 21 May 2021 / Revised: 29 June 2021 / Accepted: 2 July 2021 / Published: 8 July 2021
(This article belongs to the Special Issue Genomics of Disease Risk in Diverse Populations)

Abstract

:
Background: Thousands of genetic variants have been associated with hematological traits, though target genes remain unknown at most loci. Moreover, limited analyses have been conducted in African ancestry and Hispanic/Latino populations; hematological trait associated variants more common in these populations have likely been missed. Methods: To derive gene expression prediction models, we used ancestry-stratified datasets from the Multi-Ethnic Study of Atherosclerosis (MESA, including n = 229 African American and n = 381 Hispanic/Latino participants, monocytes) and the Depression Genes and Networks study (DGN, n = 922 European ancestry participants, whole blood). We then performed a transcriptome-wide association study (TWAS) for platelet count, hemoglobin, hematocrit, and white blood cell count in African (n = 27,955) and Hispanic/Latino (n = 28,324) ancestry participants. Results: Our results revealed 24 suggestive signals (p < 1 × 10⁻⁴) that were conditionally distinct from known GWAS identified variants and successfully replicated these signals in European ancestry subjects from UK Biobank. We found modestly improved correlation of predicted and measured gene expression in an independent African American cohort (the Genetic Epidemiology Network of Arteriopathy (GENOA) study (n = 802), lymphoblastoid cell lines) using the larger DGN reference panel; however, some genes were well predicted using MESA but not DGN. Conclusions: These analyses demonstrate the importance of performing TWAS and other genetic analyses across diverse populations and of balancing sample size and ancestry background matching when selecting a TWAS reference panel.

Graphical Abstract

1. Introduction

Hematological measures (red blood cell, white blood cell, and platelet traits) play critical roles in oxygen transport, immunity, infection, thrombosis, and hemostasis and are associated with many chronic diseases, including autoimmunity, asthma, cardiovascular disease, and viral infections. Hematological traits vary between self-reported race/ethnicity groups [1,2,3], in part due to variants which vary in frequency by genetic ancestry group [4,5]. For example, selective pressure from malaria has led to an increased prevalence of sickle cell anemia, G6PD deficiency, and alpha thalassemia in exposed populations [6,7], with impacts on hematological indices [8] in individuals with genetic ancestry from malaria endemic regions. Unfortunately, most existing genome-wide association studies (GWAS) have focused on European ancestry (EA) populations [9,10,11]. It is essential to also explore hematological trait genetics in underrepresented admixed African (AA) and Hispanic/Latino (HL) populations. Realizing that existing genetic studies are failing on diversity [12], multiple consortia have been formed to better represent non-European or multi-ethnic populations. These efforts include the Human Heredity and Health in Africa (H3Africa) consortium [13], and the NIH All of Us program. We anticipate such initiatives improve genomics studies in diverse populations.
Along with the lack of diversity in included populations, GWAS of hematological traits, similar to other complex phenotypes, also identify regions of associated variants whose biological function and target genes are often not clear. One approach to linking variants to genes (and thus to biological function) that has demonstrated success in various complex traits is transcriptome-wide association studies (TWAS) [14,15]. TWAS methods leverage reference expression quantitative trait loci (eQTL) datasets to select genetic variants which in aggregate associate with to predict tissue-specific gene expression. Weights based on variant associations with a transcript are applied to cohorts with genotype (but not expression) data available [15,16]. Transcripts whose levels can be confidently imputed from genetic variants are then assessed for phenotype associations [17]. However, like GWAS, TWAS analyses have often included only EA populations [18,19], though some recent efforts have included more diverse populations [20,21,22,23,24]. Furthermore, most reference eQTL datasets used for TWAS include predominantly EA American individuals [25,26], limiting the predictive power of this novel method in other populations with different allele frequencies.
We examine here the utility of TWAS methods to understand previously identified GWAS loci for blood cell traits, as well as to identify new candidate loci and genes. We focus on underrepresented AA and HL populations and evaluate whether use of relevant ancestry-specific eQTL reference panels from the Multi-Ethnic Study of Atherosclerosis (MESA) improves power for blood cell trait genetic discovery (above primarily European TWAS reference panels).

2. Materials and Methods

We used three different eQTL datasets, namely Depression Genes and Networks (DGN), MESA AA, and MESA HL, to train gene expression models and then performed association analysis for AA and HL populations and then replicated the results in larger UKB (UK Biobank) EA populations. The study overview is showed in Figure 1 with a more verbose version in Supplementary Figure S1.

2.1. Training of TWAS Prediction Models

Genotype Data. Using genotype data from 6 African ancestry cohorts (ARIC, BioMe, CARDIA, GERA, UK Biobank, and WHI) and 4 Hispanic/Latino cohorts (BioMe, GERA, WHI, HCHS/SOL) (Figure 1, Supplementary Table S1, Supplementary Content), we performed genotype imputation to the TOPMed freeze 5b reference panel (September 2017 release, methods described at https://www.nhlbiwgs.org/topmed-whole-genome-sequencing-project-freeze-5b-phases-1-and-2, accessed December 2019 and January 2020) on the Michigan Imputation Server [27]. After genotype imputation, we selected variants for TWAS model training if they were well-imputed in all GWAS cohorts and in reference expression quantitative trait loci (eQTL) datasets (MAF > 0.05, R2 > 0.3). The only exception was for the MESA eQTL reference panel, where direct sequencing data from TOPMed freeze 8 was available for those with monocyte expression microarray data. In brief, the sequencing for MESA was performed with mean genome coverage ≥ 30x and completed at seven sequencing centers; sequencing data files were transferred from sequencing centers to the TOPMed Informatics Research Center (IRC), where reads were aligned to human genome build GRCh38 using a common pipeline across all centers, followed by joint genotype calling. Additional sample-level quality control (such as detection of sex mismatches, pedigree discrepancies, sample swaps, etc.) was undertaken by the Sequencing Centers, the IRC, and the TOPMed Data Coordinating Center (DCC). Detailed methods for freeze 8 are available at https://www.nhlbiwgs.org/topmed-whole-genome-sequencing-methods-freeze-8 (accessed January 2020). For MESA, we included all variants with MAF > 0.05 for TWAS model training. After quality control exclusions, there were 4,694,075 variants in DGN, 4,948,702 variants in MESA AA ancestry, and 4,265,631 in MESA HL ancestry for TWAS modelling. We ran RFMix [28] to infer the global ancestry for all samples across all cohorts. Results are summarized in Supplementary Figure S2 to show the distribution and spectrum of ancestry proportions across cohorts (Supplementary Content).
Gene Expression Data. DGN RNA-seq (whole blood) data were obtained from [26]. RNA-seq was already normalized using the Hidden Covariates with Prior (HCP) method [29], correcting for technical and biological factors [19]. A total of 15,231 genes were used for training models in the DGN reference panel. The MESA monocyte gene expression data were obtained from the Illumina HumanHT-12 V4.0 expression beadchip (GSE56045) [30,31,32]. Illumina IDs were converted to Ensembl IDs. For Illumina IDs with multiple Ensembl IDs, each Illumina ID was labeled and treated as an individual gene, leading to multiple TWAS weights being used for 11,056 probe sets (including 8623 genes). More genes were available for TWAS prediction in DGN versus MESA, likely due to a use of RNA-seq instead of expression microarray, larger sample size, and inclusion of additional cell types in whole blood versus monocytes alone (for example, lymphocyte-specific transcripts). To adjust for confounders and then normalize the MESA expression data, we fit a multivariate linear model for gene expression values in MESA controlling for the following covariates: sex, age, age squared, 10 genotype principal components calculated by PC-AiR method from TOPMed freeze 8 WGS data, and 10 PEER factors from microarray gene expression profiling calculated using the “peer” package in R (v 1.0) [33]. Adjusted gene expression values were computed by inverse-quantile normalizing the residuals of the above multivariate linear model.
Model Training We used the DGN EA, MESA AA, and MESA HL eQTL datasets to train gene expression prediction models using elastic net. For each gene, variants located within +/− 1Mb of genes start and end were used in model training. Elastic-net methods have been previously shown to be effective even when there is collinearity due to variants in high linkage disequilibrium (LD), so no LD pruning of variants was conducted prior to elastic net model fitting, except for removal of perfectly correlated variants. Hyperparameters were trained via 10-fold cross validation, similar to the PrediXcan approach [15]. Genes with model R2 ≥ 0.05 for elastic net prediction models were carried forward for TWAS analyses. After model training, we separately applied DGN, MESA AA, and MESA HL training models to predict gene expression values in each GWAS cohort.
These model training methods are essentially the same as the well-established PrediXcan method (elastic net), for which precomputed weights are already available for DGN and MESA at http://predictdb.org/ (accessed January 2020), but we retrained models using TOPMed freeze 5b imputed data and TOPMed freeze 8 WGS data (in MESA) due to substantial gains in imputation quality in AA and Hispanic/Latino populations versus commonly used reference panels like 1000 Genomes [34].

2.2. Assessment of Trained Expression Prediction Models in GENOA

To assess the performance of the gene expression prediction models trained from the eQTL reference datasets in an independent AA cohort, we applied the gene expression prediction models to n = 802 participants from the Genetic Epidemiology Network of Arteriopathy (GENOA) study [35]. GENOA gene expression was measured in lymphoblastoid cell lines (LCLs) using the Affymetrix Human Transcriptome Array 2.0. We used correlation between real and predicted gene expression transcript values (true R2) to compare the performance of the MESA AA and DGN TWAS reference datasets.
Based on initial findings that, overall, DGN gene expression prediction was better than the prediction results from the smaller, ancestry-matched MESA cohort, we randomly subsampled DGN to the same size as MESA to evaluate the impact of sample size on the training models. In order to account for variability in prediction accuracy, we randomly performed five subsamplings of the DGN cohort to the MESA cohort sample size. We then retrained TWAS models with elastic net within this smaller subsampled DGN cohort, using the same TWAS training methods described above, and then compared the average of true R2 from the multiple subsampled-DGN training models with true R2 from MESA AA (to evaluate if ancestry matching would improve TWAS performance in the same sample size).

2.3. Phenotype

We analyzed four blood cell traits from each major hematological domain (hemoglobin—HGB, hematocrit—HCT, white blood cell count—WBC, platelet counts—PLT). These traits had the largest sample size across included cohorts. Prior to association analyses, we excluded extreme outlier values, notably WBC values > 200 × 109/L, HCT > 60%, and HGB > 20 g/dL. For longitudinal cohort studies, all values are from the same exam cycle, with the exam which maximized available sample size chosen (usually baseline). WBC was log transformed due to the skewed distribution. All four traits were adjusted for age, age squared, sex, and top 10 principal components/study specific covariates. The residuals were then inverse normalized.

2.4. TWAS Association and Conditional Analysis

We assessed association between predicted gene expression and the inverse normalized HCT, HGB, WBC, and PLT residuals using the cGWAS.emmax function of R package cpgen v0.1, adjusting for an EPACTS kinship matrix. Since linear mixed model allows relatedness among samples by incorporating the kinship matrix, we didn’t prune study samples based on genetic relatedness. Additionally, WBC analyses included adjustment for the Duffy (rs2814778) variant, which strongly impacts neutrophil counts and overall WBC, with the null allele much more common in African ancestry populations [4]. Following association testing within each cohort, we performed meta-analysis within ancestry groups using METAL [36] We further investigated genes with a nominal meta-analysis p-value < 1 × 10⁻⁴ through a conditional association test on all known variants within +/− 1 Mb flanking regions. Strict Bonferroni significance thresholds (0.05/# tested genes) are listed in Supplementary Table S7. We performed conditional analysis by conditioning on these known signals within +/− 1 Mb of each significant gene in two steps (Supplementary Table S5). We additionally aggregated four sets (i.e., DGN AA, DGN HL, MESA AA, MESA HL) of p-values using the Cauchy combination test implemented by ACAT [37]. We would like to note that most meta-analysis approaches including ACAT may be sub-optimal for detecting ancestry specific associations. For example, the TNFAIP2-platelets association highlighted was only discovered by MESA HL (because this gene was not available in the other three sets: poorly predicted by DGN and not even present in MESA AA), and therefore, not surprisingly, was not Bonferroni significant after ACAT aggregation. We initially conducted conditional analysis using known variants from the GWAS catalog as of June 2018 (Step 1). If the TWAS signal remained significant after Step 1 conditional analysis, or if the TWAS signal had no GWAS catalog GWAS variants within +/− 1 Mb region, we further conditioned on significant (p < 5 × 10⁻⁸) variants from recent blood cell traits GWAS [11,38] (Step 2). We then keep the larger (i.e., less significant) conditional p-value as the final results. Note that we used a lenient threshold of 0.05 to declare conditional significance. In addition, we define a locus from our TWAS results as the +/− 1 Mb region of most significant sentinel gene’s start and end positions. For loci with more than one marginally significant gene identified, we further perform fine-mapping using FINEMAP [39].

2.5. Replication

Our replication procedure was split into two tiers of testing to assess the effect of ancestry-matched gene expression prediction models in TWAS replication. First, we attempted replication using gene expression prediction models trained in DGN, but further restricted to variants that are common and well-imputed (MAF > 0.05, R2 > 0.8) in both DGN and UKB Europeans (DGN-for-UKB). We retrained gene expression prediction model using DGN-for-UKB with the same elastic net procedure described above.
For genes with models trained in DGN using variants available in all cohorts in the AA or HL TWAS meta-analysis dataset, DGN-for-UKB trained models served as the only model for predicted gene expression considered in initial replication analyses. For MESA AA or MESA HL trained models, if either the gene-trait association was not significant at the Bonferroni adjusted threshold (p < 8 × 10⁻⁴) or the prediction quality of the gene expression prediction model was poor (model R2 < 0.01), we used the MESA trained model to impute gene expression values into UKB Europeans, in a second tier of replication analyses.
Sixty-one gene-trait pairs that demonstrated evidence of conditionally significant association in AA or HL TWAS meta-analyses were included in the UK Biobank replication analysis. We used a Bonferroni-corrected threshold for the number of tests (0.05/61 = 8 × 10⁻⁴) to identify replicated signals. Phenotypes were adjusted for covariates and inverse normalized, as described above for AA and HL cohorts (additional details in Supplemental Content, Included Cohorts). REGENIE [40] was used to test the association between predicted gene expression and adjusted phenotypes.

3. Results

3.1. Train Gene Expression Prediction Models from Reference eQTL Datasets

In this study, we leveraged data from two studies as reference eQTL datasets: EA individuals from the Depression Genes and Networks (DGN) cohort (n = 922 with whole blood RNA-sequencing data [26]), and AA (n = 229) and HL (n = 381) individuals from the MESA study [30,31]. We attempted to train gene expression prediction models using elastic net for 11,687 genes, 5958 genes with 7120 probe sets, and 6082 genes with 7316 probe sets in DGN EA, MESA AA, and MESA HL eQTL reference panels, respectively. Following previous studies [15,16], we retained prediction models with model R2 > 0.05 for 9861 genes, 5883 genes with 7026 probe sets, and 5522 genes with 6559 probe sets, respectively. From the training results, based on model R2 > 0.05, 3331 genes were well-predicted with all reference panels, but 4859 were well-predicted only with DGN (and 664 and 410 only in MESA AA and HL, respectively, Figure 2). If we restrict to the 3931 genes present in both the DGN and both MESA reference panels, 3927 genes are well-predicted (model R2 > 0.05) by at least one of the three reference panels; 7 genes are well predicted only with DGN; 50 only with MESA AA; and 5 only with MESA HL (Supplementary Figure S1). Comparing the distribution of model R2 across all genes and common genes, the MESA AA reference panel performed slightly better than DGN, while DGN performed slightly better than MESA HL (Figure 3, Supplementary Table S2). The large number of genes (4859) only well-predicted with DGN is likely due to the larger sample size and higher number of expressed genes for this reference panel, as well as the greater number of included cell types in whole blood. Genes not highly expressed in monocytes are unlikely to be well predicted with the MESA reference panel. Differences in model R2 across reference panels can be quite striking; for example, LTBP3 is well predicted in DGN (model R2 = 0.47), but not well predicted with MESA HL (model R2 = 0.03), and less than 2 non-zero weights contribute to the LTBP3 prediction model with MESA AA. The Human Protein Atlas, a database that provides gene expression in different blood cell types, shows that LTBP3 has higher gene expression in lymphocytes such as the memory B-cells and naive B-cells but very low gene expression in myeloid-lineage white blood cell types such as monocytes, eosinophils, and neutrophils [41], which may explain this poor prediction using MESA monocyte expression data as a reference panel. However, for a subset of genes, the MESA ancestry-specific reference panels had better performance, such as TNFAIP2 with model R2 = 0.10 in MESA HL but only R2 = 0.02 in DGN. For TNFAIP2, variants in the prediction models for MESA HLs were more common in HL than EA populations (14/16, 87.5%) using 1000 Genome phase 3 data as a minor allele frequency (MAF) reference.

3.2. Assessment of Trained Expression Prediction Models in Independent Non-European Datasets

To assess the performance of gene expression prediction models trained from the eQTL reference datasets among minority participants, we applied TWAS prediction models to AA participants (n = 802) from the Genetic Epidemiology Network of Arteriopathy (GENOA) study [35]. We compared the performance of prediction models trained from MESA AA and DGN reference eQTL datasets in terms of the correlation between predicted and true (true R2) (Figure 4a,b, Supplementary Table S3). When comparing genes found in both DGN and MESA reference panels, we found that DGN performs better than MESA AA in prediction of GENOA expression, based on true R2 (Figure 4a). Restricting to well-predicted genes in both DGN and MESA AA (model R2 > 0.05 in both reference panels), DGN outperforms MESA AA as well (Supplementary Table S3, Figure 4b). We then selected four well-predicted genes as examples, two from MESA-AA predicted models and two from DNA predicted models, all illustrated in Figure 4c–f. Figure 4c–f are scatter plots showing the observed expressions in GENOA and predicted expressions using MESA AA (Figure 4c,d) and DGN (Figure 4e,f) as reference, respectively. Among them, 279 genes had true R2 > 0.05 in GENOA with both reference panels, 584 only with DGN, and 247 only with MESA AA (Figure 4g) and comparison results at different true R2 threshold values were showed in Supplementary Figure S3. As expected, the proportion of shared well-predicted genes between DGN and MESA AA increases with true R2 threshold values (Figure 4g, Supplementary Figure S3e). We suspected that DGN might be performing slightly better than the ancestry-matched MESA AA reference due to the larger sample size. We therefore sub-sampled DGN to be the same size as the MESA AA panel and predicted into the external GENOA dataset, to directly compare the impact of sample size on the training model. The true R2, which decreased with the reduced sample size for the sub-sampled DGN panel, was still slightly better, on average, than models trained from MESA AA (Supplementary Table S3) when restricting to common predicted genes between DGN and MESA AA. The decreased true R2 of sub-sampled DGN models compared to the original full DGN-sample models does, however, directly demonstrate the effect of sample size on the prediction performance (Supplementary Table S3). In addition, we still found GENOA genes which are well-predicted by MESA but very poorly predicted by DGN, such as POLR2J, which is highly expressed in most blood cells (including monocytes and lymphocytes) [41]. For POLR2J, true R2 in GENOA is 0.42 using the MESA TWAS reference panel versus R2 = 0.007 using DGN as a TWAS reference panel. Comparing the variants included in prediction models from both reference panels, 39 of 57 variants (~68%) used in MESA AA derived prediction model are more common in AA than EA populations, which may lead to better prediction, while only 4 of 27 (~15%) included variants are more common in AA versus EA populations for the DGN prediction model. Allele frequency differences across populations likely leads to the lower true R2 using DGN as a reference panel.

3.3. Association between Predicted Gene Expression and Blood independent Traits

We applied TWAS weights from both DGN and MESA to independent cohorts of AA ancestry (n = 27,955) and HL (n = 28,324) participants and performed TWAS for four blood cell traits: HGB, HCT, WBC, and PLT. We selected these four traits to both encompass all three major hematological domains (red and white blood cells, and platelets) and retain maximal sample size in each constituent cohort (due to extensive missing data for most other traits). Results were then meta-analyzed for each trait within each ancestry group (AA or HL).
For the 27,955 AA participants from 6 AA cohorts (Supplementary Content and Supplementary Table S1), we conducted TWAS with the four hematological traits using pre-trained models on 9861 and 5883 genes with 7026 probe sets from the DGN and MESA AA eQTL reference dataset, respectively. For the 28,324 HL participants from 4 HL cohorts (cohort details in Supplementary Content and Supplementary Table S1), we performed TWAS with the four blood cell traits for 9861 and 5522 genes with 6559 probe sets trained in DGN and MESA HL eQTL reference datasets, respectively.
Meta-analyses revealed 42 and 27 marginally significant gene-trait pairs in AA and HL, respectively, when DGN expression prediction models were used. When prediction models from MESA AA and HL samples were employed, 22 and 18 marginally significant gene-trait pairs were identified for AA and HL, respectively (Table 1, Figure 5, Supplementary Figures S1 and S4). Effect sizes of the 65 associations in AA range from -0.312 to 0.381 with the absolute mean of 0.112 across the four blood cell traits for AA. Effect sizes of the 45 associations in HL range from −0.356 to 0.302 with the absolute mean of 0.130 across the four blood cell traits for HL. The largest effect size we observed is from ABCA13 for WBC, with a value of 0.381, meaning that for every unit change in the expression of ABCA13, WBC increases by 0.381 (Supplementary Table S4). Note that the effect sizes are comparable across genes because we inversed-normalized the gene expression values (detailed in Methods 2.1). In total, we identified 80 unique genes and 90 unique gene-trait pairs across AA and HL. Of 90 unique marginally significant gene-trait pairs, we found 13 gene-trait pairs by both DGN and MESA (AA and HL) prediction models, 51 gene-trait pairs by DGN models only, and 26 gene-trait pairs using MESA AA and/or HL prediction models only. We note that there were 23 unique genes associated with blood cell traits only when using non-EA reference panels, despite the much smaller sample sizes compared to DGN EA reference (detailed in Supplementary Table S4, Supplementary Figure S4).
We therefore calculated cross-validation R2 for the 80 marginally significant genes (i.e., genes that showed suggestive association (p < 1 × 10 4 ) with at least one blood cell trait). Overall, cross-validation R2 are smaller than model R2, but overall, reasonably consistent (Pearson correlation between model R2 and cross-validation R2 is 0.91 with p-value < 2.2 × 10⁻¹⁶) (Supplementary Table S4 and Supplementary Figure S5). Importantly, all genes we highlight were reasonably well-predicted based with cross-validation R2 > 1%.

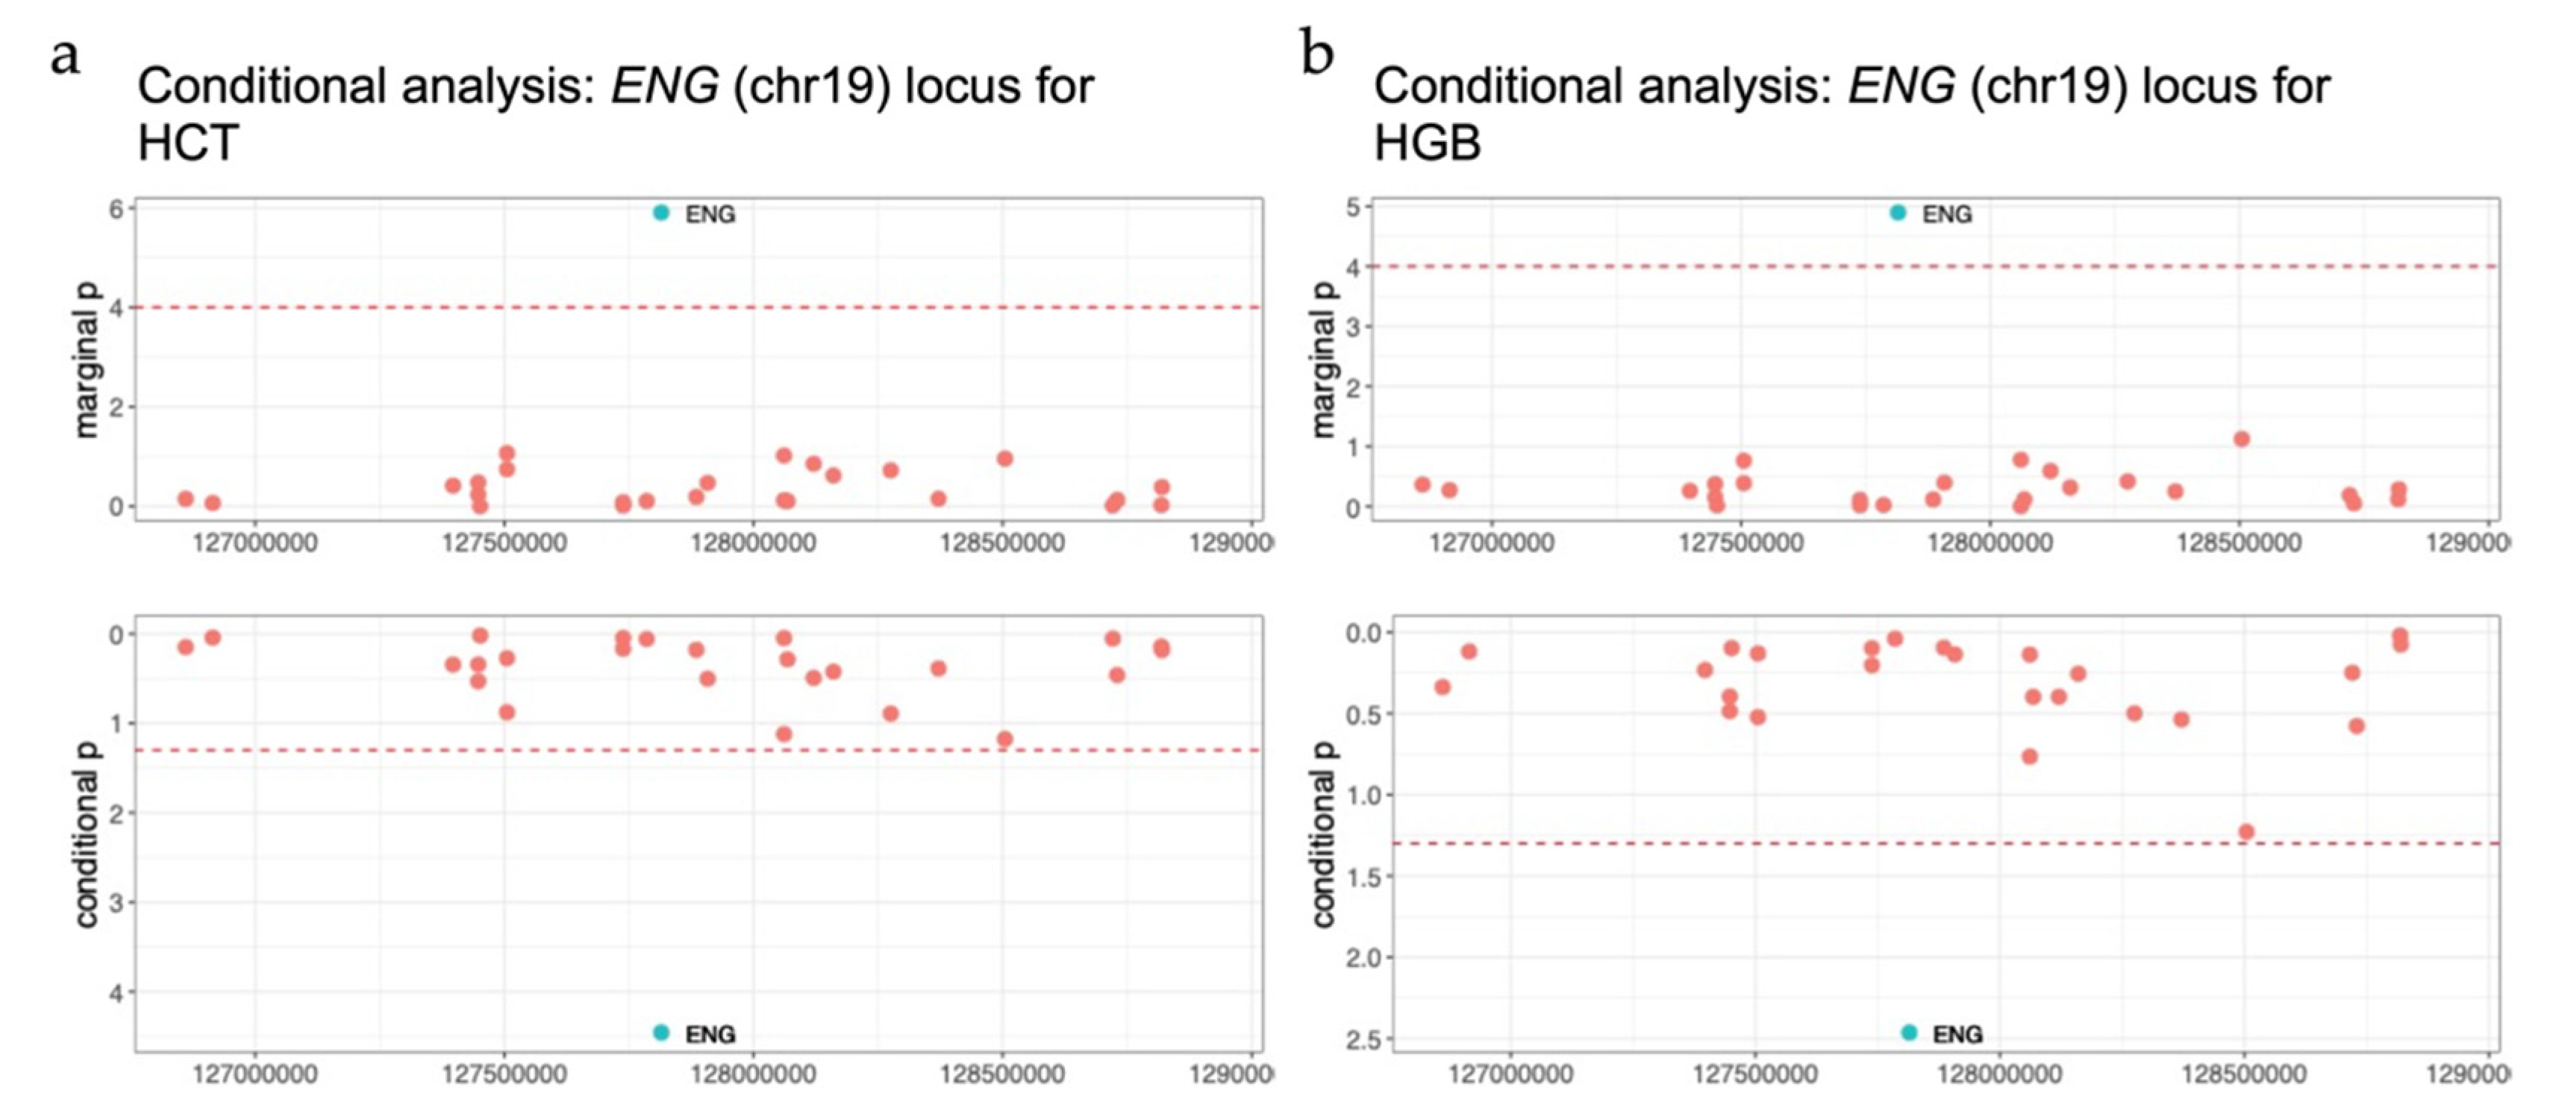
3.4. TWAS Analysis Conditional on Neighboring GWAS Variants

For the 90 marginally significant gene-trait pairs, 67 genes (involved in 74 unique gene-trait associations, ~82.2%) have known GWAS-identified variant associations for the same hematological trait within +/− 1 Mb. We performed conditional analysis to investigate whether the significant TWAS genes remain significant when conditioned on known GWAS variants, which would suggest that additional genetic variants regulating expression of the TWAS identified gene remain to be discovered (see Methods). The conditional analysis shows that 45 (including 42 genes) out of the total 74 (~60.8%) unique associations are still nominally significant when conditioned on known GWAS variants (p < 0.05, Supplementary Table S4). An additional 16 out of 90 unique gene-trait associations have no known GWAS variants within 1 Mb. In the replication analysis using the much larger UKB EA sample, we focused on the 42 conditionally significant genes (45 gene-trait associations) and the 15 genes with no known GWAS variants within +/− 1 Mb (16 gene-trait associations), as these were the genes with evidence of association with hematological traits not captured by existing GWAS, for 61 total gene-trait associations (Supplementary Table S4).

3.5. Replication in UK Biobank

To validate the conditionally significant gene-trait associations we identified in the discovery cohorts, we performed replication analysis in 405,782 EA participants from the UKB. Specifically, we attempted to validate both the conditionally significant gene-trait associations and gene-trait associations without nearby known GWAS variants. We note that African ancestry UKB participants were already included in our discovery TWAS meta-analyses and thus were not available for replication purposes. Using independently trained DGN-for-UKB gene expression prediction models, 21 out of 49 gene-trait association pairs were successfully replicated at significance level of α < 8 × 10 4 (α = 0.05/61). For the 16 genes (involved in 16 associations) which did not have a valid DGN-for-UKB gene expression prediction model, we performed replication analysis in UKB-EA using the same models for gene expression prediction used in MESA AA and MESA HL. Of these genes, 3 out of 16 replicated in the secondary analysis at α < 8 × 10 4 (α = 0.05/61). We note that almost all of these replicated genes are conditionally distinct signals at known loci; of the 16 unique gene-trait pairs with no nearby GWAS identified variants, only APEH’s association with hematocrit in AA populations compellingly replicates in UK Biobank (p = 1.7 × 10⁻⁶). Two findings of interest, both of which replicated in UKB, are described below.

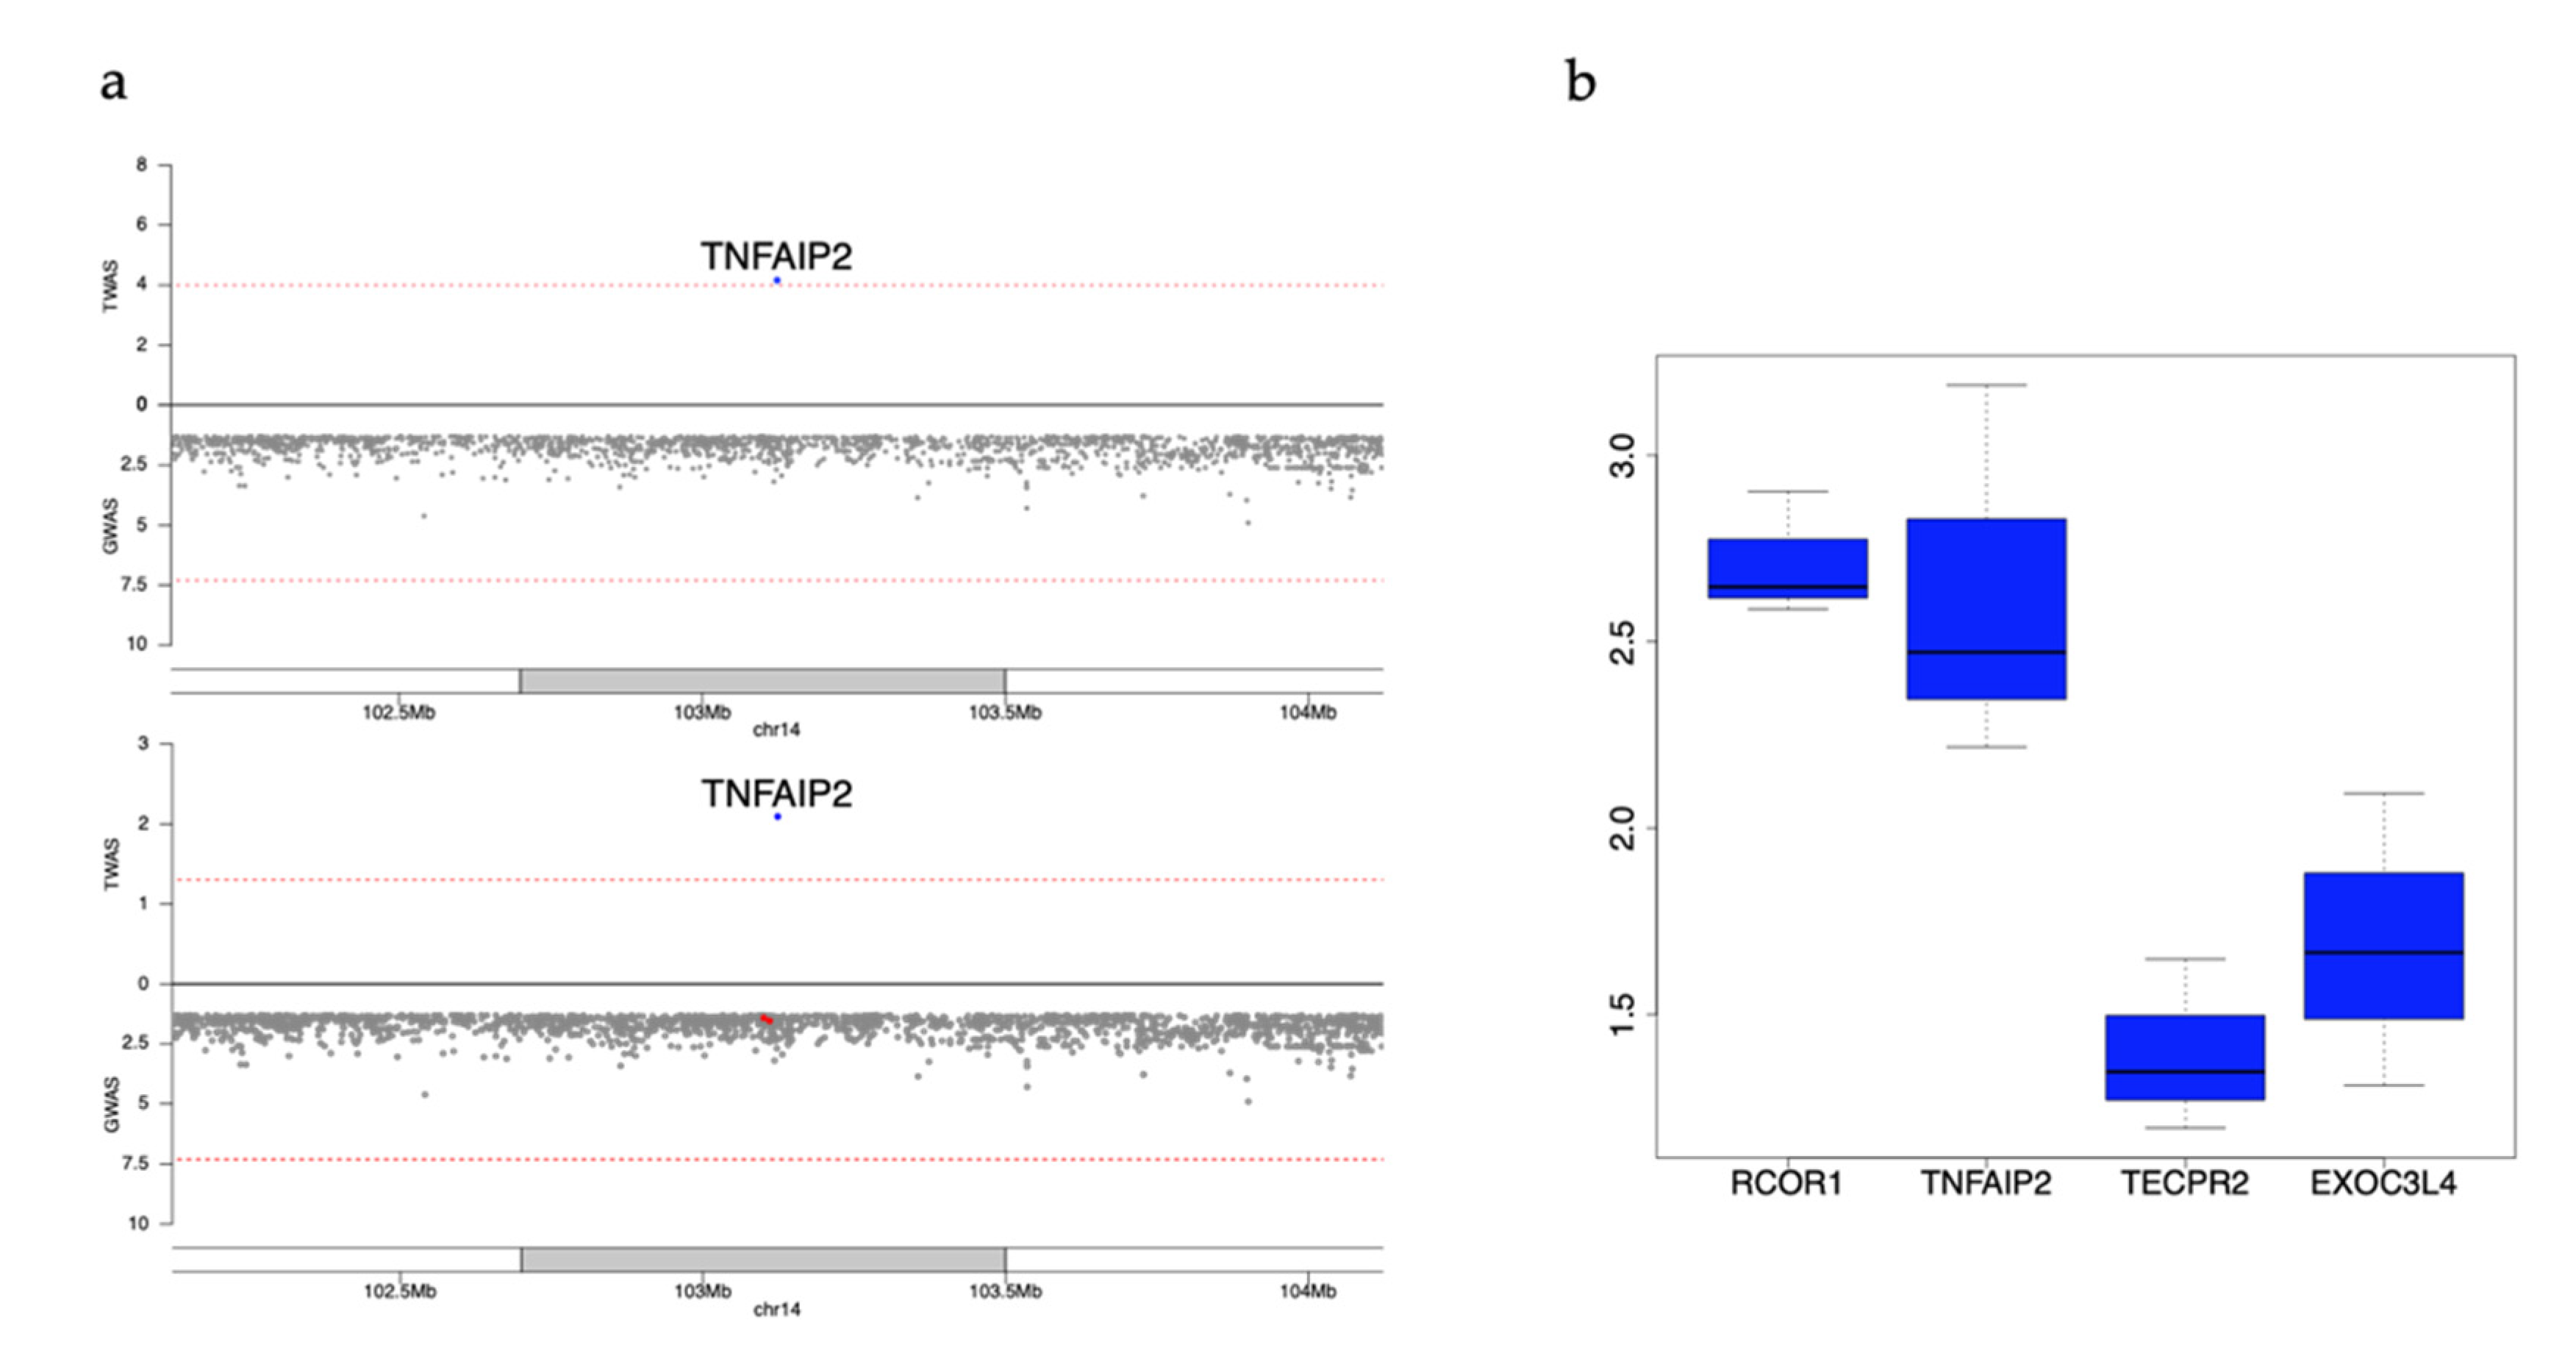
3.6. Example Replicated Genes Still Nominally Significant after Conditioning on Known GWAS Variants

TNFAIP2 (TNF alpha Induced Protein 2) In the analyses conducted in HL populations using MESA as reference, TNFAIP2 remains significant for platelet count when conditioned on known GWAS variants (marginal p = 6.8 × 10⁻⁵; conditional p = 8.1 × 10⁻³). As noted previously, TNFAIP2 is not well-predicted using the DGN reference panel; the prediction model of TNFAIP2 using MESA HL as a reference mostly includes variants more common in HL than EA populations, which may lead to better prediction using this ancestry-matched reference panel. We assessed the variants which contribute to TNFAIP2 prediction in functional annotation data from megakaryocytes, the cells which produce platelets. Five variants (Variants ID of chr:GRCh38-positions:Ref_allele:Alt_allele: 14:103099825:G:A; 14:103112649:T:C; 14:103118337:A:G; 14:103378293:G:A, and 14:103535180:G:A) used in the MESA HL TWAS prediction model for TNFAIP2 are annotated as being in open chromatin by megakaryocyte ATAC-seq [42]. Megakaryocyte gene expression from the BLUEPRINT consortium [43] shows that TNFAIP2 has higher expression in this cell type than other nearby GWAS annotated genes (EXOC3L4 and TECPR2) and has comparable expression with RCOR1 (Figure 6). Moreover, this gene replicates in the UKB EA cohort using variant weights derived from the MESA HL reference panel (marginal p = 2.9 × 10⁻³⁰).
ENG (Endoglin). ENG is a known hemoglobin (HGB)/hematocrit (HCT) associated gene reported in EA populations in previous GWAS [11,38,44]. We identified this gene in our TWAS meta-analyses using weights from the MESA AA panel (marginal p = 1.27 × 10⁻⁵ for HGB, p = 1.24 × 10⁻⁶, which passes the Bonferroni threshold value for HCT), but not the DGN panel (marginal p = 5 × 10⁻³ for HGB and p = 3 × 10⁻⁴ for HCT) (Figure 7). When conditioned on known GWAS variants for HGB/HCT, ENG is still nominally significant with conditional p = 3.44 × 10⁻³ for HGB and p = 2.6 × 10⁻³ for HCT. We further investigated the MAF distribution of variants used in the prediction models of the two training panels and found 18/22 (~81.8%) variants used in the MESA-derived prediction model are more common in AA versus EA individuals in 1000 G, with similar enrichment not observed for the DGN EA reference panel weights (27/53 variants (~50.9%) more common in AA populations).

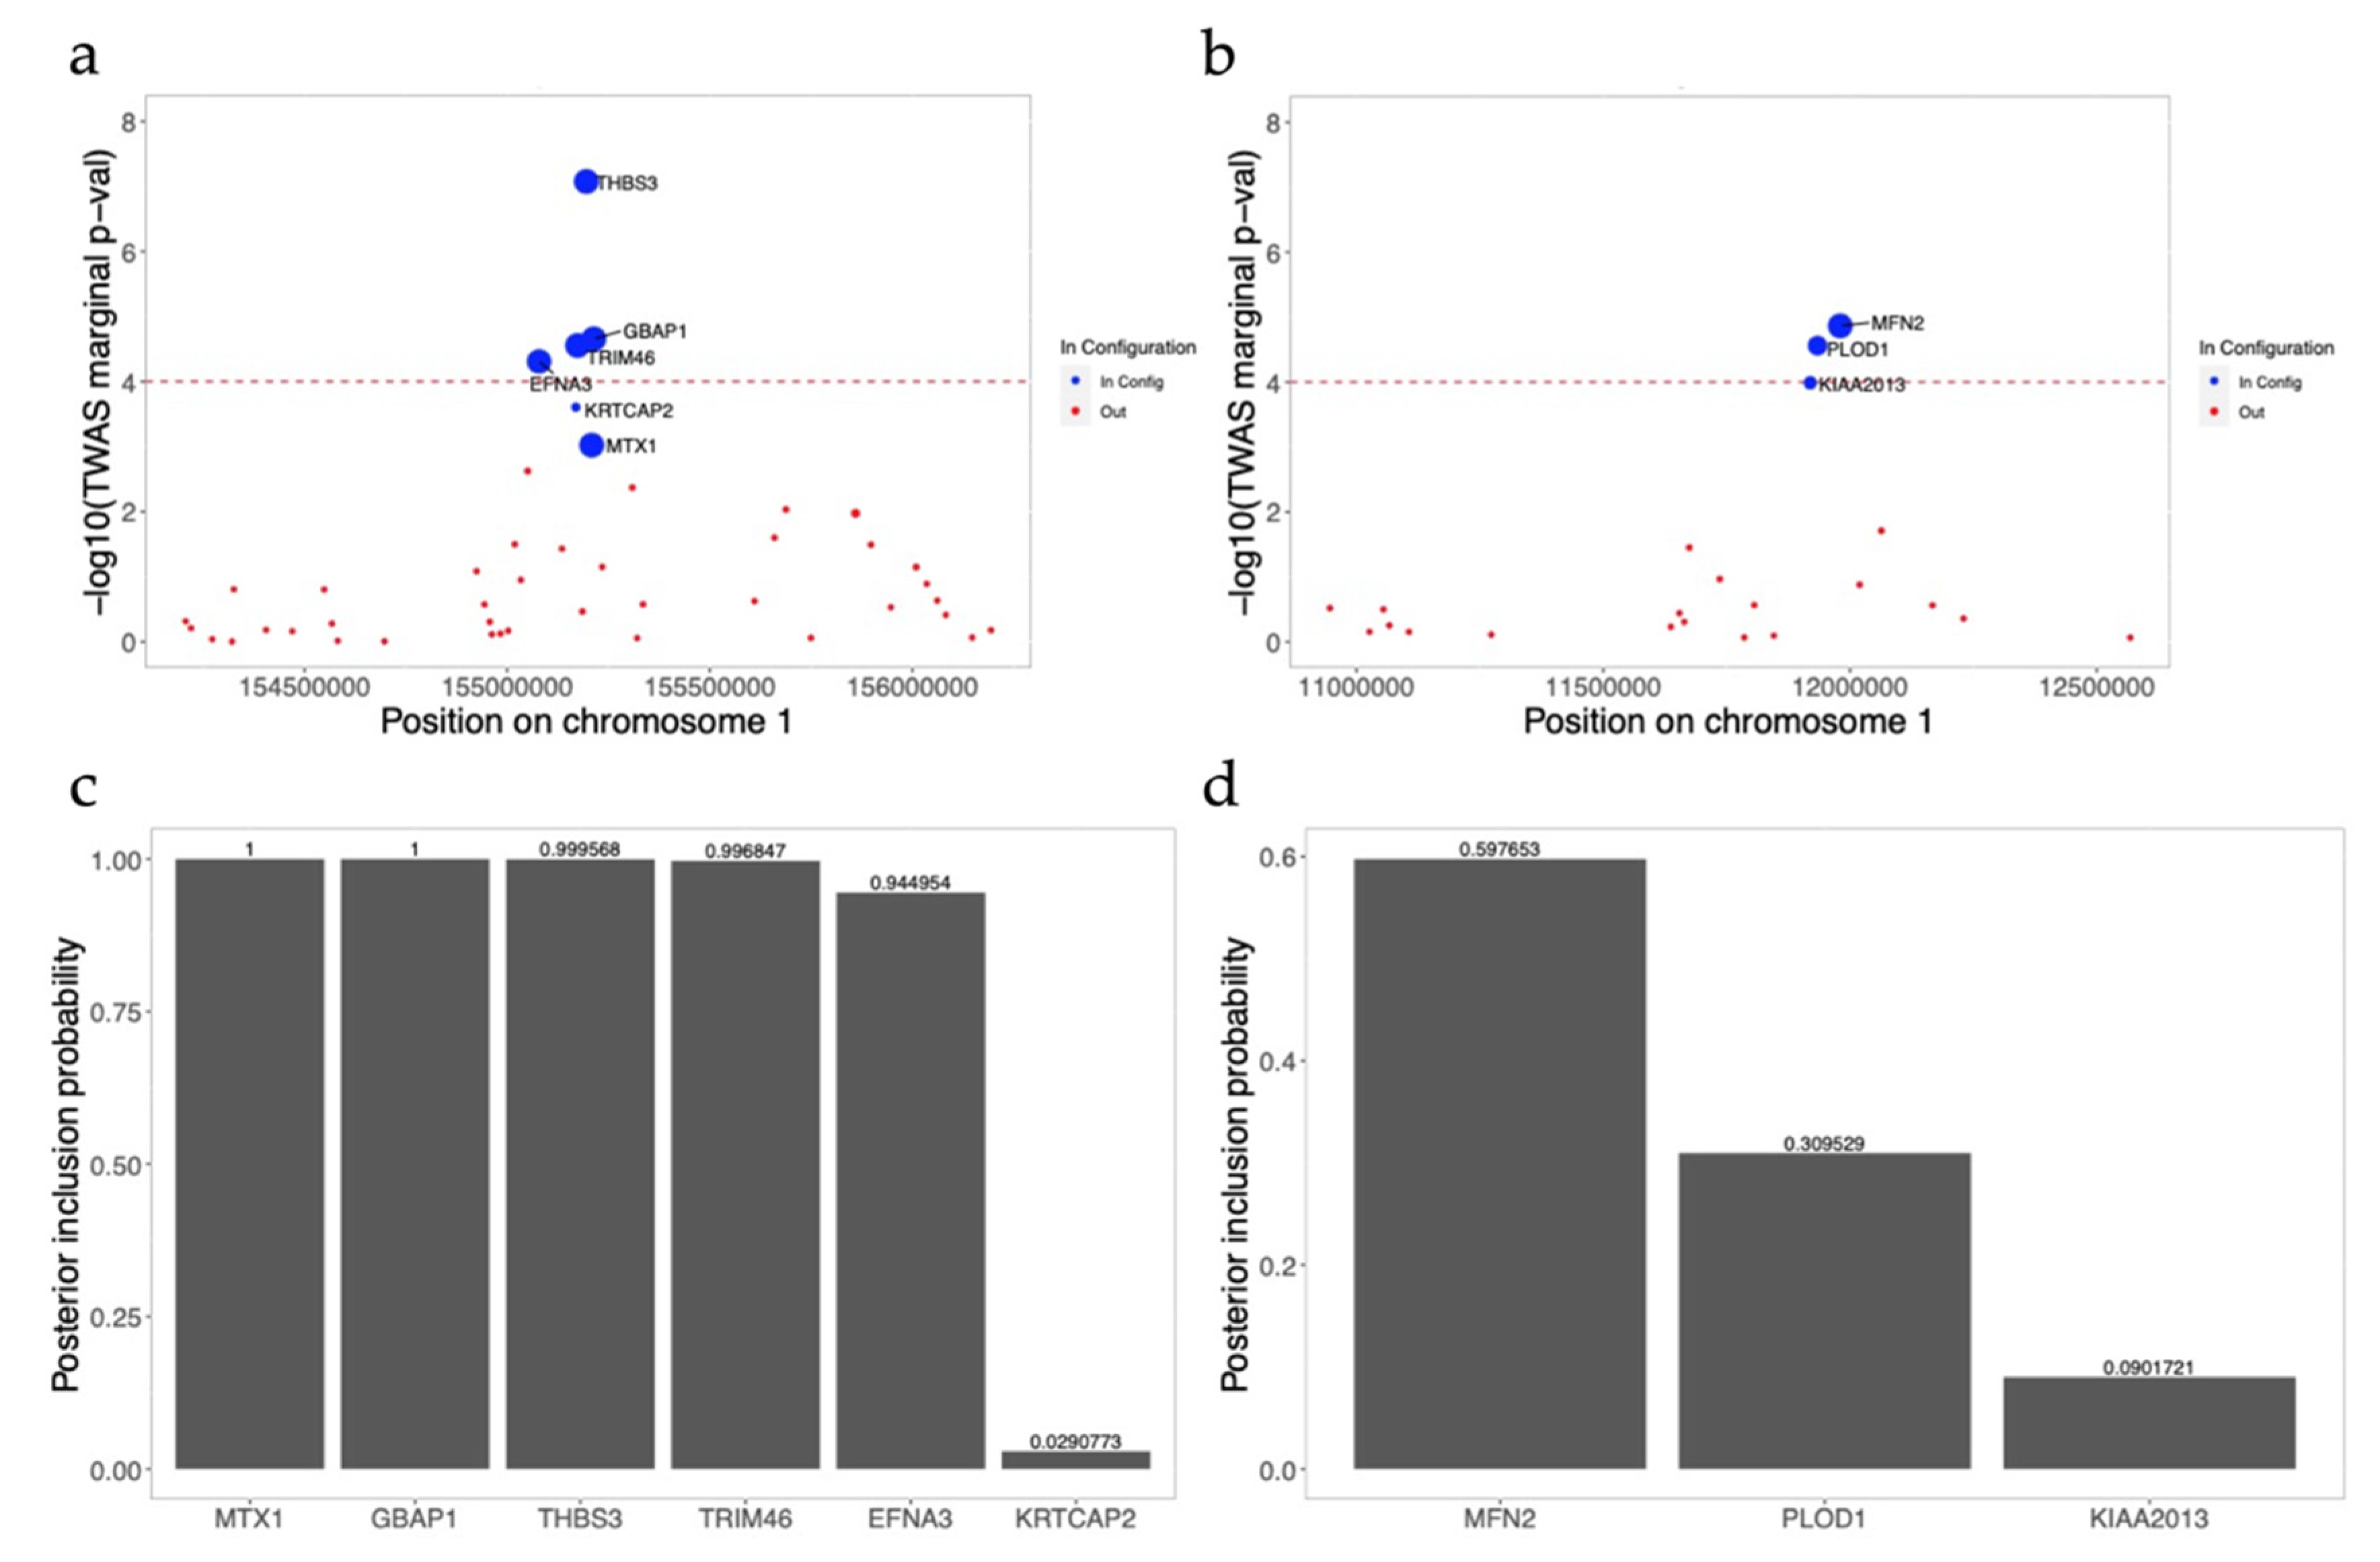
3.7. FINEMAP Analysis for Significant Gene-Trait Associations

In total, we identified 66 loci for 4 blood cell traits across AA and HL using both reference panels (Supplementary Table S4), of which 58 loci only include one gene. There are in total 27 gene-trait pairs in the remaining 8 loci which include at least two signals. For prioritizing the candidate causal gene at these loci, we performed fine-mapping using FINEMAP [39], however the findings were difficult to interpret, in particular for the following two examples.
THBS3 locus. The THBS3 locus includes four genes: THBS3, EFNA2, TRIM46, and GBAP1. THBS3 was the most marginally significant gene, passing the Bonferroni threshold value (marginal p-value = 9.8 × 10⁻⁸) for HCT from TWAS analysis using the DGN reference panel in HL. The correlation of predicted gene expression was very low for these 4 genes (correlation R2 ranged from 7 × 10⁻⁴ to 0.03). However, the fine-mapping results included 6 genes: 4 significant genes (EFNA2, TRIM46, THBS3, and GBAP1) plus 2 additional non-significant genes (MTX1 and KRTCAP2), in the 95% credible set (Figure 8a,c). MTX1 is reported as the mapped gene for the previously reported GWAS lead variant for HCT at this locus (i.e., rs760077) [9,11,38]. However, MTX1 was not significant in our TWAS results, despite adequate model R2 for gene expression prediction (marginal p = 0.001; model R2 = 0.10). Within this locus the predicted gene expression between the lead gene THBS3 and GWAS-reported gene MTX1 was not correlated (R2 = 7.2 × 10⁻⁵), but the gene prediction correlations are stronger between MTX1 and GBAP1 (R2 = 0.31), MTX1 and EFNA3 (R2 = 0.40), and MTX1 and TRIM46 (R2 = 0.78). We further note that FINEMAP assigned MTX1 the highest marginal posterior inclusion probability (PIP = 1) [9,44], followed by GBAP1. Given the high correlations between GBAP1, EFNA3, TRIM46, and MTX1, none of which are correlated with lead TWAS gene (THBS3), it is difficult to accurately narrow down a reasonably sized candidate causal gene set at this locus. The low PIP for the most significant THBS3 gene is also difficult to interpret. In summary, fine-mapping was not informative in pinpointing the candidate causal gene for this locus.
MFN2 locus. The MFN2 locus includes two significant genes: PLOD1 and MFN2. The lead gene MFN2 is the most significant gene for platelet count in our AA-focused meta-analysis (p = 1.36 × 10⁻⁵, DGN reference panel). MFN2 is a hemostasis-related gene involved in megakaryocyte development and platelet production [45]. Both of the genes were reported in prior GWAS results based on proximity (the TSS of MFN2 is ~5 kb from the 3′UTR of PLOD1 on the same strand) [9,38]. Fine-mapping results reported three genes (PLOD1, KIAA2013, and MFN2) in the 95% credible set at this locus. The predicted expression of the lead gene, MFN2, is not highly correlated with KIAA2013 (R2 = 0.005) or PLOD1 (R2 = 0.003); however, fine-mapping shows that all these three genes are in the 95% credible causal gene set (Figure 8b,d). Additionally, around 50–55% of variants are shared in the three gene prediction models, even though the predicted expression correlations are low, which may contribute to the unclear 95% credible set results.
We further checked additional 6 loci from our TWAS results and found that the 95% credible causal gene sets were very similar: fine-mapping included all marginal significant genes within each locus and did not help to distinguish the candidate causal genes (Supplementary Table S6).

4. Discussion

In recent years, we have increasingly realized that our genomic studies are failing on diversity. We observe examples where certain population-specific variants significantly associated with complex traits: examples include the African specific Duffy null variant rs2814778 alone accounts for 15–20% of variability in white blood cell counts among AAs [4,46], and the trypanolytic APOL1 G1/G2 alleles conferring an estimated ~20% lifetime risk of developing chronic kidney disease [47,48]. In addition, certain drugs may be less effective or even unsafe in some racial/ethnic groups due to genetic differences [12]. For GWAS, studies embracing ethnic diversity have been recognized as more powerful for gene mapping due to differences in allele frequency, effect size, haplotype background of causal variant(s), and LD across ethnicities [49,50], as well as factors that are broadly defined as social determinants of race including but not limited to differential pathogen invasion, environmental exposures, perceived discrimination and associated psychosocial stress [51,52,53]. We therefore consider it a pressing task to increase diversity in our genetic studies.
Here, we conducted large-scale TWAS meta-analyses for 4 blood cell traits in AA and HL populations, using a larger whole-blood eQTL reference panel (DGN) in European ancestry populations and smaller but ancestry-matched reference panels from MESA monocytes. To our knowledge, this is the largest genetic discovery effort yet conducted in these populations for blood cell indices, exceeding available sample sizes from recent trans-ethnic blood cell traits GWAS ([38], n = 15,171 African ancestry, n = 9368 Hispanic/Latino), recent analyses of red blood cells in the Population Architecture using Genomics and Epidemiology [PAGE] studies ([54], n = 16,258 African American, n = 20,784 Hispanic/Latino), and our own recent TOPMed imputed GWAS analyses ([55], n = 21,513 African ancestry and 21,689 Hispanic/Latino participants). These previous efforts all included some but not all of the cohorts included here. In our comparisons of expression reference panels, using one of the largest expression datasets in African Americans (GENOA LCL data) as a testing dataset for comparing imputed to true gene expression (using the DGN, sub-sampled DGN and MESA TWAS training reference panels), we observed that the larger sample size for DGN (as well as the potentially the use of whole blood instead of monocyte specific data, or RNA-seq versus expression microarray) led to slight improvements in model performance over MESA AAs. The generalizability of these comparisons in GENOA is limited by tissue heterogeneity between the DGN and MESA reference panels, however. However, we see additional significant gene-trait associations using the ancestry-matched monocyte eQTL reference panels not captured using DGN, and these TWAS models generally include a high percentage of variants more common in non-European populations. This is true even for red blood cell and platelet traits; in theory, a monocyte-specific eQTL dataset should be a poorer model for these traits than whole blood, as unlike in whole blood no transcripts from platelets or red blood cells would be included (though even for whole blood, the vast majority of transcripts are for white blood cells (monocytes and lymphocytes)). Finding new, replicated loci in much more modest sample sizes than for current trans-ethnic GWAS efforts (which include > 750,000 participants [38]) also highlights the importance of performing TWAS and other genetic analyses in diverse populations.
Previous work has also suggested the value of ancestry-matched TWAS reference panels. Recent work from Geoffroy, et al. [24] found more significant complex trait-associated genes in summary statistics from the diverse PAGE consortium (~50,000 HL, African American, Asian, Native Hawaiian, and Native American individuals) using models trained in African American and HL MESA participants than in European- or all-ancestry TWAS models. Work in the diverse Carolina Breast Cancer Study (CBCS) cohort also suggests that TWAS models perform poorly across race/ethnicity groups, with multiple novel discoveries for breast cancer survival found in AA women using TWAS gene expression models trained in a subset of the cohort with measured expression data [21]. Poor performance comparing real and predicted gene expression in whole blood was also observed for GTEx v7 (>85% European) and DGN TWAS weights in a pediatric African American cohort—the Study of African Americans, Asthma, Genes, and Environment (SAGE)—with substantial declines in prediction accuracy in African ancestry populations from the GEUVADIS LCL expression datasets also observed versus European ancestry datasets [56]. Sample sizes remain limited for transcriptome data in non-European populations, however. For example, the large blood-based eQTLGen meta-analysis included almost exclusively European-ancestry individuals [57]. Additional data generation in non-European populations is important to improve TWAS performance and gene-trait association discovery.
Our work also identified biologically relevant genes for hematological traits at loci not containing previous GWAS signals, as well as genes which may explain known GWAS signals in gene-dense regions or highlight additional sub-genome-wide significant conditionally distinct signals at known loci, such as TNFAIP2. Previous studies reported that TNFAIP2, identified by TWAS with the MESA HL reference panel for platelet count, is related to acute promyelocytic leukemia [58,59] and may play a role as mediator of inflammation [60] and angiogenesis [61]. It is also known to be highly expressed in mononuclear progenitor cells of the bone marrow [62] and in mature peripheral blood monocytes [63], and plays a crucial role in apoptosis [60,64,65]. One study reported that TNFAIP2 was involved with the protective mechanism of Amentoflavone in the hematopoietic system of mice against γ-irradiation [62]. While this broad locus for platelet count was known from GWAS, conditional analysis adjusting for these known GWAS identified variants suggests additional variant-trait associations remain to be discovered, and this gene also has not been commonly identified as the likely target gene in prior GWAS studies [11,38] (where annotated genes were often based on proximity alone). This gene-trait association was not identified using the DGN reference panel, likely due to the allele frequency differences for variants in the gene expression prediction model in European-ancestry and HL populations, further demonstrating the importance of ancestry matched reference panels.
Even though fine-mapping could help to prioritize the candidate causal genes at TWAS loci in some cases, our results show that fine-mapping may not always provide assistance in identifying candidate causal genes. There are several challenges for TWAS fine-mapping. One challenge is that shared eQTLs in the prediction models for multiple genes could bias the fine-mapping results, such as those observed at the MFN2 locus. Having a large number of genes whose predicted expression is highly correlated to the GWAS reported gene could also bias fine-mapping results, as we observed at the THBS3 locus. Moreover, FINEMAP, which performs fine-mapping using the correlation matrix based on the gene prediction models, may not reflect the true correlation of gene expression within a locus. Future work on pinpointing the potential causal genes from TWAS may include using measured gene expression, instead of predicted gene expression, to calibrate the correlation matrix in fine-mapping analysis [14].
Our analysis has a number of limitations. First, our TWAS significance threshold value was lenient. Using a strict Bonferroni (0.05/# tested genes, Supplementary Table S7) significance threshold, only 24 out of 90 unique gene-trait associations noted in Supplementary Table S4 (~26.7%) met that criterion, most of which are well known genes from previous GWAS studies. To increase our odds of identifying novel and biologically interesting signals in understudied AA and HL populations, we chose 1 × 10⁻⁴ as a nominal significance threshold, but only considered as true findings genes which additionally replicated in UK Biobank, increasing confidence in our results. Larger sample sizes are necessary to identify novel genes using a strict multiple-testing threshold. Secondly, we do not have access to a dataset for comparing real and predicted gene expression in a HL population (as such a publicly available dataset does not, to our knowledge, currently exist); also, the tissue used for GENOA gene expression quantification, LCLs, differs from that in MESA (monocytes) and DGN (whole blood). Comparisons in GENOA are thus complicated by tissue heterogeneity, though we note that prior studies have performed comparisons (for example across eQTLs) across these relatively similar blood cell related tissues (for example LCLs, whole blood, and peripheral blood mononuclear cells are compared in the eQTLGen meta-analysis [57]). Thirdly, gene with cross-validation R2 < 1% and passing lenient significant threshold (Table 1 and Supplementary Table S4) might be derived from potential GWAS SNPs that have relatively large eQTL effect sizes, rather than implicate causality in that they may not indicate genetic effect on phenotype mediated through gene expression. In addition, we note that cohorts were classified as HL and AA based primarily on participant self-report; these self-identified race/ethnicity groupings, which are socially defined, encompass a variety of genetic ancestry backgrounds. Therefore, exact ancestry matching between, for example, MESA HL participants and HL participants in cohorts included in the hematological traits meta-analysis cannot be assumed.
In summary, TWAS analysis can help to enhance our understanding of the genetics of complex traits, including hematological indices. TWAS not only helps to identify potential causal genes at known GWAS loci, but can also increase power for new candidate gene and locus discovery. Some gene-trait associations in our analysis were only revealed by ancestry-matched TWAS reference panels due to the difference in MAF of included variants for expression prediction across populations. More work is needed to both generate large expression datasets in non-European-ancestry populations and apply these datasets to TWAS discovery for complex traits across ancestrally diverse cohorts.

Supplementary Materials

The following are available online at https://www.mdpi.com/article/10.3390/genes12071049/s1, Supplementary Figure S1: Detailed Study Overview; Supplementary Figure S2: Ancestry Inference Results. Global ancestry estimates for each cohort were summarized in violin plots; Supplementary Figure S3: Comparison of well-predicted genes between and MESA AA reference panels, at different true R2 thresholds; Supplementary Figure S4: Mirror plots for TWAS and GWAS results; Supplementary Figure S5: Model R2 vs. cross-validation R2. Supplementary Table S1: Summary of eQTL and GWAS datasets used for this study; Supplementary Table S2: Comparison of training results between DGN and MESA reference panel; Supplementary Table S3: Comparison of performance of prediction of true gene expression in GENOA using DGN and MESA AA reference panels; Supplementary Table S4: All the association results identified by marginal p-value < 1 × 10⁻⁴. Supplementary Table S5: All the known GWAS variants used for conditional analysis; Supplementary Table S6: The 8 multi-gene loci results from our TWAS analyses, with fine-mapping credible set posterior probabilities of inclusion; Supplementary Table S7: Bonferroni corrected p-value thresholds for TWAS analysis in each ancestry group and with each reference panel, based on the number of tested genes.

Author Contributions

Conceptualization, A.P.R., L.M.R. and Y.L.; methodology, J.W., M.X., B.R., J.D.R., Q.S., A.L.T., H.Q., M.H.K., Y.S., K.L.Y. and M.G.; formal analysis, J.W., M.X. and B.R.; resources, M.A., C.L.A., S.A.B., S.B., J.Y., H.C., M.F., C.J.H., E.J., C.K., R.J.F.L., Y.L., J.-Y.M., K.E.N., S.S.R., J.I.R., J.A.S., W.Z., L.S., T.W. and X.Z.; writing—original draft preparation, J.W., M.X., B.R. and L.M.R.; writing—review and editing, all authors; visualization, J.W. and J.C.; supervision, L.M.R. and Y.L.; funding acquisition, A.P.R. and Y.L. All authors have read and agreed to the published version of the manuscript.

Funding

This project was funded by R01HL129132. The project described was also supported by the National Center for Advancing Translational Sciences, National Institutes of Health, through Grant KL2TR002490 (L.M.R.). The content is solely the responsibility of the authors and does not necessarily represent the official views of the NIH. CJH was additionally funded by T32 HL007284. LMR was additionally funded by R01HG010297 and T32 HL129982. YL was additionally funded by R01 GM105785 and U01 DA052713. This material is additionally based upon work supported by the National Science Foundation Graduate Research Fellowship under Grant No. DGE-1650116 to BR.

Institutional Review Board Statement

Data collection for all contributing studies was conducted according to the guidelines of the Dec-laration of Helsinki, and approved by the Institutional Review Board (or Ethics Committee) of the relevant institutions. IRB numbers are: MESA 16-2213; ARIC 16-2213; BioMe 16-2213; CARDIA 16-2213; GERA 14-2427; UK Biobank 16-2213; WHI 16-2213; HCHS/SOL 16-2213.

Informed Consent Statement

Informed consent was provided by all participants in the participating cohort and biobank studies.

Data Availability Statement

Data used in these analyses can be obtained either through the coordinating centers of the participating cohort and biobank studies or through dbGaP. Relevant dbGaP accession numbers are listed below. BioMe phs000227 (MEGA) and phs000925; ARIC phs000557; CARDIA phs000613; WHI phs000227 (MEGA) and phs000386; HCHS/SOL phs000810; GERA phs000674; MESA phs001416, phs000209; GENOA phs000379.

Acknowledgments

This research has been conducted using the UK Biobank Resource under Application Number 25953. Support for title page creation and format was provided by AuthorArranger, a tool developed at the National Cancer Institute. Whole genome sequencing (WGS) for the Trans-Omics in Precision Medicine (TOPMed) program was supported by the National Heart, Lung and Blood Institute (NHLBI). WGS for “NHLBI TOPMed: Multi-Ethnic Study of Atherosclerosis (MESA)” (phs001416.v1.p1) was performed at the Broad Institute of MIT and Harvard (3U54HG003067-13S1). Centralized read mapping and genotype calling, along with variant quality metrics and filtering were provided by the TOPMed Informatics Research Center (3R01HL-117626-02S1, contract HHSN268201800002I). Phenotype harmonization, data management, sample-identity QC, and general study coordination, were provided by the TOPMed Data Coordinating Center (R01HL-120393; U01HL-120393; contract HHSN268201800001I). MESA and the MESA SHARe project are conducted and supported by the National Heart, Lung, and Blood Institute (NHLBI) in collaboration with MESA investigators. Support for MESA is provided by contracts 75N92020D00001, HHSN268201500003I, N01-HC-95159, 75N92020D00005, N01-HC-95160, 75N92020D00002, N01-HC-95161, 75N92020D00003, N01-HC-95162, 75N92020D00006, N01-HC-95163, 75N92020D00004, N01-HC-95164, 75N92020D00007, N01-HC-95165, N01-HC-95166, N01-HC-95167, N01-HC-95168, N01-HC-95169, UL1-TR-000040, UL1-TR-001079, UL1-TR-001420, UL1-TR-001881, and DK063491. The MESA Epigenomics & Transcriptomics Studies were funded by NIH grants 1R01HL101250, 1RF1AG054474, R01HL126477, R01DK101921, and R01HL135009. Genotyping of the GERA cohort was funded by a grant from the National Institute on Aging, National Institute of Mental Health, and National Institute of Health Common Fund (RC2 AG036607). The Population Architecture Using Genomics and Epidemiology (PAGE) program is funded by the National Human Genome Research Institute (NHGRI) with co-funding from the National Institute on Minority Health and Health Disparities (NIMHD). The contents of this paper are solely the responsibility of the authors and do not necessarily represent the official views of the NIH. The PAGE consortium thanks the staff and participants of all PAGE studies for their important contributions. We thank Rasheeda Williams and Margaret Ginoza for providing assistance with program coordination. The complete list of PAGE members can be found at http://www.pagestudy.org (accessed January 2020). Assistance with data management, data integration, data dissemination, genotype imputation, ancestry deconvolution, population genetics, analysis pipelines, and general study coordination was provided by the PAGE Coordinating Center (NIH U01HG007419). Genotyping services were provided by the Center for Inherited Disease Research (CIDR). CIDR is fully funded through a federal contract from the National Institutes of Health to The Johns Hopkins University, contract number HHSN268201200008I. Genotype data quality control and quality assurance services were provided by the Genetic Analysis Center in the Biostatistics Department of the University of Washington, through support provided by the CIDR contract. The data and materials included in this report result from collaboration between the following studies and organizations: HCHS/SOL: Primary funding support to Kari E. North and colleagues is provided by U01HG007416. Additional support was provided via R01DK101855 and 15GRNT25880008. The Hispanic Community Health Study/Study of Latinos was carried out as a collaborative study supported by contracts from the National Heart, Lung, and Blood Institute (NHLBI) to the University of North Carolina (N01-HC65233), University of Miami (N01-HC65234), Albert Einstein College of Medicine (N01-HC65235), Northwestern University (N01-HC65236), and San Diego State University (N01-HC65237). The following Institutes/Centers/Offices contribute to the HCHS/SOL through a transfer of funds to the NHLBI: National Institute on Minority Health and Health Disparities, National Institute on Deafness and Other Communication Disorders, National Institute of Dental and Craniofacial Research, National Institute of Diabetes and Digestive and Kidney Diseases, National Institute of Neurological Disorders and Stroke, NIH Institution-Office of Dietary Supplements. The Genetic Analysis Center at the University of Washington was supported by NHLBI and NIDCR contracts (HHSN268201300005C AM03 and MOD03). WHI: Funding support for the “Exonic variants and their relation to complex traits in minorities of the WHI” study is provided through the NHGRI PAGE program (NIH U01HG007376). The WHI program is funded by the National Heart, Lung, and Blood Institute, National Institutes of Health, U.S. Department of Health and Human Services through contracts HHSN268201100046C, HHSN268201100001C, HHSN268201100002C, HHSN268201100003C, HHSN268201100004C, and HHSN271201100004C. The authors thank the WHI investigators and staff for their dedication, and the study participants for making the program possible. A listing of WHI investigators can be found at: https://www.whi.org/researchers/Documents%20%20Write%20a%20Paper/WHI%20Investigator%20Long%20List.pdf (accessed January 2020). ARIC: The Atherosclerosis Risk in Communities study has been funded in whole or in part with Federal funds from the National Heart, Lung, and Blood Institute, National Institutes of Health, Department of Health and Human Services, under Contract nos. (HHSN268201700001I, HHSN268201700002I, HHSN268201700003I, HHSN268201700005I, HHSN268201700004I). The authors thank the staff and participants of the ARIC study for their important contributions. CARDIA: The Coronary Artery Risk Development in Young Adults Study (CARDIA) is conducted and supported by the National Heart, Lung, and Blood Institute (NHLBI) in collaboration with the University of Alabama at Birmingham (HHSN268201800005I & HHSN268201800007I), Northwestern University (HHSN268201800003I), University of Minnesota (HHSN268201800006I), and Kaiser Foundation Research Institute (HHSN268201800004I). Support for the Genetic Epidemiology Network of Arteriopathy (GENOA) data collection and analysis was provided by the National Heart, Lung and Blood Institute (U01HL054457, RC1HL100185, R01HL119443, R01HL133221, and R01HL141292) and the National Institute of Neurological Disorders and Stroke (R01NS041558) of the National Institutes of Health. Finally, we would like to acknowledge use of the Trans-Omics in Precision Medicine (TOPMed) program imputation panel (freeze 5 version) supported by the National Heart, Lung and Blood Institute (NHLBI); see www.nhlbiwgs.org. TOPMed study investigators contributed data to the reference panel, which was accessed through the Michigan Imputation Server; see https://imputationserver.sph.umich.edu (accessed January 2020). The newest version of the imputation panel (which was not used in this study) can be found at https://imputation.biodatacatalyst.nhlbi.nih.gov. The panel was constructed and implemented by the TOPMed Informatics Research Center at the University of Michigan (3R01HL-117626-02S1; contract HHSN268201800002I). The TOPMed Data Coordinating Center (R01HL-120393; U01HL-120393; contract HHSN268201800001I) provided additional data management, sample identity checks, and overall program coordination and support. We gratefully acknowledge the studies and participants who provided biological samples and data for TOPMed.

Conflicts of Interest

The authors declare no conflict of interest.

References

  1. Segal, J.B.; Moliterno, A.R. Platelet Counts Differ by Sex, Ethnicity, and Age in the United States. Ann. Epidemiology 2006, 16, 123–130. [Google Scholar] [CrossRef]
  2. Zakai, N.A.; McClure, L.A.; Prineas, R.; Howard, G.; McClellan, W.; Holmes, C.E.; Newsome, B.B.; Warnock, D.G.; Audhya, P.; Cushman, M. Correlates of Anemia in American Blacks and Whites: The REGARDS Renal Ancillary Study. Am. J. Epidemiology 2008, 169, 355–364. [Google Scholar] [CrossRef]
  3. Lim, E.-M.; Cembrowski, G.; Clarke, G. Race-specific WBC and neutrophil count reference intervals. Int. J. Lab. Hematol. 2010, 32, 590–597. [Google Scholar] [CrossRef]
  4. Reich, D.; Nalls, M.A.; Kao, W.H.L.; Akylbekova, E.L.; Tandon, A.; Patterson, N.; Mullikin, J.; Hsueh, W.-C.; Cheng, C.-Y.; Coresh, J.; et al. Reduced Neutrophil Count in People of African Descent Is Due To a Regulatory Variant in the Duffy Antigen Receptor for Chemokines Gene. PLoS Genet. 2009, 5, e1000360. [Google Scholar] [CrossRef] [PubMed] [Green Version]
  5. Beutler, E.; West, C. Hematologic differences between African-Americans and whites: The roles of iron deficiency and α-thalassemia on hemoglobin levels and mean corpuscular volume. Blood 2005, 106, 740–745. [Google Scholar] [CrossRef] [PubMed]
  6. Network, M.G.E. Insights into malaria susceptibility using genome-wide data on 17,000 individuals from Africa, Asia and Oceania. Nat. Commun. 2019, 10, 5732. [Google Scholar] [CrossRef] [Green Version]
  7. Clarke, G.M.; Rockett, K.; Kivinen, K.; Hubbart, C.; Jeffreys, A.E.; Rowlands, K.; Jallow, M.; Conway, D.; Bojang, K.A.; Pinder, M.; et al. Characterisation of the opposing effects of G6PD deficiency on cerebral malaria and severe malarial anaemia. eLife 2017, 6. [Google Scholar] [CrossRef] [PubMed]
  8. Hu, Y.; Stilp, A.M.; McHugh, C.P.; Rao, S.; Jain, D.; Zheng, X.; Lane, J.; de Bellefon, S.M.; Raffield, L.M.; Chen, M.-H.; et al. Whole-genome sequencing association analysis of quantitative red blood cell phenotypes: The NHLBI TOPMed program. Am. J. Hum. Genet. 2021, 108, 874–893. [Google Scholar] [CrossRef]
  9. Astle, W.; Elding, H.; Jiang, T.; Allen, D.; Ruklisa, D.; Mann, A.; Mead, D.; Bouman, H.; Riveros-Mckay, F.; Kostadima, M.A.; et al. The Allelic Landscape of Human Blood Cell Trait Variation and Links to Common Complex Disease. Cell 2016, 167, 1415–1429.e19. [Google Scholar] [CrossRef] [Green Version]
  10. Ganesh, S.K.; A Zakai, N.; A Van Rooij, F.J.; Soranzo, N.; Smith, A.V.; A Nalls, M.; Chen, M.-H.; Kottgen, A.; Glazer, N.; Dehghan, A.; et al. Multiple loci influence erythrocyte phenotypes in the CHARGE Consortium. Nat. Genet. 2009, 41, 1191–1198. [Google Scholar] [CrossRef] [PubMed] [Green Version]
  11. Vuckovic, D.; Bao, E.L.; Akbari, P.; Lareau, C.A.; Mousas, A.; Jiang, T.; Chen, M.-H.; Raffield, L.M.; Tardaguila, M.; Huffman, J.E.; et al. The Polygenic and Monogenic Basis of Blood Traits and Diseases. Cell 2020, 182, 1214–1231.e11. [Google Scholar] [CrossRef] [PubMed]
  12. Popejoy, A.B.; Fullerton, S.M. Genomics is failing on diversity. Nat. Cell Biol. 2016, 538, 161–164. [Google Scholar] [CrossRef] [PubMed] [Green Version]
  13. Peprah, E.; Wiley, K.; Sampson, U.; Narula, J. A New Age for African-Driven Genomics Research: Human Heredity and Health in Africa (H3Africa). Glob. Hear. 2017, 12, 67–68. [Google Scholar] [CrossRef] [PubMed]
  14. Wainberg, M.; Sinnott-Armstrong, N.; Mancuso, N.; Barbeira, A.N.; Knowles, D.A.; Golan, D.; Ermel, R.; Ruusalepp, A.; Quertermous, T.; Hao, K.; et al. Opportunities and challenges for transcriptome-wide association studies. Nat. Genet. 2019, 51, 592–599. [Google Scholar] [CrossRef]
  15. Gamazon, E.R.; GTEx Consortium; Wheeler, H.; Shah, K.P.; Mozaffari, S.; Aquino-Michaels, K.; Carroll, R.J.; Eyler, A.E.; Denny, J.C.; Nicolae, D.; et al. A gene-based association method for mapping traits using reference transcriptome data. Nat. Genet. 2015, 47, 1091–1098. [Google Scholar] [CrossRef] [Green Version]
  16. Gusev, A.; Ko, A.; Shi, H.; Bhatia, G.; Chung, W.; Penninx, B.W.J.H.; Jansen, R.; De Geus, E.J.C.; I Boomsma, D.; A Wright, F.; et al. Integrative approaches for large-scale transcriptome-wide association studies. Nat. Genet. 2016, 48, 245–252. [Google Scholar] [CrossRef] [Green Version]
  17. Barbeira, A.N.; GTEx Consortium; Dickinson, S.P.; Bonazzola, R.; Zheng, J.; Wheeler, H.; Torres, J.M.; Torstenson, E.S.; Shah, K.P.; Garcia, T.; et al. Exploring the phenotypic consequences of tissue specific gene expression variation inferred from GWAS summary statistics. Nat. Commun. 2018, 9, 1–20. [Google Scholar] [CrossRef]
  18. Wu, L.; Shi, W.; Long, J.; Guo, X.; Michailidou, K.; Beesley, J.; Bolla, M.K.; Shu, X.-O.; Lu, Y.; Cai, Q.; et al. A transcriptome-wide association study of 229,000 women identifies new candidate susceptibility genes for breast cancer. Nat. Genet. 2018, 50, 968–978. [Google Scholar] [CrossRef]
  19. Mancuso, N.; The PRACTICAL Consortium; Gayther, S.; Gusev, A.; Zheng, W.; Penney, K.L.; Kote-Jarai, Z.; Eeles, R.; Freedman, M.; Haiman, C.; et al. Large-scale transcriptome-wide association study identifies new prostate cancer risk regions. Nat. Commun. 2018, 9, 4079. [Google Scholar] [CrossRef] [Green Version]
  20. Andaleon, A.; Mogil, L.S.; Wheeler, H.E. Genetically regulated gene expression underlies lipid traits in Hispanic cohorts. PLoS ONE 2019, 14, e0220827. [Google Scholar] [CrossRef] [Green Version]
  21. Bhattacharya, A.; García-Closas, M.; Olshan, A.F.; Perou, C.M.; Troester, M.A.; Love, M.I. A framework for transcriptome-wide association studies in breast cancer in diverse study populations. Genome Biol. 2020, 21, 42. [Google Scholar] [CrossRef] [PubMed] [Green Version]
  22. Patel, A.; García-Closas, M.; Olshan, A.F.; Perou, C.M.; Troester, M.A.; Love, M.I.; Bhattacharya, A. Gene-level germline contributions to clinical risk of recurrence scores in Black and White breast cancer patients. medRxiv 2021. [Google Scholar] [CrossRef]
  23. Fiorica, P.N.; Schubert, R.; Morris, J.D.; Sami, M.A.; Wheeler, H.E. Multi-ethnic transcriptome-wide association study of prostate cancer. PLoS ONE 2020, 15, e0236209. [Google Scholar] [CrossRef] [PubMed]
  24. Geoffroy, E.; Gregga, I.; Wheeler, H.E. Population-Matched Transcriptome Prediction Increases TWAS Discovery and Replication Rate. iScience 2020, 23, 101850. [Google Scholar] [CrossRef]
  25. Ki Sung GTEx Consortium. Genetic effects on gene expression across human tissues. Nat. Cell Biol. 2017, 550, 204–213. [Google Scholar] [CrossRef]
  26. Battle, A.; Mostafavi, S.; Zhu, X.; Potash, J.B.; Weissman, M.; McCormick, C.; Haudenschild, C.D.; Beckman, K.B.; Shi, J.; Mei, R.; et al. Characterizing the genetic basis of transcriptome diversity through RNA-sequencing of 922 individuals. Genome Res. 2014, 24, 14–24. [Google Scholar] [CrossRef] [Green Version]
  27. Das, S.; Forer, L.; Schöenherr, S.; Sidore, C.; Locke, A.E.; Kwong, A.; Vrieze, S.I.; Chew, E.Y.; Levy, S.; McGue, M.; et al. Next-generation genotype imputation service and methods. Nat. Genet. 2016, 48, 1284–1287. [Google Scholar] [CrossRef] [Green Version]
  28. Maples, B.K.; Gravel, S.; Kenny, E.; Bustamante, C.D. RFMix: A Discriminative Modeling Approach for Rapid and Robust Local-Ancestry Inference. Am. J. Hum. Genet. 2013, 93, 278–288. [Google Scholar] [CrossRef] [Green Version]
  29. Mostafavi, S.; Battle, A.; Zhu, X.; Urban, A.E.; Levinson, D.; Montgomery, S.B.; Koller, D. Normalizing RNA-Sequencing Data by Modeling Hidden Covariates with Prior Knowledge. PLoS ONE 2013, 8, e68141. [Google Scholar] [CrossRef]
  30. Mogil, L.S.; Andaleon, A.; Badalamenti, A.; Dickinson, S.P.; Guo, X.; Rotter, J.I.; Johnson, W.C.; Im, H.K.; Liu, Y.; Wheeler, H.E. Genetic architecture of gene expression traits across diverse populations. PLoS Genet. 2018, 14, e1007586. [Google Scholar] [CrossRef]
  31. Liu, Y.; Reynolds, L.M.; Ding, J.; Hou, L.; Lohman, K.; Young, T.; Cui, W.; Huang, Z.; Grenier, C.; Wan, M.; et al. Blood monocyte transcriptome and epigenome analyses reveal loci associated with human atherosclerosis. Nat. Commun. 2017, 8, 393. [Google Scholar] [CrossRef] [PubMed] [Green Version]
  32. Liu, Y.; Ding, J.; Reynolds, L.; Lohman, K.; Register, T.C.; De La Fuente, A.; Howard, T.D.; Hawkins, G.A.; Cui, W.; Morris, J.; et al. Methylomics of gene expression in human monocytes. Hum. Mol. Genet. 2013, 22, 5065–5074. [Google Scholar] [CrossRef] [PubMed] [Green Version]
  33. Stegle, O.; Parts, L.; Piipari, M.; Winn, J.; Durbin, R. Using probabilistic estimation of expression residuals (PEER) to obtain increased power and interpretability of gene expression analyses. Nat. Protoc. 2012, 7, 500–507. [Google Scholar] [CrossRef] [PubMed] [Green Version]
  34. The 1000 Genomes Project Consortium A global reference for human genetic variation. Nature 2015, 526, 68–74. [CrossRef] [Green Version]
  35. Shang, L.; Smith, J.A.; Zhao, W.; Kho, M.; Turner, S.T.; Mosley, T.H.; Kardia, S.L.; Zhou, X. Genetic Architecture of Gene Expression in European and African Americans: An eQTL Mapping Study in GENOA. Am. J. Hum. Genet. 2020, 106, 496–512. [Google Scholar] [CrossRef] [PubMed]
  36. Willer, C.J.; Li, Y.; Abecasis, G.R. METAL: Fast and efficient meta-analysis of genomewide association scans. Bioinformatics 2010, 26, 2190–2191. [Google Scholar] [CrossRef]
  37. Liu, Y.; Chen, S.; Li, Z.; Morrison, A.C.; Boerwinkle, E.; Lin, X. ACAT: A Fast and Powerful p Value Combination Method for Rare-Variant Analysis in Sequencing Studies. Am. J. Hum. Genet. 2019, 104, 410–421. [Google Scholar] [CrossRef] [Green Version]
  38. Chen, M.-H.; Raffield, L.M.; Mousas, A.; Sakaue, S.; Huffman, J.E.; Moscati, A.; Trivedi, B.; Jiang, T.; Akbari, P.; Vuckovic, D.; et al. Trans-ethnic and Ancestry-Specific Blood-Cell Genetics in 746,667 Individuals from 5 Global Populations. Cell 2020, 182, 1198–1213.e14. [Google Scholar] [CrossRef]
  39. Benner, C.; Spencer, C.; Havulinna, A.S.; Salomaa, V.; Ripatti, S.; Pirinen, M. FINEMAP: Efficient variable selection using summary data from genome-wide association studies. Bioinformatics 2016, 32, 1493–1501. [Google Scholar] [CrossRef] [Green Version]
  40. Mbatchou, J.; Barnard, L.; Backman, J.; Marcketta, A.; Kosmicki, J.A.; Ziyatdinov, A.; Benner, C.; O’Dushlaine, C.; Barber, M.; Boutkov, B.; et al. Computationally efficient whole-genome regression for quantitative and binary traits. Nat. Genet. 2021, 1–7. [Google Scholar] [CrossRef]
  41. Uhlén, M.; Fagerberg, L.; Hallström, B.M.; Lindskog, C.; Oksvold, P.; Mardinoglu, A.; Sivertsson, Å.; Kampf, C.; Sjöstedt, E.; Asplund, A.; et al. Tissue-based map of the human proteome. Science 2015, 347, 1260419. [Google Scholar] [CrossRef] [PubMed]
  42. Ulirsch, J.C.; Lareau, C.A.; Bao, E.L.; Ludwig, L.S.; Guo, M.H.; Benner, C.; Satpathy, A.T.; Kartha, V.; Salem, R.M.; Hirschhorn, J.N.; et al. Interrogation of human hematopoiesis at single-cell and single-variant resolution. Nat. Genet. 2019, 51, 683–693. [Google Scholar] [CrossRef] [PubMed]
  43. Javierre, B.M.; Burren, O.S.; Wilder, S.; Kreuzhuber, R.; Hill, S.M.; Sewitz, S.; Cairns, J.; Wingett, S.; Varnai, C.; Thiecke, M.J.; et al. Lineage-Specific Genome Architecture Links Enhancers and Non-coding Disease Variants to Target Gene Promoters. Cell 2016, 167, 1369–1384.e19. [Google Scholar] [CrossRef] [PubMed] [Green Version]
  44. Kichaev, G.; Bhatia, G.; Loh, P.-R.; Gazal, S.; Burch, K.; Freund, M.K.; Schoech, A.; Pasaniuc, B.; Price, A.L. Leveraging Polygenic Functional Enrichment to Improve GWAS Power. Am. J. Hum. Genet. 2019, 104, 65–75. [Google Scholar] [CrossRef] [PubMed] [Green Version]
  45. Gieger, C.; Radhakrishnan, A.; Cvejic, A.; Tang, W.; Porcu, E.; Pistis, G.; Serbanovic-Canic, J.; Elling, U.; Goodall, A.; Labrune, Y.; et al. New gene functions in megakaryopoiesis and platelet formation. Nat. Cell Biol. 2011, 480, 201–208. [Google Scholar] [CrossRef] [Green Version]
  46. Nalls, M.A.; Wilson, J.G.; Patterson, N.J.; Tandon, A.; Zmuda, J.M.; Huntsman, S.; Garcia, M.; Hu, D.; Li, R.; Beamer, B.A.; et al. Admixture Mapping of White Cell Count: Genetic Locus Responsible for Lower White Blood Cell Count in the Health ABC and Jackson Heart Studies. Am. J. Hum. Genet. 2008, 82, 81–87. [Google Scholar] [CrossRef] [Green Version]
  47. Genovese, G.; Friedman, D.J.; Ross, M.D.; Lecordier, L.; Uzureau, P.; Freedman, B.I.; Bowden, D.W.; Langefeld, C.D.; Oleksyk, T.K.; Knob, A.L.U.; et al. Association of Trypanolytic ApoL1 Variants with Kidney Disease in African Americans. Science 2010, 329, 841–845. [Google Scholar] [CrossRef] [PubMed] [Green Version]
  48. Freedman, B.I.; Moxey-Mims, M.M.; Alexander, A.A.; Astor, B.C.; Birdwell, K.A.; Bowden, D.W.; Bowen, G.; Bromberg, J.; Craven, T.E.; Dadhania, D.M.; et al. APOL1 Long-term Kidney Transplantation Outcomes Network (APOLLO): Design and Rationale. Kidney Int. Rep. 2020, 5, 278–288. [Google Scholar] [CrossRef] [Green Version]
  49. Traylor, M.; Lewis, C.M. Genetic discovery in multi-ethnic populations. Eur. J. Hum. Genet. 2016, 24, 1097–1098. [Google Scholar] [CrossRef] [Green Version]
  50. Wojcik, G.L.; Graff, M.; Nishimura, K.K.; Tao, R.; Haessler, J.; Gignoux, C.R.; Highland, H.M.; Patel, Y.M.; Sorokin, E.P.; Avery, C.L.; et al. Genetic analyses of diverse populations improves discovery for complex traits. Nature 2019, 570, 514–518. [Google Scholar] [CrossRef]
  51. Hurst, L.D. Genetics and the understanding of selection. Nat. Rev. Genet. 2009, 10, 83–93. [Google Scholar] [CrossRef] [PubMed]
  52. Walker, R.J.; Williams, J.S.; Egede, L.E. Influence of Race, Ethnicity and Social Determinants of Health on Diabetes Outcomes. Am. J. Med. Sci. 2016, 351, 366–373. [Google Scholar] [CrossRef] [PubMed] [Green Version]
  53. Ogungbe, O.; Turkson-Ocran, R.-A.; Nkimbeng, M.; Cudjoe, J.; Miller, H.N.; Baptiste, D.; Himmelfarb, C.D.; Davidson, P.; Cooper, L.A.; Commodore-Mensah, Y. Social determinants of hypertension and diabetes among African immigrants: The African immigrants health study. Ethn. Heal. 2021, 1–13. [Google Scholar] [CrossRef]
  54. Hodonsky, C.J.; Baldassari, A.R.; Bien, S.A.; Raffield, L.M.; Highland, H.M.; Sitlani, C.M.; Wojcik, G.L.; Tao, R.; Graff, M.; Tang, W.; et al. Ancestry-specific associations identified in genome-wide combined-phenotype study of red blood cell traits emphasize benefits of diversity in genomics. BMC Genom. 2020, 21, 228. [Google Scholar] [CrossRef] [PubMed]
  55. Kowalski, M.H.; Qian, H.; Hou, Z.; Rosen, J.D.; Tapia, A.L.; Shan, Y.; Jain, D.; Argos, M.; Arnett, D.K.; Avery, C.; et al. Use of >100,000 NHLBI Trans-Omics for Precision Medicine (TOPMed) Consortium whole genome sequences improves imputation quality and detection of rare variant associations in admixed African and Hispanic/Latino populations. PLoS Genet. 2019, 15, e1008500. [Google Scholar] [CrossRef] [Green Version]
  56. Keys, K.L.; Mak, A.C.Y.; White, M.J.; Eckalbar, W.L.; Dahl, A.W.; Mefford, J.; Mikhaylova, A.; Contreras, M.G.; Elhawary, J.R.; Eng, C.; et al. On the cross-population generalizability of gene expression prediction models. PLoS Genet. 2020, 16, e1008927. [Google Scholar] [CrossRef]
  57. Võsa, U.; Claringbould, A.; Westra, H.-J.; Bonder, M.J.; Deelen, P.; Zeng, B.; Kirsten, H.; Saha, A.; Kreuzhuber, R.; Kasela, S.; et al. Unraveling the polygenic architecture of complex traits using blood eQTL metaanalysis. bioRxiv 2018, 447367. [Google Scholar] [CrossRef] [Green Version]
  58. Ramsingh, G.; Koboldt, D.C.; Trissal, M.; Chiappinelli, K.B.; Wylie, T.; Koul, S.; Chang, L.-W.; Nagarajan, R.; Fehniger, T.A.; Goodfellow, P.; et al. Complete characterization of the microRNAome in a patient with acute myeloid leukemia. Blood 2010, 116, 5316–5326. [Google Scholar] [CrossRef] [Green Version]
  59. Rusiniak, M.E.; Yu, M.; Ross, D.T.; Tolhurst, E.C.; Slack, J.L. Identification of B94 (TNFAIP2) as a potential retinoic acid target gene in acute promyelocytic leukemia. Cancer Res. 2000, 60, 1824–1829. [Google Scholar]
  60. Zhao, D.; Deng, S.-C.; Ma, Y.; Hao, Y.-H.; Jia, Z.-H. miR-221 alleviates the inflammatory response and cell apoptosis of neuronal cell through targeting TNFAIP2 in spinal cord ischemia–reperfusion. NeuroReport 2018, 29, 655–660. [Google Scholar] [CrossRef]
  61. Sarma, V.; Wolf, F.W.; Marks, R.M.; Shows, T.B.; Dixit, V.M. Cloning of a novel tumor necrosis factor-alpha-inducible primary response gene that is differentially expressed in development and capillary tube-like formation in vitro. J. Immunol. 1992, 148, 3302–3312. [Google Scholar] [PubMed]
  62. Qu, X.; Li, Q.; Zhang, X.; Wang, Z.; Wang, S.; Zhou, Z. Amentoflavone protects the hematopoietic system of mice against γ-irradiation. Arch. Pharmacal Res. 2019, 42, 1021–1029. [Google Scholar] [CrossRef] [PubMed]
  63. Wolf, F.; Sarma, V.; Seldin, M.; Drake, S.; Suchard, S.; Shao, H.; O’Shea, K.; Dixit, V. B94, a primary response gene inducible by tumor necrosis factor-alpha, is expressed in developing hematopoietic tissues and the sperm acrosome. J. Biol. Chem. 1994, 269, 3633–3640. [Google Scholar] [CrossRef]
  64. Cheng, Z.; Wang, H.Z.; Li, X.; Wu, Z.; Han, Y.; Li, Y.; Chen, G.; Xie, X.; Huang, Y.; Du, Z.; et al. MicroRNA-184 inhibits cell proliferation and invasion, and specifically targets TNFAIP2 in Glioma. J. Exp. Clin. Cancer Res. 2015, 34, 27. [Google Scholar] [CrossRef] [Green Version]
  65. Liu, Z.; Wei, S.; Ma, H.; Zhao, M.; Myers, J.N.; Weber, R.S.; Sturgis, E.M.; Wei, Q. A functional variant at the miR-184 binding site in TNFAIP2 and risk of squamous cell carcinoma of the head and neck. Carcinogenesis 2011, 32, 1668–1674. [Google Scholar] [CrossRef]
Figure 1. Study design for blood cell trait focused TWAS analyses in African ancestry (AA) and Hispanic/Latino (HL) populations. TWAS: Transcriptome-wide association study; DGN: Depression Genes and Networks, n = 922; MESA: Multi-Ethnic Study of Atherosclerosis, n = 229 for AA and n = 381 for HL; ARIC: Atherosclerosis Risk in Communities, n = 2874; BioMe: BioMeTM Biobank, n = 3550 for AA and n = 4730 for HL; CARDIA: Coronary Artery Risk Development in Young Adults, n = 953; GERA: Genetic Epidemiology Research on Adult Health and Aging, n = 3699 for AA and n = 7348 for HL; UKB: UK Biobank, n = 8262; WHI: Women’s Health Initiative, n = 8617 for AA and n = 4359 for HL; HCHS/SOL: Hispanic Community Health Study/Study of Latinos, n = 11,887.
Genes 12 01049 g001
Figure 2. Venn diagram showing the overlap of well-predicted genes by Depression Genes and Networks (DGN) European ancestry and Multi-Ethnic Study of Atherosclerosis (MESA) African ancestry (AA) and Hispanic/Latino (HL) reference panels.
Genes 12 01049 g002
Figure 3. The smooth scatter plots show the model R2 distribution of common genes available in both the Depression Genes and Networks (DGN) European and Multi-Ethnic Study of Atherosclerosis (MESA) reference eQTL datasets. The dashed line denotes the threshold value (model R2 = 0.05) for well-predicted genes. (a) Comparison of model R2 of common genes found in both Depression Genes and Networks (DGN) and Multi-Ethnic Study of Atherosclerosis (MESA) African ancestry (AA) reference panels; (b) Comparison of model R2 of common genes between the Depression Genes and Networks (DGN) and Multi-Ethnic Study of Atherosclerosis (MESA) Hispanic/Latino (HL) reference panels; (c) Comparison of model R2 of common genes between the Multi-Ethnic Study of Atherosclerosis (MESA) African ancestry (AA) and Multi-Ethnic Study of Atherosclerosis (MESA) Hispanic/Latino (HL) reference panels; (d) Histograms showing the model R2 distribution of all genes in each reference panel (without model R2 filtering). The blue solid line denotes the median of model R2; the blue dashed line denotes the mean of model R2. All genes, including those which do not meet a model R2 = 0.05 cut-off, are displayed.
Genes 12 01049 g003
Figure 4. Smooth scatter plots comparing true gene expression from Genetic Epidemiology Network of Arteriopathy (GENOA) lymphoblastoid (LCL) data to predicted gene expression using Depression Genes and Networks (DGN) and Multi-Ethnic Study of Atherosclerosis (MESA) African ancestry (AA) reference eQTL datasets. (a) True R2 distribution using the Depression Genes and Networks (DGN) and Multi-Ethnic Study of Atherosclerosis (MESA) eQTL reference panel for all genes (# genes = 4043); (b) true R2 distribution for genes with model R2 > 0.05 in each reference eQTL dataset (# genes = 3426); (cf). Prediction performance of four examples of well-predicted genes. The scatter plots show the observed expression in GENOA versus predicted expression using prediction models build using MESA AA (c,d) and DGN (e,f). The observed expression in GENOA is from array data in LCLs. The red line is the diagonal line with slope = 1 and the blue line is the fitting line between the observed expression and predicted expression; (g) Venn diagram of well-predicted genes (true R2 > 0.05) by DGN and MESA AA reference panels in GENOA.
Genes 12 01049 g004
Figure 5. Mirror plot for the TWAS and GWAS results for platelets (PLT) in Multi-Ethnic Study of Atherosclerosis (MESA) Hispanic/Latino (HL). The upper panel shows TWAS marginal results and Table 1. 10 4 for TWAS and 5 × 10 8 for GWAS.
Genes 12 01049 g005
Figure 6. TNFAIP2 locus. (a) Mirror plots showing the conditional analysis for TNFAIP2, predicted using the Multi-Ethnic Study of Atherosclerosis (MESA) Hispanic/Latino (HL) reference panel, for platelet association meta-analysis in Hispanic/Latino cohorts. The red dots in the bottom panel denote the nearby GWAS signals conditioned on. TNFAIP2 is still significant when conditioned on nearby GWAS signals (as listed in Supplementary Table S5); (b) Gene expression for TNFAIP2 and the other three GWAS annotated genes in this locus from platelet-producing megakaryocytes (MK) from BLUEPRINT [43].
Genes 12 01049 g006
Figure 7. ENG locus. (a) The marginal and conditional results for ENG for hematocrit (HCT) and (b) hemoglobin (HGB) predicted using the Multi-Ethnic Study of Atherosclerosis (MESA) reference panel in African ancestry (AA) meta-analysis. The green dot denotes the gene ENG, the red dots denote other genes within this locus region.
Genes 12 01049 g007
Figure 8. Fine-mapping of the THBS3 and MFN2 locus. Blue dots denote genes in the causal gene set configuration; red dots denote the genes outside of the causal gene set configuration. Dot size is proportional to the marginal posterior inclusion probability of each gene in the 95% credible set within the locus. The red dashed line denotes the TWAS significance threshold value. (a,c) THBS3 locus for hematocrit using Depression Genes and Networks (DGN) reference panel in African ancestry (AA) and the posterior inclusion probability of each gene in the 95% credible set within this locus; (b,d) MFN2 locus for platelet count using Depression Genes and Networks (DGN) reference panel in African ancestry (AA) and the posterior inclusion probability of each gene in the 95% credible set within this locus.
Genes 12 01049 g008
Table 1. The table shows the marginally significant results discovered by MESA HL for all four phenotypes. “NA” denotes there is no known variants +/− 1 MB around the gene.
GeneChrStart_hg38End_hg38PhenotypeMeta_betaMeta_seDirectionMarginal p-ValueConditional p-ValueModel R2Cross-Validation R2TWAS Reference PanelDiscovery Population
ADAM151155050566155062775HCT−0.0780.018(−−−−+)8.74 × 10 6 2.52 × 10 1 0.3010.395MESAHL
THBS31155195588155209051HCT0.2120.039(+++++)5.40 × 10 8 9.22 × 10 1 0.10.060MESAHL
GTF2IRD2B77509257375149817HCT−0.2490.056(−−−−−)9.18 × 10 6 NA0.1380.004MESAHL
AGAP6104998219050010499HCT−0.2310.059(−−−−−)8.44 × 10 5 NA0.1190.017MESAHL
SMAD6156670222866782849HCT−0.3560.081(−−−−+)1.14 × 10 5 8.55 × 10 6 0.0740.005MESAHL
ADAM151155050566155062775HGB−0.0660.018(−−−−+)3.95 × 10 5 1.51 × 10 1 0.3010.395MESAHL
THBS31155195588155209051HGB0.1590.039(++++-)2.88 × 10 5 7.71 × 10 1 0.10.060MESAHL
ARHGAP19109722217397292673HGB−0.2150.056(−−−−+)7.15 × 10 5 NA0.10.011MESAHL
CCDC1511124954121125041489HGB0.0590.016(++++−)5.84 × 10 5 NA0.3420.235MESAHL
SMAD615667022286678284HGB−0.3440.080(−−−−+)9.0 × 10 6 4.77 × 10 5 0.0740.005MESAHL
IL6R1154405193154469450PLT−0.2320.058(−−−−+)6.06 × 10 5 7.63 × 10 1 0.0650.014MESAHL
BAK163357254733580293PLT−0.1180.029(−−−+−)4.95 × 10 5 2.42 × 10 1 0.1670.088MESAHL
PAQR865236142152407777PLT0.0800.019(+++++)4.79 × 10 5 1.27 × 10 3 0.2680.165MESAHL
TNFAIP214103123442103137439PLT−0.2650.065(−−−−−)6.85 × 10 5 8.10 × 10 3 0.0950.013MESAHL
SLC22A45132294394132344190WBC0.1170.027(+++++)1.73 × 10 5 1.53 × 10 1 0.1720.126MESAHL
BAK163357254733580293WBC−0.1100.028(−−−−+)9.47 × 10 5 1.46 × 10 4 0.1670.088MESAHL
GRINA8143990056143993415WBC−0.2980.077(−−+−−)9.70 × 10 5 NA0.0660.004MESAHL
ATXN212111443485111599676WBC−0.3380.071(−−+−+)1.56 × 10 6 2.12 × 10 3 0.0790.003MESAHL
Publisher’s Note: MDPI stays neutral with regard to jurisdictional claims in published maps and institutional affiliations.

