
Identification of Distant Regulatory Elements Using Expression Quantitative Trait Loci Mapping for Heat-Responsive Genes in Oysters

 ,
,
Abstract
:1. Introduction
2. Materials and Methods
2.1. Origin and Background of Oysters
2.2. Heat Stress Simulation
2.3. DNA and RNA Extraction
2.4. Genotyping-by-Sequencing
2.5. Detection of Thermal Responsive Gene Expressions
2.6. eQTL Analysis
2.7. Verification of eQTLs for an Independent Family
2.7.1. Genotyping by SNaPshot
2.7.2. Statistical Analysis
3. Results
3.1. Gene Expression Analysis
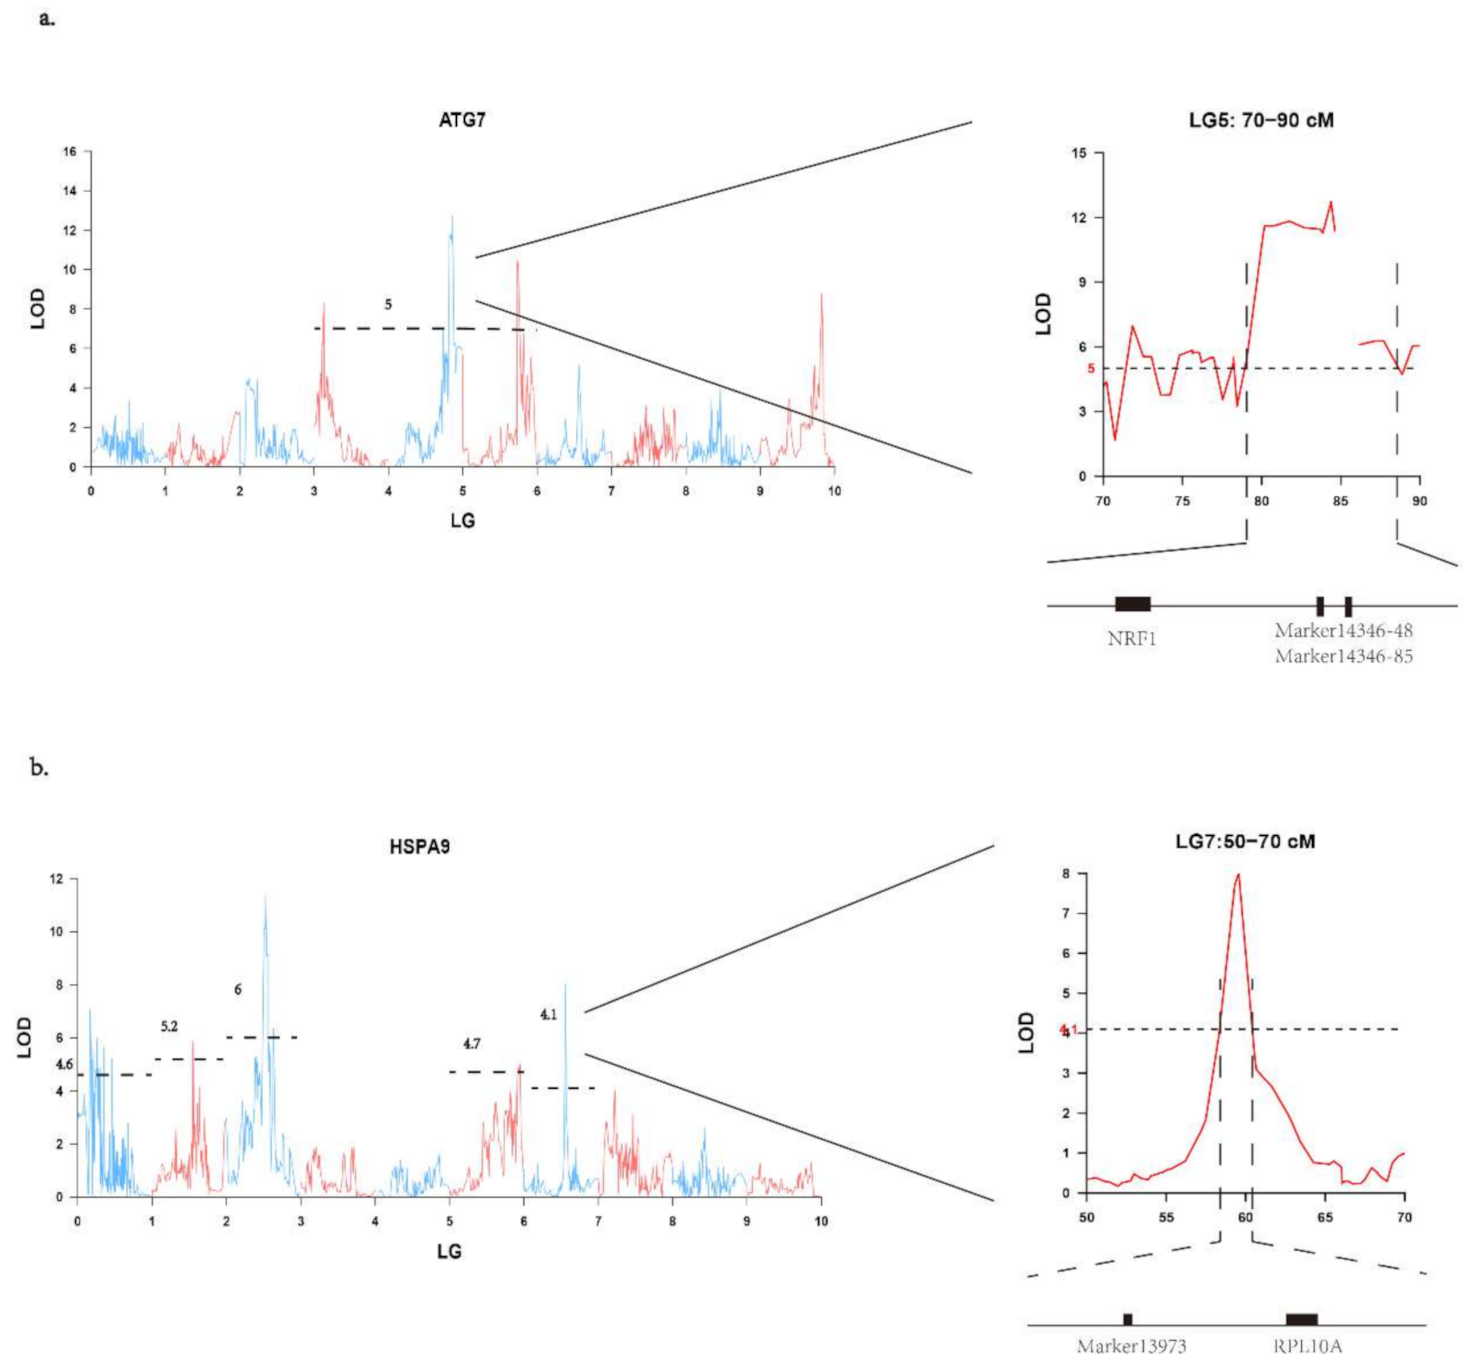
3.2. eQTL Mapping and Distant eQTLs for Candidate Gene Expression
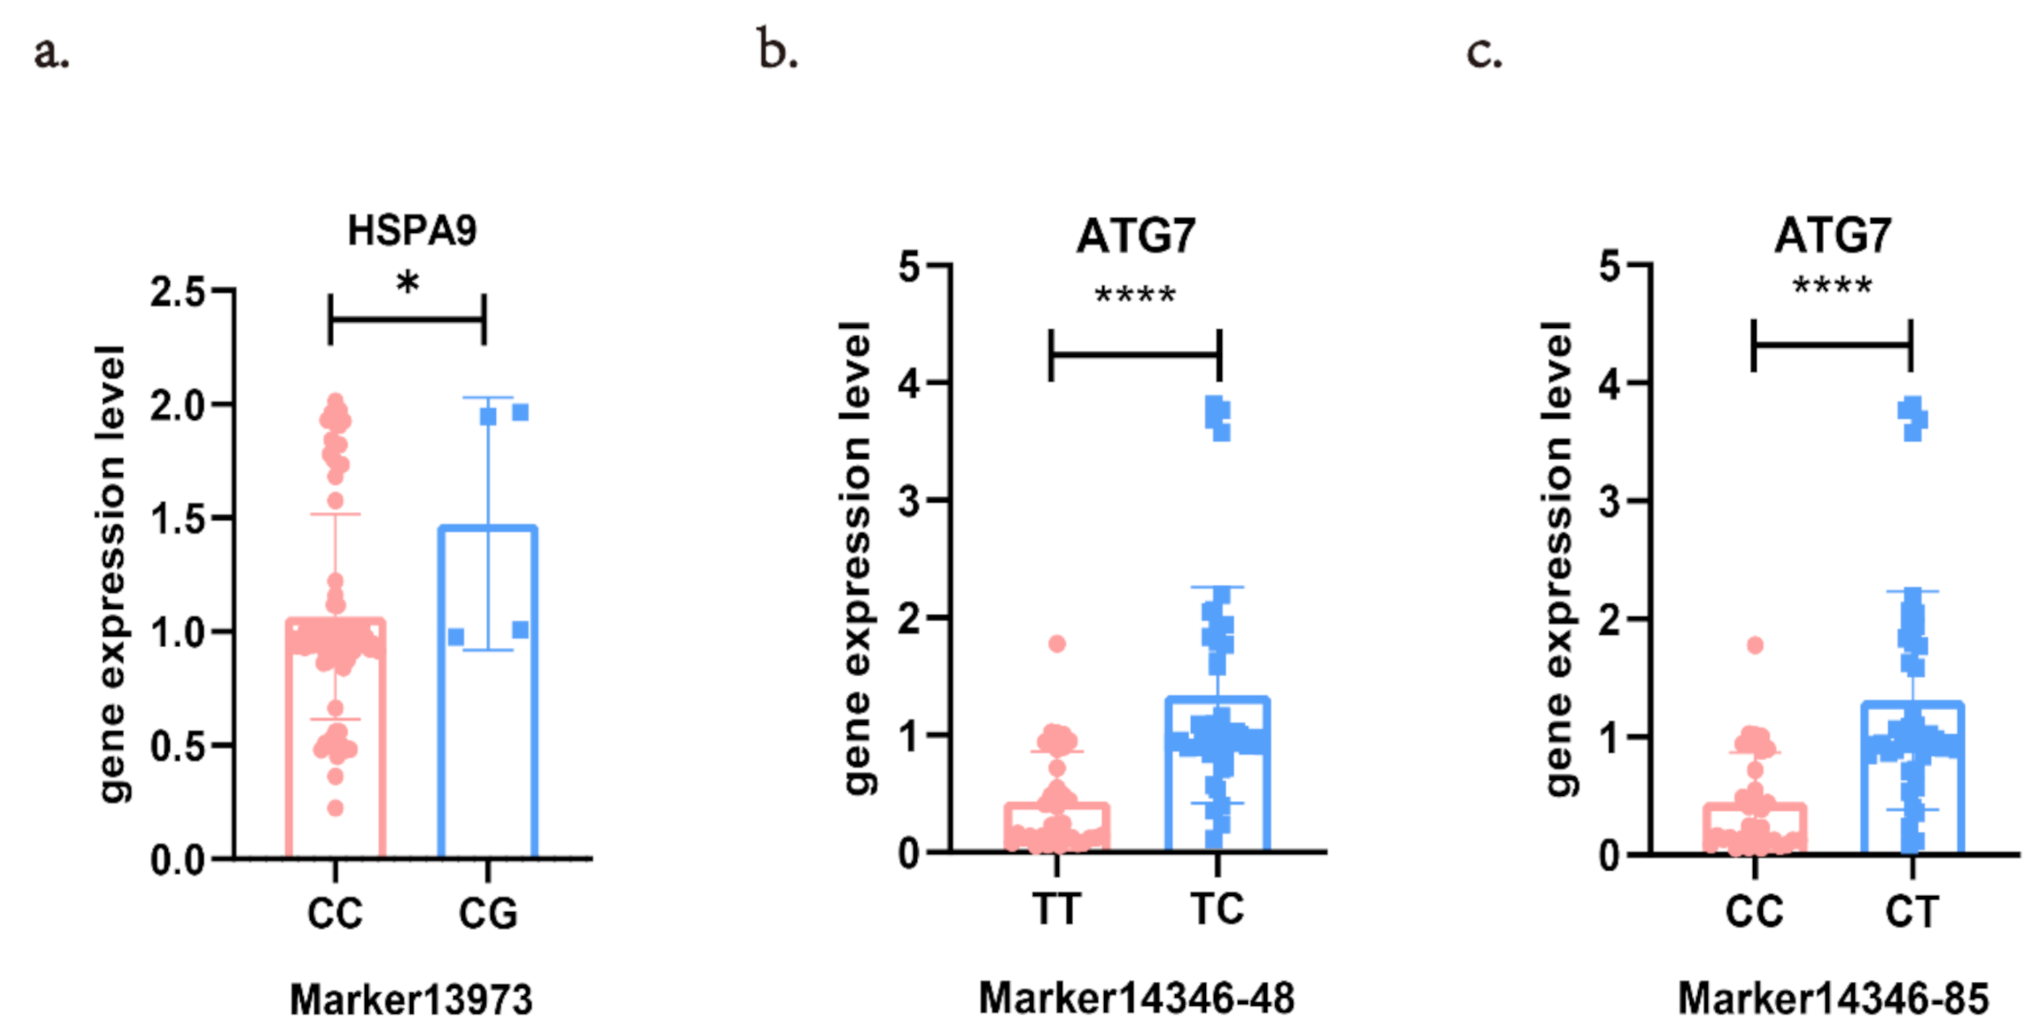
3.3. Verification of Distant eQTLs in Different Families
4. Discussion
Supplementary Materials
Author Contributions
Funding
Institutional Review Board Statement
Informed Consent Statement
Data Availability Statement
Acknowledgments
Conflicts of Interest
References
- Cheng, L.; Abraham, J.; Hausfather, Z.; Trenberth, K.E. How fast are the oceans warming? Science 2019, 363, 128–129. [Google Scholar] [CrossRef]
- Schulte, P.M. The effects of temperature on aerobic metabolism: Towards a mechanistic understanding of the responses of ectotherms to a changing environment. J. Exp. Biol. 2015, 218, 1856–1866. [Google Scholar] [CrossRef] [Green Version]
- Tang, H.Y.; Smith-Caldas, M.S.; Driscoll, M.V.; Salhadar, S.; Shingleton, A.W. FOXO regulates organ-specific pheno-typic plasticity in Drosophila. PLoS Genet. 2011, 7, e1002373. [Google Scholar] [CrossRef] [Green Version]
- Chevin, L.-M.; Lande, R.; Mace, G. Adaptation, Plasticity, and Extinction in a Changing Environment: Towards a Predictive Theory. PLoS Biol. 2010, 8, e1000357. [Google Scholar] [CrossRef] [Green Version]
- Gienapp, P.; Teplitsky, C.; Alho, J.S.; Mills, J.A.; Merilä, J. Climate change and evolution: Disentangling environmental and genetic responses. Mol. Ecol. 2008, 17, 167–178. [Google Scholar] [CrossRef] [PubMed]
- Kelly, M. Adaptation to climate change through genetic accommodation and assimilation of plastic phenotypes. Philos. Trans. R. Soc. B Biol. Sci. 2019, 374, 20180176. [Google Scholar] [CrossRef] [Green Version]
- Whitman, D.; Ananthakrishnan, T. What is Phenotypic Plasticity and Why is it Important? Phenotypic Plast. Insects Mech. Conseq. 2009, 1–63. [Google Scholar] [CrossRef]
- Ghaffari, H.; Wang, W.; Li, A.; Zhang, G.; Li, L. Thermotolerance Divergence Revealed by the Physiological and Mo-lecular Responses in Two Oyster Subspecies of Crassostrea gigas in China. Front. Physiol. 2019, 10, 1137. [Google Scholar] [CrossRef]
- Li, A.; Li, L.; Song, K.; Wang, W.; Zhang, G. Temperature, energy metabolism, and adaptive divergence in two oyster subspecies. Ecol. Evol. 2017, 7, 6151–6162. [Google Scholar] [CrossRef]
- Li, A.; Li, L.; Wang, W.; Zhang, G. Evolutionary trade-offs between baseline and plastic gene expression in two con-generic oyster species. Biol. Lett. 2019, 15, 20190202. [Google Scholar] [CrossRef] [Green Version]
- Albert, F.; Kruglyak, L. The role of regulatory variation in complex traits and disease. Nat. Rev. Genet. 2015, 16, 197–212. [Google Scholar] [CrossRef]
- Claussnitzer, M.; Dankel, S.N.; Kim, K.-H.; Quon, G.; Meuleman, W.; Haugen, C.; Glunk, V.; Sousa, I.S.; Beaudry, J.L.; Puviindran, V.; et al. FTO Obesity Variant Circuitry and Adipocyte Browning in Humans. N. Engl. J. Med. 2015, 373, 895–907. [Google Scholar] [CrossRef] [Green Version]
- Cubillos, A.F.; Coustham, V.; Loudet, O. Lessons from eQTL mapping studies: Non-coding regions and their role behind natural phenotypic variation in plants. Curr. Opin. Plant Biol. 2012, 15, 192–198. [Google Scholar] [CrossRef]
- Musunuru, K.; Strong, A.; Frank-Kamenetsky, M.; Lee, N.E.; Ahfeldt, T.; Sachs, K.V.; Li, X.; Li, H.; Kuperwasser, N.; Ruda, V.M.; et al. From noncoding variant to phenotype via SORT1 at the 1p13 cholesterol locus. Nature 2010, 466, 714–719. [Google Scholar] [CrossRef] [PubMed]
- Sokolova, I.M.; Frederich, M.; Bagwe, R.; Lannig, G.; Sukhotin, A. Energy homeostasis as an integrative tool for assessing limits of environmental stress tolerance in aquatic invertebrates. Mar. Environ. Res. 2012, 79, 1–15. [Google Scholar] [CrossRef] [PubMed]
- Chen, Y.; Liu, E.; Li, C.; Pan, C.; Zhao, X.; Wang, Y.; Ling, Q. Effects of heat stress on histopathology, antioxidant enzymes, and transcriptomic profiles in gills of pikeperch Sander lucioperca. Aquaculture 2021, 534, 736277. [Google Scholar] [CrossRef]
- Li, P.; Liu, Q.; Li, J.; Wang, F.; Wen, S.; Li, N. Transcriptomic responses to heat stress in gill and liver of endangered Brachymystax lenok tsinlingensis. Comp. Biochem. Physiol. Part D Genom. Proteom. 2021, 38, 100791. [Google Scholar] [CrossRef]
- Cottin, D.; Shillito, B.; Chertemps, T.; Tanguy, A.; Léger, N.; Ravaux, J. Identification of differentially expressed genes in the hydrothermal vent shrimp Rimicaris exoculata exposed to heat stress. Mar. Genom. 2010, 3, 71–78. [Google Scholar] [CrossRef]
- Rahi, M.L.; Mahmud, S.; Dilruba, K.J.; Sabbir, W.; Aziz, D.; Hurwood, D.A. Temperature induced changes in physio-logical traits and expression of selected candidate genes in black tiger shrimp (Penaeus monodon) larvae. Aquac. Rep. 2021, 19. [Google Scholar] [CrossRef]
- Hamdoun, A.; Cheney, D.P.; Cherr, G.N. Phenotypic Plasticity of HSP70 and HSP70 Gene Expression in the Pacific Oyster (Crassostrea gigas): Implications for Thermal Limits and Induction of Thermal Tolerance. Biol. Bull. 2003, 205, 160–169. [Google Scholar] [CrossRef] [PubMed] [Green Version]
- Jones, H.R.; Johnson, K.; Kelly, M.W. Synergistic Effects of Temperature and Salinity on the Gene Expression and Physiology of Crassostrea virginica. Integr. Comp. Biol. 2019, 59, 306–319. [Google Scholar] [CrossRef]
- Li, S.; Liu, C.; Huang, J.; Liu, Y.; Zhang, S.; Zheng, G.; Xie, L.; Zhang, R. Transcriptome and biomineralization responses of the pearl oyster Pinctada fucata to elevated CO2 and temperature. Sci. Rep. 2016, 6, 18943. [Google Scholar] [CrossRef] [Green Version]
- Liu, W.; Huang, X.; Lin, J.; He, M. Seawater Acidification and Elevated Temperature Affect Gene Expression Patterns of the Pearl Oyster Pinctada fucata. PLoS ONE 2012, 7, e33679. [Google Scholar] [CrossRef] [Green Version]
- Li, L.; Li, A.; Song, K.; Meng, J.; Guo, X.; Li, S.; Li, C.; De Wit, P.; Que, H.; Wu, F.; et al. Divergence and plasticity shape adaptive potential of the Pacific oyster. Nat. Ecol. Evol. 2018, 2, 1751–1760. [Google Scholar] [CrossRef]
- Zhang, G.; Fang, X.; Guo, X.; Li, L.; Luo, R.; Xu, F.; Yang, P.; Zhang, L.; Wang, X.; Qi, H.; et al. The oyster genome reveals stress adaptation and complexity of shell formation. Nat. Cell Biol. 2012, 490, 49–54. [Google Scholar] [CrossRef] [Green Version]
- Kita, R.; Venkataram, S.; Zhou, Y.; Fraser, H.B. High-resolution mapping of cis-regulatory variation in budding yeast. Proc. Natl. Acad. Sci. USA 2017, 114, E10736–E10744. [Google Scholar] [CrossRef] [PubMed] [Green Version]
- Druka, A.; Potokina, E.; Luo, Z.; Jiang, N.; Chen, X.; Kearsey, M.; Waugh, R. Expression quantitative trait loci analysis in plants. Plant Biotechnol. J. 2010, 8, 10–27. [Google Scholar] [CrossRef] [Green Version]
- Rockman, M.V.; Kruglyak, L. Genetics of global gene expression. Nat. Rev. Genet. 2006, 7, 862–872. [Google Scholar] [CrossRef] [PubMed]
- Holloway, B.; Luck, S.; Beatty, M.; Rafalski, J.-A.; Li, B. Genome-wide expression quantitative trait loci (eQTL) analysis in maize. BMC Genom. 2011, 12, 336. [Google Scholar] [CrossRef] [PubMed] [Green Version]
- Benton, M.C.; Lea, R.A.; Macartney-Coxson, D.; Carless, M.A.; Göring, H.H.; Bellis, C.; Hanna, M.; Eccles, D.; Chambers, G.K.; Curran, J.E.; et al. Mapping eQTLs in the Norfolk Island Genetic Isolate Identifies Candidate Genes for CVD Risk Traits. Am. J. Hum. Genet. 2013, 93, 1087–1099. [Google Scholar] [CrossRef] [Green Version]
- Cesar, A.S.M.; Regitano, L.C.A.; Reecy, J.M.; Poleti, M.D.; Oliveira, P.S.N.; de Oliveira, G.B.; Moreira, G.C.M.; Mudadu, M.A.; Tizioto, P.C.; Koltes, J.E.; et al. Identification of putative regulatory regions and transcription factors associated with in-tramuscular fat content traits. BMC Genom. 2018, 19, 499. [Google Scholar] [CrossRef] [Green Version]
- Orozco, L.D.; Chen, H.-H.; Cox, C.; Katschke, K.J.; Arceo, R.; Espiritu, C.; Caplazi, P.; Nghiem, S.S.; Chen, Y.-J.; Modrusan, Z.; et al. Integration of eQTL and a Single-Cell Atlas in the Human Eye Identifies Causal Genes for Age-Related Macular Degeneration. Cell Rep. 2020, 30, 1246–1259.e6. [Google Scholar] [CrossRef] [Green Version]
- Ramasamy, A.; UK Brain Expression Consortium; Trabzuni, D.; Guelfi, S.; Varghese, V.; Smith, C.; Walker, R.; De, T.; Coin, L.; De Silva, R.; et al. Genetic variability in the regulation of gene expression in ten regions of the human brain. Nat. Neurosci. 2014, 17, 1418–1428. [Google Scholar] [CrossRef] [Green Version]
- Steige, K.A.; Reimegard, J.; Koenig, D.; Scofield, D.G.; Slotte, T. Cis-Regulatory Changes Associated with a Recent Mating System Shift and Floral Adaptation in Capsella. Mol. Biol. Evol. 2015, 32, 2501–2514. [Google Scholar] [CrossRef] [Green Version]
- Ting, N.C.; Jansen, J.; Nagappan, J.; Ishak, Z.; Chin, C.W.; Tan, S.G.; Cheah, S.C.; Singh, R. Identification of QTLs associated with callogenesis and embryogenesis in oil palm using genetic linkage maps improved with SSR markers. PLoS ONE 2013, 8, e53076. [Google Scholar] [CrossRef] [Green Version]
- Pritchard, V.L.; Viitaniemi, H.M.; McCairns, R.J.S.; Merilä, J.; Nikinmaa, M.; Primmer, C.R.; Leder, E.H. Regulatory Architecture of Gene Expression Variation in the Threespine Stickleback Gasterosteus aculeatus. Genes Genomes Genet. 2017, 7, 165–178. [Google Scholar] [CrossRef] [Green Version]
- Bouchet, V.M.; Debenay, J.-P.; Sauriau, P.-G.; Radford-Knoery, J.; Soletchnik, P. Effects of short-term environmental disturbances on living benthic foraminifera during the Pacific oyster summer mortality in the Marennes-Oléron Bay (France). Mar. Environ. Res. 2007, 64, 358–383. [Google Scholar] [CrossRef] [PubMed] [Green Version]
- Cotter, E.; Malham, S.K.; O’Keeffe, S.; Lynch, S.A.; Latchford, J.W.; King, J.W.; Beaumont, A.R.; Culloty, S.C. Summer mortality of the Pacific oyster, Crassostrea gigas, in the Irish Sea: The influence of growth, biochemistry and gametogenesis. Aquaculture 2010, 303, 8–21. [Google Scholar] [CrossRef]
- Wendling, C.C.; Wegner, K.M. Relative contribution of reproductive investment, thermal stress and Vibrio infection to summer mortality phenomena in Pacific oysters. Aquaculture 2013, 412–413, 88–96. [Google Scholar] [CrossRef]
- Samain, J.; Dégremont, L.; Soletchnik, P.; Haure, J.; Bédier, E.; Ropert, M.; Moal, J.; Huvet, A.; Bacca, H.; Van Wormhoudt, A.; et al. Genetically based resistance to summer mortality in the Pacific oyster (Crassostrea gigas) and its relationship with physiological, immunological characteristics and infection processes. Aquaculture 2007, 268, 227–243. [Google Scholar] [CrossRef] [Green Version]
- Ren, J.; Liu, X.; Jiang, F.; Guo, X.; Liu, B. Unusual conservation of mitochondrial gene order in Crassostrea oysters: Evidence for recent speciation in Asia. BMC Evol. Biol. 2010, 10, 394. [Google Scholar] [CrossRef] [Green Version]
- Wang, J.; Li, L.; Zhang, G. A High-Density SNP Genetic Linkage Map and QTL Analysis of Growth-Related Traits in a Hybrid Family of Oysters (Crassostrea gigas × Crassostrea angulata) Using Genotyping-by-Sequencing. G3 2016, 6, 1417–1426. [Google Scholar] [CrossRef] [Green Version]
- Livak, K.J.; Schmittgen, T.D. Analysis of relative gene expression data using real-time quantitative PCR and the 2(-Delta Delta C(T)) Method. Methods 2001, 25, 402–408. [Google Scholar] [CrossRef] [PubMed]
- Van Oojien, J.W. Software for the Mapping of Quantitative Trait Loci in Experimental Populations of Diploid Species. Biology 2009, 18–24. [Google Scholar]
- Young, M.D.; Wakefield, M.J.; Smyth, G.K.; Oshlack, A. Gene ontology analysis for RNA-seq: Accounting for selection bias. Genome Biol. 2010, 11, R14. [Google Scholar] [CrossRef] [Green Version]
- Kanehisa, M.; Araki, M.; Goto, S.; Hattori, M.; Hirakawa, M.; Itoh, M.; Katayama, T.; Kawashima, S.; Okuda, S.; Tokimatsu, T.; et al. KEGG for linking genomes to life and the environment. Nucleic Acids Res. 2007, 36, D480–D484. [Google Scholar] [CrossRef] [PubMed]
- Li, Z.; Zhang, Z.; He, Z.; Tang, W.; Li, T.; Zeng, Z.; He, L.; Shi, Y. A partition-ligation-combination-subdivision EM algorithm for haplotype inference with multiallelic markers: Update of the SHEsis (http://analysis.bio-x.cn). Cell Res. 2009, 19, 519–523. [Google Scholar] [CrossRef]
- Shen, J.; Li, Z.; Chen, J.; Song, Z.; Zhou, Z.; Shi, Y. SHEsisPlus, a toolset for genetic studies on polyploid species. Sci. Rep. 2016, 6, 24095. [Google Scholar] [CrossRef]
- Yong, Y.; He, L. SHEsis, a powerful software platform for analyses of linkage disequilibrium, haplotype construction, and genetic association at polymorphism loci. Cell Res. 2005, 15, 97–98. [Google Scholar] [CrossRef] [Green Version]
- Sołtys-Kalina, D.; Szajko, K.; Stefańczyk, E.; Smyda-Dajmund, P.; Śliwka, J.; Marczewski, W. eQTL mapping of the 12S globulin cruciferin gene PGCRURSE5 as a novel candidate associated with starch content in potato tubers. Sci. Rep. 2020, 10, 17168. [Google Scholar] [CrossRef]
- Criado-Mesas, L.; Ballester, M.; Crespo-Piazuelo, D.; Castelló, A.; Fernández, A.I.; Folch, J.M. Identification of eQTLs associated with lipid metabolism in Longissimus dorsi muscle of pigs with different genetic backgrounds. Sci. Rep. 2020, 10, 9845. [Google Scholar] [CrossRef]
- DeCook, R.; Lall, S.; Nettleton, D.; Howell, S.H. Genetic Regulation of Gene Expression During Shoot Development in Arabidopsis. Genet. 2006, 172, 1155–1164. [Google Scholar] [CrossRef] [Green Version]
- Liu, H.; Luo, X.; Niu, L.; Xiao, Y.; Chen, L.; Liu, J.; Wang, X.; Jin, M.; Li, W.; Zhang, Q.; et al. Distant eQTLs and Non-coding Sequences Play Critical Roles in Regulating Gene Expression and Quantitative Trait Variation in Maize. Mol. Plant 2017, 10, 414–426. [Google Scholar] [CrossRef] [PubMed] [Green Version]
- Grishkevich, V.; Yanai, I. The genomic determinants of genotype x environment interactions in gene expression. Trends Genet. 2013, 29, 479–487. [Google Scholar] [CrossRef] [PubMed]
- Landry, C.R.; Wittkopp, P.J.; Taubes, C.H.; Ranz, J.M.; Clark, A.; Hartl, D.L. Compensatory cis-trans Evolution and the Dysregulation of Gene Expression in Interspecific Hybrids of Drosophila. Genetics 2005, 171, 1813–1822. [Google Scholar] [CrossRef] [PubMed] [Green Version]
- Schaefke, B.; Emerson, J.; Wang, T.-Y.; Lu, M.-Y.J.; Hsieh, L.-C.; Li, W.-H. Inheritance of Gene Expression Level and Selective Constraints on Trans- and Cis-Regulatory Changes in Yeast. Mol. Biol. Evol. 2013, 30, 2121–2133. [Google Scholar] [CrossRef] [PubMed] [Green Version]
- Guerrero, R.F.; Posto, A.L.; Moyle, L.C.; Hahn, M.W. Genome-wide patterns of regulatory divergence revealed by introgression lines. Evolution 2016, 70, 696–706. [Google Scholar] [CrossRef]
- Meiklejohn, C.D.; Coolon, J.D.; Hartl, D.L.; Wittkopp, P.J. The roles of cis- and trans-regulation in the evolution of regulatory incompatibilities and sexually dimorphic gene expression. Genome Res. 2013, 24, 84–95. [Google Scholar] [CrossRef] [Green Version]
- Shi, X.; Ng, D.W.-K.; Zhang, C.; Comai, L.; Ye, W.; Chen, Z.J. Cis- and trans-regulatory divergence between progenitor species determines gene-expression novelty in Arabidopsis allopolyploids. Nat. Commun. 2012, 3, 950. [Google Scholar] [CrossRef]
- Xiong, J. Atg7 in development and disease: Panacea or Pandora’s Box? Protein Cell 2015, 6, 722–734. [Google Scholar] [CrossRef] [Green Version]
- Phillips, J.J.; Gong, H.; Chen, K.; Joseph, N.M.; Van Ziffle, J.; Jin, L.-W.; Bastian, B.; Bollen, A.W.; Perry, A.; Nicolaides, T.; et al. Activating NRF1-BRAF and ATG7-RAF1 fusions in anaplastic pleomorphic xanthoastrocytoma without BRAF p.V600E mutation. Acta Neuropathol. 2016, 132, 757–760. [Google Scholar] [CrossRef]
- Li, S.; Hua, W.; Wang, K.; Gao, Y.; Chen, S.; Liu, W.; Song, Y.; Wu, X.; Tu, J.; Kang, L.; et al. Autophagy attenuates compression-induced apoptosis of human nucleus pulposus cells via MEK/ERK/NRF1/Atg7 signaling pathways during in-tervertebral disc degeneration. Exp. Cell Res. 2018, 370, 87–97. [Google Scholar] [CrossRef] [PubMed]
- Bukau, B.; Horwich, A.L. The Hsp70 and Hsp60 Chaperone Machines. Cell 1998, 92, 351–366. [Google Scholar] [CrossRef] [Green Version]
- Kampinga, H.H.; Craig, E.A. The HSP70 chaperone machinery: J proteins as drivers of functional specificity. Nat. Rev. Mol. Cell Biol. 2010, 11, 579–592. [Google Scholar] [CrossRef] [PubMed] [Green Version]
- Mayer, M.P.; Bukau, B. Hsp70 chaperones: Cellular functions and molecular mechanism. Cell. Mol. Life Sci. 2005, 62, 670–684. [Google Scholar] [CrossRef] [Green Version]
- Del Campo, E.M.; Casano, L.M.; Barreno, E. Evolutionary implications of intron–exon distribution and the properties and sequences of the RPL10A gene in eukaryotes. Mol. Phylogenet. Evol. 2013, 66, 857–867. [Google Scholar] [CrossRef]
- Wonglapsuwan, M.; Miyazaki, T.; Loongyai, W.; Chotigeat, W. Characterization and Biological Activity of the Ribosomal Protein L10a of the White Shrimp: Fenneropenaeus merguiensis De Man during Vitellogenesis. Mar. Biotechnol. 2009, 12, 230–240. [Google Scholar] [CrossRef]


| Gene Name | Gene ID | Primer Sequence (5′–3′) |
|---|---|---|
| HSPA4 | CGI_10017255 | F:ACCAAGCACAACTCTGAAT |
| R:AGGCTGAGTATCCACAATG | ||
| HSPA5-08834 | CGI_10008834 | F:CCAGAACGACAACAACAGACTCTCA |
| R:TTGGCTTCAACCTTCTCCTTCACTT | ||
| HSPA12A | CGI_10002491 | F:CCACGTCATCAGGTCGATACAGAGA |
| R:GCAATATGCTGTCTACGGCTGGTT | ||
| HSPA12B-22078 | CGI_10022078 | F:CTCTCACTGCGGACAAACTTCGT |
| R:GCTTTCCACTTCTGGGTGCTGTAA | ||
| PARP4 | CGI_10013249 | F:ATAGCCAGGGTTGGAGCAGGTT |
| R:ACGGATACCGAGGTCAGCACTG | ||
| HYOU1 | CGI_10027129 | F:CTAACGGACGAGGACCACGAGAA |
| R:ACCTCCTTCTTGGCATCCTCTTCC | ||
| HSPA13 | CGI_10027222 | F:TCCATACCAAGCCTGAGCTGAAGA |
| R:TACACGGAGTAGCGACACATCCA | ||
| HSPA12B-12492 | CGI_10012492 | F:CTGAAGATCCAGGACTTGCTGTGTT |
| R:GCCAGCTCTGAATGCCATAAGTGT | ||
| HSPA9 | CGI_10016162 | F:TCACTCCGCTGTCGTTGGGTAT |
| R:TGTCCATCAGCAGCCGTTGAGA | ||
| HSPA5-15492 | CGI_10015492 | F:ACCGTGGAGTCAACCCTGATGA |
| R:CGTCCAACAGCAGAAGGTCACC | ||
| HSP68 | CGI_10002594 | F:TCAGCCAAGGACAAGAGCACAG |
| R:TCGGCCTCGTTCACCATTCTCT | ||
| SIP1 | CGI_10004164 | F:CGCCATTACGGACGGCAAGAA |
| R:ACGGTAATGTGGTCAGGCTCGA | ||
| HSPB1 | CGI_10017582 | F:CCGAAGGAAGAGGACCAGGAGATG |
| R:CGAACACCGACAGGTCTAAACTCTC | ||
| DJB13 | CGI_10006977 | F:CACATTTCCAGAAGAAGGCGACCA |
| R:GAACCTTGGCAGTGTGGATCAGATT | ||
| DNJB4 | CGI_10009495 | F:GGAGGAGACGACCCGTTTGCTA |
| R:GTTGCCCGCCGAAATGGAACA | ||
| CLCN2 | CGI_10022926 | F:CCTGGTTACATTGGTGATTTCC |
| R:CTCAGCCTGTCCTGTCGTC | ||
| BRKS2 | CGI_10010977 | F:TGGATAGTCACGGATTAGTAGAG |
| R:GGGGTTCCTGAGTTTTCG | ||
| MTMR8 | CGI_10006555 | F:TGTTTGTTCCTGCCTCCG |
| R:CCTTTACCAGCCGCCTTA | ||
| ATG7 | CGI_10025698 | F:CACTGGACACCCCTGAAC |
| R:GCAACAAAGAAACCCTGAT | ||
| GAK | CGI_10028689 | F:CGACAAAGGACAGTGCGAGTA |
| R:CTGAATGGCTGACCAAGACC | ||
| RNF123 | CGI_10004787 | F:TCCGTCATCTCCCACTCC |
| R:TTCTTTGTCCTTTCTTCCCT |
| Gene ID | eQTL Name | Linkage Group | CI (cM) | Nearest Marker | Peak LOD | Number of Markers | PVE (%) |
|---|---|---|---|---|---|---|---|
| HSPA4 | eqtl_HSPA4_7 | 7 | 59.305-59.559 | Marker13973 | 5.73 | 1 | 11.4 |
| HSPA5-08834 | eqtl_08834_1 | 1 | 37.775-38.056 | Marker10740 | 6.85 | 3 | 11 |
| eqtl_08834_2 | 2 | 55.886-56.171 | Marker27538 | 6.8 | 3 | 12.2 | |
| eqtl_08834_3 | 3 | 70.226-70.319 | Marker7956 | 7.55 | 1 | 13.7 | |
| eqtl_08834_6 | 6 | 45.588-47.109 | Marker10629 | 4.25 | 3 | 6 | |
| eqtl_08834_10 | 10 | 55.184-63.734 | Marker8139 | 3.97 | 14 | 6.6 | |
| HSPA12A | eqtl_HSPA12A_2 | 2 | 76.025-76.531 | Marker18003 | 6.55 | 2 | 12.5 |
| eqtl_HSPA12A_6 | 6 | 85.9-86.9 | Marker25714 | 7.12 | 2 | 13.4 | |
| HSPA12B-22078 | eqtl_22078_2 | 2 | 75.66 | Marker2650 | 8.52 | 1 | 17.1 |
| eqtl_22078_6 | 6 | 86.854 | Marker25714 | 9.29 | 1 | 19 | |
| HYOU1 | eqtl_HYOU1_8 | 8 | 70.508-71.201 | Marker27468 | 7.19 | 4 | 17.2 |
| HSPA13 | eqtl_HSPA13_2 | 2 | 75.66 | Marker2650 | 6.89 | 1 | 15.2 |
| eqtl_HSPA13_6-1 | 6 | 85.852-86.854 | Marker28123 | 9.56 | 5 | 21.9 | |
| eqtl_HSPA13_6-2 | 6 | 93.738-97.367 | Marker36658 | 6.9 | 5 | 16.5 | |
| eqtl_HSPA13_6-3 | 6 | 80.218-80.894 | Marker36719 | 6.27 | 2 | 15.3 | |
| HSPA12B-12492 | eqtl_12492_4 | 4 | 67.045-68.122 | Marker1504 | 7.07 | 1 | 9.7 |
| eqtl_12492_5 | 5 | 29.69-31.306 | Marker4421 | 6.31 | 3 | 10.1 | |
| eqtl_12492_6 | 6 | 86.284-86.854 | Marker25714 | 8.24 | 3 | 13.8 | |
| HSPA9 | eqtl_HSPA9_2 | 2 | 56.171-56.918 | Marker32411 | 5.87 | 3 | 10.8 |
| eqtl_HSPA9_3 | 3 | 58.831 | Marker37157 | 11.39 | 2 | 24.9 | |
| eqtl_HSPA9_7 | 7 | 59.305-59.559 | Marker13973 | 8.02 | 1 | 16.2 | |
| HSPA5-15492 | eqtl_15492_3-1 | 3 | 55.568-62.396 | Marker37157 | 5.68 | 17 | 14.8 |
| eqtl_15492_3-2 | 3 | 70.226-70.319 | Marker7956 | 7.61 | 1 | 19.1 | |
| eqtl_15492_4 | 4 | 25.851-26.48 | Marker20355 | 4.43 | 3 | 9.6 | |
| eqtl_15492_5 | 5 | 66.47-71.853 | Marker45911 | 4.82 | 4 | 11.2 | |
| eqtl_15492_6 | 6 | 47.913-54.293 | Marker37730 | 4.11 | 5 | 8.2 | |
| SIP1 | eqtl_SIP1_3 | 3 | 68.861-68.966 | Marker34975 | 12.71 | 1 | 26.6 |
| HSPB1 | eqtl_HSPB1_1 | 1 | 13.509 | Marker30594 | 6.14 | 1 | 10.6 |
| eqtl_HSPB1_7 | 7 | 59.305-59.559 | Marker13973 | 5.1 | 1 | 8.6 | |
| DJB13 | eqtl_DJB13_4-1 | 4 | 77.435-77.904 | Marker5101 | 7.41 | 2 | 13.4 |
| eqtl_DJB13_4-2 | 4 | 81.469-81.772 | Marker30102 | 7.41 | 2 | 14.8 | |
| eqtl_DJB13_9-1 | 9 | 31.72-31.793 | Marker23397 | 7.77 | 2 | 15.6 | |
| eqtl_DJB13_9-2 | 9 | 26.511-30.02 | Marker32635 | 5.93 | 14 | 12.4 | |
| eqtl_DJB13_9-3 | 9 | 40.641-41.260 | Marker6180 | 4.7 | 5 | 10.1 | |
| eqtl_DJB13_9-4 | 9 | 22.587-23.134 | Marker13132 | 4.53 | 3 | 9.8 | |
| DNJB4 | eqtl_DNJB4_3 | 3 | 68.966 | Marker34975 | 6.55 | 1 | 12.4 |
| eqtl_DNJB4_5 | 5 | 70.735 | Marker38934 | 6.03 | 1 | 11.3 | |
| ATG7 | eqtl_ATG7_4 | 4 | 12.875-15 | Marker12663 | 8.32 | 5 | 8.9 |
| eqtl_ATG7_5 | 5 | 80.077-84.62 | Marker14346 | 12.74 | 6 | 15.3 | |
| eqtl_ATG7_6 | 6 | 74.921-76.921 | Marker26545 | 10.47 | 1 | 11.9 | |
| eqtl_ATG7_10 | 10 | 82.583-85.39 | Marker17442 | 8.78 | 2 | 9.3 | |
| BRKS2 | eqtl_BRKS2_3 | 3 | 67.861-68.966 | Marker34975 | 8.2 | 1 | 17.2 |
| eqtl_BRKS2_8 | 8 | 50.382-50.764 | Marker35461 | 7.87 | 2 | 16.4 | |
| CLCN2 | eqtl_CLCN2_8 | 8 | 101.355-101.509 | Marker20478 | 6.17 | 1 | 15.4 |
| eqtl_CLCN2_9 | 9 | 46.8-47.215 | Marker16655 | 5.84 | 3 | 14.7 | |
| GAK | eqtl_GAK_7 | 7 | 59.305-59.559 | Marker13973 | 6.37 | 1 | 12 |
| MTMR8 | eqtl_MTMR8_5 | 5 | 30.419-33.214 | Marker43580 | 6.92 | 6 | 12.7 |
| eqtl_MTMR8_9 | 9 | 45.837-48.737 | Marker30815 | 6.4 | 6 | 15.9 | |
| RNF123 | eqtl_RNF123_5-1 | 5 | 73.043 | Marker3732 | 9.01 | 1 | 19.7 |
| eqtl_RNF123_5-2 | 5 | 67.803-72.526 | Marker49357 | 6.61 | 11 | 15.2 | |
| eqtl_RNF123_9-1 | 9 | 0-3 | Marker8801 | 10.71 | 1 | 20.7 | |
| eqtl_RNF123_9-2 | 9 | 4-5.149 | Marker7204 | 8.35 | 2 | 15.2 | |
| eqtl_RNF123_9-3 | 9 | 8.219-8.229 | Marker31542 | 6.84 | 2 | 14.6 | |
| eqtl_RNF123_9-4 | 9 | 10.631-12.125 | Marker44034 | 7.15 | 6 | 15.1 | |
| eqtl_RNF123_9-5 | 9 | 13.521-13.73 | Marker8825 | 6.16 | 4 | 13.4 | |
| eqtl_RNF123_9-6 | 9 | 20.193-20.556 | Marker43279 | 5.89 | 3 | 12.8 |
Publisher’s Note: MDPI stays neutral with regard to jurisdictional claims in published maps and institutional affiliations. |
© 2021 by the authors. Licensee MDPI, Basel, Switzerland. This article is an open access article distributed under the terms and conditions of the Creative Commons Attribution (CC BY) license (https://creativecommons.org/licenses/by/4.0/).
Share and Cite
Zhang, K.; Wang, J.; Ding, F.; Shi, R.; Wang, W.; Zhang, G.; Li, L. Identification of Distant Regulatory Elements Using Expression Quantitative Trait Loci Mapping for Heat-Responsive Genes in Oysters. Genes 2021, 12, 1040. https://doi.org/10.3390/genes12071040
Zhang K, Wang J, Ding F, Shi R, Wang W, Zhang G, Li L. Identification of Distant Regulatory Elements Using Expression Quantitative Trait Loci Mapping for Heat-Responsive Genes in Oysters. Genes. 2021; 12(7):1040. https://doi.org/10.3390/genes12071040
Chicago/Turabian StyleZhang, Kexin, Jinpeng Wang, Fangfang Ding, Ruihui Shi, Wei Wang, Guofan Zhang, and Li Li. 2021. "Identification of Distant Regulatory Elements Using Expression Quantitative Trait Loci Mapping for Heat-Responsive Genes in Oysters" Genes 12, no. 7: 1040. https://doi.org/10.3390/genes12071040
APA StyleZhang, K., Wang, J., Ding, F., Shi, R., Wang, W., Zhang, G., & Li, L. (2021). Identification of Distant Regulatory Elements Using Expression Quantitative Trait Loci Mapping for Heat-Responsive Genes in Oysters. Genes, 12(7), 1040. https://doi.org/10.3390/genes12071040