Article

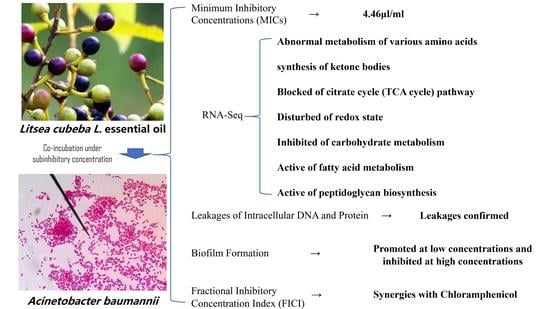
Transcriptomic Analysis of Drug-Resistance Acinetobacter baumannii under the Stress Condition Caused by Litsea cubeba L. Essential Oil via RNA Sequencing

1
College of Animal Sciences and Technology, Guangxi University, Nanning 530004, China
2
College of Bioscience and Biotechnology, Yangzhou University, Yangzhou 225012, China
*
Author to whom correspondence should be addressed.
Genes 2021, 12(7), 1003; https://doi.org/10.3390/genes12071003
Submission received: 16 April 2021 / Revised: 3 June 2021 / Accepted: 28 June 2021 / Published: 29 June 2021
(This article belongs to the Section RNA)

Abstract

:
Litsea cubeba L. essential oil (LCEO) can affect the growth of drug-resistance bacteria. However, research on stress response of drug-resistant A. baumannii under sub-lethal LCEO concentrations had been limited so far. Therefore, transcriptomic analysis of A. baumannii under 1/2 minimum inhibitory concentration (MIC, 0.54 mg/mL) of LCEO was performed. Results of transcriptomic analysis showed that 320/352 genes were significantly up/down-regulated, respectively, in LCEO-treated A. baumannii. Both up and down-regulated genes were significantly enriched in three GO terms (oxidation-reduction process; oxidoreductase activity; oxidoreductase activity, acting on the CH-CH group of donors), which indicated that the redox state of A. baumannii was significantly affected by LCEO. LCEO may also inhibit aerobic respiration, synthesis of ketone bodies and the metabolism of some amino acids while, meanwhile, promoting fatty acid degradation of A. baumannii according to Kyoto Encyclopedia of Genes and Genomes (KEGG) enrichment. The permeability and the stress of cell membrane of A. baumannii were significantly affected by LCEO. After crystal violet dyeing, the biofilm formation of A. baumannii was promoted/inhibited by extremely low/relatively high concentration of LCEO, respectively. LCEO and chloramphenicol have synergistic growth inhibitory effect against A. baumannii according to the Fractional Inhibitory Concentration Index (FICI) value = 0.375. Our results indicate that the growth of A. baumannii was inhibited by LCEO, and give insights into the stress response of A. baumannii under sub-lethal concentrations of LCEO. These results provided evidence that A. baumannii was inhibited by LCEO, and expanded knowledges of stress response of A. baumannii under sub-lethal concentration of LCEO.

Graphical Abstract

1. Introduction

LC is a Lauraceae is a Lauraceae plant and widely grown in East Asia [1]. The whole plant of Litsea cubeba L. gives off a smell that is similar to ginger [2]. According to the records of pharmacology and herbal medicine, L. cubeba has therapeutic effects on skin, lung and breast infections [3,4]. Research reports on pharmacology and chemical composition of L. cubeba essential oil (LCEO) have gradually increased in recent years. Ho’s results showed that limonene, citronellal, and citronellol were the main components of LCEO in the stem of L. cubeba. The content of citral, 1,8-cineole was higher in the parts where the content of water is higher, such as flowers, twig and leaves [2]. The fruit oil of LC can be used as a flavor enhancer for cigarettes, cosmetics and food products, as well as as a food preservative at present [1,5]. In the process of industrial production of neral and geranial, LCEO were often used as raw material [6]. The antioxidative [7,8], anticancer insecticidal [9] and antimicrobial activities [1,10] of LCEO were reported in pharmacological research fields. Studies have shown that LCEO can affect the cell membrane stability of Gram-negative and Gram-positive bacteria, which leads to the death of the cells, and can also deal with drug-resistance bacteria [7,11,12,13].
A. baumannii is a successful pathogen which often causes infections of humans and aquatic animals [14]. It usually causes bacteremia, pneumonia, meningitis, peritonitis, endocarditis, and urinary tract and skin infections [15,16].
However, few antibiotics can cure infections and prevent outbreaks caused by A. baumannii, as this pathogen has multi drug-resistant properties [17]. To address drug-resistant infections, Adukwu indicated the potential use of lemongrass (Cymbopogon flexuosus) essential oil (LEO) and citral which have the ability to inhibit and kill multi drug-resistant (MDR) A. baumannii [18]. The main component of LCEO is citral, however, the impact of LCEO on A. baumannii has not been reported yet. Therefore, the elucidation of the mechanisms by which LCEO impacts A. baumannii would be helpful for the development and clinical utilization of LCEO.
In our previous work, through transcriptomics, we found that toxin production and a variety of metabolic pathways of Staphylococcus aureus (S. aureus) were significantly affected by LCEO [19]. The objective of the present work was to detect stress reactions of MDR A. baumannii under 1/2 minimum inhibitory concentration (MIC) of LCEO using transcriptomics.

2. Materials and Methods

2.1. Chemical and Bacterial Strains

LCEO was provided by Jiangxi Hongwei Natural Perfume Oil Co. LTD (China). As shown in Table 1, the chemical compositions of LCEO in this work were listed. We mixed 14.29 wt% LCEO, 14.29 wt% tween-80 and 71.43 wt% distilled water to form a stable system which can disperse the LCEO in water. In this system, the hydrophilic-lipophilic balance value was 15.
Three strains of A. baumannii (A. baumannii 4, A. baumannii 17 and A. baumannii 20) were provided by the First Affiliated Hospital of Guangxi Medical University, China. These three strains were all harboring arm-A (β-lactam resistance genes), sul2 (sulfa resistance genes), tetB (tetracycline resistance genes). A. baumannii 17 also harbors aac6′-1b (aminoglycoside resistance genes). In addition, A. baumannii 17 has a strong virulence: when 2 × 10⁸ colony-forming units (CFU)/mL of this fresh strain was intraperitoneally injected at a dosage of 0.1 mL/10 g body weight for a mouse, the mortality rate was 100% within 12 hours (12 of 12 mice).
For each strains, 0.5 mL of bacteria was taken from the cryotube and then added to a tube with 3.5 mL tryptic soy broth (TSB) for 24 h shaking at 37 ℃, at 300 RPM. The culture medium was inoculated on tryptone soy agar (TSA) plates using an inoculation ring. After these plates were cultured for 24 h at 37 °C, a single colony was selected for inoculation to TSB culture for 6 h at 37 °C at 300 RPM shaking before subsequent trials.

2.2. Determination of Minimum Inhibitory Concentration (MIC)

Serial-dilution culture method was performed to obtain MIC values for different antibiotics (ceftriaxone sodium, amoxicillin, berberine, neomycin, levofloxacin, fosfomycin, colistin, mequindox, clinfloxacin, sulfamonomethoxine, gatifloxacin, amikacin, ceftazidime, lincomycin, ceftiofur sodium, florfenicol, azithromycin, cefotaxime sodium, rifampin, meropenem, ceftriaxone sodium), tween-80 and LCEO on A. baumannii.
Every drug solution was two-fold diluted in TSB and equally mixed with 100 μL A. baumannii 17 TSB suspensions (104 CFU/mL) respectively in a 96-well microtiter plate. After stationary culture at 37 °C for 24 h, MIC values were judged by no visible growth of A. baumannii of broth in wells [20]. This test was repeated three times.

2.3. Growth Curve

A growth curve assay was performed to investigate the growth inhibitory effect of LCEO on A. baumannii 17. Bacterial TSB suspensions (104 CFU/mL) were transferred into tubes, followed by tween 80 and LCEO. The final concentration of tween 80, LCEO (1/2 MIC) and LCEO (1 MIC) in corresponding groups was 1.08, 0.54 and 1.08 mg/mL. After 300 RPM shaking at 37 °C for 24 h, the OD600 was determined at intervals by a spectrophotometer. Before each detection, zero was set using a same batch of sterile TSB. This test was repeated three times.

2.4. Time Kill Curve

After 12 h culture at 37 °C with 300 RPM shaking, A. baumannii 17 culture was added with tween 80 and LCEO. The final concentration of tween 80, LCEO (1/2 MIC) and LCEO (1 MIC) in the corresponding group was 1.08 mg/mL, 0.54 and 1.08 mg/mL. Next, all samples were cultured for another 8 h. At intervals, 100 μL culture in each sample was taken, centrifuged and resuspended in 100 μL sterile phosphate-buffered saline (PBS). Subsequently, 10-fold serially diluted suspensions were plated on TSA plates and incubated 24 h at 37 °C. Colonies were counted and the CFUs/mL was calculated. This experiment was performed with at least three biological replicates.

2.5. Preparation of Bacterial Samples for RNA-Seq

For RNA extraction, culture of A. baumannii 17 was inoculated into fresh TSB then incubated at 37 ℃ with 250 RPM shaking. When the opioid addiction (OD) value at 600 nm of culture reached 0.8 (1 × 10⁶ CFU/mL), ½ MIC (0.54 mg/mL) of LCEO was set as stimulation treatment, thus bacteria from the aliquot were suspended in 10 mL TSB with ½ MIC LCEO, and the bacterial from another aliquot were suspended in 10 mL TSB as control.
When the OD600nm value of the culture reached 0.8 (1 × 10⁶ CFU/mL), ½ MIC of LCEO was added in the culture, and this was the LCEO treatment group. At the same time, a control group was set without LECO. Each group had three independent samples. After 30 min incubation at 37 °C, bacterial cells were collected for RNA extraction.

2.6. RNA Extraction and Purification, cDNA Library Construction for RNA-Seq, RNA-Seq and Data Analysis

By using the Total RNA Isolation System (Promega), total RNA of six cell samples was extracted. The extracted RNAs quality was checked using Agilent 2100 Bioanalyzer. Library construction and Illumina sequencing was undertaken by Novogene China.
All RNA-seq reads were aligned to the genome of A. baumannii ATCC 17978 (https://www.ncbi.nlm.nih.gov/assembly/GCA_000015425.1; accessed on 1 March 2007) for data analysis. Only genes with an adjusted p-value  <  0.05 and |fold change|  >  1.5 were regarded as differentially expressed genes (DEGs).

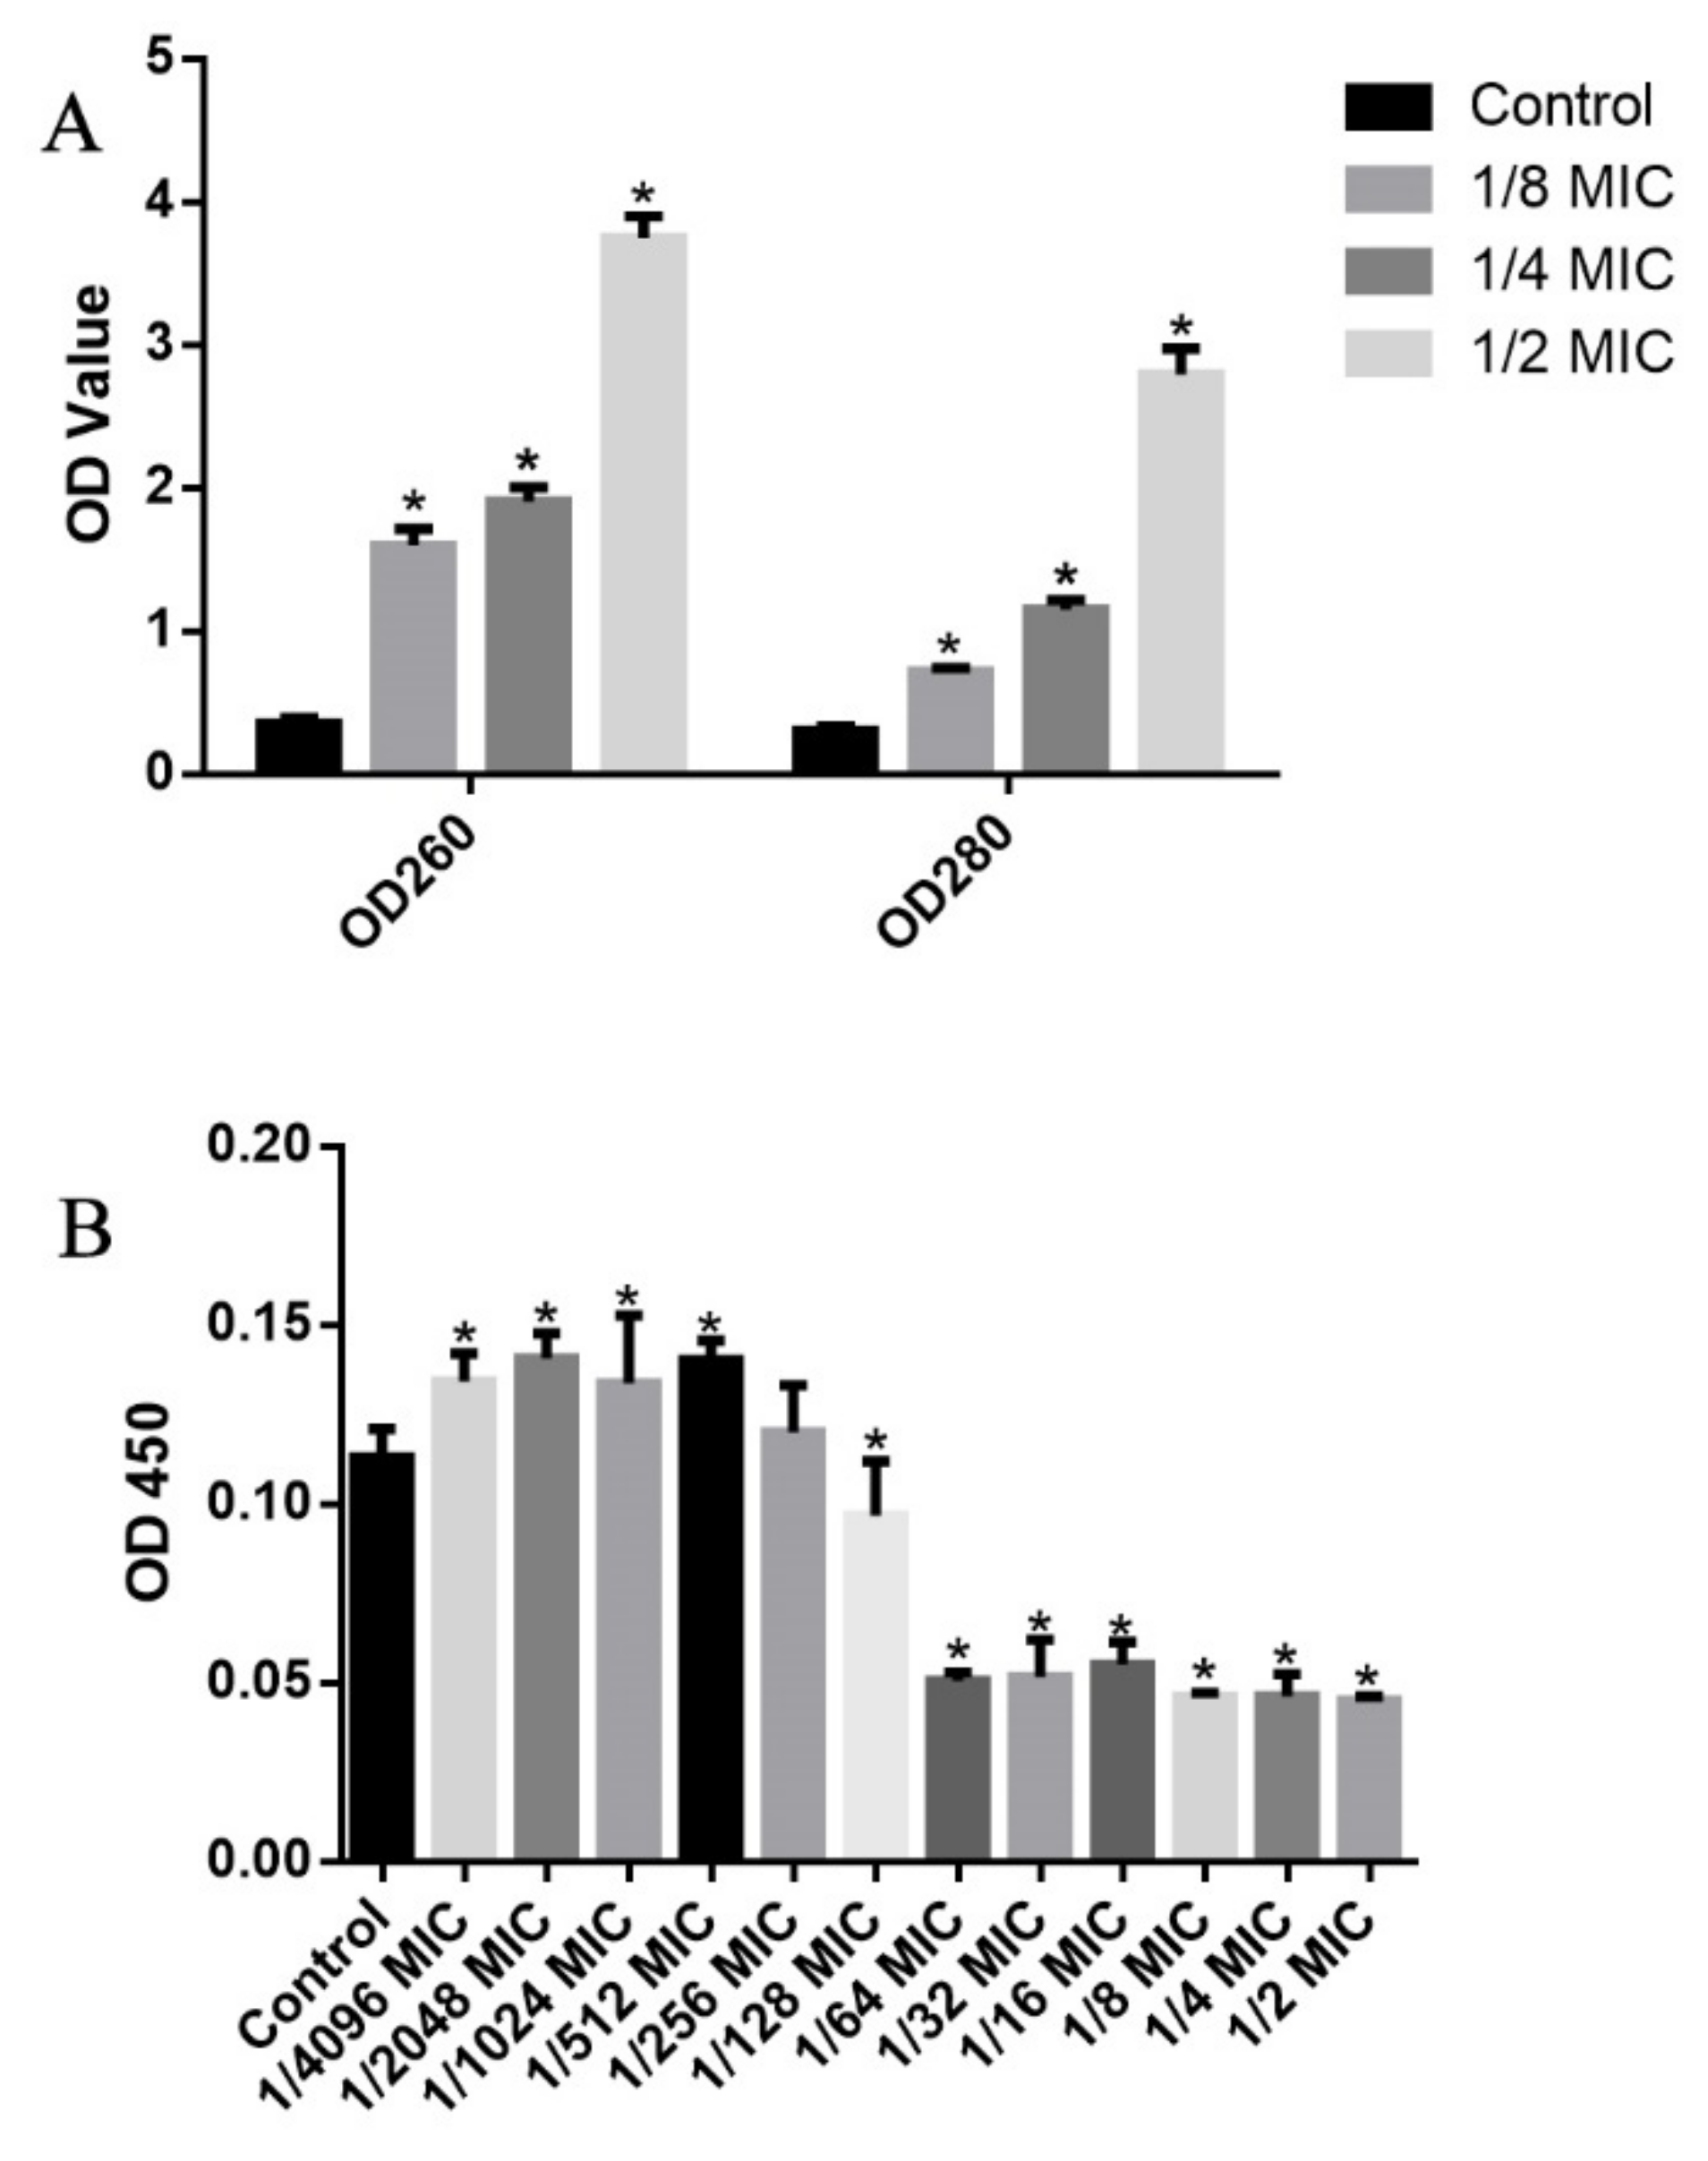
2.7. Leakages of Intracellular DNA and Protein

To investigate the leakages of intracellular DNA and proteins of A. baumannii 17 triggered by LCEO, an ultraviolet (UV) light spectrophotometer (DU 730 Nucleic Acid/Protein Analyzer; Beckman Coulter, Brea, CA, USA) was used [21]. A fresh culture of A. baumannii 17 (1 × 10⁶ CFU/mL, TSB cultured) was washed with sterile water twice and then resuspended by sterile water to the same volume. The resuspended A. baumanni from the previous step was divided into 16 test tubes (4 groups and 4 duplicates). The four groups were: Control, 1/8 MIC (0.135 mg/mL of LCEO), 1/4 MIC (0.27 mg/mL of LCEO) and 1/2 MIC (0.54 mg/mL of LCEO). These 16 test tubes were incubated at 37 °C with 250 rpm shaking for 2 h. Afterwards, 16 test tubes were subjected to centrifugation under 5500 rpm for 15 min, and then the supernatant was taken for absorbance detection of OD260nm (DNA absorbance) and OD280nm (protein absorbance). Because citral (the main active component of LCEO) absorbs UV light, three control tubes with the same concentration of LCEO were set for zeroing the OD value before testing, respectively.

2.8. L. cubeba Essential Oil (LCEO) on Biofilm Formation

The method applied was a slight modification of the method used in a previous work [22]. LCEO (from 0.54 to 0.00026 mg/mL and the 0 mg/mL was set as control) was two-fold diluted in TSB and equally mixed with 100 μL A. baumannii TSB suspensions (104 CFU/mL) respectively in a 96-well microtiter plate. After incubation at 37 °C for 36 h, the culture was removed and 200 μL methanol was added to each well for 15 min at room temperature. After that, the methanol supernatant was removed, and the plates were dried at room temperature. Then, 200 μL of 0.1% crystal violet solution was added to the wells for 15 min at room temperature. After that, the crystal violet was removed, the wells were washed gently with distilled water until the distilled water was clear and transparent, and 200 μL 33% acetic acid was added to each well. Finally, the OD450nm value of plates were read [22]. This test was repeated at three times.

2.9. Fractional Inhibitory Concentration Index (FICI)

The Fractional Inhibitory Concentration Index (FICI) was used to evaluate the synergistic growth inhibitory effect of LCEO with other antibiotic (tetracycline, meropenem, chloramphenicol, amikacin, ampicillin, kanamycin, ciprofloxacin, fosfomycin, streptomycin sulfate, ceftiofur). FICI = FICA + FICB = C Acomb/MIC A alone + C B comb/MIC B alone. MIC A alone and MICB alone are the MIC values of drug A and B when acting alone. C Acomb and C B comb are concentrations of drug A and B in combination. FICI results were determined as follows: synergy: <0.5; additivity: 0.5–1; indifference: >1–4; and antagonism: >4 [23,24]. This test was repeated at three times.

2.10. Quantitative Real-Time Polymerase Chain Reaction (RT-PCR)

To validate the RNA-seq results, 8 DEGs were selected for quantitative real-time PCR (RT-PCR) assay. The selective criteria of these 8 DEGs were: (1) in different Kyoto Encyclopedia of Genes and Genomes (KEGG) pathways; (2) the |fold change| > 1.5; (3) 4 DEGs were up-regulated and the remaining 4 DEGs were down-regulated. These experiments were performed in triplicate.
Total RNA was extracted from the bacteria using Bacteria RNA Plus Reagent (Vazyme) and RNA Isolater Total RNA Extraction Reagent (Vazyme). HiScript® III RT SuperMix for qPCR (+gDNA wiper) (Vazyme) was used for reverse transcription. Primers were designed by Primer-BLAST (NCBI) and provided by Vazyme (Table 2). The amplification and detection part were carried out by LightCycler® 480 (Roche). This test was repeated three times.

2.11. Statistical Analysis of Quantitative Real-Time PCR and Opioid Addiction (OD) Value

The statistical analysis of results was performed using one-way analysis of variance (ANOVA) followed by post hoc analysis with Tukey’s test using SPSS16 software. Values of p < 0.05 were considered to be statistically significant.

3. Results and Discussion

3.1. MIC Values

All strains had obvious drug-resistant phenotype to some common antibiotics: amoxicillin, amikacin, sulfamonomethoxine, azithromycin (Table 3). However, the MIC value of tween 80 on A. baumannii was >108 mg/mL, which may indicate that the tween 80 has no negative effect on the growth of A. baumannii.
We selected A. baumannii 17 for follow-up studies because the A. baumannii 17 harbored more drug resistance gene than other 2 strains, and A. baumannii 17 also had strong virulence phenotypes as mentioned above.

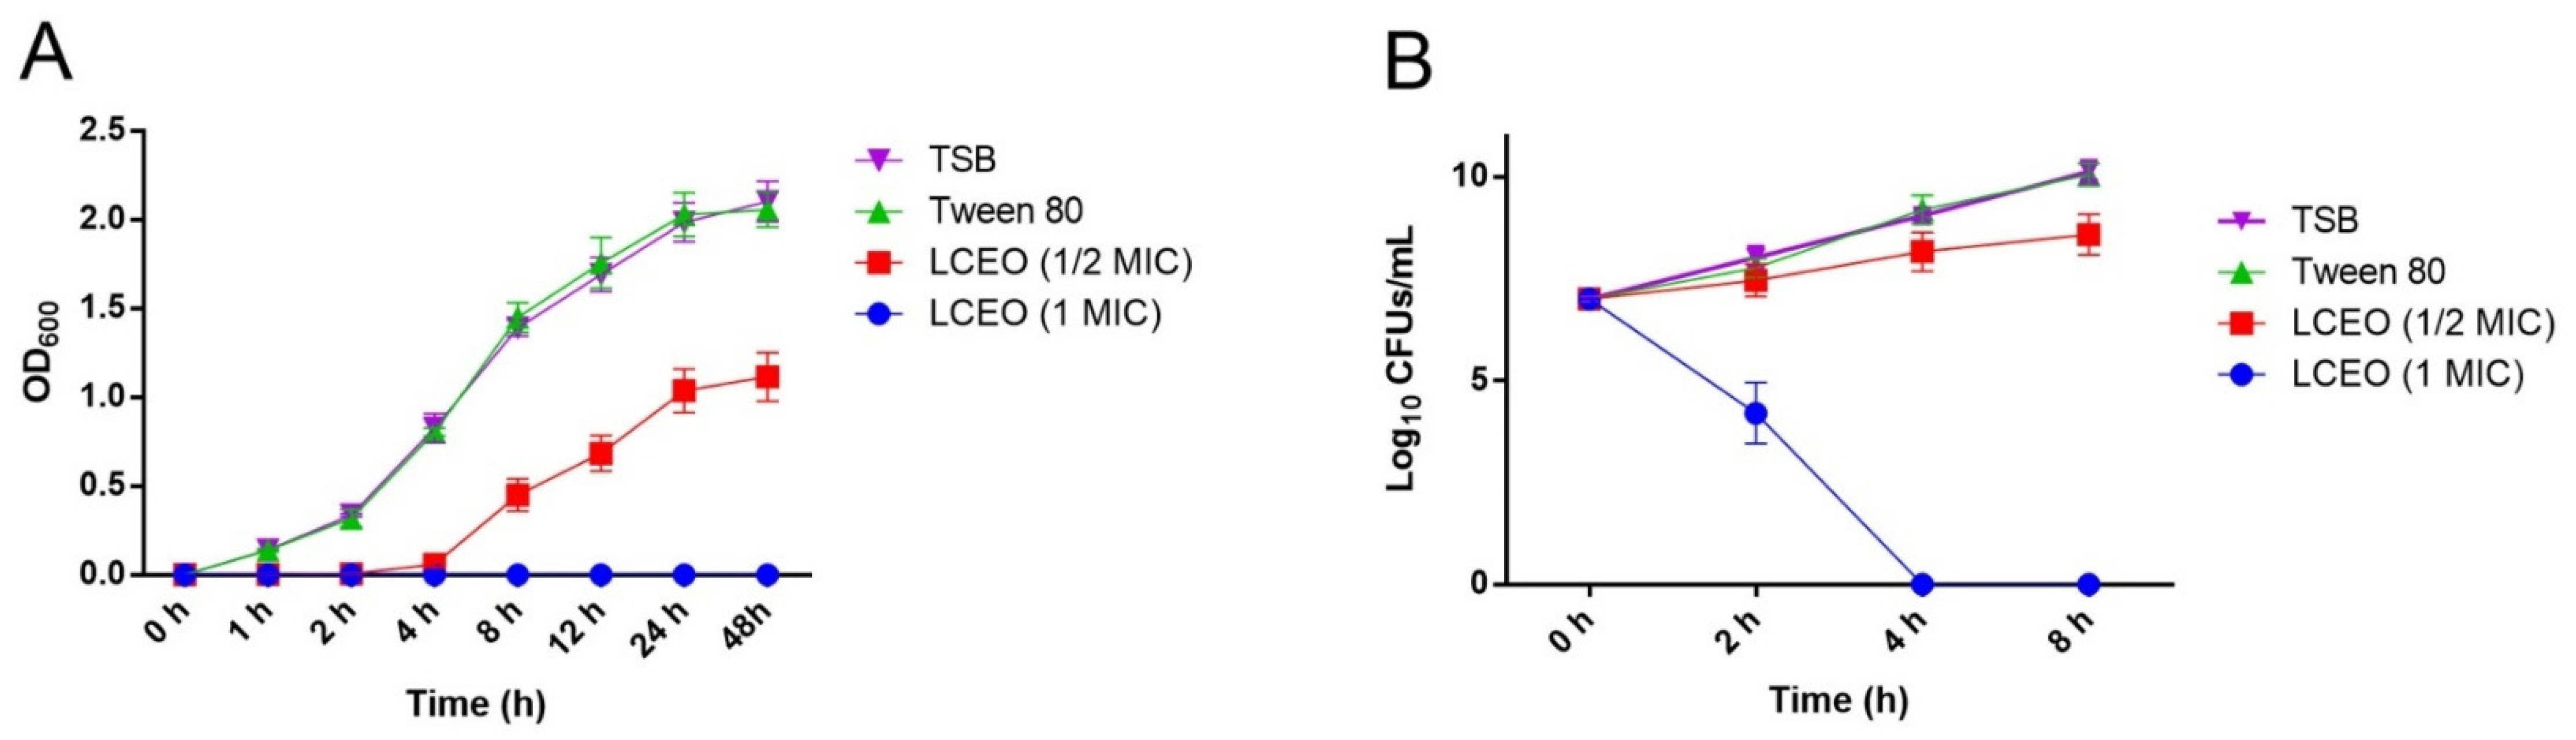
3.2. Growth Curve and Time Kill Curve

As shown in Figure 1A, the growth of A. baumannii 17 was inhibited by LCEO. However, tween 80 had no such effect. Similar results were found in the time kill assay (Figure 1B). Combined with the above MIC results and the results of existing studies [25,26], it was easy to assume that in this LCEO dispersion system, only LCEO plays a bacteriostatic role.

3.3. General Transcriptome Information

RNA-Seq generated total 10,597,964 to 20,954,540 clean reads from LCEO-treated (AB_LCEO_treated) and control cDNA libraries, respectively (Supplementary Figure S1 and Table S1). These clean reads were mapped to the reference genome of Acinetobacter baumannii ATCC 17978 (https://www.ncbi.nlm.nih.gov/assembly/GCA_000015425.1; accessed on 1 March 2007).
As the gene expression profile of samples in the same group were highly similar, further analysis can be performed. Per Kilobase of transcript per Million mapped reads (RPKM, full information of reads quantification) analysis showed that 4320 total genes were expressed in LCEO-treated and non-treated groups.
The raw sequence data reported in this paper have been deposited in the Genome Sequence Archive (Genomics, Proteomics and Bioinformatics 2017) in BIG Data Center (Nucleic Acids Res 2019), Beijing Institute of Genomics (BIG), Chinese Academy of Sciences, under accession numbers CRA003099 that is accessible at https://bigd.big.ac.cn/gsa (accessed on 18 August 2020).

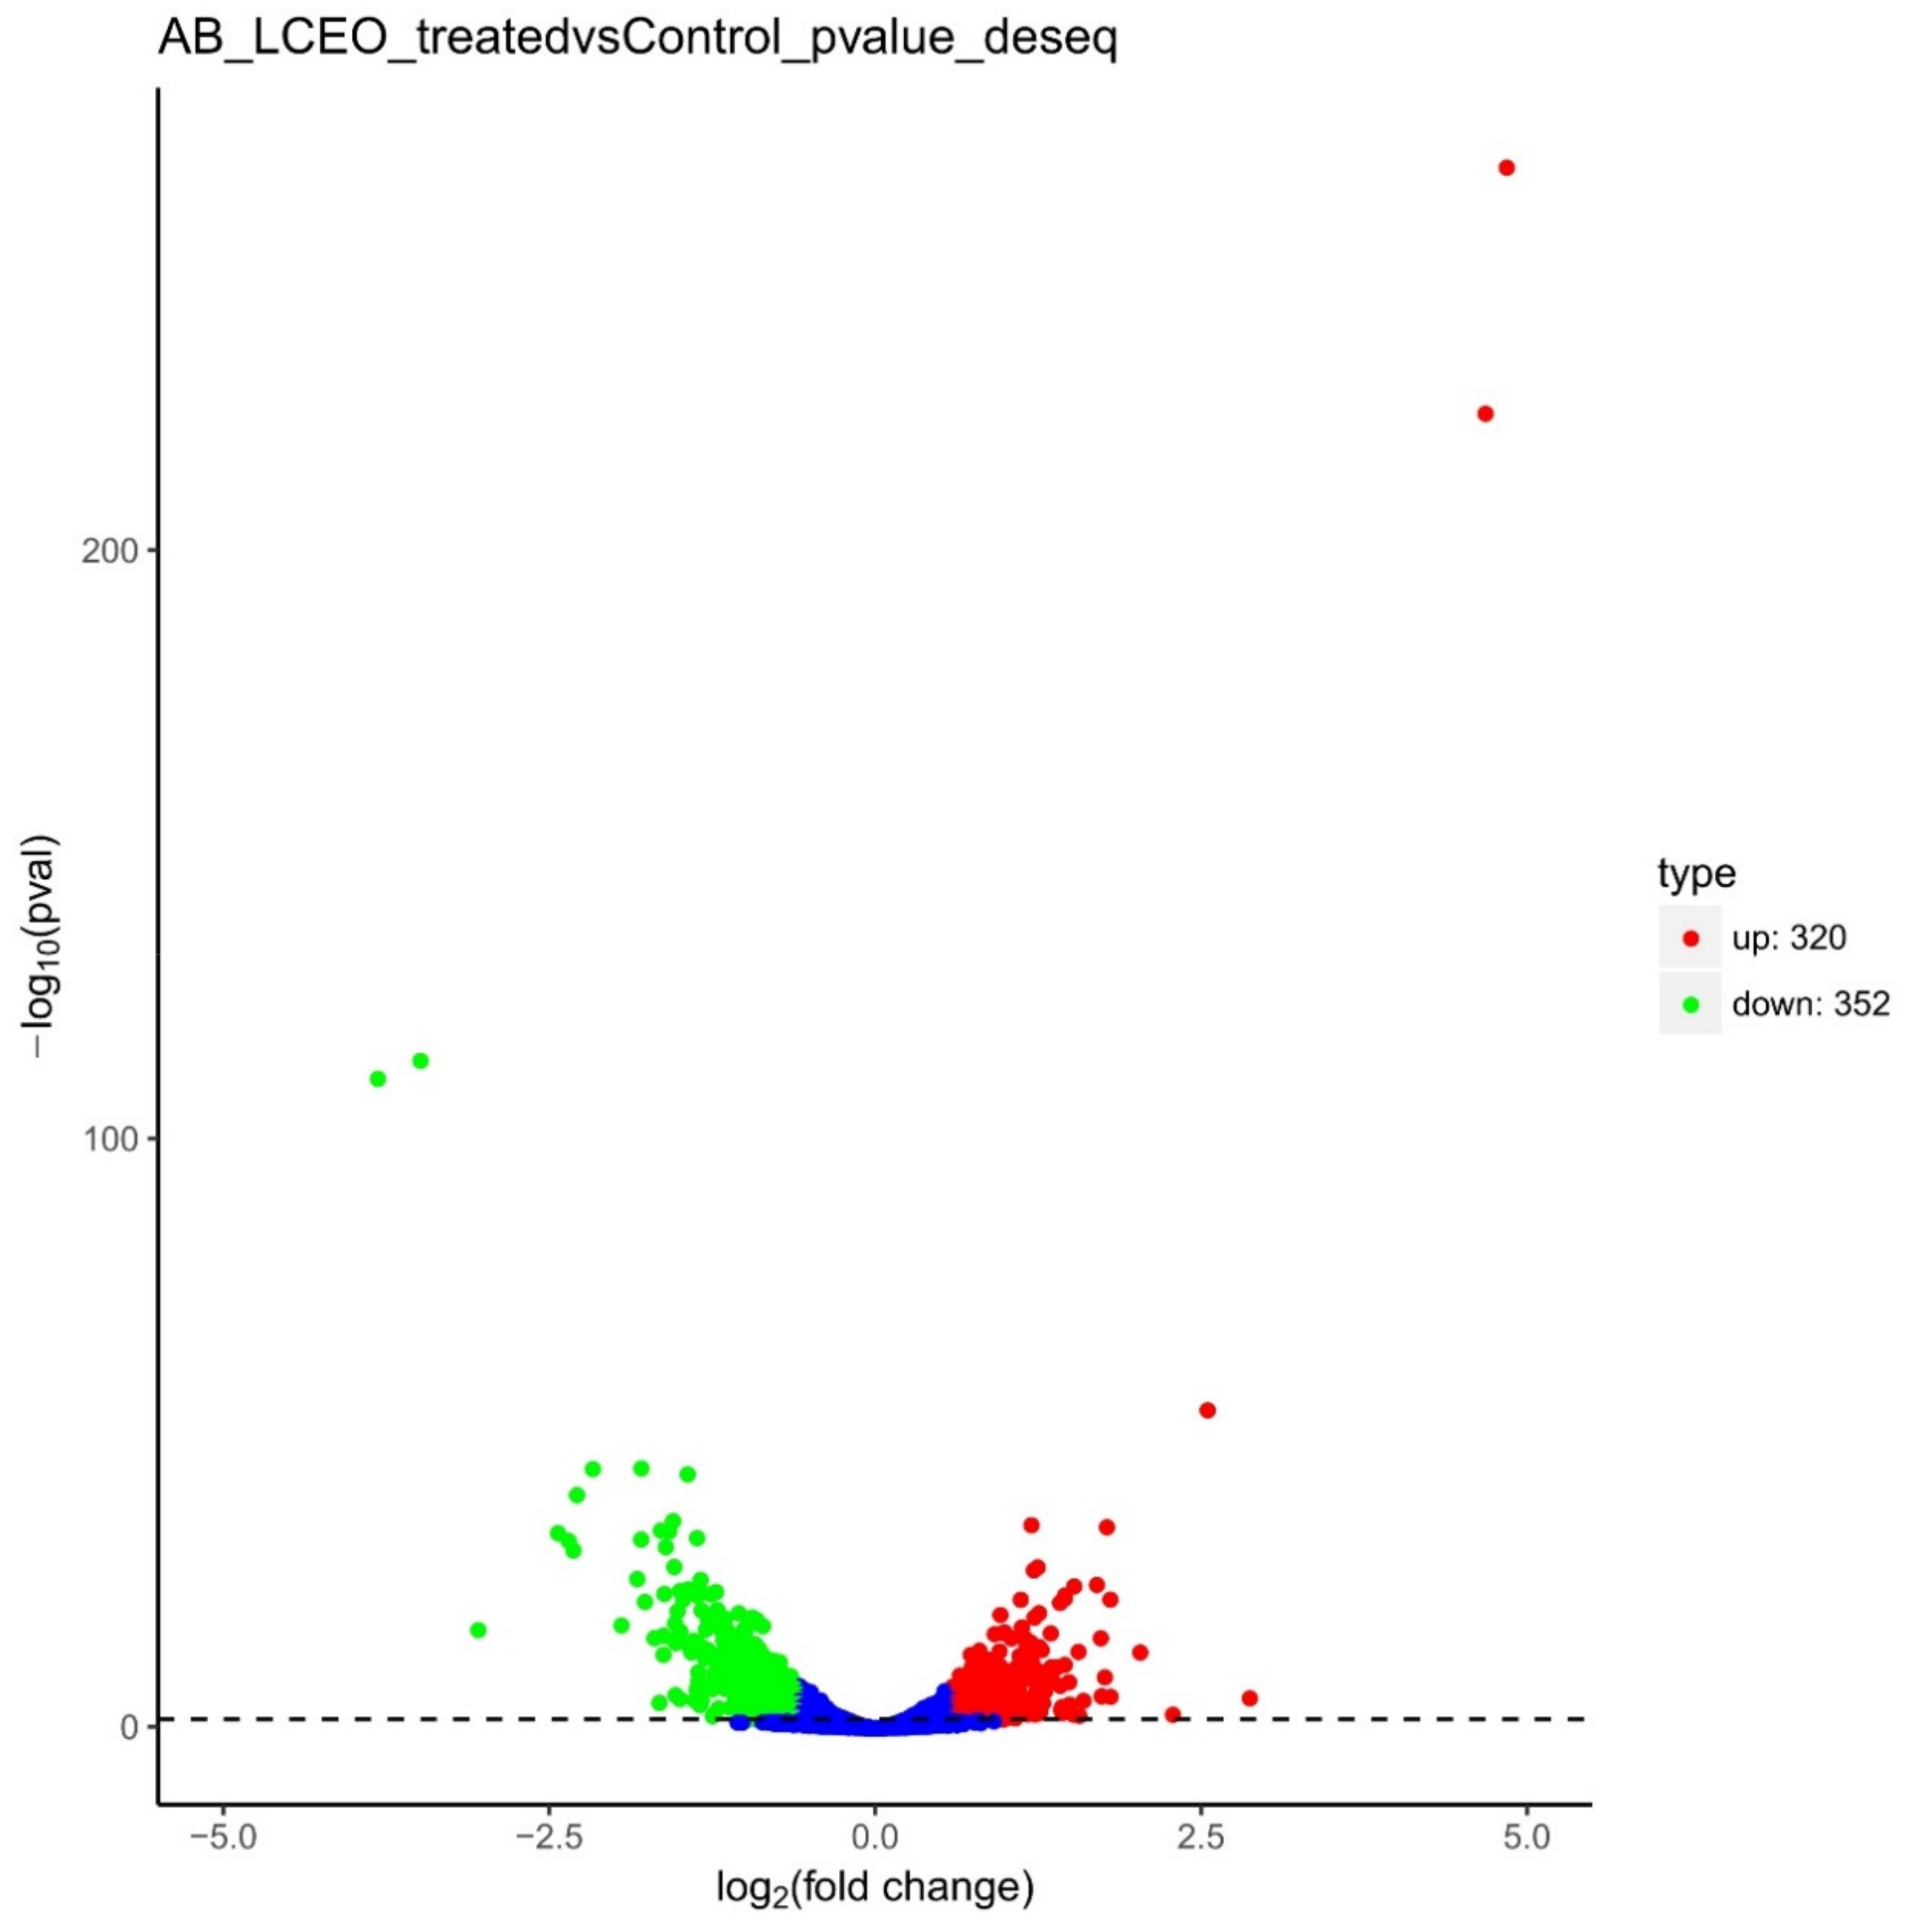
3.4. Differentially Expressed Genes in LCEO-Treated A. Baumannii 17

To understand and explain the results of RNA-seq, the differential expression patterns of the transcripts were analyzed between the LCEO-treated and control group. 672 genes (320 up and 352 down-regulated) were identified by differential expression analysis (Figure 2). Among these 672 DEGs, the |fold change| of 11 up and 9 down-regulated DEGs were all >4.
According to the gene ID and gene name of the NCBI database, 11 up-regulated genes encode 4-carboxymuconolactone decarboxylase; NAD(P)-dependent alcohol dehydrogenase; alkane 1-monooxygenase; AraC family transcriptional regulator; hypothetical protein; N/A; 3-oxoacid CoA-transferase subunit A; hypothetical protein; α/β fold hydrolase; L-lactate permease; chromate transporter. The 9 down-regulated genes encode ferredoxin reductase; acyl-CoA desaturase; VOC family protein; 4-hydroxyphenylpyruvate dioxygenase; maleylacetoacetate isomerase; amino acid permease, fumarylacetoacetase; 1,2-phenylacetyl-CoA epoxidase subunit B; SDR family oxidoreductase.

3.5. Gene Ontology (GO) Functional Enrichment Analysis

Gene Ontology (GO) is an international standard classification system of gene function. By GO enrichment analysis of mRNA, functions of targeted mRNA can be obtained.
All 672 DEGs underwent GO enrichment analysis; 848, 183 and 529 specific GO terms in biological process, cellular component and molecular function were reported, as shown in Figure 3 and Supplementary Table S2.
Ten GO terms were enriched in biological process; including oxidation-reduction process; anion transport; organic anion transport; organic acid transport; carboxylic acid transport; anion transmembrane transport; organic acid transmembrane transport; amino acid transport; ion transmembrane transport; single-organism metabolic process.
Ten GO terms were enriched in cellular components; including membrane-enclosed lumen; organelle lumen; intracellular organelle lumen; nuclear part; nuclear lumen; proton-transporting two-sector ATPase complex, catalytic domain; intracellular organelle part; THO complex; chromosome; dynein complex.
In the category of molecular function, 10 GO terms (oxidoreductase activity; acyl-CoA dehydrogenase activity; coenzyme binding; oxidoreductase activity, acting on the CH-CH group of donors; cofactor binding; flavin adenine dinucleotide binding; excitatory extracellular ligand-gated ion channel activity; extracellular-glutamate-gated ion channel activity; organic acid transmembrane transporter activity; carboxylic acid transmembrane transporter activity) were significantly enriched.
Within the 30 significantly enriched GO terms, there were six terms containing the keyword “membrane”. Combined with a recent report [27], LCEO have significant negative effects on the cell membrane and cell wall of A. baumannii 17.
Previous studies have shown that LCEO has a strong antioxidant activity (that is, reducing activity) [7,28]. It was noteworthy that in a total of 672 DEGs, 127 DEGs were involved in three GO terms which contained the prefix “oxid”. The three GO terms were: oxidation-reduction process; oxidoreductase activity; oxidoreductase activity, acting on the CH-CH group of donors. These results suggested that LCEO influenced the biological redox processes of A. baumannii 17 comprehensively. We wanted to know which pathways that these 127 DEGs were involved in. Therefore, a customized KEGG enrichment analysis was performed individually based on the 127 DEGs.

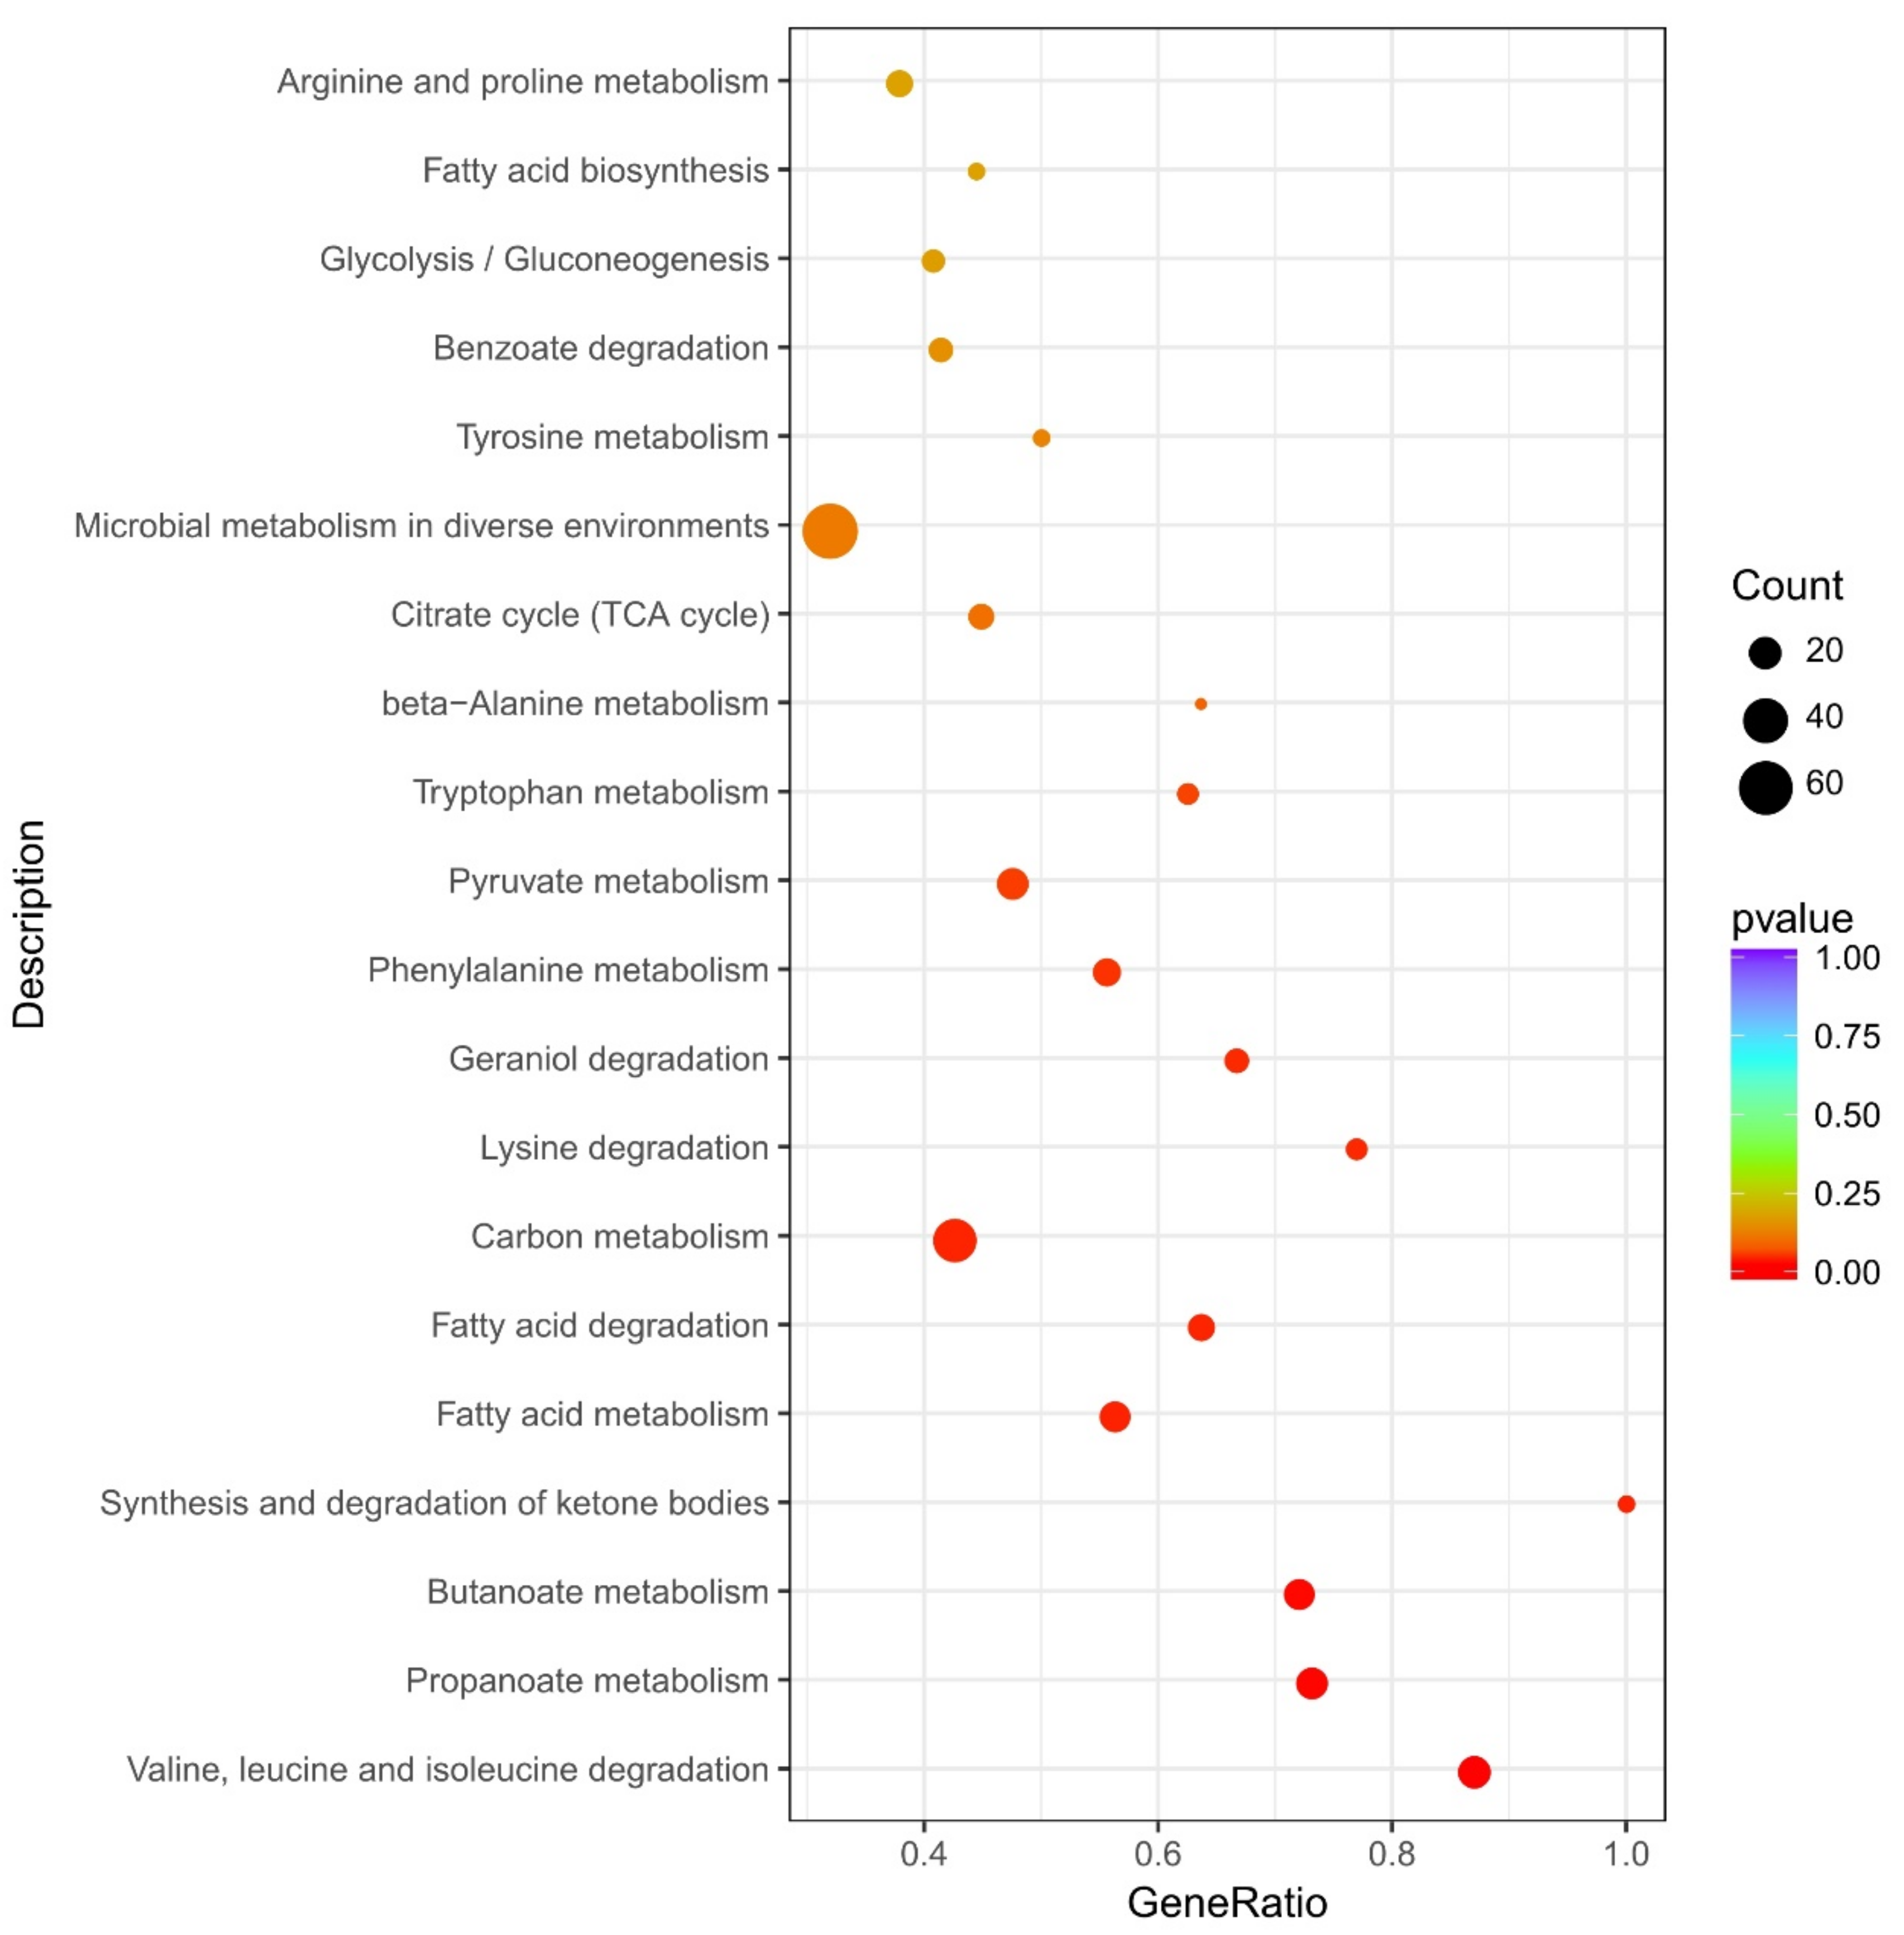
3.6. Kyoto Encyclopedia of Genes and Genomes (KEGG) Pathway Enrichment Analysis

KEGG is a database integrating genome, chemical and system functional information. KEGG pathway enrichment analysis can not only find out the pathways involved in target genes or proteins, but also analyze the significant differences of these pathways.
To further identify significant changes in the biochemical pathways during LCEO stimulation, the 672 DEGs were further mapped using the KEGG database (Supplementary Table S3). In Figure 4, 12 KEGG pathways (valine, leucine and isoleucine degradation; propanoate metabolism; butanoate metabolism; synthesis and degradation of ketone bodies; fatty acid metabolism; fatty acid degradation; carbon metabolism; lysine degradation; geraniol degradation; phenylalanine metabolism; pyruvate metabolism; tryptophan metabolism) were significantly enriched.
Also, the 127 DEGs were mapped to the KEGG database (the reason was mentioned at the end of Section 3.5). Eight KEGG pathways (geraniol degradation; valine, leucine and isoleucine degradation; butanoate metabolism; fatty acid degradation; β-alanine metabolism; chloroalkane and chloroalkene degradation; lysine degradation; phenylalanine metabolism) were significantly enriched (Supplementary Table S3).
After a detailed comparison between the results of two KEGG enrichment analyses with 672 and 127 DEGs, we found that: the significantly enriched pathways were similar; the 127 DEGs were widely distributed in multiple KEGG pathways. Also, in the results of 127 DEGs, and in a particular KEGG pathway, the ratio of measured genes (input number) to annotated genes in the database (background number) was not high. These suggested that the biological redox processes of A. baumannii 17 were extensively and strongly interfered with by LCEO, and these effects may be non-specific. Therefore, we hypothesized that many redox reactions in cells were affected by LCEO as LCEO can simultaneously act on multiple targets of A. baumannii 17.
In the KEGG enrichment sections below, only the results of the total 672 DEGs were discussed in detail.

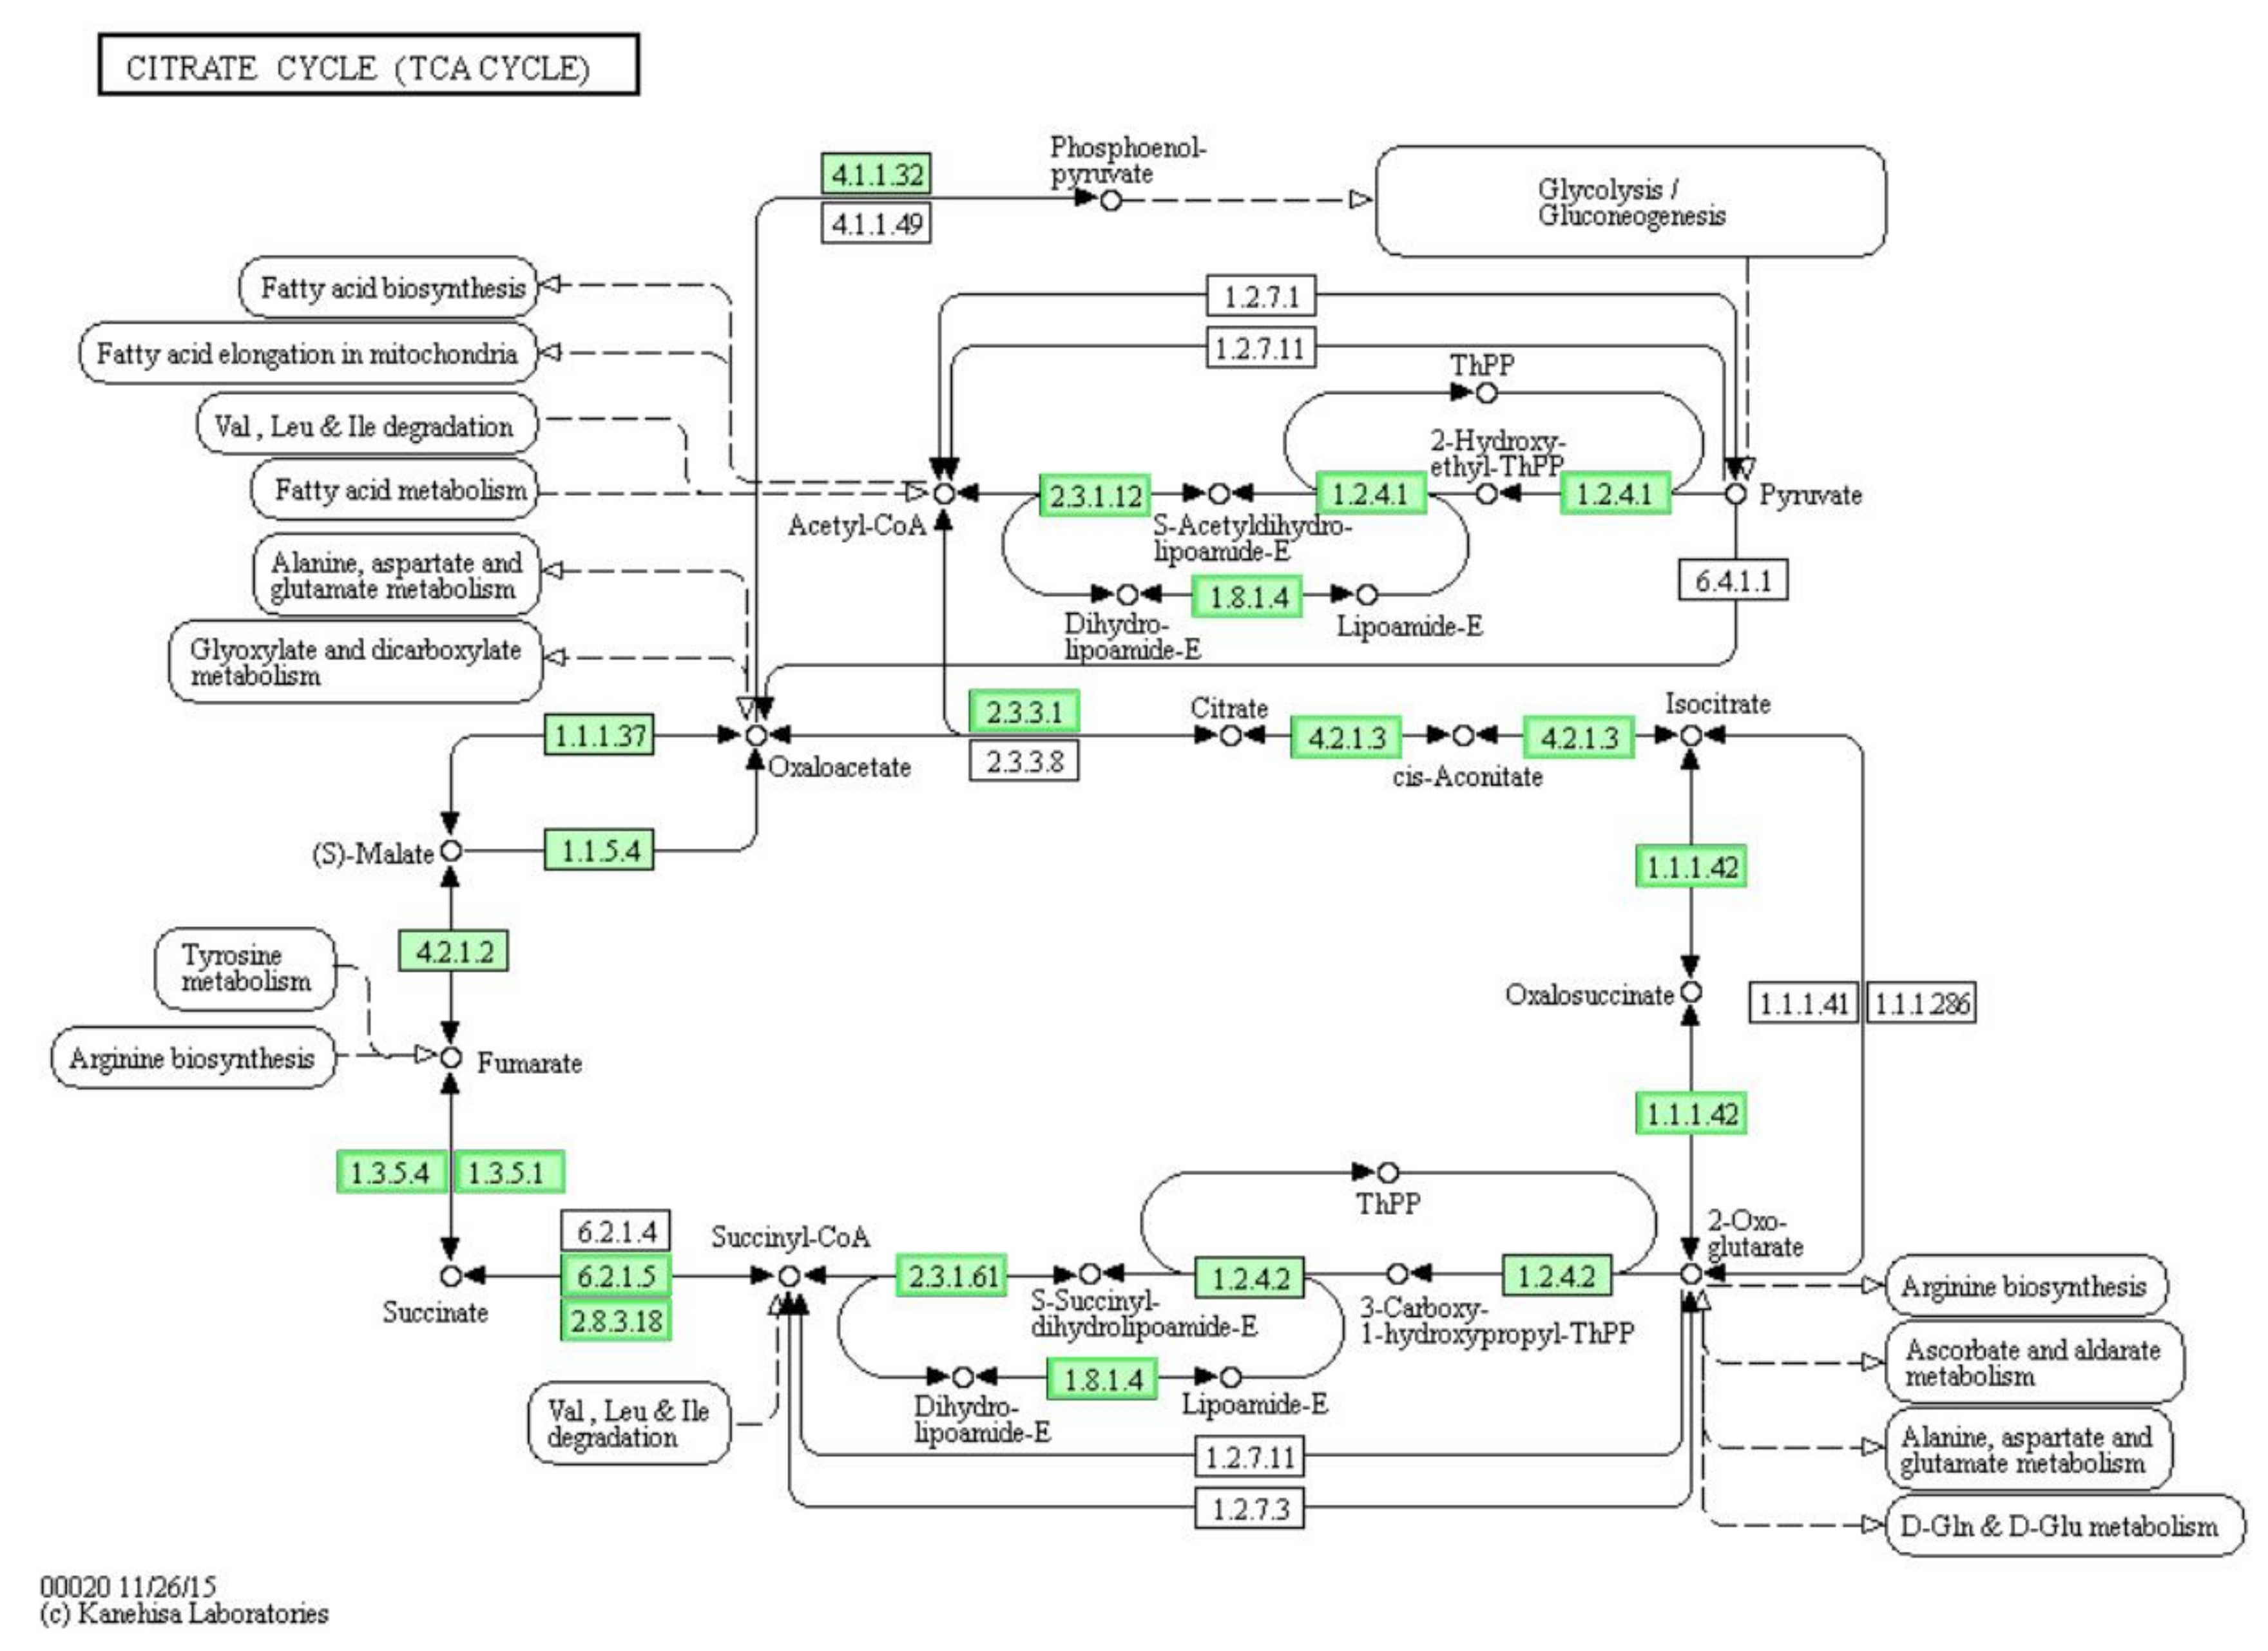
3.7. Differentially Expressed Genes (DEGs) Involved in “Citrate Cycle (TCA Cycle)” Pathway

It was necessary to discuss the citrate cycle (TCA cycle) pathway first, although it was not significantly enriched (p = 0.0780). TCA cycle is an important aerobic pathway for the final oxidization of carbohydrates, fatty acids, proteins and other organics [29,30,31]. As compared to the control, in LCEO-treated A. baumannii 17, all the enriched genes were significantly down-regulated (Figure 5). The gene expressions of the key enzymes (citrate synthase [EC:2.3.3.1], isocitrate dehydrogenase [EC:1.1.1.42]) which were involved in two irreversible and critical rate-limiting reactions, was down-regulated. These results suggest that the declined reaction rate of the TCA cycle pathway, and a decreased energy production of the bacteria. The TCA cycle contains a number of dehydrogenation steps; however, the essence of dehydrogenation is oxidation. Then it made sense in principle that the TCA cycle of A. baumannii 17 was inhibited by LCEO with strong reducibility.

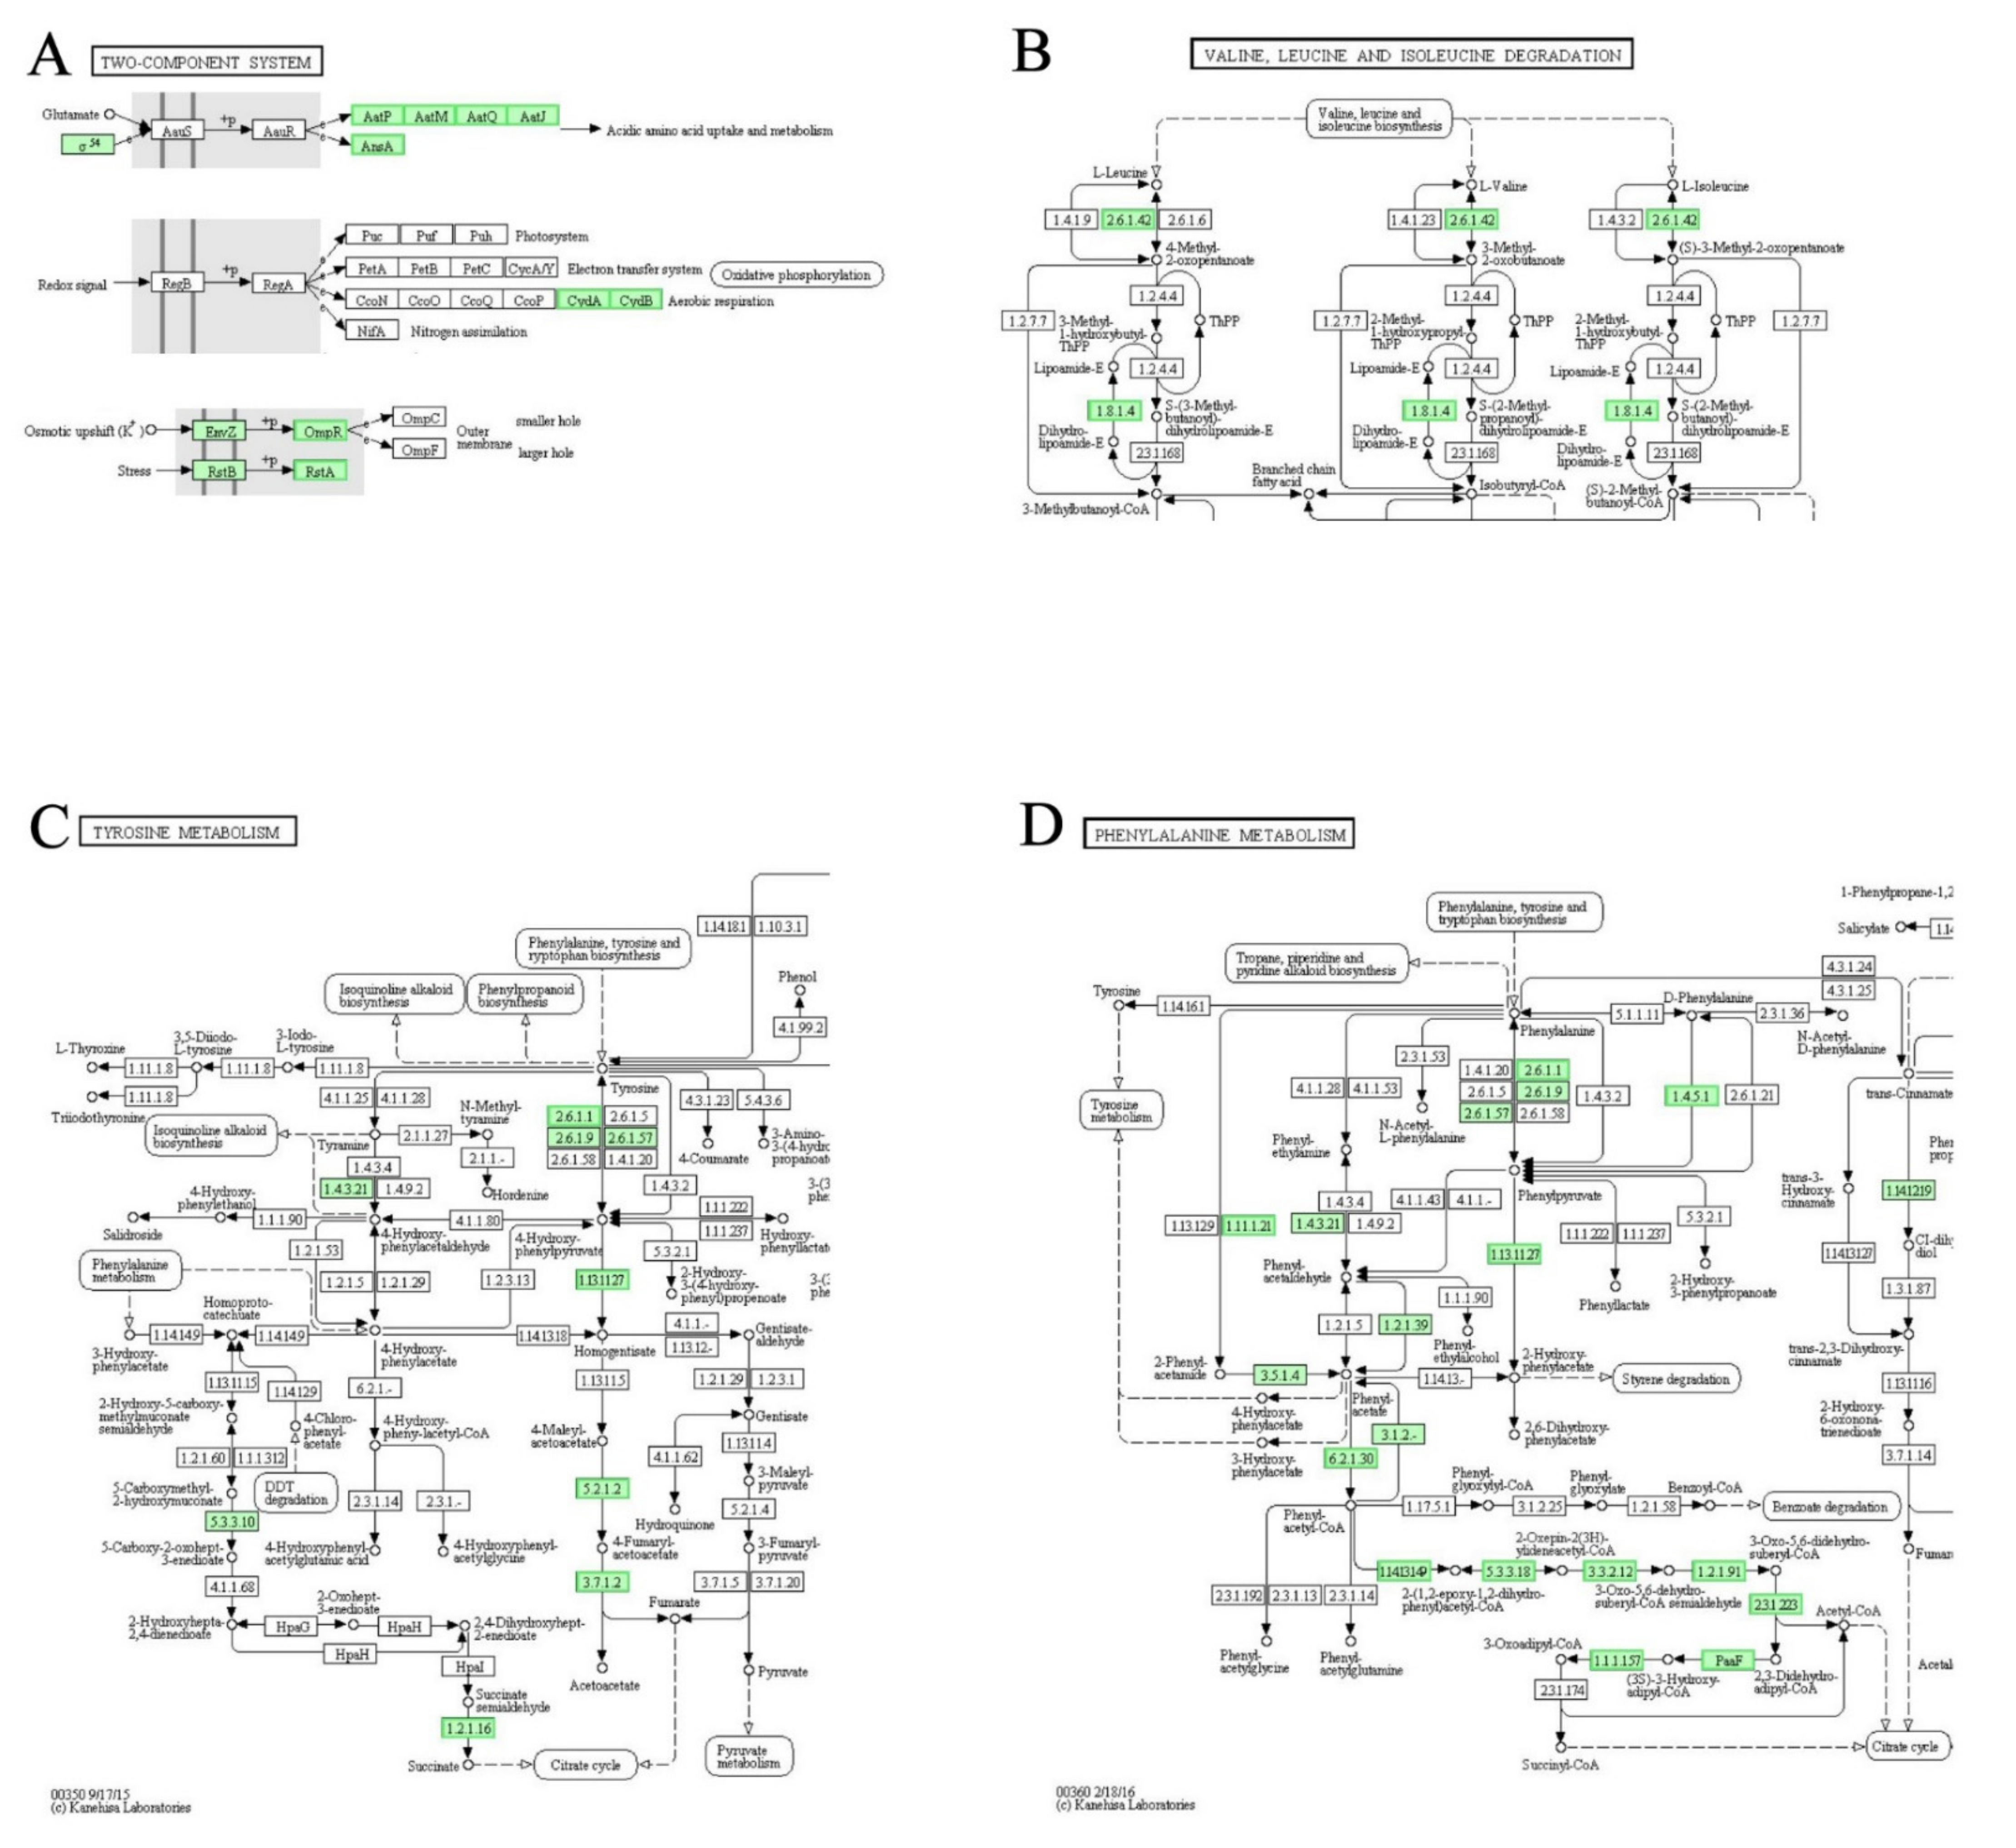
3.8. DEGs Involved in “Two-Component System”, “Valine, Leucine and Isoleucine Degradation”, “Tyrosine Metabolism” and “Phenylalanine Metabolism” Pathways

Two-component signal transduction systems enable bacteria to sense the changes and stimulation of the external environment, and carry out signal transmission. In general, the two-component system includes a membrane-bound histidine kinase and a corresponding response regulator. After the histidine kinase senses specific stimuli, it phosphorylates specific histidine residue of its own. Next, the corresponding response regulator mediates the cellular response. Histidine kinase and reaction regulator are the largest gene families in Gram-negative bacteria and cyanobacteria in particular [32,33,34,35]. AauSR is a sensor of glutamate. In LCEO-treated A. baumannii 17, the expressions of downstream genes (aatJMPQ, ansA) were significantly downregulated as compared with the control (Figure 6A). These transcriptomic results strongly suggested a weakening of acidic amino acid (aspartic acid and glutamic acid) uptake and metabolism in the LCEO treated cell.
Valine, leucine and isoleucine can be degraded into the TCA cycle; pyrimidine metabolism; terpenoid backbone biosynthesis and other pathways [36,37]. In the LCEO-treated A. baumannii 17, genes encoding the enzymes that start the whole reaction (branched-chain amino acid aminotransferase [EC:2.6.1.42] and dihydrolipoamide dehydrogenase [EC:1.8.1.4]) were significantly downregulated in comparison with the control (Figure 6B). These results suggested that the activity of Valine, leucine and isoleucine degradation pathway was inhibited.
In the KEGG database, there were still many non-annotated genes in the tyrosine metabolism pathway map. As shown in Figure 6C, the expressions of genes encoding enzymes (4-hydroxyphenylpyruvate dioxygenase [EC:1.13.11.27], maleylacetoacetate isomerase [EC:5.2.1.2], fumarylacetoacetase [EC:3.7.1.2] and succinate-semialdehyde dehydrogenase [EC:1.2.1.16]) of irreversible reaction were down-regulated by LCEO in A. baumannii 17. Therefore, we can infer from the results a reduced production of succinate and fumarate for TCA cycle in cells.
Phenylalanine can be metabolized into succinyl-CoA and acetyl-CoA for the TCA cycle [38]. According to Figure 6D, gene expressions of almost all the enzymes known to be involved in this process were downregulated by LCEO significantly. Therefore, we can assume that the production of succinyl-CoA and acetyl-CoA from phenylalanine was decreased by LCEO of A. baumannii 17 as compared to that of the control.

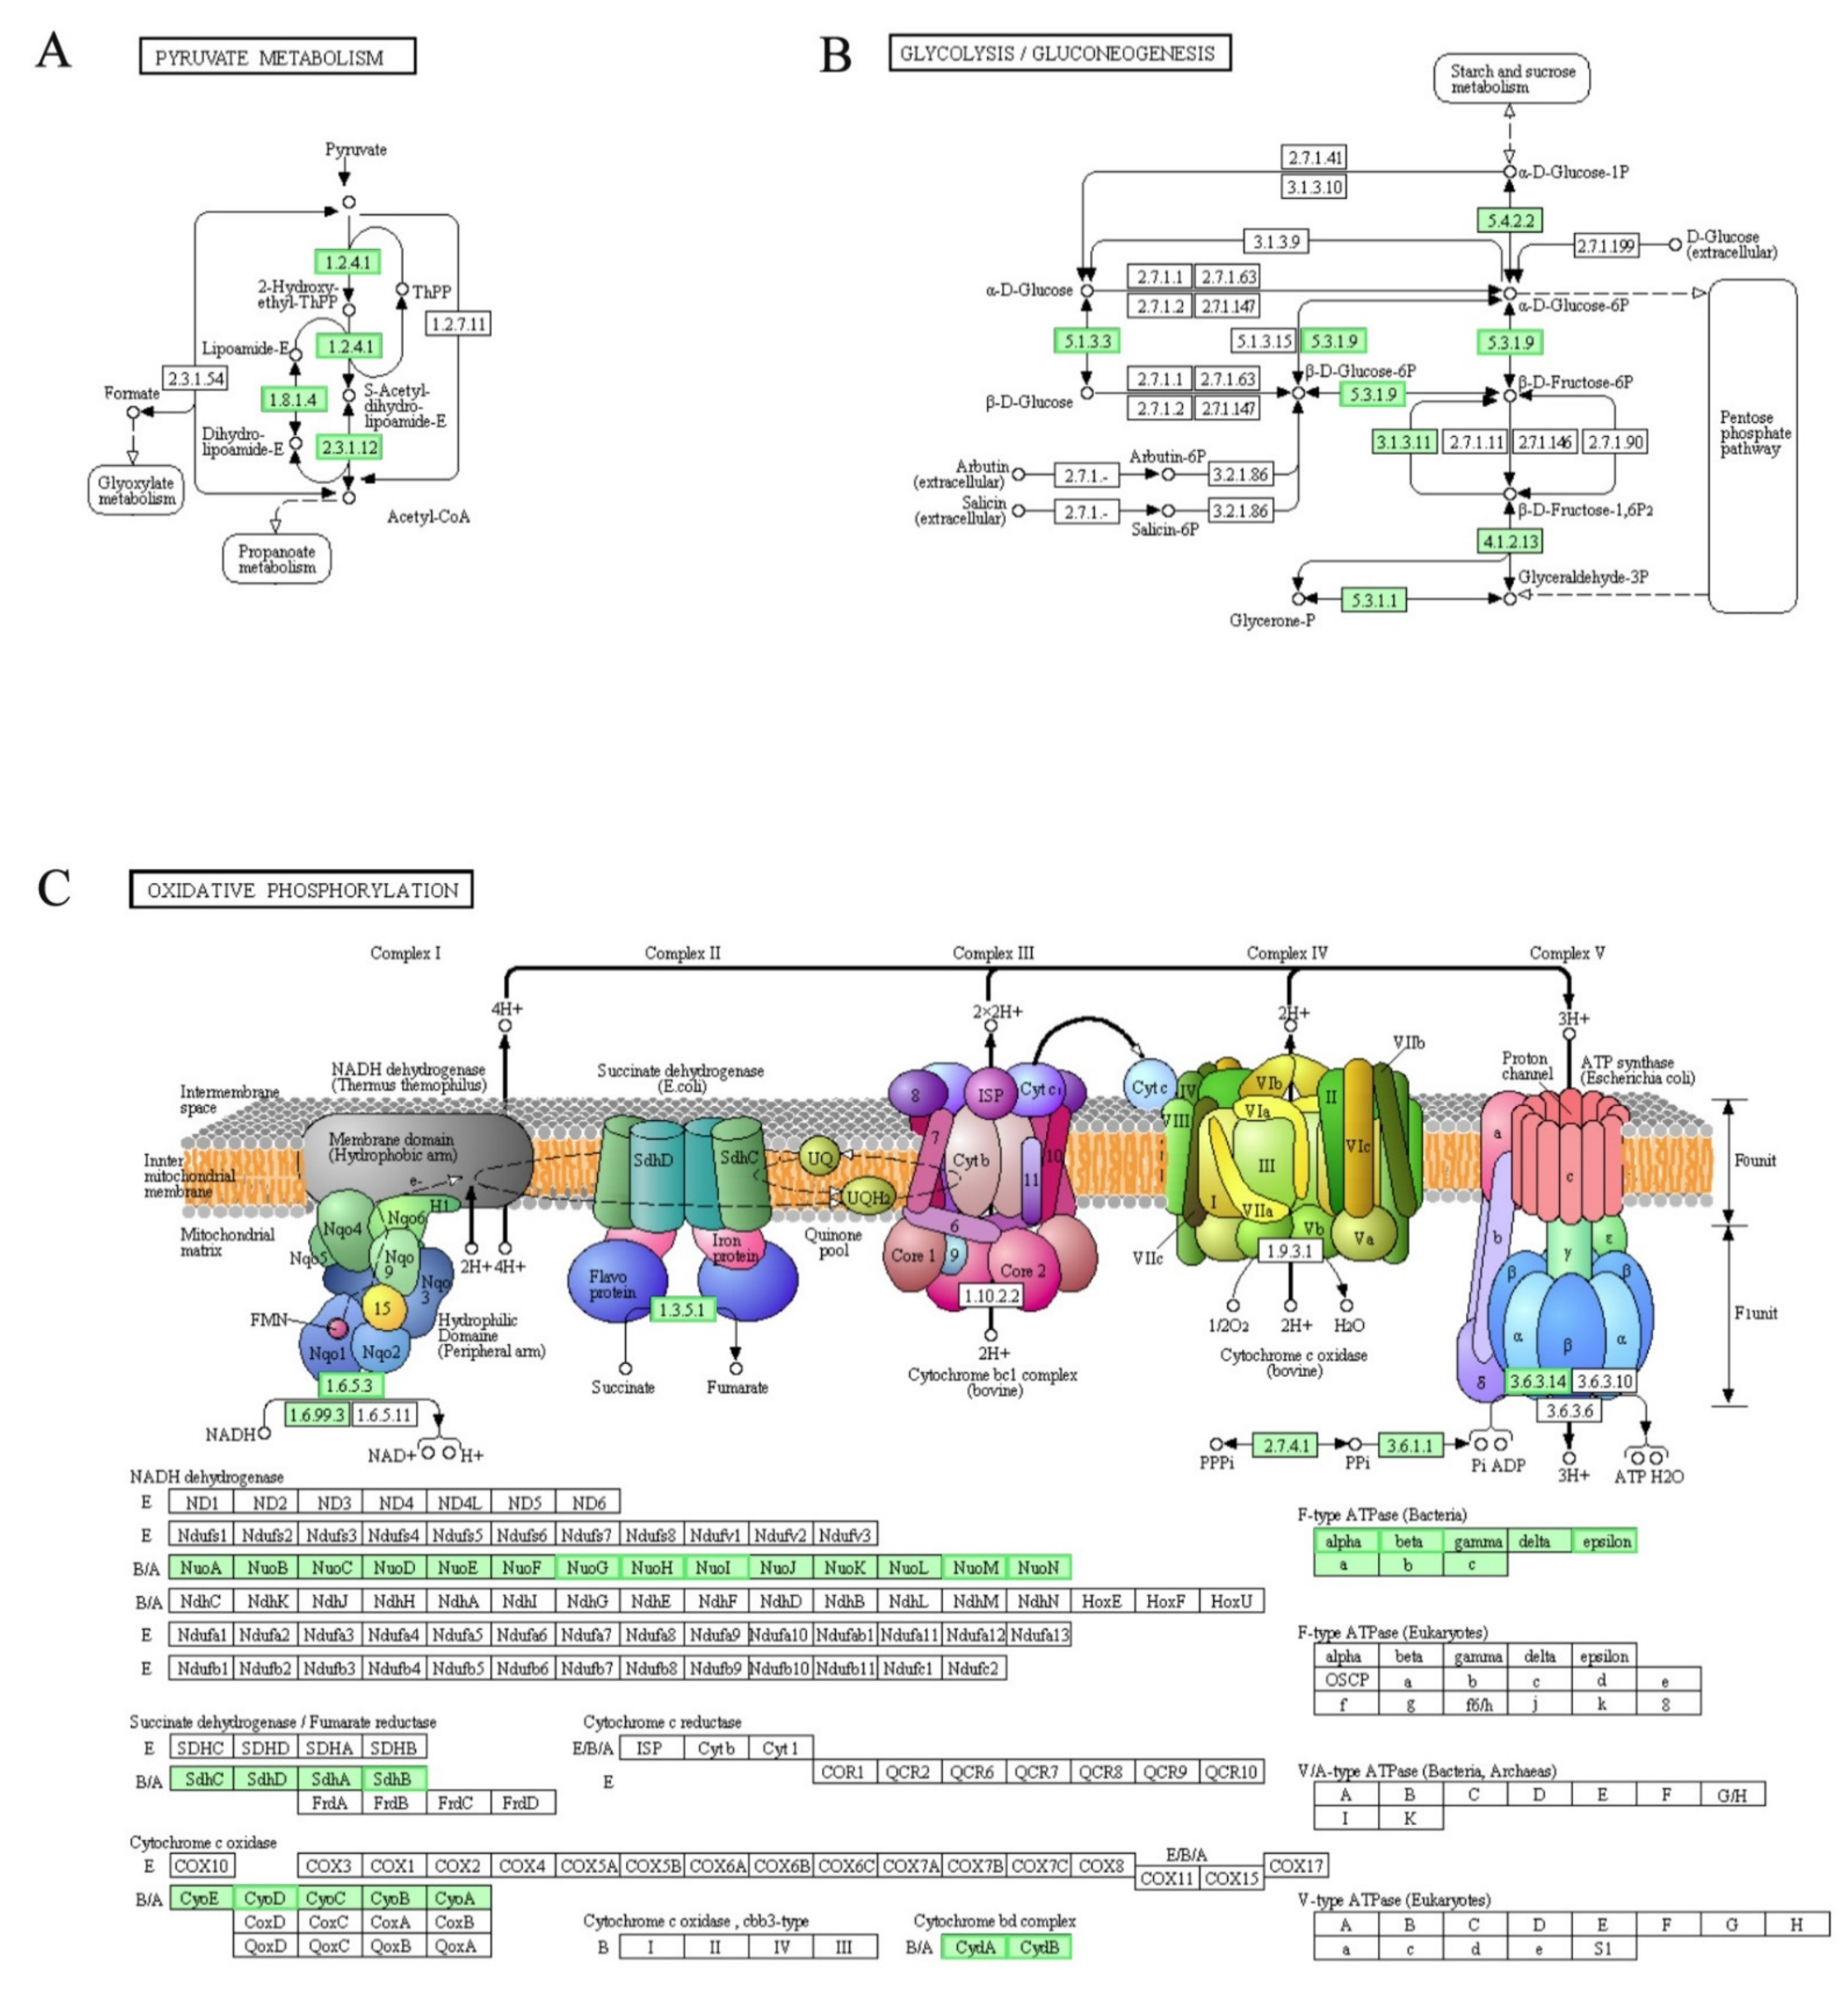
3.9. DEGs Involved in “Two-Component System”, “Pyruvate Metabolism”, “Glycolysis/Gluconeogenesis” and “Oxidative Phosphorylation” Pathways

Aerobic respiration is the process of synthesizing large amounts of ATP and it is usually defined by the degradation of glucose. This process has three stages: 1 glycolysis; 2 TCA cycle; 3 oxidative phosphorylation (electron transport chain) [39,40,41]. As shown in Figure 6A, CydAB were down-regulated by LCEO of A. baumannii 17, which indicated that the aerobic respiration activity was slowed.
Pyruvate dehydrogenase complex (PDHC) is a mitochondrial multienzyme complex composed and it holds an important position in pyruvate metabolism pathway. PDHC is A group of rate-limiting enzymes that catalyze irreversible oxidative decarboxylation of pyruvate into acetyl-coA [42,43,44]. PDHC is composed of six enzymes, among which E1, E2 and E3 are the three main subunits of it [45]. As shown in Figure 7A, genes encoding PDHC (E1 component α subunit [EC:1.2.4.1], pyruvate dehydrogenase E2 component (dihydrolipoamide acetyltransferase) [EC:2.3.1.12] and dihydrolipoamide dehydrogenase: subunit E3 [EC:1.8.1.4]) in LCEO-treated A. baumannii 17 were down-regulated compared with that of the control. Also, LCEO has been shown to inhibit the hexose monophophate pathway of S. aureus [11]. These results suggested that LCEO had negative effects on mitochondrial energy metabolism in A. baumannii 17.
In the absence of oxygen, organisms derive energy from the glycolysis which is a preparatory pathway for aerobic oxidation of glucose in most organisms. Gluconeogenesis, in turn, is a synthesis pathway of glucose from non-carbohydrate precursors [46]. The gene expression of glucose-6-phosphate isomerase [EC:5.3.1.9] was down-regulated by LCEO. This enzyme ([EC:5.3.1.9]) catalyzes the reversible reaction among α-D-glucose 6-phosphate, β-D-fructose 6-phosphate and β-D-glucose 6-phosphate. At the same time, gene encoding aldose 1-epimerase [EC:5.1.3.3] that catalyzes the reversible reaction between α-D-glucose and β-D-glucose was down-regulated by LCEO (Figure 7B). These two enzymes are involved in both the glycolysis and gluconeogenesis pathways. Therefore; these results suggested that LCEO influenced the glycolysis/gluconeogenesis pathway of A. baumannii to some extent.
Oxidative phosphorylation is defined as an electron transfer chain driven by substrate oxidation that is coupled to the synthesis of ATP through an electrochemical transmembrane gradient in cytoplasm [47]. As shown in Figure 7C, all the enriched genes were down-regulated in known and relative independent steps. This suggested that the oxidative phosphorylation was also hindered.
We noticed that in Figure 6A, CydAB, PetABC and CycA/Y are controlled by RegAB and RegA is a sensor for sensing redox signals. The present data showed that both oxidative phosphorylation and aerobic respiration were inhibited. Therefore; it was reasonable to believe that LCEO may achieve these inhibitory effects through its reducibility via RegAB.

3.10. DEGs Involved in “Synthesis and Degradation of Ketone Bodies” Pathway

Acetyl-CoA, produced by the β-oxidation of fatty acids and other metabolisms, has another metabolic pathway. Finally, acetoacetic acid, -hydroxybutyric acid and acetone are formed. These three products are collectively called ketone bodies [48]. For bacteria, ketone bodies are a form of carbon and energy storage under nutrient deprivation, especially (R)-3-hydroxybutanoate [49]. However, excessive concentration of ketone bodies can inhibit the growth of bacteria [50]. Here, genes encoding hydroxymethylglutaryl-CoA lyase [EC:4.1.3.4] and 3-hydroxybutyrate dehydrogenase [EC:1.1.1.30] were down-regulated (Figure 8), which indicated that the reversible reaction between acetyl-CoA to (R)-3-hydroxybutanoate slowed down by LCEO. This may result in a decreased energy storage in the A. baumannii 17 treated with LCEO.

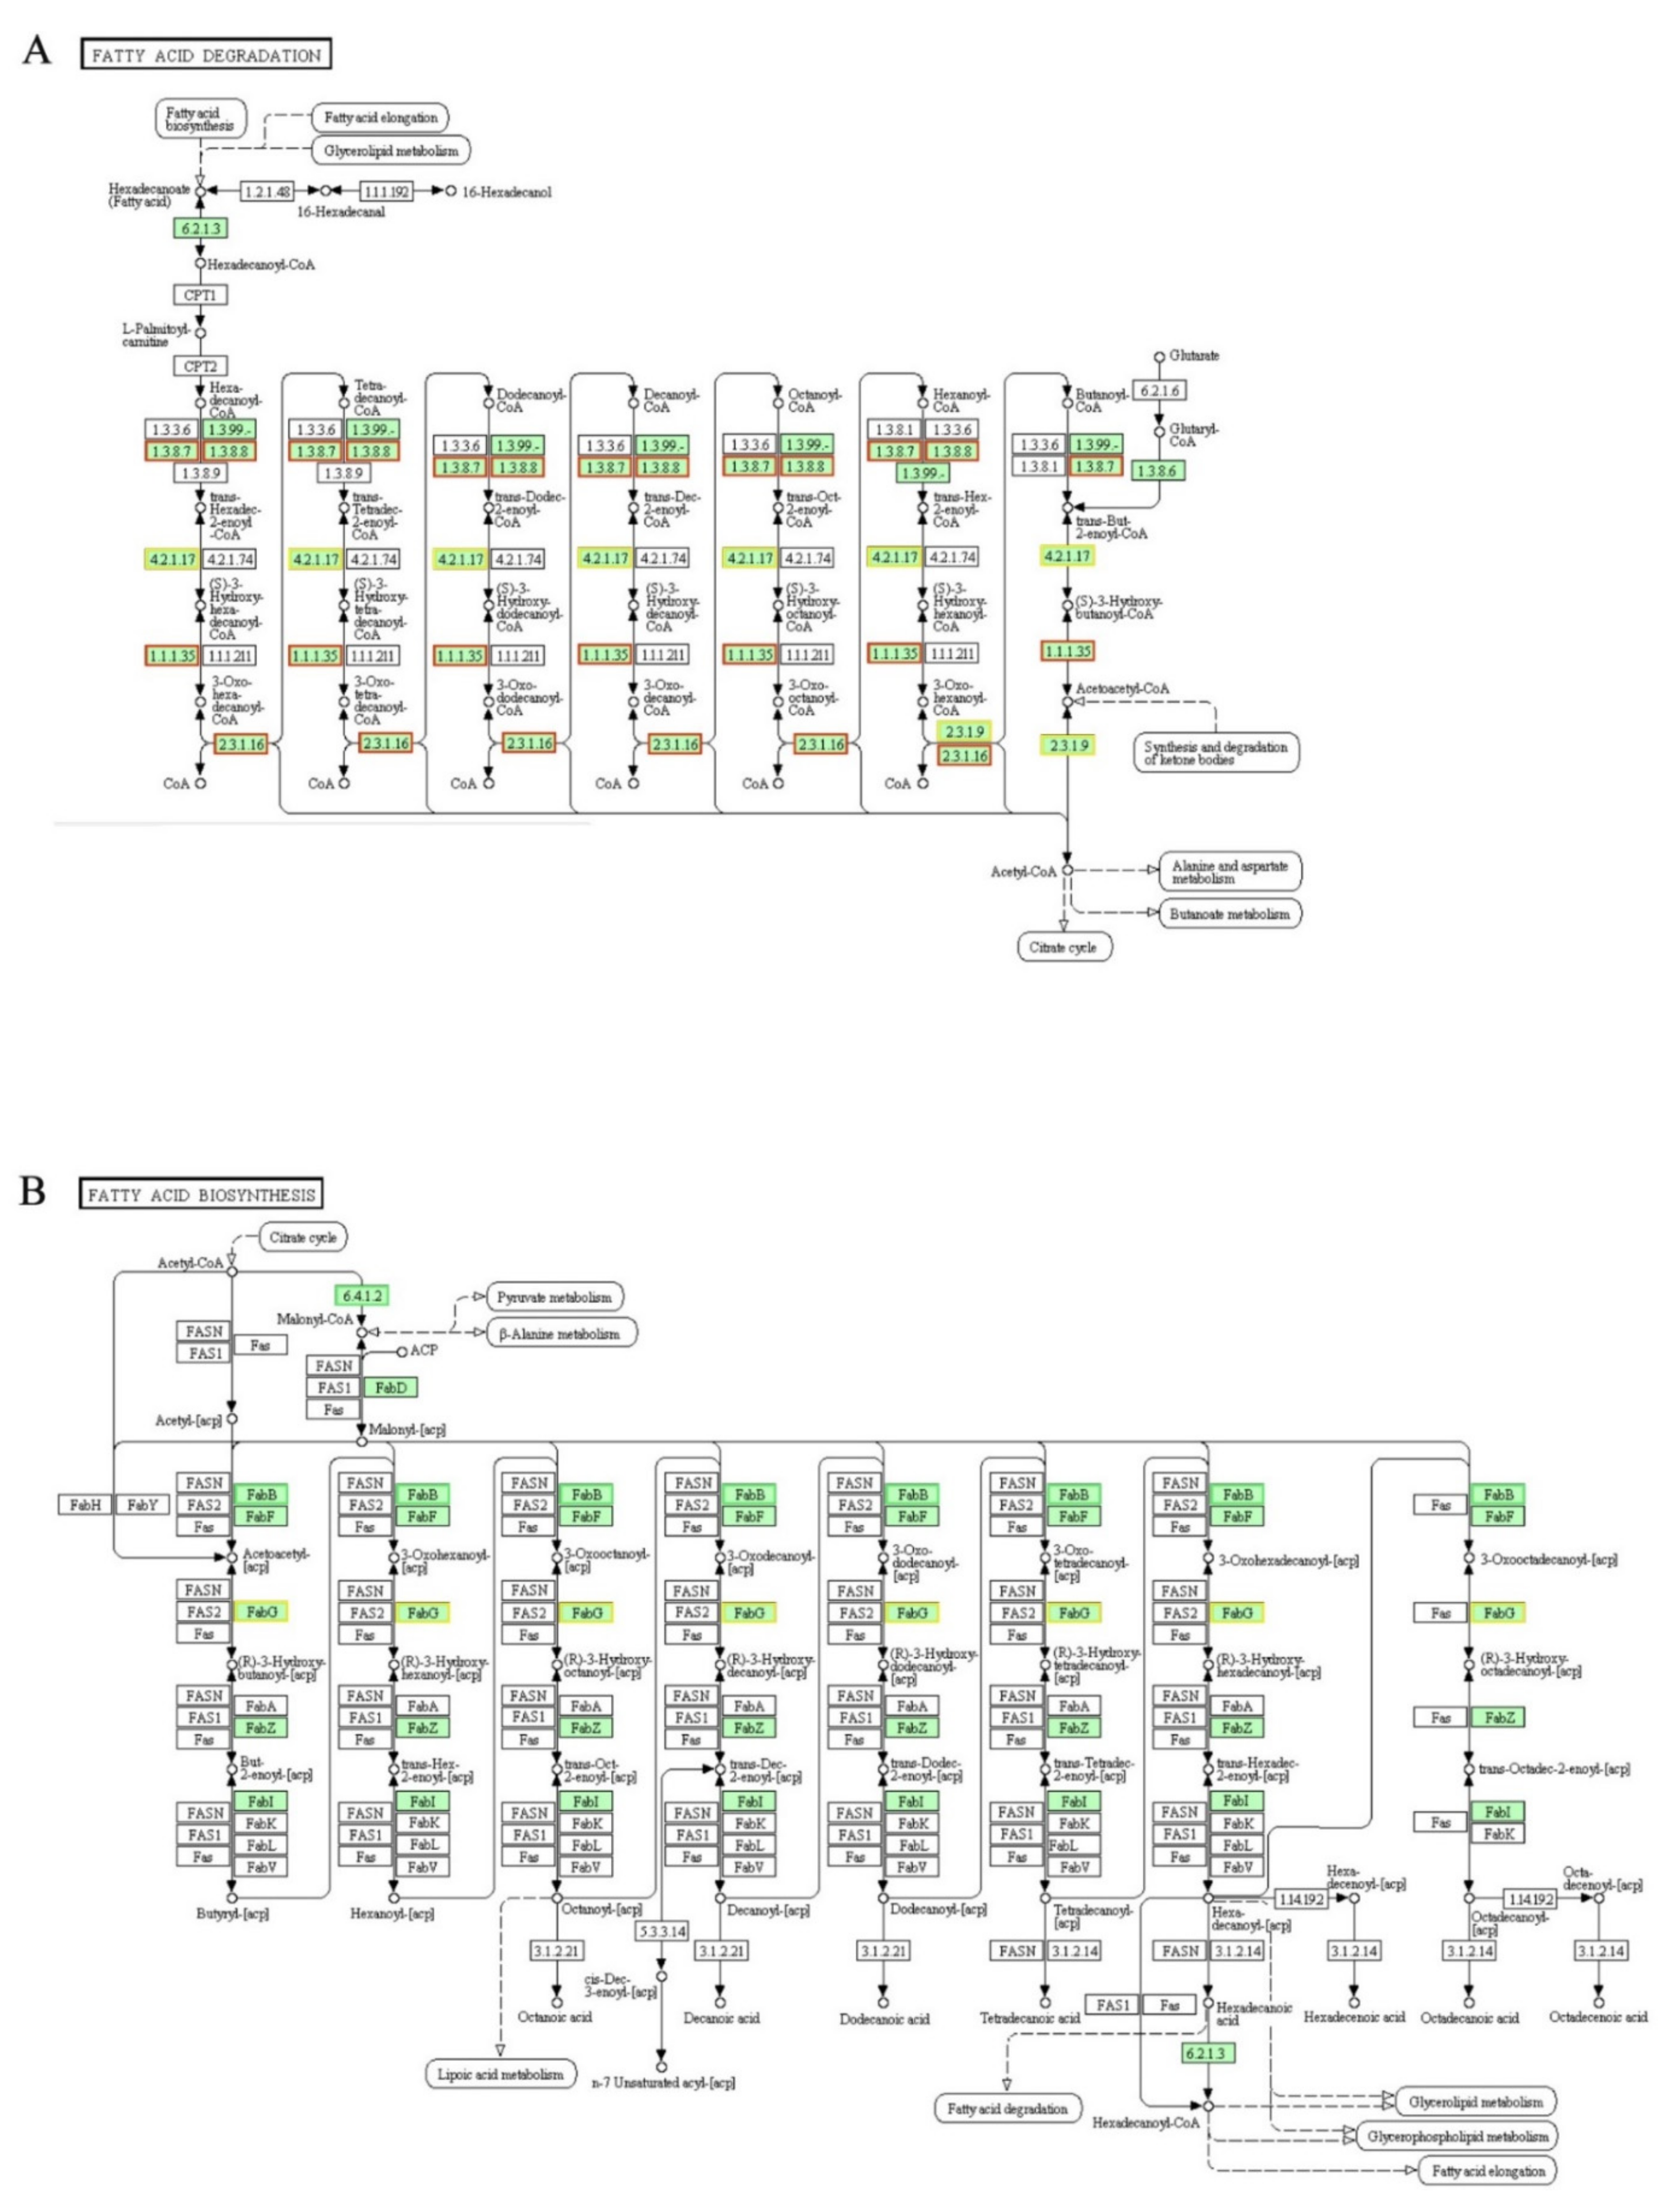
3.11. DEGs Involved in “Fatty Acid Degradation” and “Fatty Acid Biosynthesis” Pathways

The oxidative decomposition (degradation) of fatty acids is one of the important pathways for cells to obtain energy [51]. The fatty acids in cytoplasm are synthesized into hexadecanoyl-CoA by fadE then transported into the mitochondria via carnitine palmitoyl transferase I (CPT1) and CPT2. After seven cycles, hexadecanoyl-CoA is degraded into acetyl-CoA completely. There are four steps (dehydrogenation, hydration, dehydrogenation and transformation) in each cycle, and then a total of 4 mol ATP will be generated by the 2 dehydrogenation procedure in a cycle [51]. In current studies (Figure 9A), genes encoding enzymes (acyl-CoA dehydrogenase [EC:1.3.8.7], long-chain-acyl-CoA dehydrogenase [EC:1.3.8.8], enoyl-CoA hydratase [EC:4.2.1.17], 3-hydroxyacyl-CoA dehydrogenase [EC:1.1.1.35], acetyl-CoA acyltransferase [EC:2.3.1.16]) were up-regulated significantly, which suggested that the fatty acid degradation activity of A. baumannii 17 was increased by LCEO.
In the fatty acid biosynthesis pathway, hexadecanoyl-CoA is biosynthesized by acetyl-CoA by a series of reactions [52]. In Figure 9B, genes encoding proteins (acetyl-CoA carboxylase carboxyl transferase subunit α [EC:6.4.1.2], 3-oxoacyl-[acyl-carrier-protein] synthase I [FabB]) were down-regulated. This suggested that the fatty acid biosynthesis of A. baumannii 17 was slowed by LCEO. The degradation of fatty acid was enhanced while the synthesis of fatty acid was retarded, indicating that the cells were utilizing fatty acids to obtain energy.
Of course, some genes were down-regulated in the fatty acid degradation pathway; and some genes were up-regulated in the fatty acid biosynthesis pathway. However, we still believe that the overall trend was enhanced degradation and retarded biosynthesis of fatty acid. Because 1: in our previous work [19], LCEO caused a significant upregulation of genes related to fatty acid degradation in S. aureus; 2: just a small proportion of genes were down-regulated in the fatty acid degradation pathway and up-regulated in the fatty acid biosynthesis pathway.
From this part, we assumed that LCEO suppressed the aerobic respiration and degradation of amino acid. At the same time, the concentration of ketone bodies used for energy storage was also decreased. In order to survive, A. baumannii 17 increased the activity of fatty acid degradation to obtain energy.

3.12. Cell Membrane Damage and DEGs Involved in “Two-Component System”, “Histidine Metabolism”, “Peptidoglycan Biosynthesis” Pathways

As shown in Figure 10A, the presence of LCEO significantly affected the permeability of cell membranes, which led to the leakage of proteins and nucleic acids. Studies have shown that LCEO is a cell wall-active agent and can cause cell membrane damage of S. aureus [11], and our current results were similar. S. aureus is a Gram-positive bacteria and A. baumannii 17 is a Gram-negative bacteria, which again showed that LCEO has spectral antimicrobial activity [7,53,54,55].
As shown in Figure 6A, the down-regulation of EnvZ (not shown in green frame as the |fold change| = 1.30) and OmpR suggests that the cells were stimulated by osmotic pressure (downshift of K+). This was probably due to damage to the cell membrane by the LCEO.
The importance and location of histidine kinases have been described above. Therefore, it is not difficult to speculate that histidine is particularly important in the repair process when the cell membrane is damaged. As shown in Figure 11A, Gene expression of all the annotated enzymes (histidine ammonia-lyase [EC:4.3.1.3], urocanate hydratase [EC:4.2.1.49], imidazolonepropionase [EC:3.5.2.7], formiminoglutamase [EC:3.5.3.8]) that catalyze the irreversible reactions of L-Histidine to L-Glutamate were significantly down-regulated. At the same time, the gene expression of the enzyme that catalyzes (histidinol dehydrogenase [EC:1.1.1.23]) the irreversible reaction (L-histidinol → L-histidinal → L-histidine) in the final step of histidine-synthesis was slightly up-regulated (not shown in green frame as the |fold change| = 1.28). According to the results of cell contents leakage and RNA-Seq, we hypothesized that: under the stress condition of LCEO, a cell wall stimulus, the amount of histidine in A. baumannii 17 is increased as for the cell membrane and two-component system reparation.
In bacteria, peptidoglycan is one of the building blocks of the cell wall [56]. Here, as shown in Figure 11B, the gene encoding an enzyme (UDP-N-acetylmuramoylalanine--D-glutamate ligase [EC:6.3.2.9]) that catalyzes the irreversible reaction in the early stages of peptidoglycan biosynthesis pathway was up-regulated. A recent report showed that LCEO caused damages to cell membranes of A. baumannii [27]. Therefore; with some related results above, we think that the cell wall of A. baumannii 17 was damaged by the LCEO, so that the bacteria required more peptidoglycan to do the repair work.

3.13. Effects of LCEO on Biofilm Formation and FICI Values

Studies have shown that LCEO affected the biofilm of Borrelia burgdorferi and Candida spp. [54,56]. Therefore, we investigated the effects of different concentrations of LCEO on the biofilm formation of A. baumannii 17. As shown in Figure 10B, the formation of biofilm of A. baumannii 17 was significantly promoted by the extremely low concentration of LCEO (1/4096 to 1/512 MIC). This result was similar to that of Junyan’s report: low level of ampicillin stimulation can accelerate the biofilm formation of S. aureus [57]. However, the biofilm biosynthesis of A. baumannii 17 was significantly reduced by the relatively high concentrations of LCEO (1/64 to 1/2 MIC). Compared to the planktonic bacteria, bacteria in biofilm are more resistant to antibiotics or reactive molecules produced by the host immune system [58]. Thus, at the right concentration, LCEO may be able to promote the efficacy of other combined antimicrobial drug(s).
Therefore, the FICI value was used to evaluate the synergistic growth inhibitory effect of LCEO with antibiotics. Here, we randomly selected some antibiotics (tetracycline, meropenem, chloramphenicol, amikacin, ampicillin, kanamycin, ciprofloxacin, fosfomycin, streptomycin sulfate, ceftiofur) for testing the synergistic growth inhibitory effect with LCEO. As shown in Table 4, synergy and additivity were found when LCEO combined with chloramphenicol and tetracycline on A. baumannii 17, and no antagonistic effect was recorded. This suggested that LCEO has certain potential research value on pathogenic microbial infection.

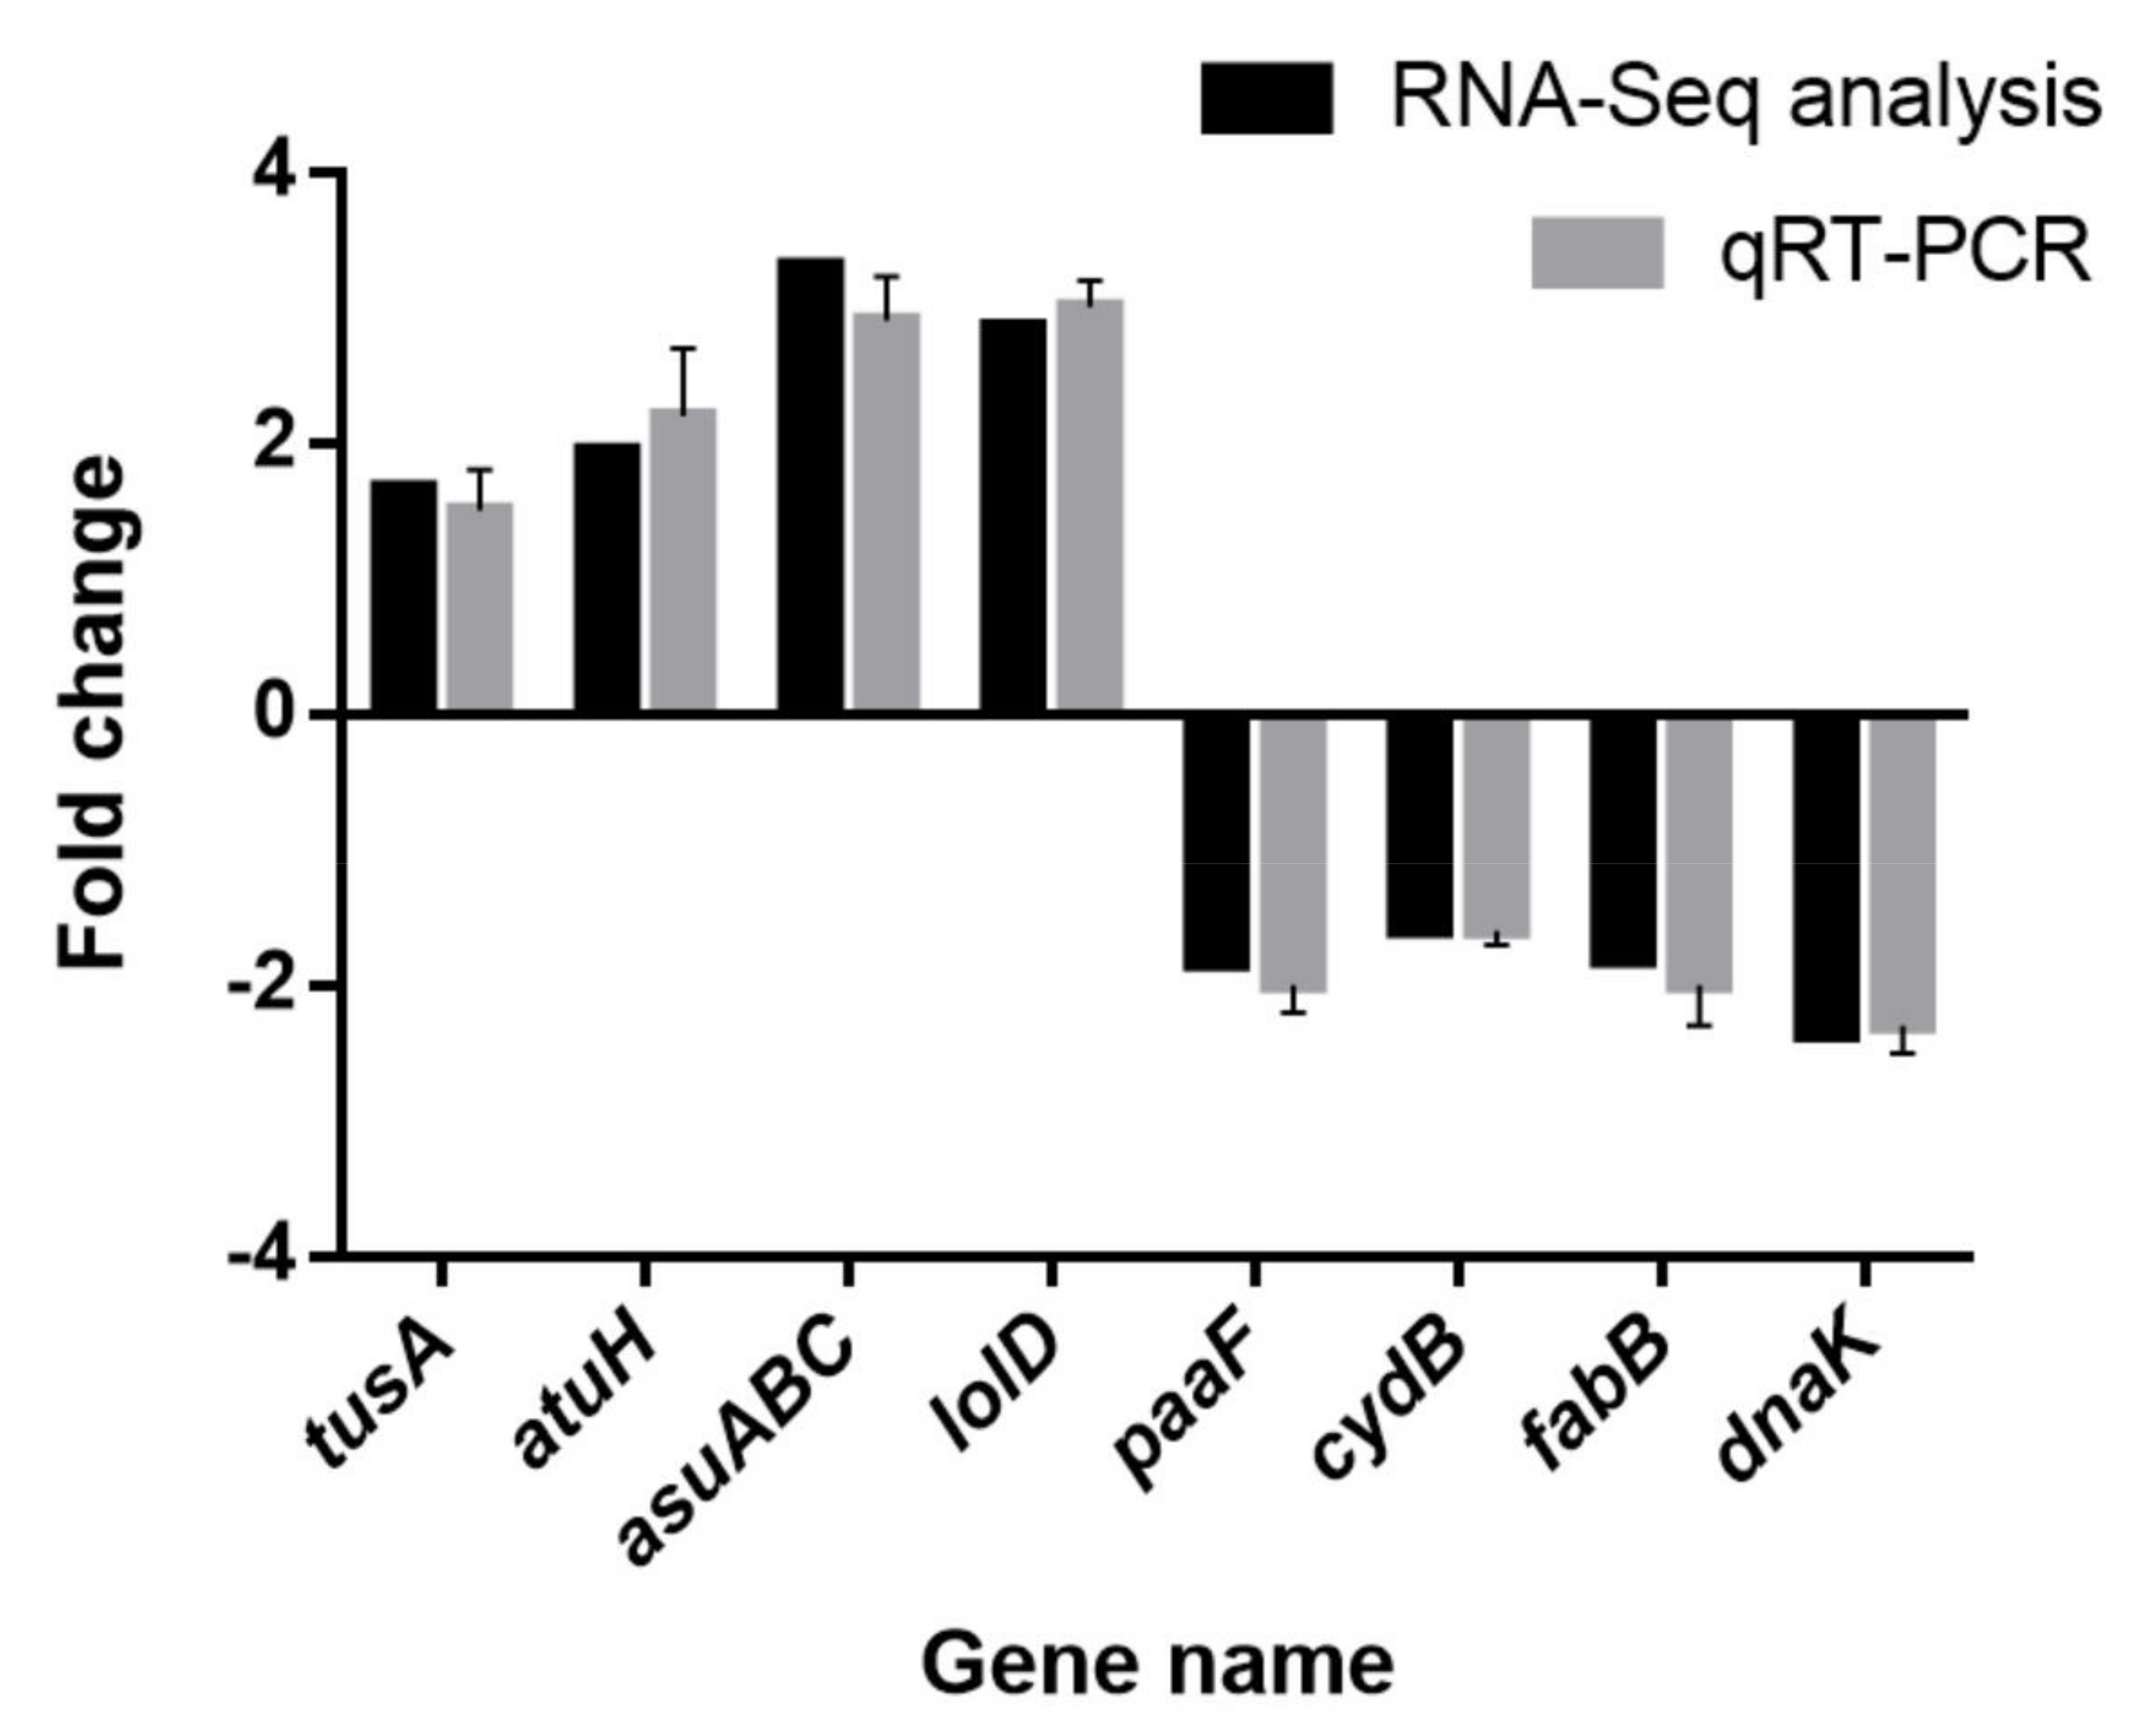
3.14. RT-PCR Validation

The qRT-PCR results of eight DEGs were very similar to those of the transcriptome analysis (Figure 12), indicating that the transcriptome analysis in this work was highly accurate and reliable.

4. Conclusions

Evidence of transcriptomic assays for the stress response of A. baumannii under low concentration of LCEO were reported in the present work; 320/352 DEGs were significantly up/down-regulated in LCEO-treated A. baumannii; 127 DEGs were significantly enriched in three GO terms (oxidation-reduction process; oxidoreductase activity; oxidoreductase activity, acting on the CH-CH group of donors), which indicated that the cell redox state was widely affected by 1/2 MIC of LCEO. LCEO may also inhibit the aerobic respiration, synthesis of ketone bodies and metabolism of some amino acids as well as promote fatty acid degradation of A. baumannii. Therefore, we hypothesized that LCEO, due to its inherent reductivity, extensively affected the redox reaction of cells, thus causing metabolic disorders of bacteria then exerting bacteriostatic effects. The integrity of the cell membrane of A. baumannii was damaged by sub-inhibitory concentration of LCEO. We also founded that the biofilm formation of A. baumannii was promoted/inhibited by extremely low/relatively high concentration of LCEO. LCEO and chloramphenicol have a synergistic growth inhibitory effect against A. baumannii. These results provided evidence that LCEO affects A. baumannii in multiple ways (multiple targets), and expand the knowledge of the stress response of A. baumannii under low concentration of LCEO.

Supplementary Materials

The following are available online at https://www.mdpi.com/article/10.3390/genes12071003/s1, Figure S1: Heatmap; Table S1: Differentially expressed genes; Table S2: GO enrichment; Table S3: KEGG enrichment.

Author Contributions

Y.Y., K.H., M.J., F.U.M., L.G., G.Z. and T.L. contributed equally to this work and share the first authorship. X.W. and H.S. designed this work. All authors have read and agreed to the published version of the manuscript.

Funding

This work was supported by the Science and Technology Major Project of Guangxi (China) (AA17204057), the National Natural Science Foundation of China (31760746), the Key Research and Development Plan of Guangxi (AB19245037) and Innovation and Entrepreneurship Training Program for College Students (Guangxi University) (202010593305).

Institutional Review Board Statement

Not applicable.

Informed Consent Statement

Not applicable.

Data Availability Statement

All datasets generated for this study are included in the article/Supplementary Material. This manuscript and data have not been submitted for possible publication to another journal or that the work has previously been published elsewhere. The raw sequence data reported in this paper have been deposited in the Genome Sequence Archive (Genomics, Proteomics and Bioinformatics 2017) in BIG Data Center (Nucleic Acids Res 2019), Beijing Institute of Genomics (BIG), Chinese Academy of Sciences, under accession numbers CRA003099 that is publicly accessible at https://bigd.big.ac.cn/gsa (accessed on 18 August 2020).

Conflicts of Interest

The authors declare that the research was conducted in the absence of any commercial or financial relationships that could be construed as a potential conflict of interest.

Abbreviations

AbbreviationMeaning
LCLitsea cubeba L.
LCEOLitsea cubeba L. essential oil
MICMinimum Inhibitory Concentration
FICIFractional inhibitory concentration index
KEGGKyoto Encyclopedia of Genes and Genomes
GOGene Ontology
DEGsDifferentially expressed genes
A. baumanniiAcinetobacter baumannii
TCA cycleTricarboxylic acid cycle
TSATryptone soy agar
TSBTryptic soy broth
CFUColony forming units
ODOpioid addiction

References

  1. Liu, T.-T.; Yang, T.-S. Antimicrobial impact of the components of essential oil of Litsea cubeba from Taiwan and antimicrobial activity of the oil in food systems. Int. J. Food Microbiol. 2012, 156, 68–75. [Google Scholar] [CrossRef]
  2. Ho, C.-L.; Jie-Ping, O.; Liu, Y.-C.; Hung, C.-P.; Tsai, M.-C.; Liao, P.-C.; Wang, E.I.-C.; Chen, Y.-L.; Su, Y.-C. Compositions and in vitro Anticancer activities of the Leaf and Fruit Oils of Litsea cubeba from Taiwan. Nat. Prod. Commun. 2010, 5, 617–620. [Google Scholar] [CrossRef] [Green Version]
  3. Chen, Y.; Wang, Y.; Han, X.; Si, L.; Wu, Q.; Lin, L. Biology and chemistry ofLitsea cubeba, a promising industrial tree in China. J. Essent. Oil Res. 2013, 25, 103–111. [Google Scholar] [CrossRef]
  4. Van Nguyen, H.; Caruso, D.; Lebrun, M.; Nguyen, N.T.; Trinh, T.T.; Meile, J.; Chu, S.K.; Sarter, S. Antibacterial activity of Litsea cubeba (Lauraceae, May Chang) and its effects on the biological response of common carp Cyprinus carpio challenged with Aeromonas hydrophila. J. Appl. Microbiol. 2016, 121, 341–351. [Google Scholar] [CrossRef] [Green Version]
  5. Wang, Y.; Jiang, Z.-T.; Li, R. Complexation and molecular microcapsules of Litsea cubeba essential oil with β-cyclodextrin and its derivatives. Eur. Food Res. Technol. 2009, 228, 865–873. [Google Scholar] [CrossRef]
  6. Zhili, J.; Yasmin, A.; Rod, B.; Xing, Z.; Isman, M.B. Comparative toxicity of essential oils of Litsea pungens and Litsea cubeba and blends of their major constituents against the cabbage looper, Trichoplusia ni. J. Agric. Food Chem. 2009, 57, 4833–4837. [Google Scholar] [CrossRef]
  7. She, Q.-H.; Li, W.-S.; Jiang, Y.-Y.; Wu, Y.-C.; Zhou, Y.-H.; Zhang, L. Chemical composition, antimicrobial activity and antioxidant activity of Litsea cubeba essential oils in different months. Nat. Prod. Res. 2020, 34, 3285–3288. [Google Scholar] [CrossRef] [PubMed]
  8. Hwang, J.-K.; Choi, E.-M.; Lee, J.H. Antioxidant activity of Litsea cubeba. Fitoterapia 2005, 76, 684–686. [Google Scholar] [CrossRef]
  9. Seo, S.-M.; Kim, J.; Lee, S.-G.; Shin, C.-H.; Shin, S.-C.; Park, I.-K. Fumigant Antitermitic Activity of Plant Essential Oils and Components from Ajowan (Trachyspermum ammi), Allspice (Pimenta dioica), Caraway (Carum carvi), Dill (Anethum graveolens), Geranium (Pelargonium graveolens), and Litsea (Litsea cubeba) Oils against Japanese Termite (Reticulitermes speratus Kolbe). J. Agric. Food Chem. 2009, 57, 6596–6602. [Google Scholar] [CrossRef] [PubMed]
  10. Wang, H.; Liu, Y. Chemical Composition and Antibacterial Activity of Essential Oils from Different Parts ofLitsea cubeba. Chem. Biodivers. 2010, 7, 229–235. [Google Scholar] [CrossRef]
  11. Hu, W.; Li, C.; Dai, J.; Cui, H.; Lin, L. Antibacterial activity and mechanism of Litsea cubeba essential oil against methicillin-resistant Staphylococcus aureus (MRSA). Ind. Crops Prod. 2019, 130, 34–41. [Google Scholar] [CrossRef]
  12. Li, W.-R.; Shi, Q.-S.; Liang, Q.; Xie, X.-B.; Huang, X.-M.; Chen, Y.-B. Antibacterial Activity and Kinetics of Litsea cubeba Oil on Escherichia coli. PLoS ONE 2014, 9, e110983. [Google Scholar] [CrossRef] [PubMed]
  13. Nguyen, H.; Lebrun, M.; Caruso, D.; Chu-Ky, S.; Sarter, S.; Van Nguyen, H.; Meile, J.-C. Litsea cubeba leaf essential oil from Vietnam: Chemical diversity and its impacts on antibacterial activity. Lett. Appl. Microbiol. 2018, 66, 207–214. [Google Scholar] [CrossRef] [PubMed]
  14. Guardabassi, L.; Dalsgaard, A.; Olsen, J.E. Phenotypic characterization and antibiotic resistance of Acinetobacter spp. isolated from aquatic sources. J. Appl. Microbiol. 1999, 87, 659–667. [Google Scholar] [CrossRef]
  15. Antunes, L.C.; Visca, P.; Towner, K.J. Acinetobacter baumannii: Evolution of a global pathogen. Pathog. Dis. 2014, 71, 292–301. [Google Scholar] [CrossRef] [PubMed] [Green Version]
  16. Zurawski, D.V.; Banerjee, J.; Alamneh, Y.A.; Shearer, J.P.; Demons, S.T. Skin and Soft Tissue Models for Acinetobacter baumannii Infection. Methods Mol. Biol. 2019, 271–287. [Google Scholar] [CrossRef]
  17. Lee, C.-R.; Lee, J.H.; Park, M.; Park, K.S.; Bae, I.K.; Kim, Y.B.; Cha, C.-J.; Jeong, B.C.; Lee, S.H. Biology of Acinetobacter baumannii: Pathogenesis, Antibiotic Resistance Mechanisms, and Prospective Treatment Options. Front. Cell. Infect. Microbiol. 2017, 7, 55. [Google Scholar] [CrossRef] [Green Version]
  18. Adukwu, E.C.; Bowles, M.; Edwards-Jones, V.; Bone, H. Antimicrobial activity, cytotoxicity and chemical analysis of lemongrass essential oil (Cymbopogon flexuosus) and pure citral. Appl. Microbiol. Biotechnol. 2016, 100, 9619–9627. [Google Scholar] [CrossRef] [Green Version]
  19. Yang, Y.; Chen, Y.; Zhang, G.; Sun, J.; Guo, L.; Jiang, M.; Ou, B.; Zhang, W.; Si, H. Transcriptomic Analysis of Staphylococcus aureus Under the Stress Condition Caused by Litsea cubeba L. Essential Oil via RNA Sequencing. Front. Microbiol. 2020, 11. [Google Scholar] [CrossRef]
  20. Yang, Y.; Guo, L.; Tariq, K.; Zhang, W.; Li, C.; Memon, F.Q.; Chai, B.; Li, Z.; Sun, J.; Chen, Y.; et al. The Antioxidant Polysaccharide from Semiaquilegia adoxoides (DC.) Makino Adjusts the Immune Response of Mice Infected by Bacteria. Evid. Based Complement. Altern. Med. 2020, 2020, 1–8. [Google Scholar] [CrossRef] [PubMed] [Green Version]
  21. Li, Y.; Pan, J.; Ye, G.; Zhang, Q.; Wang, J.; Zhang, J.; Fang, J. In vitro studies of the antimicrobial effect of non-thermal plasma-activated water as a novel mouthwash. Eur. J. Oral Sci. 2017, 125, 463–470. [Google Scholar] [CrossRef] [PubMed]
  22. Gonçalves, L.N.C.; Costa-Orlandi, C.B.; Bila, N.M.; Vaso, C.O.; Da Silva, R.A.M.; Mendes-Giannini, M.J.S.; Taylor, M.L.; Fusco-Almeida, A.M. Biofilm Formation by Histoplasma capsulatum in Different Culture Media and Oxygen Atmospheres. Front. Microbiol. 2020, 11, 1455. [Google Scholar] [CrossRef]
  23. Guo, N.; Ling, G.; Liang, X.; Jin, J.; Fan, J.; Qiu, J.; Song, Y.; Huang, N.; Wu, X.; Wang, X.; et al. In vitro synergy of pseudolaric acid B and fluconazole against clinical isolates of Candida albicans. Mycoses 2010, 54, e400–e406. [Google Scholar] [CrossRef]
  24. Li, Z.; Yin, H.; Chen, W.; Jiang, C.; Hu, J.; Xue, Y.; Yao, D.; Peng, Y.; Hu, X. Synergistic Effect of Pseudolaric Acid B with Fluconazole Against Resistant Isolates and Biofilm of Candida tropicalis. Infect. Drug Resist. 2020, 13, 2733–2743. [Google Scholar] [CrossRef]
  25. Moghimi, R.; Aliahmadi, A.; Rafati, H. Ultrasonic nanoemulsification of food grade trans-cinnamaldehyde: 1,8-Cineol and investigation of the mechanism of antibacterial activity. Ultrason. Sonochem. 2017, 35, 415–421. [Google Scholar] [CrossRef] [PubMed]
  26. Terjung, N.; Löffler, M.; Gibis, M.; Hinrichs, J.; Weiss, J. Influence of droplet size on the efficacy of oil-in-water emulsions loaded with phenolic antimicrobials. Food Funct. 2012, 3, 290–301. [Google Scholar] [CrossRef] [PubMed]
  27. Hao, K.; Xu, B.; Zhang, G.; Lv, F.; Wang, Y.; Ma, M.; Si, H. Antibacterial Activity and Mechanism of Litsea cubeba L. Essential Oil Against Acinetobacter baumannii. Nat. Prod. Commun. 2021, 16. [Google Scholar] [CrossRef]
  28. Zheng, K.; Li, W.; Fu, B.; Fu, M.; Ren, Q.; Yang, F.; Qin, C. Physical, antibacterial and antioxidant properties of chitosan films containing hardleaf oatchestnut starch and Litsea cubeba oil. Int. J. Biol. Macromol. 2018, 118, 707–715. [Google Scholar] [CrossRef]
  29. Nakagami, K. [Studies on the shunt pathway of TCA cycle in avian type of tubercle bacillus. I. Citrate degradation]. Kekkaku [Tuberculosis] 1957, 32, 547–550. [Google Scholar]
  30. Atkinson, D.E. Citrate and the citrate cycle in the regulation of energy metabolism. Biochem. Soc. Symp. 1968, 27, 23–40. [Google Scholar]
  31. Goel, A.; Domach, M.M.; Hanley, W.; Lee, J.W.; Ataai, M.M. Coordination of Glycolysis and TCA Cycle Reaction Networks. Ann. N. Y. Acad. Sci. 1996, 782, 1–16. [Google Scholar] [CrossRef]
  32. Fukuchi, K.; Kasahara, Y.; Asai, K.; Kobayashi, K.; Moriya, S.; Ogasawara, N. The essential two-component regulatory system encoded by yycF and yycG modulates expression of the ftsAZ operon in Bacillus subtilis. Microbiology 2000, 146, 1573–1583. [Google Scholar] [CrossRef] [Green Version]
  33. Pallegar, P.; Canuti, M.; Langille, E.; Peña-Castillo, L.; Lang, A.S. A Two-Component System Acquired by Horizontal Gene Transfer Modulates Gene Transfer and Motility via Cyclic Dimeric GMP. J. Mol. Biol. 2020, 432, 4840–4855. [Google Scholar] [CrossRef]
  34. Loessner, M.J.; Gaeng, S.; Wendlinger, G.; Maier, S.K.; Scherer, S. The two-component lysis system ofStaphylococcus aureusbacteriophage Twort: A large TTG-start holin and an associated amidase endolysin. FEMS Microbiol. Lett. 1998, 162, 265–274. [Google Scholar] [CrossRef]
  35. Stibftz, S.; Aaronson, W.; Monackt, D.; Falkowt, S. Phase variation in Bordetella pertussis by frameshift mutation in a gene for a novel two-component system. Nat. Cell Biol. 1989, 338, 266–269. [Google Scholar] [CrossRef] [PubMed]
  36. Meador, W.E.; Quiocho, F.A. Preliminary crystallographic data for a leucine, isoleucine, valine-binding protein from Escherichia coli K12. J. Mol. Biol. 1978, 123, 485–498. [Google Scholar] [CrossRef]
  37. Block, K.; Harper, A. Valine metabolism in vivo: Effects of high dietary levels of leucine and isoleucine. Metabolism 1984, 33, 559–566. [Google Scholar] [CrossRef]
  38. Teufel, R.; Mascaraque, V.; Ismail, W.; Voss, M.; Perera, J.; Eisenreich, W.; Haehnel, W.; Fuchs, G. Bacterial phenylalanine and phenylacetate catabolic pathway revealed. Proc. Natl. Acad. Sci. USA 2010, 107, 14390–14395. [Google Scholar] [CrossRef] [PubMed] [Green Version]
  39. Trchounian, A.; Ohanjanyan, Y.; Bagramyan, K.; Vardanian, V.; Zakharyan, E.; Vassilian, A.; Davtian, M. Relationship of the Escherichia coli TrkA system of potassium ion uptake with the F0F1-ATPase under growth conditions without anaerobic or aerobic respiration. Biosci. Rep. 1998, 18, 143–154. [Google Scholar] [CrossRef]
  40. Tran, Q.H.; Unden, G. Changes in the proton potential and the cellular energetics of Escherichia coli during growth by aerobic and anaerobic respiration or by fermentation. JBIC J. Biol. Inorg. Chem. 1998, 251, 538–543. [Google Scholar] [CrossRef] [PubMed]
  41. Zhang, X.; Hulett, F.M. ResD signal transduction regulator of aerobic respiration in Bacillus subtilis: CtaA promoter regulation. Mol. Microbiol. 2000, 37, 1208–1219. [Google Scholar] [CrossRef] [PubMed]
  42. Guest, J.R.; Angier, S.J.; Russell, G.C. Structure, Expression, and Protein Engineering of the Pyruvate Dehydrogenase Complex of Escherichia coli. Ann. N. Y. Acad. Sci. 1989, 573, 76–99. [Google Scholar] [CrossRef] [PubMed]
  43. Sugden, M.C.; Holness, M.J. The Role of Regulation of Tissue Pyruvate Dehydrogenase Complex Activity during the Starved-to-Fed Transition. Ann. N. Y. Acad. Sci. 1989, 573, 314–336. [Google Scholar] [CrossRef]
  44. Gol’dshtein, B.N.; Kornilov, V.V. Symmetry-regulated dynamics of multi-enzyme complexes. A model of a pyruvate dehydrogenase complex from Escherichia coli. Mol. Biol. 1988, 22, 538–548. [Google Scholar]
  45. Dallo, S.F.; Kannan, T.R.; Blaylock, M.W.; Baseman, J.B. Elongation factor Tu and E1 β subunit of pyruvate dehydrogenase complex act as fibronectin binding proteins in Mycoplasma pneumoniae. Mol. Microbiol. 2002, 46, 1041–1051. [Google Scholar] [CrossRef] [PubMed]
  46. Kinoshita, J.; Kawamori, R. Gluconeogenesis and glycolysis. Nihon Rinsho Jpn. J. Clin. Med. 2002, 60, 121–128. [Google Scholar]
  47. Gibson, F. The introduction of Escherichia coli and biochemical genetics to the study of oxidative phosphorylation. Trends Biochem. Sci. 2000, 25, 342–344. [Google Scholar] [CrossRef]
  48. Fukao, T.; Mitchell, G.; Sass, J.O.; Hori, T.; Orii, K.; Aoyama, Y. Ketone body metabolism and its defects. J. Inherit. Metab. Dis. 2014, 37, 541–551. [Google Scholar] [CrossRef]
  49. Lundgren, B.R.; Harris, J.R.; Scheel, R.A.; Sarwar, Z.; Nomura, C.T. The metabolism of (R)-3-hydroxybutyrate is regulated by the enhancer-binding protein PA2005 and the alternative sigma factor RpoN in Pseudomonas aeruginosa PAO1. Microbiology 2015, 161, 2232–2242. [Google Scholar] [CrossRef]
  50. Potezny, N.; Atkinson, E.R.; Rofe, A.M.; Conyers, R.A. The inhibition of bacterial cell growth by ketone bodies. Aust. J. Exp. Biol. Med. Sci. 1981, 59, 639–649. [Google Scholar] [CrossRef]
  51. Parekh, V.R.; Traxler, R.W.; Sobek, J.M. N-Alkane oxidation enzymes of a pseudomonad. Appl. Environ. Microbiol. 1977, 33, 881–884. [Google Scholar] [CrossRef] [PubMed] [Green Version]
  52. Venkatesan, R.; Sah-Teli, S.K.; Awoniyi, L.O.; Jiang, G.; Prus, P.; Kastaniotis, A.J.; Hiltunen, J.K.; Wierenga, R.K.; Chen, Z. Insights into mitochondrial fatty acid synthesis from the structure of heterotetrameric 3-ketoacyl-ACP reductase/3R-hydroxyacyl-CoA dehydrogenase. Nat. Commun. 2014, 5, 4805. [Google Scholar] [CrossRef] [PubMed]
  53. Pedroso, R.D.S.; Balbino, B.L.; Andrade, G.; Dias, M.C.P.S.; Alvarenga, T.A.; Pedroso, R.C.N.; Pimenta, L.P.; Lucarini, R.; Pauletti, P.M.; Januário, A.H.; et al. In Vitro and In Vivo Anti-Candida spp. Activity of Plant-Derived Products. Plants 2019, 8, 494. [Google Scholar] [CrossRef] [PubMed] [Green Version]
  54. Krzyśko-Łupicka, T.; Sokół, S.; Piekarska-Stachowiak, A.A. Evaluation of Fungistatic Activity of Eight Selected Essential Oils on Four Heterogeneous Fusarium Isolates Obtained from Cereal Grains in Southern Poland. Molecules 2020, 25, 292. [Google Scholar] [CrossRef] [PubMed] [Green Version]
  55. Feng, J.; Shi, W.; Miklossy, J.; Tauxe, G.M.; McMeniman, C.J.; Zhang, Y. Identification of Essential Oils with Strong Activity against Stationary Phase Borrelia burgdorferi. Antibiotics 2018, 7, 89. [Google Scholar] [CrossRef] [Green Version]
  56. Van Heijenoort, J. Recent advances in the formation of the bacterial peptidoglycan monomer unit (1985 to 2000). Nat. Prod. Rep. 2001, 18, 503–519. [Google Scholar] [CrossRef]
  57. Liu, J.; Yang, L.; Hou, Y.; Soteyome, T.; Zeng, B.; Su, J.; Li, L.; Li, B.; Chen, D.; Li, Y.; et al. Transcriptomics Study on Staphylococcus aureus Biofilm Under Low Concentration of Ampicillin. Front. Microbiol. 2018, 9, 2413. [Google Scholar] [CrossRef] [Green Version]
  58. Rabin, N.; Zheng, Y.; Opoku-Temeng, C.; Du, Y.; Bonsu, E.; O Sintim, H. Biofilm formation mechanisms and targets for developing antibiofilm agents. Futur. Med. Chem. 2015, 7, 493–512. [Google Scholar] [CrossRef] [PubMed]
Figure 1. Growth curve (A) and time kill curve (B) assay of LCEO on A. baumannii 17. In tween 80 and LCEO (1 MIC) group, they had the same concentration (1.08 mg/mL) of tween 80.
Genes 12 01003 g001
Figure 2. Differential expression level of LCEO-treated (AB_LCEO_treated) and non-treated A. baumannii(Control) groups identified by |fold change| > 1.5 and p-value < 0.05.
Genes 12 01003 g002
Figure 3. Significantly enriched Gene Ontology (GO) terms of differentially expressed genes. BP: biological process, CC: cellular component, MF: molecular function.
Genes 12 01003 g003
Figure 4. Significantly enriched Kyoto Encyclopedia of Genes and Genomes (KEGG) pathways of differentially expressed genes.
Genes 12 01003 g004
Figure 5. Significantly enriched KEGG pathway “Citrate cycle (TCA cycle)”; (from KEGG database, green rectangles represent proved organism-specific gene product and green frames represent down-regulation and red frames represent up-regulation).
Genes 12 01003 g005
Figure 6. Significantly enriched KEGG pathway “Two-component system” (A), “Valine, leucine and isoleucine degradation” (B), “Tyrosine metabolism” (C) and “Phenylalanine metabolism” (D); (from KEGG database, green rectangles represent proved Organism-specific gene product and green frames represent down-regulation and red frames represent up-regulation).
Genes 12 01003 g006
Figure 7. Significantly enriched KEGG pathway “Pyruvate metabolism” (A), “Glycolysis / Gluconeogenesis” (B) and “Oxidative phosphorylation” (C); (from KEGG database, green rectangles represent proved Organism-specific gene product and green frames represent down-regulation and red frames represent up-regulation).
Genes 12 01003 g007
Figure 8. Significantly enriched KEGG pathway “Synthesis and degradation of ketone bodies”; (from KEGG database, green rectangles represent proved Organism-specific gene product and green frames represent down-regulation and red frames represent up-regulation).
Genes 12 01003 g008
Figure 9. Significantly enriched KEGG pathway “Fatty acid degradation” (A) and “Fatty acid biosynthesis” (B); (from KEGG database, green rectangles represent proved Organism-specific gene product and green frames represent down-regulation and red frames represent up-regulation).
Genes 12 01003 g009
Figure 10. Effects of different concentrations of LCEO on intracellular DNA and protein leakages (A) and biofilm biosynthesis (B) of A. baumannii 17. OD260, OD280 and OD450 value represent the levels of intracellular DNA leakages, intracellular protein leakages and biofilm biosynthesis in different groups, respectively. Note: The data represent the means ± standard deviation of the results. The “*” on the top of a data column indicates a significant difference between this group and the control group (p < 0.05).
Genes 12 01003 g010
Figure 11. Significantly enriched KEGG pathway “Histidine metabolism” (A) and “Peptidoglycan biosynthesis” (B); (from KEGG database, green rectangles represent proved Organism-specific gene product and green frames represent down-regulation and red frames represent up-regulation, yellow frames represent both down and up-regulation).
Genes 12 01003 g011
Figure 12. Validation of RNA sequencing data by quantitative real-time PCR. Note: The data represent the means ± standard deviation of the results.
Genes 12 01003 g012
Table 1. Chemical compositions of L. cubeba essential oil (LCEO).
CompositionRatio (%)
α-Citral38.28
β-Citral29.29
Cinene16.5348
Eudesmol2.56
Citronellal2.2383
Trans-Verbenol2.06
Aromatic alcohol1.86
β-Pinene1.5104
Cis-Verbenol1.3771
α-Vinyl acetate1.0945
Geraniol0.93
α-Pinene0.7307
2-Methyl-2-Hexen-6-One0.6994
Table 2. Primer sequences used for quantitative real-time polymerase chain reaction (RT-PCR).
Gene NamePrimer Sequence (5′->3′)NCBI-Protein IDProducts (Base Pairs)
tusAAGATGTTGTTGAAGTGTT
CCAGATAACGGTATTCTT
ABO10836137
atuHAATGATTGGTAATGGTATG
AACTGGATAATGGCATAT
ABO10859174
asuABCGGAGTGATGATGCTAGGT
TAGAATAGGAAGGATGCCATA
ABO1052596
lolDAGCAGACAGTCAATATAAGT
GGTCCATACGATGAGATAG
ABO1302880
paaFAAGAAGAATTACTTGAACA
TATTGAATGGAACATACG
ABO10593150
cydBAATATCATTCCACCATCA
ATAACCTTCATCACCTAC
ABO11861165
fabBGGAACGAGTTGTCATCAC
GTTATAGCGAATGCCAGAG
ABO10573106
dnaKTCTACTGCTGCTGATAAC
GATGTCACCTAACTGGAA
ABO13363108
Table 3. Minimum inhibitory concentration (MIC) values (mg/mL) of tested components on A. baumannii strains.
ComponentA. baumannii 4A. baumannii 20A. baumannii 17
Ceftriaxone Sodium3.21.60.8
Amoxicillin0.80.81.6
Berberine0.00156250.0031250.003125
Neomycin0.40.23.2
Levofloxacin0.01250.0250.025
Fosfomycin3.23.20.4
Colistin0.00156250.00156250.0015625
Mequindox0.10.20.1
Clinfloxacin0.0250.0250.025
Sulfamonomethoxine6.46.43.2
Gatifloxacin0.0031250.0250.025
Amikacin0.86.43.2
Ceftazidime0.20.0250.1
Lincomycin0.40.43.2
Ceftiofur Sodium3.20.80.4
Florfenicol0.320.160.32
Azithromycin0.80.43.2
Cefotaxime Sodium0.01250.20.1
Rifampin0.01250.050.025
Meropenem0.20.10.2
Ceftriaxone Sodium3.21.60.8
LCEO1.081.081.08
Tween 80>108>108>108
Table 4. Fractional Inhibitory Concentration Index (FICI) values of LCEO with some antibiotics on A. baumannii 17.
DrugsMIC AloneMIC CombinedFICIInterpretation
LCEO1.08 mg/mL0.27 mg/mL0.75ADD
Tetracycline1.28 mg/mL0.64 mg/mL
LCEO1.08 mg/mL0.27 mg/mL1.25IND
Meropenem0.32 mg/mL0.32 mg/mL
LCEO1.08 mg/mL0.27 mg/mL0.375SYN
Chloramphenicol0.32 mg/mL0.04 mg/mL
LCEO1.08 mg/mL0.27 mg/mL1.25IND
Amikacin1.28 mg/mL1.28 mg/mL
LCEO1.08 mg/mL1.08 mg/mL2IND
Ampicillin0.32 mg/mL0.32 mg/mL
LCEO1.08 mg/mL1.08 mg/mL2IND
Kanamycin0.32 mg/mL0.32 mg/mL
LCEO1.08 mg/mL0.27 mg/mL1.25IND
Ciprofloxacin0.64 mg/mL0.64 mg/mL
LCEO1.08 mg/mL0.54 mg/mL1.5IND
Fosfomycin0.64 mg/mL0.64 mg/mL
LCEO1.08 mg/mL1.08 mg/mL2IND
Streptomycin sulfate1.28 mg/mL1.28 mg/mL
LCEO1.08 mg/mL0.54 mg/mL2.5IND
Ceftiofur0.64 mg/mL1.28 mg/mL
Notes: Relationship between FICI values and drug combinations: synergy (SYN): <0.5; additivity (ADD): 0.5–1; indifference (IND): >1–4; and antagonism (ANT): >4.
Publisher’s Note: MDPI stays neutral with regard to jurisdictional claims in published maps and institutional affiliations.

