
Genomewide Association Analyses of Lactation Persistency and Milk Production Traits in Holstein Cattle Based on Imputed Whole-Genome Sequence Data


 , , ,
, , ,
Abstract
1. Introduction
2. Materials and Methods
2.1. Animals and Phenotypes
2.2. iWGS and Genomic Quality Control
2.3. Association Analyses, Statistical Models, and Significance Testing
2.4. Functional Genomic Analyses
3. Results
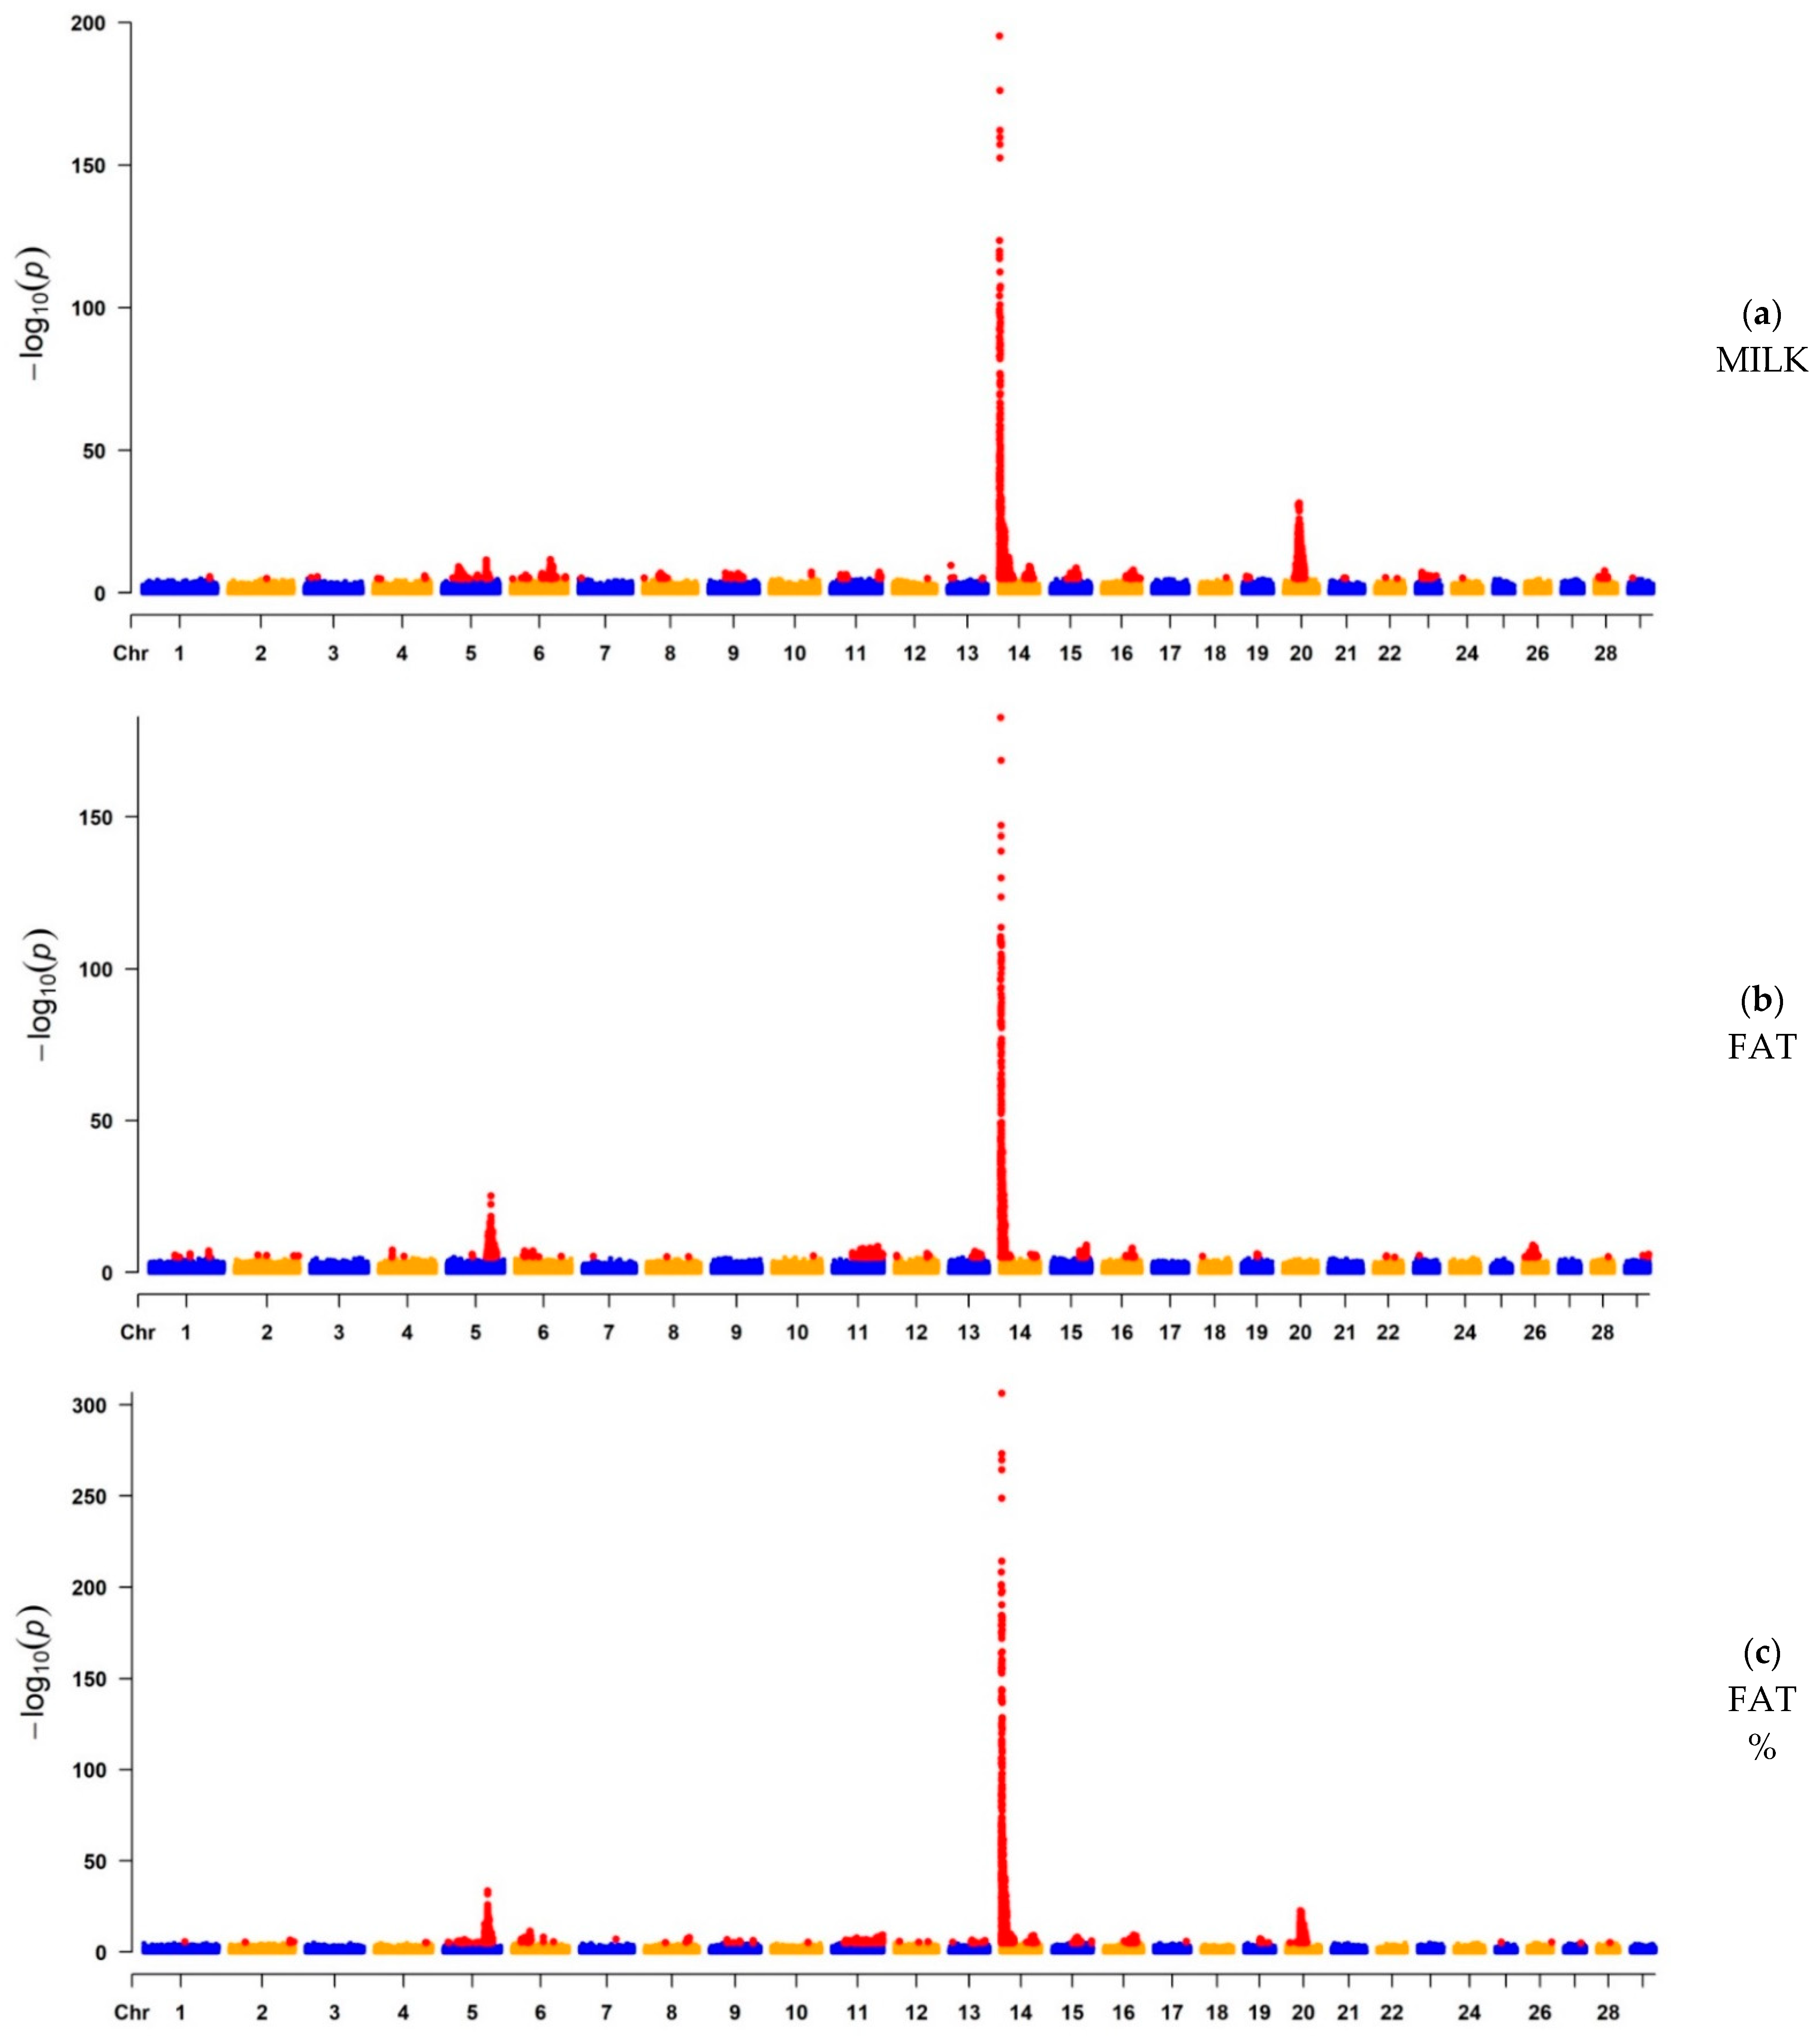
3.1. GWAS
3.1.1. GWAS for Milk Yield, Fat Yield, and Fat Percentage
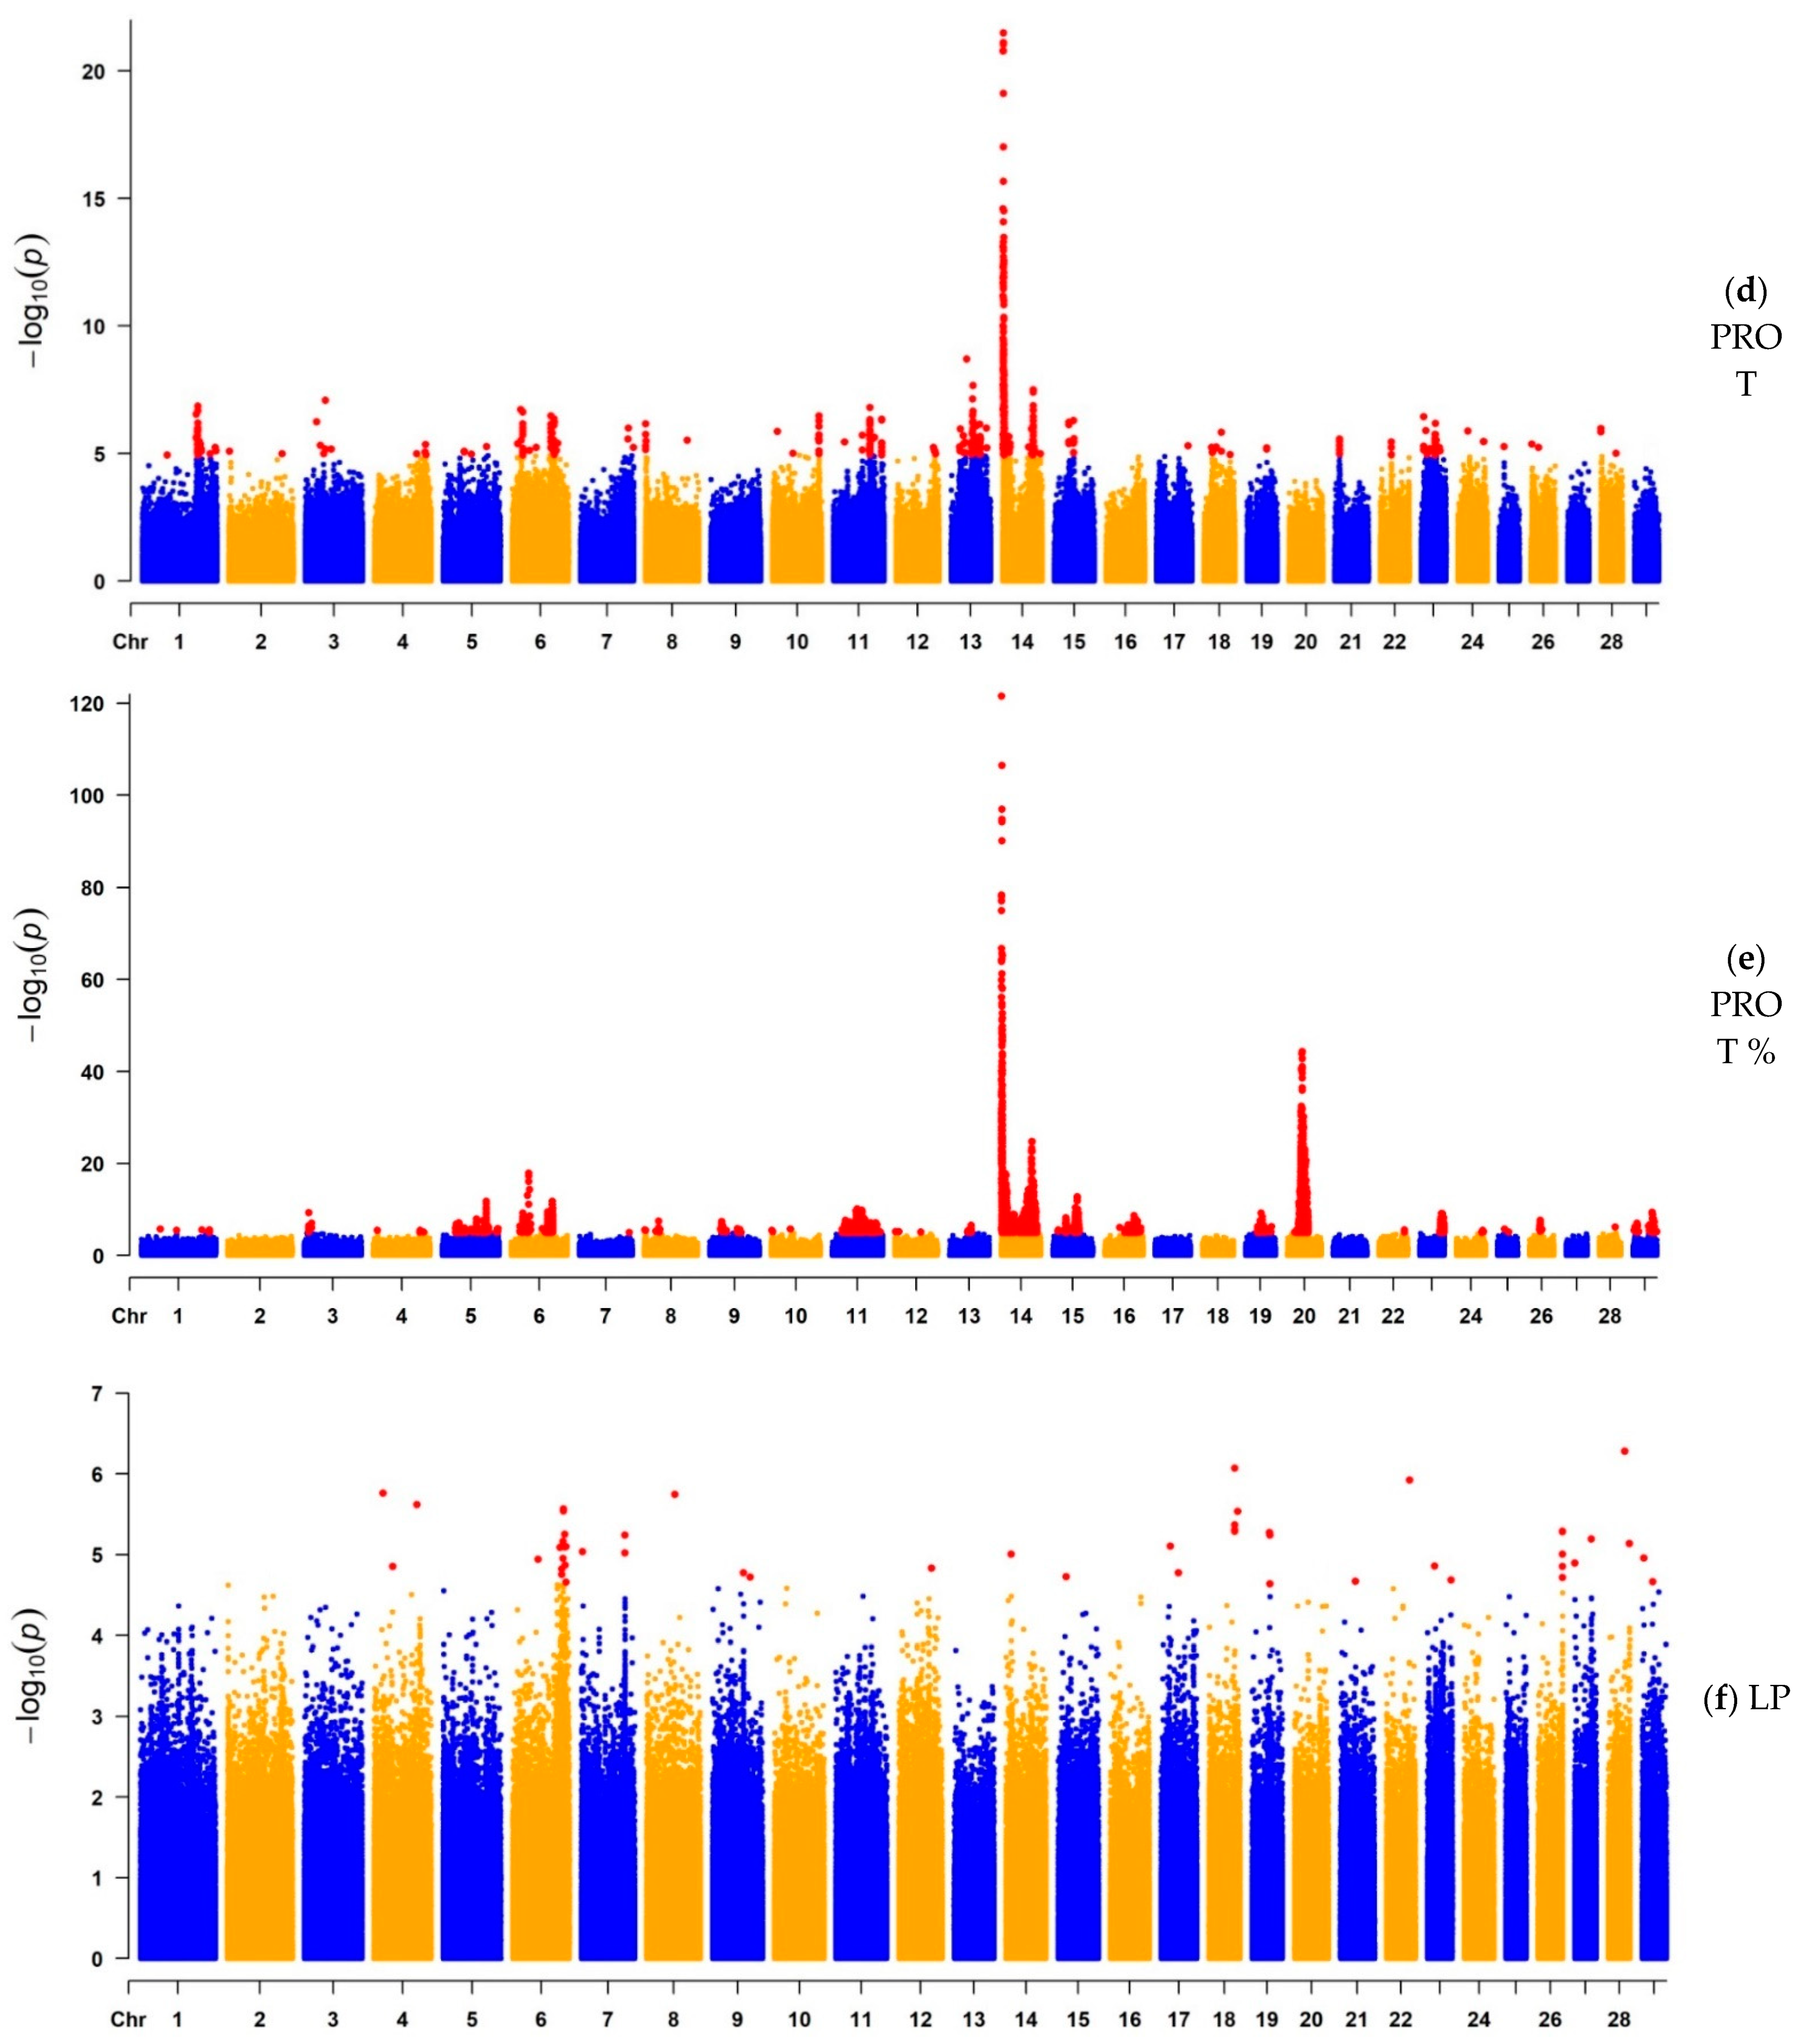
3.1.2. GWAS for Protein Yield, Protein Percentage, and Lactation Persistency
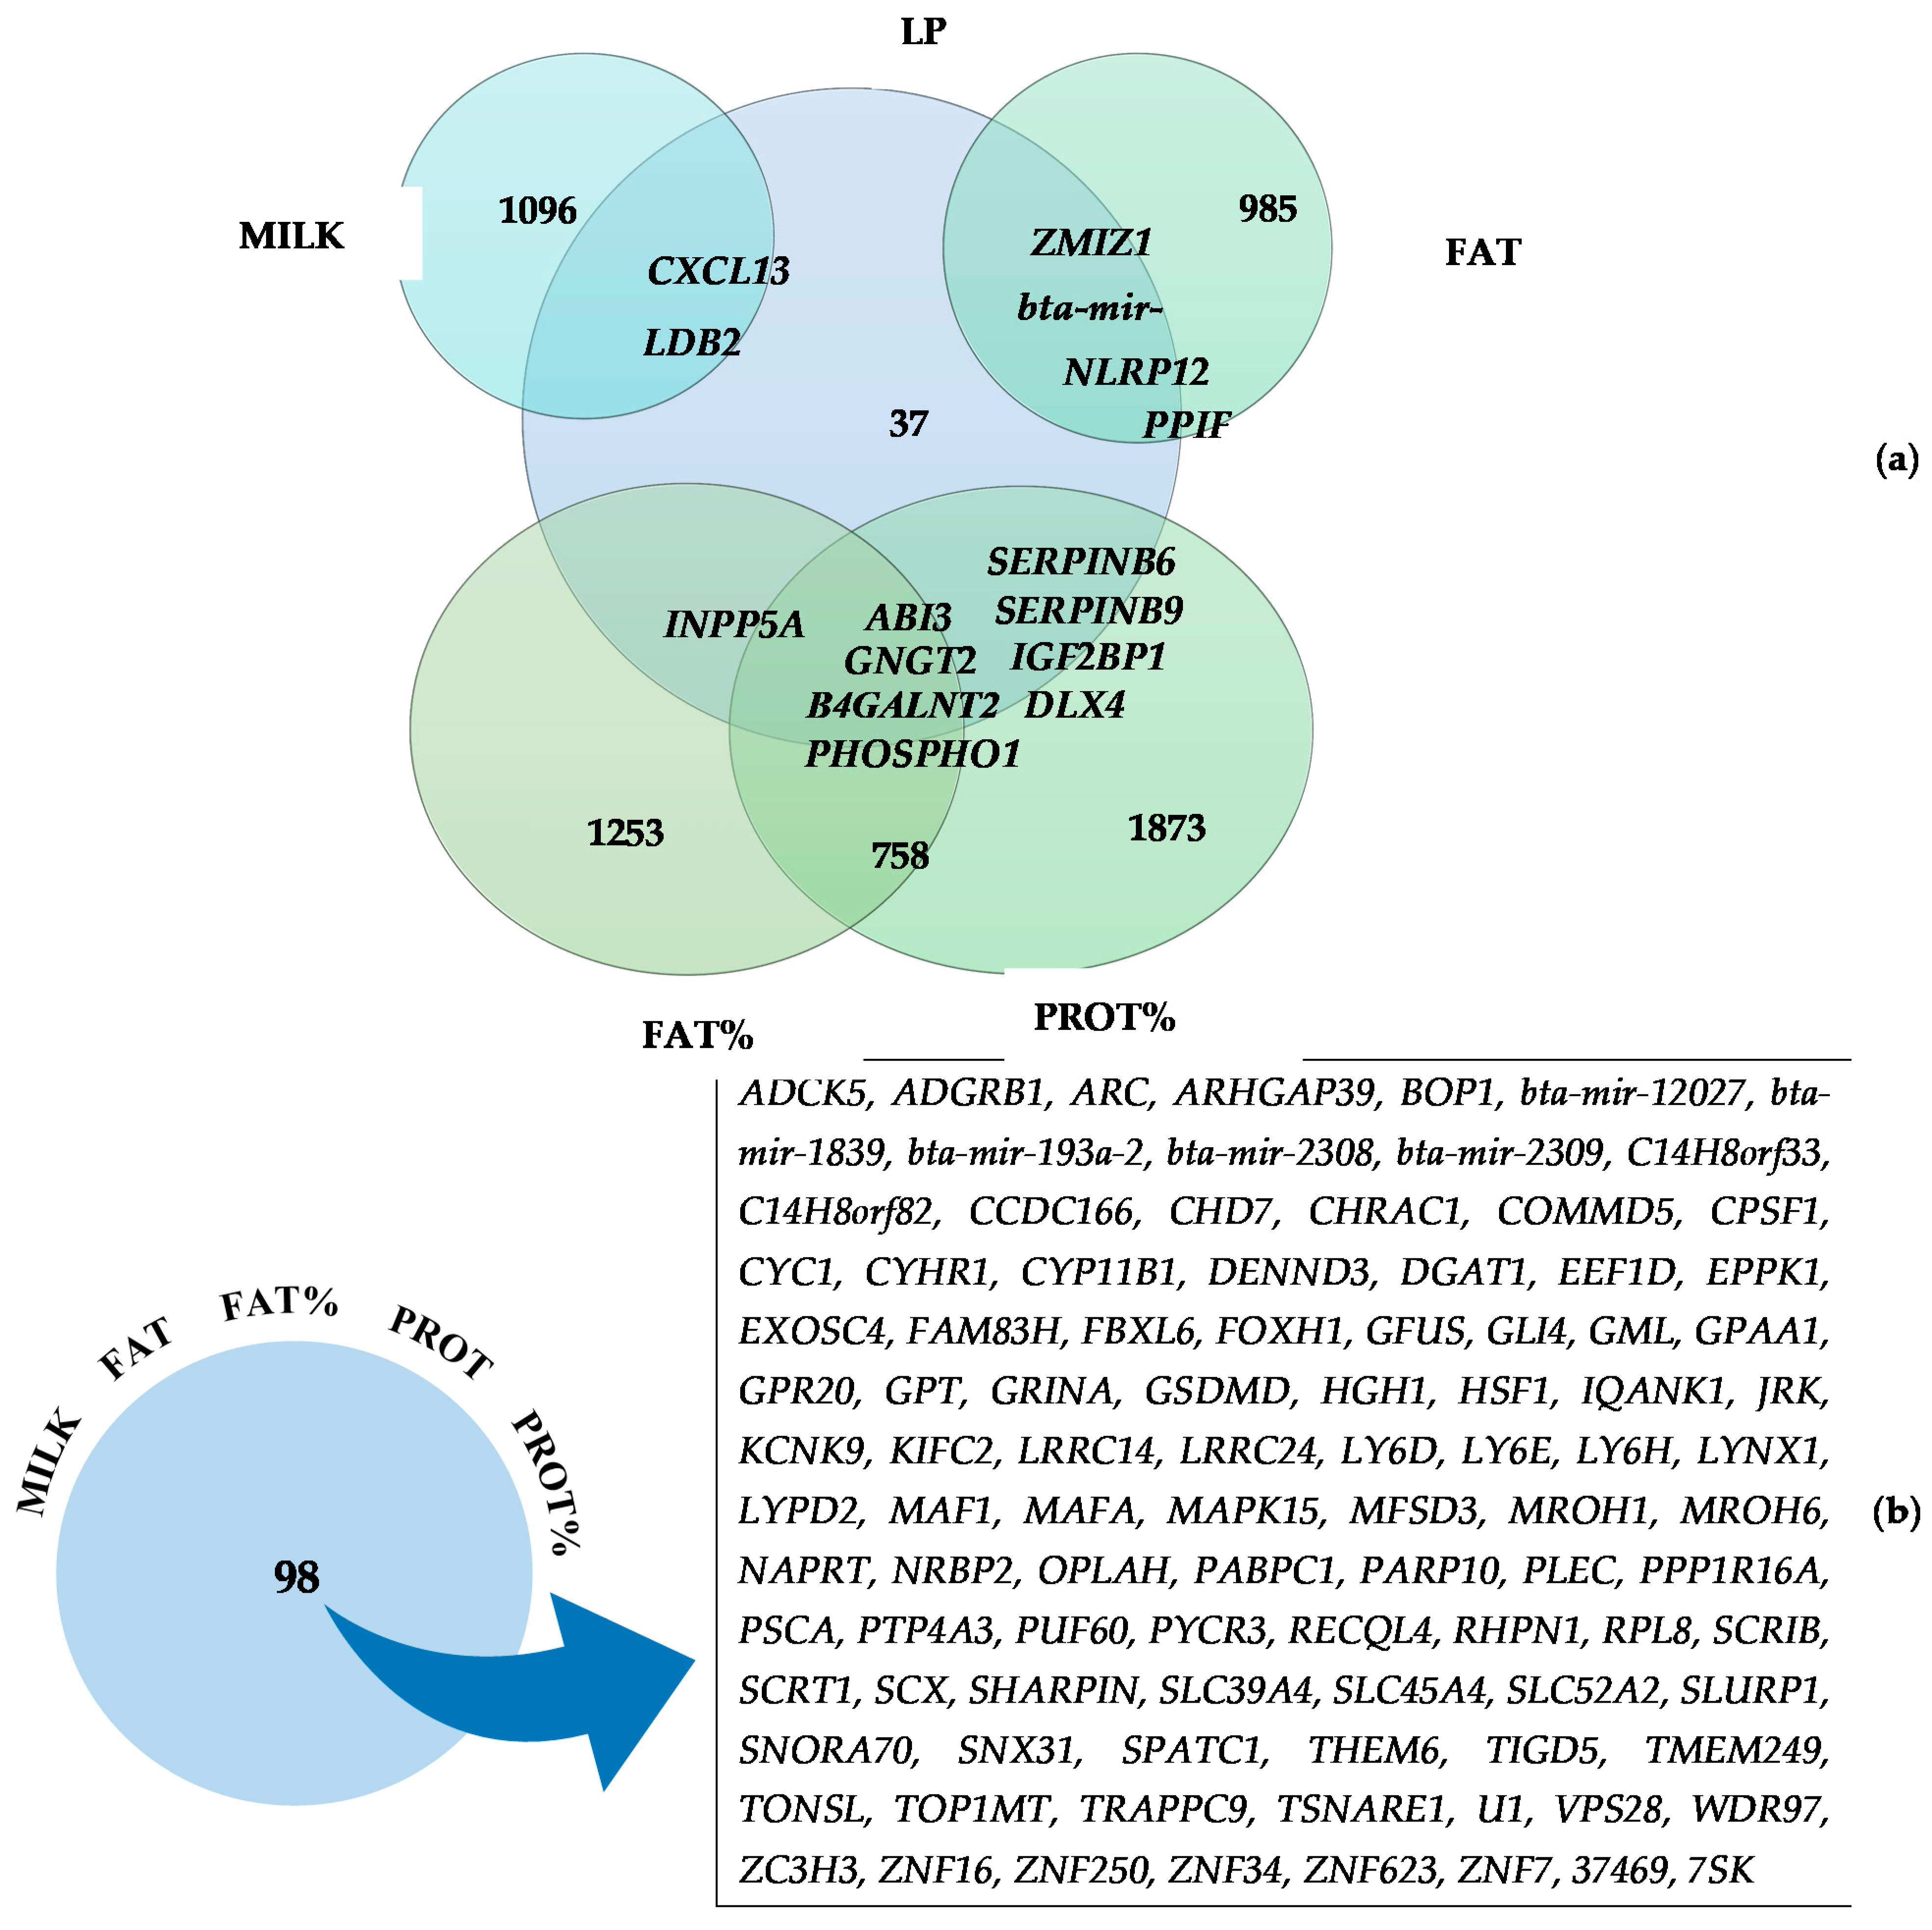
3.2. Commonly Identified Genes for Two or More Traits
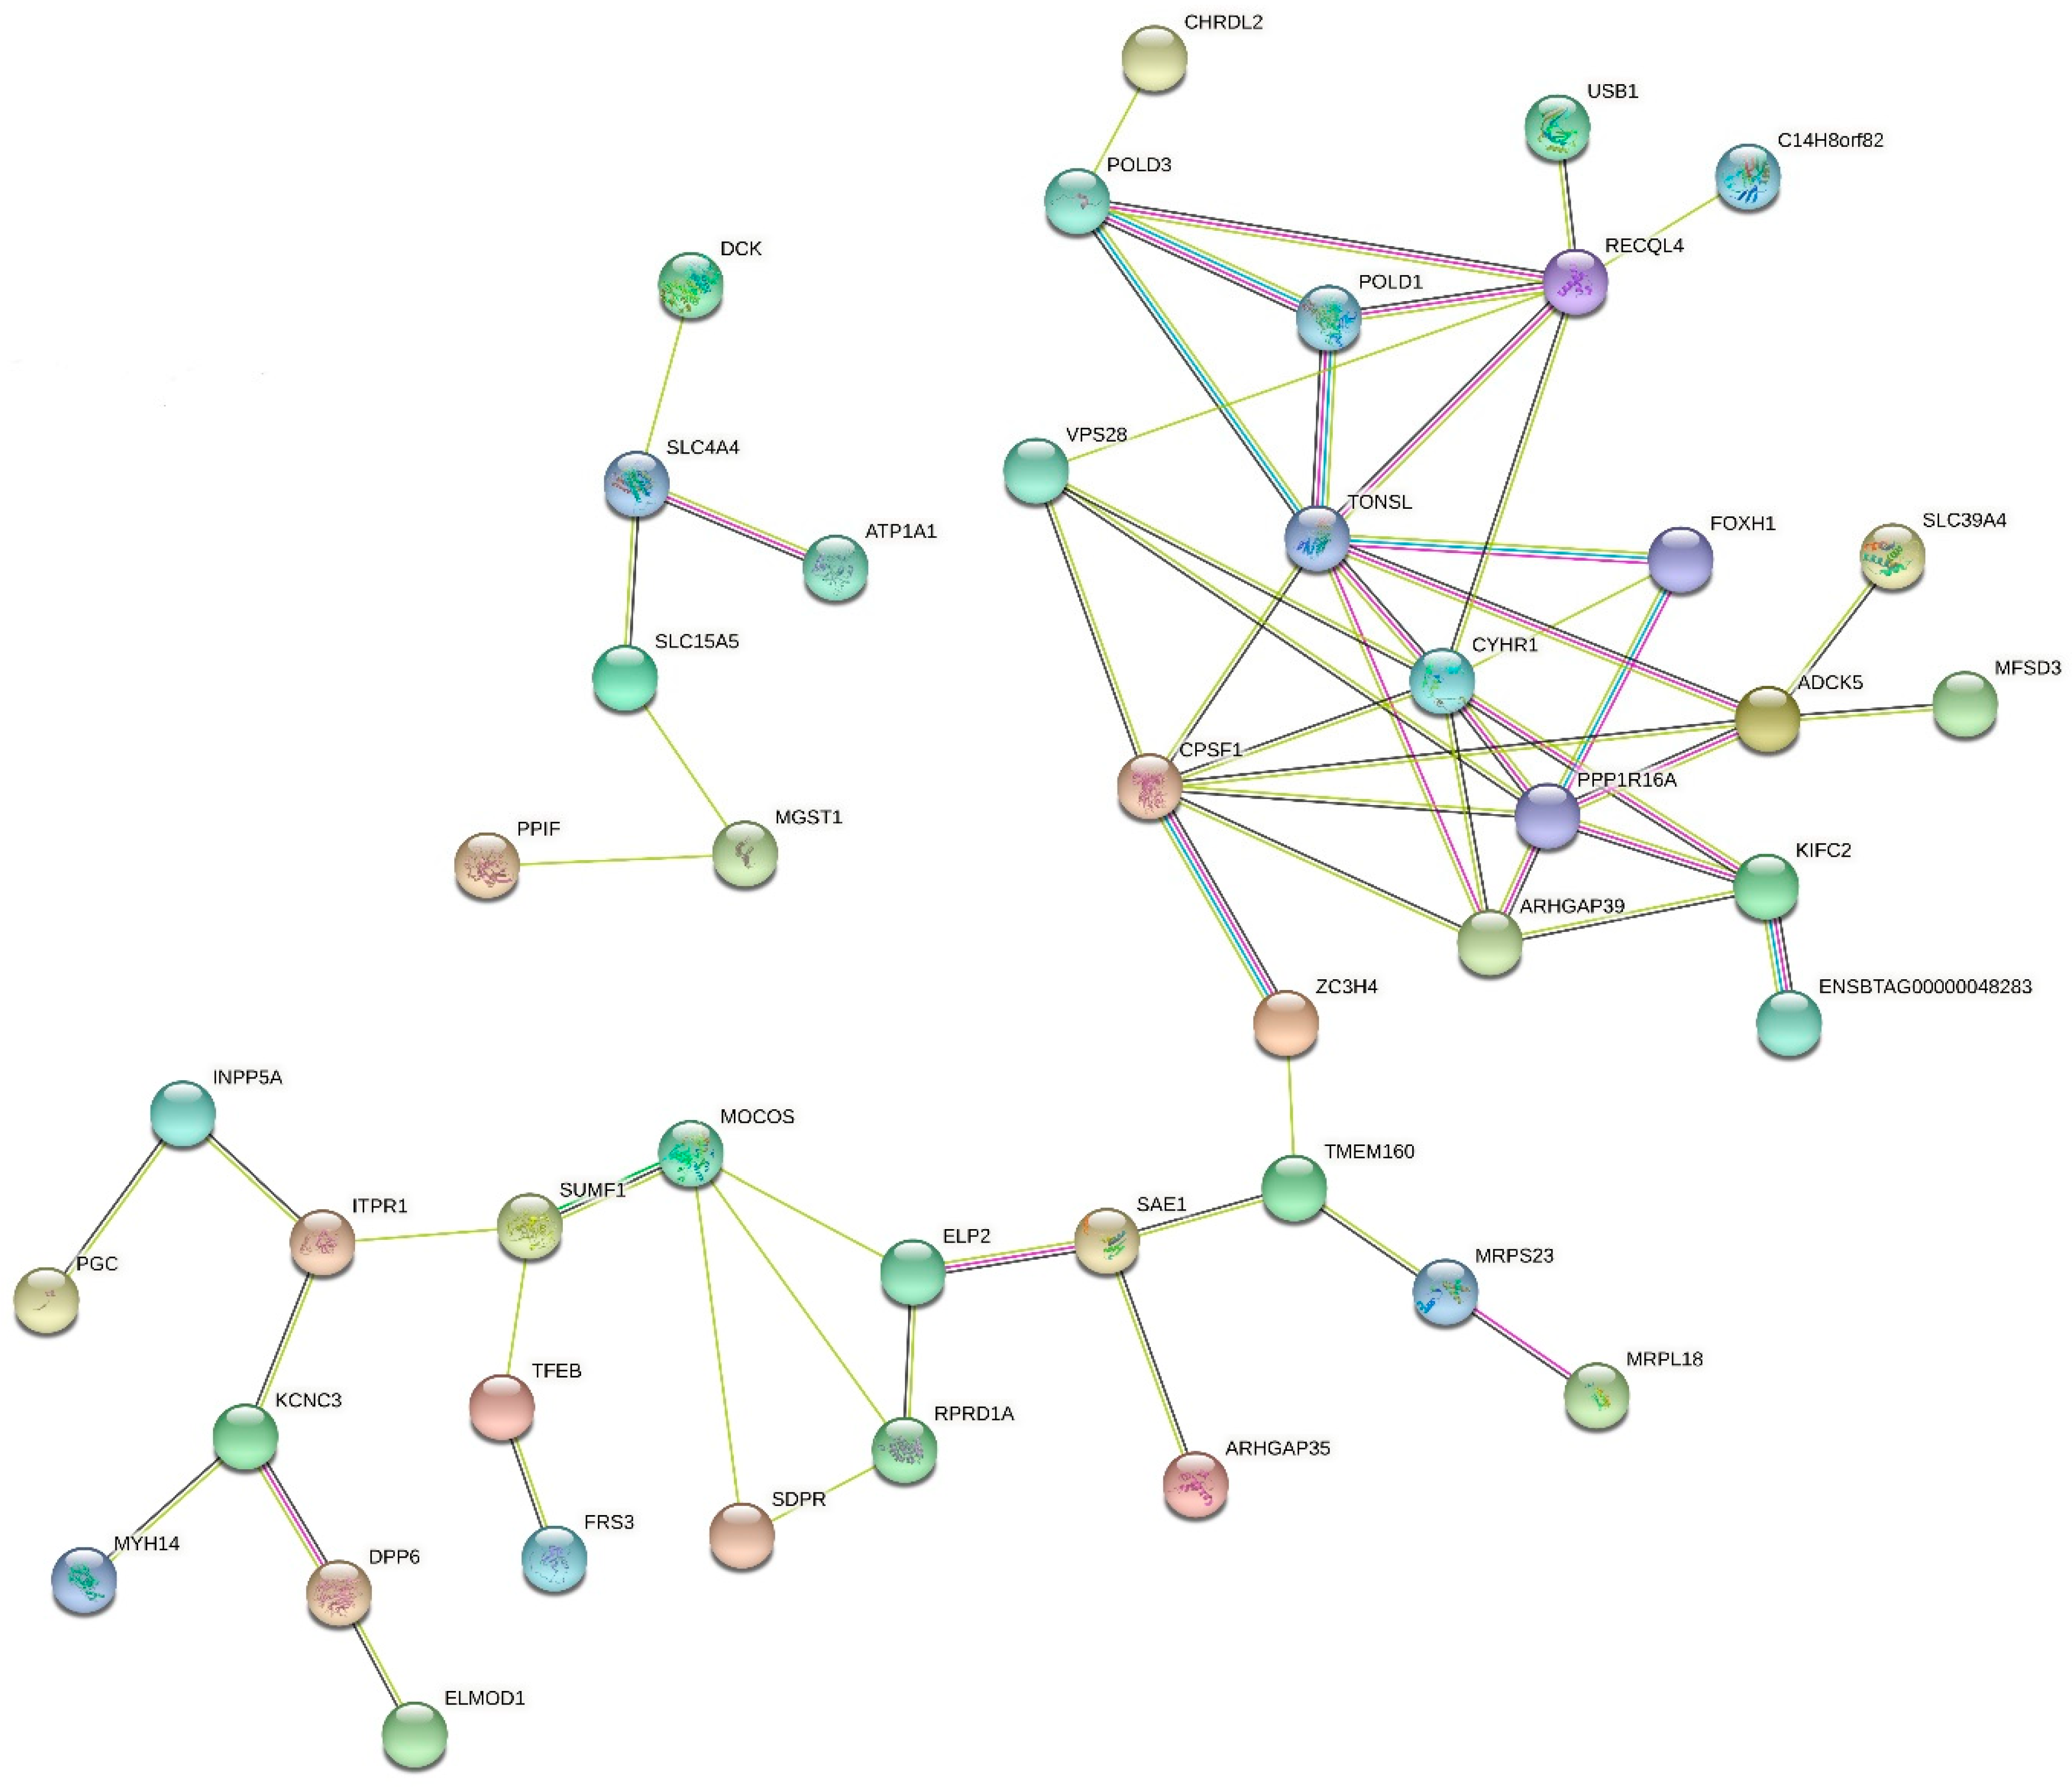
3.3. Functional Analyses of Candidate Genes
4. Discussion
4.1. Candidate Genes for Lactation Persistency
4.2. Candidate Genes for Milk Yield
4.3. Candidate Genes for Fat Yield
4.4. Candidate Genes for Fat Percentage
4.5. Candidate Genes for Protein Yield
4.6. Candidate Genes for Protein Percentage
4.7. Common Genes Identified in GO Terms
4.8. Potential Implications and Limitations
5. Conclusions
Supplementary Materials
Author Contributions
Funding
Institutional Review Board Statement
Informed Consent Statement
Data Availability Statement
Acknowledgments
Conflicts of Interest
References
- Han, B.; Yuan, Y.; Li, Y.; Liu, L.; Sun, D. Single nucleotide polymorphisms of NUCB2 and their genetic associations with milk production. Genes 2019, 10, 449. [Google Scholar] [CrossRef]
- Brito, L.F.; Bedere, N.; Douhard, F.; Oliveira, H.R.; Arnal, M.; Peñagaricano, F.; Schinckel, A.P.; Baes, C.F.; Miglior, F. Genetic selection of high-yielding dairy cattle toward sustainable farming systems in a rapidly changing world. Animal 2021, 100292. [Google Scholar] [CrossRef]
- Sehested, J.; Gaillard, C.; Lehmann, J.O.; Maciel, G.M.; Vestergaard, M.; Weisbjerg, M.R.; Mogensen, L.; Larsen, L.B.; Poulsen, N.A.; Kristensen, T. Extended lactation in dairy cattle. Animal 2019, 13, s65–s74. [Google Scholar] [CrossRef] [PubMed]
- Gaines, W.L. Persistency of Lactation in Dairy Cows: A Preliminary Study of Certain Guernsey and Holstein Records; University of Illinois Agricultural Experiment Station: Urbana, IL, USA, 1927. [Google Scholar]
- Danell, B. Studies on lactation yield and individual test-day yields of Swedish dairy cows: IV. Extension of part-lactation records for use in sire evaluation. Acta Agric. Scand. 1982, 32, 103–114. [Google Scholar] [CrossRef]
- Grossman, M.; Hartz, S.M.; Koops, W.J. Persistency of lactation yield: A novel approach. J. Dairy Sci. 1999, 82, 2192–2197. [Google Scholar] [CrossRef]
- Cole, J.B.; Null, D.J. Genetic evaluation of lactation persistency for five breeds of dairy cattle. J. Dairy Sci. 2009, 92, 2248–2258. [Google Scholar] [CrossRef]
- Dhakal, K.; Tiezzi, F.; Clay, J.S.; Maltecca, C. Causal relationships between clinical mastitis events, milk yields and lactation persistency in US Holsteins. Livest. Sci. 2016, 189, 8–16. [Google Scholar] [CrossRef]
- Yamazaki, T.; Takeda, H.; Osawa, T.; Yamaguchi, S.; Hagiya, K. Genetic correlations among fertility traits and lactation persistency within and across Holstein herds with different milk production during the first three lactations. Livest. Sci. 2019, 219, 97–103. [Google Scholar] [CrossRef]
- Loker, S.; Bastin, C.; Miglior, F. Genetic and environmental relationships between body condition score and milk production traits in Canadian Holsteins. J. Dairy Sci. 2012, 95, 410–419. [Google Scholar] [CrossRef] [PubMed]
- Miglior, F.; Fleming, A.; Malchiodi, F.; Brito, L.F.; Martin, P.; Baes, C.F. A 100-year review: Identification and genetic selection of economically important traits in dairy cattle. J. Dairy Sci. 2017, 100, 10251–10271. [Google Scholar] [CrossRef]
- Do, D.N.; Fleming, A.; Schenkel, F.S.; Miglior, F.; Zhao, X.; Ibeagha-awemu, E.M. Genetic parameters of milk cholesterol content in Holstein cattle. Can. J. Anim. Sci. 2018, 98, 714–722. [Google Scholar] [CrossRef]
- Oliveira, G.A., Jr.; Schenkel, F.S.; Alcantara, L.; Houlahan, K.; Lynch, C.; Baes, C.F. Estimated genetic parameters for all genetically evaluated traits in Canadian Holsteins. J. Dairy Sci. 2021, 104, 9002–9015. [Google Scholar] [CrossRef] [PubMed]
- Cochran, S.D.; Cole, J.B.; Null, D.J.; Hansen, P.J. Discovery of single nucleotide polymorphisms in candidate genes associated with fertility and production traits in Holstein cattle. BMC Genet. 2013, 14, 49. [Google Scholar] [CrossRef] [PubMed]
- Nayeri, S.; Sargolzaei, M.; Abo-ismail, M.K.; May, N.; Miller, S.P.; Schenkel, F.; Moore, S.S.; Stothard, P. Genome-wide association for milk production and female fertility traits in Canadian dairy Holstein cattle. BMC Genet. 2016, 17, 75. [Google Scholar] [CrossRef] [PubMed]
- Oliveira, H.R.; Cant, J.P.; Brito, L.F.; Feitosa, F.L.B.; Chud, T.C.S.; Fonseca, P.A.S.; Jamrozik, J.; Silva, F.F.; Lourenco, D.A.L.; Schenkel, F.S. Genome-wide association for milk production traits and somatic cell score in different lactation stages of Ayrshire, Holstein, and Jersey dairy cattle. J. Dairy Sci. 2019, 102, 8159–8174. [Google Scholar] [CrossRef] [PubMed]
- Wang, D.; Ning, C.; Liu, J.; Zhang, Q.; Jiang, L. Association studies for milk production traits in Chinese Holstein by an efficient rotated linear mixed model. J. Dairy Sci. 2019, 102, 2378–2383. [Google Scholar] [CrossRef]
- Van Der Berg, I.; Boichard, D.; Lund, M.S. Comparing power and precision of within-breed and multibreed genome-wide association studies of production traits using whole- genome sequence data for 5 French and Danish dairy cattle breeds. J. Dairy Sci. 2016, 99, 8932–8945. [Google Scholar] [CrossRef]
- Larmer, S.G.; Sargolzaei, M.; Brito, L.F.; Ventura, R.V.; Schenkel, F.S. Novel methods for genotype imputation to whole-genome sequence and a simple linear model to predict imputation accuracy. BMC Genet. 2017, 18, 120. [Google Scholar] [CrossRef]
- Hayes, B.J.; Macleod, I.M.; Daetwyler, H.D.; Bowman, P.J.; Chamberlian, A.J.; Vander Jagt, C.J.; Capitan, A.; Pausch, H.; Stothard, P.; Liao, X.; et al. Genomic prediction from whole genome sequence in livestock: The 1000 bull genomes project. In Proceedings of the World Congress of Genetics Applied to Livestock Production, Vancouver, BC, Canada, 3 December 2020; 2014; pp. 1–7. [Google Scholar]
- Chen, S.-Y.; Oliveira, H.R.; Schenkel, F.S.; Pedrosa, V.B.; Melka, M.G.; Brito, L.F. Using imputed whole-genome sequence variants to uncover candidate mutations and genes affecting milking speed and temperament in Holstein cattle. J. Dairy Sci. 2020, 103, 10383–10398. [Google Scholar] [CrossRef]
- Moghaddar, N.; Khansefid, M.; van der Werf, J.H.J.; Bolormaa, S.; Duijvesteijn, N.; Clark, S.A.; Swan, A.A.; Daetwyler, H.D.; MacLeod, I.M. Genomic prediction based on selected variants from imputed whole-genome sequence data in Australian sheep populations. Genet. Sel. Evol. 2019, 51, 1–14. [Google Scholar] [CrossRef]
- Van den Berg, S.; Vandenplas, J.; van Eeuwijk, F.A.; Bouwman, A.C.; Lopes, M.S.; Veerkamp, R.F. Imputation to whole-genome sequence using multiple pig populations and its use in genome-wide association studies. Genet. Sel. Evol. 2019, 51, 1–13. [Google Scholar] [CrossRef] [PubMed]
- Talouarn, E.; Bardou, P.; Palhière, I.; Oget, C.; Clément, V.; Tosser-Klopp, G.; Rupp, R.; Robert-Granié, C. Genome wide association analysis on semen volume and milk yield using different strategies of imputation to whole genome sequence in French dairy goats. BMC Genet. 2020, 21, 19. [Google Scholar] [CrossRef]
- Teissier, M.; Sanchez, M.P.; Boussaha, M.; Barbat, A.; Hoze, C.; Robert-Granie, C.; Croiseau, P. Use of meta-analyses and joint analyses to select variants in whole genome sequences for genomic evaluation: An application in milk production of French dairy cattle breeds. J. Dairy Sci. 2018, 101, 3126–3139. [Google Scholar] [CrossRef] [PubMed]
- Xiang, R.; van den Berg, I.; MacLeod, I.M.; Daetwyler, H.D.; Goddard, M.E. Effect direction meta-analysis of GWAS identifies extreme, prevalent and shared pleiotropy in a large mammal. Commun. Biol. 2020, 3, 1–14. [Google Scholar] [CrossRef]
- Van den Berg, I.; Xiang, R.; Jenko, J.; Pausch, H.; Boussaha, M.; Schrooten, C.; Tribout, T.; Gjuvsland, A.B.; Boichard, D.; Nordbø, Ø. Meta-analysis for milk fat and protein percentage using imputed sequence variant genotypes in 94,321 cattle from eight cattle breeds. Genet. Sel. Evol. 2020, 52, 1–16. [Google Scholar] [CrossRef]
- Daetwyler, H.D.; Capitan, A.; Pausch, H.; Stothard, P.; Van Binsbergen, R.; Brøndum, R.F.; Liao, X.; Djari, A.; Rodriguez, S.C.; Grohs, C.; et al. Whole-genome sequencing of 234 bulls facilitates mapping of monogenic and complex traits in cattle. Nat. Publ. Gr. 2014, 46, 858–865. [Google Scholar] [CrossRef]
- Sanchez, M.P.; Gion, A.G.; Croiseau, P.; Fritz, S.; Hozé, C.; Miranda, G.; Martin, P.; Leterrier, A.B.; Letaïef, R.; Rocha, D.; et al. Within-breed and multi-breed GWAS on imputed whole-genome sequence variants reveal candidate mutations affecting milk protein composition in dairy cattle. Genet. Sel. Evol. 2017, 49, 68. [Google Scholar] [CrossRef]
- Tribout, T.; Croiseau, P.; Lefebvre, R.; Barbat, A.; Boussaha, M.; Fritz, S.; Boichard, D.; Hoze, C.; Sanchez, M.P. Confirmed effects of candidate variants for milk production, udder health, and udder morphology in dairy cattle. Genet. Sel. Evol. 2020, 52, 1–26. [Google Scholar] [CrossRef] [PubMed]
- Bissonnette, N. Genetic association of variations in the osteopontin gene (SPP1) with lactation persistency in dairy cattle. J. Dairy Sci. 2018, 101, 456–461. [Google Scholar] [CrossRef]
- Cole, J.B.; VanRaden, P.M. Genetic evaluation and best prediction of lactation persistency. J. Dairy Sci. 2006, 89, 2722–2728. [Google Scholar] [CrossRef]
- Walsh, S.W.; Williams, E.J.; Evans, A.C.O. A review of the causes of poor fertility in high milk producing dairy cows. Anim. Reprod. Sci. 2011, 123, 127–138. [Google Scholar] [CrossRef] [PubMed]
- Nayeri, S.; Sargolzaei, M.; Miller, S.; Schenkel, F.; Moore, S.S.; Stothard, P. Genome-wide association study for lactation persistency, female fertility, longevity, and lifetime profit index traits in Holstein dairy cattle. J. Dairy Sci. 2017, 100, 1246–1258. [Google Scholar] [CrossRef] [PubMed]
- Yue, S.J.; Zhao, Y.Q.; Gu, X.R.; Yin, B.; Jiang, Y.L.; Wang, Z.H.; Shi, K.R. A genome-wide association study suggests new candidate genes for milk production traits in Chinese Holstein cattle. Anim. Genet. 2017, 48, 677–681. [Google Scholar] [CrossRef] [PubMed]
- Do, D.N.; Bissonnette, N.; Lacasse, P.; Miglior, F.; Zhao, X.; Ibeagha-awemu, E.M. Animal Genetics and Genomics: A targeted genotyping approach to enhance the identification of variants for lactation persistency in dairy cows. J. Anim. Sci. 2019, 97, 4066–4075. [Google Scholar] [CrossRef] [PubMed]
- Wang, T.; Li, J.; Gao, X.; Song, W.; Chen, C.; Yao, D.; Ma, J. Genome-wide association study of milk components in Chinese Holstein cows using single nucleotide polymorphism. Livest. Sci. 2020, 233, 103951. [Google Scholar] [CrossRef]
- VanRaden, P.M.; Van Tassell, C.P.; Wiggans, G.R.; Sonstegard, T.S.; Schnabel, R.D.; Taylor, J.F.; Schenke, F.S. Invited review: Reliability of genomic predictions for North American Holstein bulls. J. Dairy Sci. 2009, 92, 16–24. [Google Scholar] [CrossRef]
- Sargolzaei, M.; Chesnais, J.P.; Schenkel, F.S. A new approach for efficient genotype imputation using information from relatives. BMC Genom. 2014, 15, 478. [Google Scholar] [CrossRef]
- Larmer, S.G.; Sargolzaei, M.; Schenkel, F.S. Extent of linkage disequilibrium, consistency of gametic phase, and imputation accuracy within and across Canadian dairy breeds. J. Dairy Sci. 2014, 97, 3128–3141. [Google Scholar] [CrossRef]
- May, K.; Sames, L.; Scheper, C.; König, S. Genomic loci and genetic parameters for uterine diseases in first-parity Holstein cows and associations with milk production and fertility. J. Dairy Sci. 2021. [Google Scholar] [CrossRef]
- Klein, S.-L.; Scheper, C.; May, K.; König, S. Genetic and nongenetic profiling of milk β-hydroxybutyrate and acetone and their associations with ketosis in Holstein cows. J. Dairy Sci. 2020, 103, 10332–10346. [Google Scholar] [CrossRef]
- Song, Y.; Xu, L.; Chen, Y.; Zhang, L.; Gao, H.; Zhu, B.; Niu, H.; Zhang, W.; Xia, J.; Gao, X. Genome-wide association study reveals the PLAG1 gene for knuckle, biceps and shank weight in Simmental beef cattle. PLoS ONE 2016, 11, e0168316. [Google Scholar] [CrossRef] [PubMed]
- Purcell, S.; Neale, B.; Todd-brown, K.; Thomas, L.; Ferreira, M.A.R.; Bender, D.; Maller, J.; Sklar, P.; De Bakker, P.I.W.; Daly, M.J.; et al. REPORT PLINK: A tool set for whole-genome association and population-based linkage analyses. Am. J. Hum. Genet. 2007, 81, 559–575. [Google Scholar] [CrossRef]
- Yang, J.; Lee, S.H.; Goddard, M.E.; Visscher, P.M. REPORT GCTA: A tool for genome-wide complex trait analysis. Am. J. Hum. Genet. 2011, 88, 76–82. [Google Scholar] [CrossRef] [PubMed]
- Yang, J.; Zaitlen, N.A.; Goddard, M.E.; Visscher, P.M.; Price, A.L. Perspective: Advantages and pitfalls in the application of mixed-model association methods. Nat. Publ. Gr. 2014, 46, 100–106. [Google Scholar] [CrossRef]
- Prive, F.; Aschard, H.; Ziyatdinov, A.; Blum, M.G.B.; Timc-imag, L. Genetics and population analysis: Efficient analysis of large-scale genome-wide data with two R packages: Bigstatsr and bigsnpr. Bioinformatics 2018, 34, 2781–2787. [Google Scholar] [CrossRef] [PubMed]
- Johnson, R.C.; Nelson, G.W.; Troyer, J.L.; Lautenberger, J.A.; Kessing, B.D.; Winkler, C.A.; Brien, S.J.O. Accounting for multiple comparisons in a genome-wide association study (GWAS). BMC Genom. 2010, 11, 724. [Google Scholar] [CrossRef]
- Li, X.; Buitenhuis, A.J.; Lund, M.S.; Li, C.; Sun, D.; Zhang, Q.; Poulsen, N.A.; Su, G. Joint genome-wide association study for milk fatty acid traits in Chinese and Danish Holstein populations. J. Dairy Sci. 2015, 98, 8152–8163. [Google Scholar] [CrossRef]
- Goddard, M.E.; Hayes, B.J.; Meuwissen, T.H.E. Using the genomic relationship matrix to predict the accuracy of genomic selection. J. Anim. Breed. Genet. 2011, 128, 409–421. [Google Scholar] [CrossRef]
- Makanjuola, B.O.; Miglior, F.; Abdalla, E.A.; Schenkel, F.S.; Baes, C.F. Effect of genomic selection on rate of inbreeding and coancestry and effective population size of Holstein and Jersey cattle populations. J. Dairy Sci. 2020, 103, 5183–5199. [Google Scholar] [CrossRef]
- Wang, Z.; Shen, B.; Jiang, J.; Li, J.; Ma, L. Effect of sex, age and genetics on crossover interference in cattle. Sci. Rep. 2016, 6, 1–10. [Google Scholar] [CrossRef]
- Fonseca, P.A.S.; Suarez-Vega, A.; Marras, G.; Canóvas, Á. GALLO: An R package for genomic annotation and integration of multiple data sources in livestock for positional candidate loci. Giga Sci. 2020, 9, giaa149. [Google Scholar] [CrossRef] [PubMed]
- Hu, Z.-L.; Park, C.A.; Reecy, J.M. Building a livestock genetic and genomic information knowledgebase through integrative developments of Animal QTLdb and CorrDB. Nucleic Acids Res. 2019, 47, D701–D710. [Google Scholar] [CrossRef] [PubMed]
- McLaren, W.; Gil, L.; Hunt, S.E.; Riat, H.S.; Ritchie, G.R.S.; Thormann, A.; Flicek, P.; Cunningham, F. The ensembl variant effect predictor. Genome Biol. 2016, 17, 1–14. [Google Scholar] [CrossRef] [PubMed]
- Huang, D.W.; Sherman, B.T.; Zheng, X.; Yang, J.; Imamichi, T.; Stephens, R.; Lempicki, R.A. Extracting biological meaning from large gene lists with DAVID. Curr. Protoc. Bioinform. 2009, 27, 1–13. [Google Scholar] [CrossRef]
- Szklarczyk, D.; Franceschini, A.; Wyder, S.; Forslund, K.; Heller, D.; Huerta-Cepas, J.; Simonovic, M.; Roth, A.; Santos, A.; Tsafou, K.P. STRING v10: Protein–protein interaction networks, integrated over the tree of life. Nucleic Acids Res. 2015, 43, D447–D452. [Google Scholar] [CrossRef] [PubMed]
- Frischknecht, M.; Bapst, B.; Seefried, F.R.; Signer-hasler, H.; Garrick, D.; Stricker, C.; Consortium, I.; Fries, R.; Russ, I.; Sölkner, J.; et al. Genome-wide association studies of fertility and calving traits in Brown Swiss cattle using imputed whole-genome sequences. BMC Genom. 2017, 18, 910. [Google Scholar] [CrossRef]
- Liu, L.; Zhou, J.; Chen, C.J.; Zhang, J.; Wen, W.; Tian, J.; Zhang, Z.; Gu, Y. GWAS-based identification of new loci for milk yield, fat, and protein in Holstein cattle. Animals 2020, 10, 2048. [Google Scholar] [CrossRef]
- Ribeiro, E.S.; Monteiro, A.P.A.; Bisinotto, R.S.; Lima, F.S.; Greco, L.F.; Ealy, A.D. Conceptus development and transcriptome at preimplantation stages in lactating dairy cows of distinct genetic groups and estrous cyclic statuses. J. Dairy Sci. 2016, 99, 4761–4777. [Google Scholar] [CrossRef]
- Liu, A.; Wang, Y.; Sahana, G.; Zhang, Q.; Liu, L.; Lund, M.S. Genome-wide association studies for female fertility traits in Chinese and Nordic Holsteins. Sci. Rep. 2017, 7, 1–12. [Google Scholar] [CrossRef]
- Jiang, J.; Ma, L.; Prakapenka, D.; Vanraden, P.M.; Cole, J.B.; Cole, J.B. A large-scale genome-wide association study in US Holstein Cattle. Front. Genet. 2019, 10, 412. [Google Scholar] [CrossRef]
- Albarran-Portillo, B.; Pollott, G.E. The relationship between fertility and lactation characteristics in Holstein cows on United Kingdom commercial dairy farms. J. Dairy Sci. 2013, 96, 635–646. [Google Scholar] [CrossRef] [PubMed]
- Muir, B.L.; Fatehi, J.; Schaeffer, L.R. Genetic relationships between persistency and reproductive performance in first-lactation Canadian Holsteins. J. Dairy Sci. 2004, 87, 3029–3037. [Google Scholar] [CrossRef]
- Jakobsen, J.H.; Madsen, P.; Jensen, J.; Pedersen, J.; Christensen, L.G.; Sorensen, D.A. Genetic parameters for milk production and persistency for Danish Holsteins estimated in random regression models using REML. J. Dairy Sci. 2002, 85, 1607–1616. [Google Scholar] [CrossRef]
- Yamazaki, T.; Hagiya, K.; Takeda, H.; Yamaguchi, S.; Osawa, T.; Nagamine, Y. Genetic correlations among female fertility, 305-day milk yield and persistency during the first three lactations of Japanese Holstein cows. Livest. Sci. 2014, 168, 26–31. [Google Scholar] [CrossRef]
- Santos, D.J.A.; Cole, J.B.; Null, D.J.; Byrem, T.M.; Ma, L. Genetic and nongenetic profiling of milk pregnancy-associated glycoproteins in Holstein cattle. J. Dairy Sci. 2018, 101, 9987–10000. [Google Scholar] [CrossRef] [PubMed]
- Le Guillou, S.; Sdassi, N.; Laubier, J.; Passet, B.; Vilotte, M.; Castille, J.; Polyte, J.; Jaffre, F.; Cribiu, E.; Vilotte, J.; et al. Overexpression of miR-30b in the developing mouse mammary gland causes a lactation defect and delays involution. PLoS ONE 2012, 7, e45727. [Google Scholar] [CrossRef] [PubMed]
- Law, R.H.P.; Zhang, Q.; Mcgowan, S.; Buckle, A.M.; Silverman, G.A.; Wong, W.; Rosado, C.J.; Chris, G.; Pike, R.N.; Bird, P.I.; et al. An overview of the serpin superfamily. Genome Biol. 2006, 7, 1–11. [Google Scholar] [CrossRef] [PubMed][Green Version]
- De Camargo, G.M.F.; Aspilcueta-borquis, R.R.; Cardoso, D.F.; Santos, D.J.A. Prospecting major genes in dairy buffaloes. BMC Genom. 2015, 16, 872. [Google Scholar] [CrossRef]
- Soares, R.A.N.; Vargas, G.; Duffield, T.; Schenkel, F.; Squires, J. Genome-wide association study and functional analyses for clinical and subclinical ketosis in Holstein cattle. J. Dairy Sci. 2021, 104, 1–14. [Google Scholar] [CrossRef]
- Oliveira, H.R.; Lourenco, D.A.L.; Masuda, Y.; Misztal, I.; Tsuruta, S.; Jamrozik, J.; Brito, L.F.; Silva, F.F.; Cant, J.P.; Schenkel, F.S. Single-step genome-wide association for longitudinal traits of Canadian Ayrshire, Holstein, and Jersey dairy cattle. J. Dairy Sci. 2019, 102, 9995–10011. [Google Scholar] [CrossRef]
- Clancey, E.; Kiser, J.N.; Moraes, J.G.N.; Dalton, J.C.; Spencer, T.E.; Neibergs, H.L. Genome-wide association analysis and gene set enrichment analysis with SNP data identify genes associated with 305-day milk yield in Holstein dairy cows. Anim. Genet. 2019, 9, 254–258. [Google Scholar] [CrossRef] [PubMed]
- Atashi, H.; Crowe, M.; Salavati, M.; De Koster, J.; Ehrlich, J.; Crowe, M.; Opsomer, G.; Hostens, M. Genome-wide association for milk production and lactation curve parameters in Holstein dairy cows. J. Anim. Breed. Genet. 2020, 137, 292–304. [Google Scholar] [CrossRef] [PubMed]
- Raven, L.; Cocks, B.G.; Hayes, B.J. Multibreed genome wide association can improve precision of mapping causative variants underlying milk production in dairy cattle. BMC Genom. 2014, 15, 62. [Google Scholar] [CrossRef] [PubMed]
- Pradeep, J.; Monika, S.; Ankita, S.; Ks, U.; Amit, K.; Ashok, M.; Bp, M.; Sandeep, M.; Rs, K.; Kaushik, J.; et al. Expression analysis of solute carrier (SLC2A) genes in milk derived mammary epithelial cells during different stages of lactation in Sahiwal (Bos indicus) cows advances in dairy research. Adv. Dairy Res. 2014, 2, 2–7. [Google Scholar] [CrossRef]
- Banos, G.; Clark, E.L.; Id, S.J.B.; Dutta, P.; Id, G.B.; Arsenos, G.; Hume, D.A.; Id, A.P. Genetic and genomic analyses underpin the feasibility of concomitant genetic improvement of milk yield and mastitis resistance in dairy sheep. PLoS ONE 2019, 14, e0214346. [Google Scholar] [CrossRef]
- Meredith, B.K.; Kearney, F.J.; Finlay, E.K.; Bradley, D.G.; Fahey, A.G.; Berry, D.P.; Lynn, D.J. Genome-wide associations for milk production and somatic cell score in Holstein-Friesian cattle in Ireland. BMC Genet. 2012, 13, 21. [Google Scholar] [CrossRef]
- Buitenhuis, B.; Janss, L.L.G.; Poulsen, N.A.; Larsen, L.B.; Larsen, M.K.; Sørensen, P. Genome-wide association and biological pathway analysis for milk-fat composition in Danish Holstein and Danish Jersey cattle. BMC Genom. 2014, 15, 1112. [Google Scholar] [CrossRef]
- Buitenhuis, B.; Poulsen, N.A.; Gebreyesus, G.; Larsen, L.B. Estimation of genetic parameters and detection of chromosomal regions affecting the major milk proteins and their post translational modifications in Danish Holstein and Danish Jersey cattle. BMC Genet. 2016, 17, 114. [Google Scholar] [CrossRef]
- Cole, J.B.; Wiggans, G.R.; Ma, L.; Sonstegard, T.S., Jr.; Lawlor, T.J.; Crooker, B.A.; Van Tassell, C.P.; Yang, J.; Wang, S.; Matukumalli, L.K.; et al. Genome-wide association analysis of thirty one production, health, reproduction and body conformation traits in contemporary US Holstein cows. BMC Genom. 2011, 12, 408. [Google Scholar] [CrossRef]
- Zhou, J.; Liu, L.; Chen, C.J.; Zhang, M.; Lu, X.; Zhang, Z. Genome-wide association study of milk and reproductive traits in dual-purpose Xinjiang Brown cattle. BMC Genom. 2019, 20, 827. [Google Scholar] [CrossRef]
- Zhang, X.; Li, C.; Li, X.; Liu, Z.; Ni, W.; Cao, Y.; Yao, Y.; Islamov, E. Association analysis of polymorphism in the NR6A1 gene with the lumbar vertebrae number traits in sheep. Genes Genom. 2019, 41, 1165–1171. [Google Scholar] [CrossRef] [PubMed]
- Klomtong, P.; Chaweewan, K.; Phasuk, Y.; Duangjinda, M. genetic differentiation in Thai native, wild boars, and Duroc and Chinese Meishan pigs. Genet. Mol. Res. 2015, 14, 12723–12732. [Google Scholar] [CrossRef] [PubMed]
- Tokunaga, M.; Inoue, M.; Jiang, Y.; Barnes, R.H., II; Buchner, D.A.; Chun, T.-H. Fat depot-specific gene signature and ECM remodeling of Sca1high adipose-derived stem cells. Matrix Biol. 2014, 36, 28–38. [Google Scholar] [CrossRef] [PubMed]
- Buitenhuis, B.; Poulsen, N.A.; Larsen, L.B.; Sehested, J. Estimation of genetic parameters and detection of quantitative trait loci for minerals in Danish Holstein and Danish Jersey milk. BMC Genet. 2015, 16, 52. [Google Scholar] [CrossRef]
- Grisart, B.; Coppieters, W.; Farnir, F.; Karim, L.; Ford, C.; Berzi, P.; Cambisano, N.; Mni, M.; Reid, S.; Simon, P.; et al. Positional candidate cloning of a QTL in dairy cattle: Identification of a missense mutation in the bovine DGAT1 gene with major effect on milk yield and composition. Genome Res. 2002, 12, 222–231. [Google Scholar] [CrossRef]
- Cai, Z.; Guldbrandtsen, B.; Lund, M.S.; Sahana, G. Dissecting closely linked association signalsin combination with the mammalianphenotype database can identify candidategenes in dairy cattle. BMC Genet. 2018, 19, 15. [Google Scholar]
- Palombo, V.; Milanesi, M.; Sgorlon, S.; Capomaccio, S.; Mele, M.; Nicolazzi, E. Genome-wide association study of milk fatty acid composition in Italian Simmental and Italian Holstein cows using single nucleotide polymorphism arrays. J. Dairy Sci. 2018, 101, 11004–11019. [Google Scholar] [CrossRef]
- Frischknecht, M.; Pausch, H.; Bapst, B.; Signer-hasler, H.; Flury, C.; Garrick, D.; Stricker, C.; Fries, R.; Gredler-grandl, B. Highly accurate sequence imputation enables precise QTL mapping in Brown Swiss cattle. BMC Genom. 2017, 18, 999. [Google Scholar] [CrossRef] [PubMed]
- Ning, C.; Kang, H.; Zhou, L.; Wang, D.; Wang, H.; Wang, A.; Fu, J. Performance gains in genome-wide association studies for longitudinal traits via modeling time-varied effects. Sci. Rep. 2017, 1–12. [Google Scholar] [CrossRef]
- Fang, Z.-H.; Pausch, H. Multi-trait meta-analyses reveal 25 quantitative trait loci for economically important traits in Brown Swiss cattle. BMC Genom. 2019, 20, 695. [Google Scholar] [CrossRef]
- Cai, Z.; Dusza, M.; Guldbrandtsen, B.; Lund, M.S.; Sahana, G. Distinguishing pleiotropy from linked QTL between milk production traits and mastitis resistance in Nordic Holstein cattle. Genet. Sel. Evol. 2020, 52, 1–15. [Google Scholar] [CrossRef]
- Fonseca, I.; Cardoso, F.F.; Higa, R.H.; Giachetto, P.F.; Brandão, H.M.; Brito, M.A.V.P.; Ferreira, M.B.D.; Guimarães, S.E.F.; Martins, M.F. Gene expression profile in zebu dairy cows (Bos taurus indicus) with mastitis caused by Streptococcus agalactiae. Livest. Sci. 2015, 180, 47–57. [Google Scholar] [CrossRef]
- Koh, Y.; Peiris, H.; Vaswani, K.; Almughlliq, F.; Meier, S.; Burke, C.; Mitchell, M. Exosomes from dairy cows of divergent fertility; Action on endometrial cells. J. Reprod. Immunol. 2020, 137, 102624. [Google Scholar] [CrossRef] [PubMed]
- Marcos-Carcavilla, A.; Calvo, J.H.; González, C.; Moazami-Goudarzi, K.; Laurent, P.; Bertaud, M.; Hayes, H.; Alves, M.E.F.; Serrano, M. Short communication: IL-1 family members as possible candidate genes affencting economically important traits in cattle. Span. J. Agric. Res. 2007, 5, 38–42. [Google Scholar] [CrossRef]
- Yu, G.I.; Song, D.K.; Shin, D. Associations of IL1RAP and IL1RL1 gene polymorphisms with obesity and inflammation mediators. Inflamm. Res. 2020, 69, 191–202. [Google Scholar] [CrossRef]
- Ogorevc, J.; Kunej, T.; Razpet, A.; Dovc, P. Database of cattle candidate genes and genetic markers for milk production and mastitis. Anim. Genet. 2009, 40, 832–851. [Google Scholar] [CrossRef] [PubMed]
- Kaniyamattam, K.; De Vries, A. Agreement between milk fat, protein, and lactose observations collected from the Dairy Herd Improvement Association (DHIA) and a real-time milk analyzer. J. Dairy Sci. 2014, 97, 2896–2908. [Google Scholar] [CrossRef] [PubMed]
- Mastrangelo, S.; Ben, S.; Elena, J.; Gianluca, C.; Moscarelli, A.; Boussaha, M.; Montedoro, M.; Pilla, F.; Cassandro, M. Genome-wide detection of signatures of selection in three Valdostana cattle populations. J. Anim. Breed. Genet. 2020, 137, 609–621. [Google Scholar] [CrossRef]
- Liu, J.J.; Liang, A.X.; Campanile, G.; Plastow, G.; Zhang, C.; Wang, Z.; Salzano, A.; Gasparrini, B. Genome-wide association studies to identify quantitative trait loci affecting milk production traits in water buffalo. J. Dairy Sci. 2018, 101, 433–444. [Google Scholar] [CrossRef]
- Raschia, M.A.; Nani, J.P.; Carignano, H.A.; Amadio, A.F.; Maizon, D.O.; Poli, M.A.; Nacional, I.; Agropecuaria, D.T.; De Genética, I.; Favret, E.A.; et al. Weighted single-step genome-wide association analyses for milk traits in Holstein and Holstein x Jersey crossbred dairy cattle. Livest. Sci. 2020, 242, 104294. [Google Scholar] [CrossRef]
- Jena, M.K.; Mohanty, A.K. New insights of mammary gland during different stages of development. Asian J. Pharm. Clin. Res. 2017, 10, 35–40. [Google Scholar] [CrossRef][Green Version]
- Lin, S.; Wan, Z.; Zhang, J.; Xu, L.; Han, B.; Sun, D. Genome-wide association studies for the concentration of albumin in colostrum and serum in Chinese Holstein. Animals 2020, 10, 2211. [Google Scholar] [CrossRef]
- Jiménez-González, V.; Ogalla-García, E.; García-Quintanilla, M.; García-Quintanilla, A. Deciphering GRINA/Lifeguard1: Nuclear location, ca2+ homeostasis and vesicle transport. Int. J. Mol. Sci. 2019, 20, 4005. [Google Scholar] [CrossRef] [PubMed]
- Kaufmann, M.; Feijis, K.; Lüscher, B. Endogenous ADP-Ribosylation. 2014. Available online: https://link.springer.com/chapter/10.1007/82_2014_379 (accessed on 30 October 2021).
- Zhou, C.; Li, C.; Cai, W.; Liu, S.; Yin, H.; Shi, S.; Zhang, Q. Genome-wide association study for milk protein composition traits in a Chinese Holstein population using a single-step approach. Front. Genet. 2019, 10, 1–17. [Google Scholar] [CrossRef]
- Do, D.N.; Bissonnette, N.; Lacasse, P.; Miglior, F.; Sargolzaei, M.; Zhao, X. Genome-wide association analysis and pathways enrichment for lactation persistency in Canadian Holstein cattle. J. Dairy Sci. 2017, 100, 1955–1970. [Google Scholar] [CrossRef] [PubMed]
- Mohan, T.; Deng, L.; Wang, B.-Z. CCL28 chemokine: An anchoring point bridging innate and adaptive immunity. Int. Immunopharmacol. 2017, 51, 165–170. [Google Scholar] [CrossRef]
- Tomazi, T.; Gonçalves, J.L.; Barreiro, J.R.; Arcari, M.A.; Dos Santos, M.V. Bovine subclinical intramammary infection caused by coagulase-negative staphylococci increases somatic cell count but has no effect on milk yield or composition. J. Dairy Sci. 2015, 98, 3071–3078. [Google Scholar] [CrossRef]
- Huang, W.; Peñagaricano, F.; Ahmad, K.R.; Lucey, J.A.; Weigel, K.A.; Khatib, H. Association between milk protein gene variants and protein composition traits in dairy cattle. J. Dairy Sci. 2012, 95, 440–449. [Google Scholar] [CrossRef]
- Yang, F.; Zhang, M.; Rong, Y.; Liu, Z.; Yang, S.; Zhang, W. A novel SNPs in alpha-lactalbumin gene effects on lactation traits in Chinese Holstein dairy cows. Animals 2020, 10, 60. [Google Scholar] [CrossRef] [PubMed]
- Raven, L.; Cocks, B.G.; Kemper, K.E.; Chamberlain, A.J.; Vander, C.J.; Michael, J.; Hayes, B.J. Targeted imputation of sequence variants and gene expression profiling identifies twelve candidate genes associated with lactation volume, composition and calving interval in dairy cattle. Mamm. Genome 2016, 27, 81–97. [Google Scholar] [CrossRef]
- Du, C.; Deng, T.; Zhou, Y.; Ye, T.; Zhou, Z.; Zhang, S.; Shao, B.; Wei, P.; Sun, H.; Khan, F.A.; et al. Systematic analyses for candidate genes of milk production traits in water buffalo (Bubalus Bubalis). Anim. Genet. 2019, 50, 207–216. [Google Scholar] [CrossRef] [PubMed]
- Laodim, T.; Elzo, M.A.; Koonawootrittriron, S.; Suwanasopee, T.; Jattawa, D. Genomic-polygenic and polygenic predictions for milk yield, fat yield, and age at first calving in Thai multibreed dairy population using genic and functional sets of genotypes. Livest. Sci. 2019, 219, 17–24. [Google Scholar] [CrossRef]
- Mrode, R.; Ojango, J.M.K.; Okeyo, A.M.; Mwacharo, J.M. Genomic selection and use of molecular tools in breeding programs for indigenous and crossbred cattle in developing countries: Current status and future prospects. Front. Genet. 2019, 9, 694. [Google Scholar] [CrossRef] [PubMed]
- Rong, L.; Qing-Zhang, L.; Jian-Guo, H.; Li-min, L.; Xue-Jun, G. Proteomic identification of differentially expressed proteins in Vaccaria segetalis-treated dairy cow mammary epithelial cells. J. Northeast Agric. Univ. 2013, 20, 24–31. [Google Scholar]


| Traits | Sample Size | dEBVs | Reliability | ||||
|---|---|---|---|---|---|---|---|
| Mean | Min | Max | SD | Mean | SD | ||
| MILK | 8264 | −1507.99 | −58,315.8 | 89,084.9 | 13,218.18 | 63.3 | 9.5 |
| FAT | 8262 | −57.62 | −3416.98 | 5254.22 | 893.60 | 64.7 | 9.9 |
| PROT | 8263 | −55.87 | −2124.84 | 2479.37 | 526.11 | 60.2 | 8.9 |
| FAT% | 8262 | 0.27 | −37.47 | 40.01 | 9.61 | 64.7 | 9.9 |
| PROT% | 8263 | 0.11 | −17.91 | 17.96 | 4.86 | 60.2 | 8.9 |
| LP | 3447 | 95.68 | −810.60 | 1008.61 | 486.37 | 36.7 | 6.8 |
| TRAIT | N 1 | Chr 2 | Position (bp) | p-Value | Genes (Within ±100 Kb) | QTL 3 | QTL_Type 4 |
|---|---|---|---|---|---|---|---|
| MILK | 8 | 1 | 141,861,836 | 2.69 × 10⁻⁶ | ENSBTAG00000050235, ENSBTAG00000045771, ENSBTAG00000046015 | 1 | Meat/Carcass |
| MILK | 2 | 2 | 80,496,336 | 9.86 × 10⁻⁶ | CAVIN2 | 0 | - |
| MILK | 6 | 3 | 26,833,328 | 2.52 × 10⁻⁶ | CD58, ATP1A1 | 3 | Reproduction |
| MILK | 16 | 4 | 116,598,211 | 2.28 × 10⁻⁵ | DPP6 | 4 | Milk |
| MILK | 871 | 5 | 93,545,576 | 3.62 × 10⁻¹² | MGST1, SLC15A5 | 357 | Milk |
| MILK | 579 | 6 | 86,348,368 | 2.27 × 10⁻¹⁰ | MOB1B, DCK, SLC4A4 | 69 | Milk |
| MILK | 28 | 7 | 5,452,360 | 7.17 × 10⁻⁶ | B3GNT3, FCHO1, MAP1S, UNC13A, COLGALT1 | 10 | Reproduction |
| MILK | 24 | 8 | 36,048,320 | 1.30 × 10⁻⁷ | bta-mir-2285bg, PTPRD | 1 | Meat/Carcass |
| MILK | 91 | 9 | 61,950,514 | 1.39 × 10⁻⁷ | SPACA1 | 0 | - |
| MILK | 20 | 10 | 87,491,769 | 5.67 × 10⁻⁸ | GPATCH2L | 1 | Reproduction |
| MILK | 769 | 11 | 103,587,292 | 5.24 × 10⁻⁸ | NACC2, TMEM250, LHX3 | 4 | Milk |
| MILK | 1 | 12 | 72,628,679 | 1.02 × 10⁻⁵ | ENSBTAG00000023309 | 0 | - |
| MILK | 37 | 13 | 6,976,693 | 2.95 × 10⁻¹⁰ | ISM1, TASP1 | 15 | Exterior |
| MILK | 5564 | 14 | 465,742 | 5.98 × 10−196 | ARHGAP39, bta-mir-2308, C14H8orf82, LRRC24, LRRC14, RECQL4, MFSD3, GPT, PPP1R16A, FOXH1, KIFC2, CYHR1, TONSL, VPS28, ENSBTAG00000053637, SLC39A4, CPSF1, ADCK5 | 765 | Milk |
| MILK | 1012 | 15 | 54,030,861 | 2.13 × 10⁻⁹ | POLD3, CHRDL2, RNF169, U6, ENSBTAG00000054207, ENSBTAG00000042319 | 3 | Milk |
| MILK | 308 | 16 | 64,637,424 | 9.60 × 10⁻⁹ | SMG7, NCF2, ARPC5, APOBEC4 | 1 | Health |
| MILK | 35 | 18 | 56,457,916 | 5.07 × 10⁻⁶ | IZUMO2, ENSBTAG00000053322, MYH14, KCNC3, NAPSA, ENSBTAG00000048283, NR1H2, POLD1 | 37 | Milk |
| MILK | 132 | 19 | 8,625,414 | 1.77 × 10⁻⁶ | CCDC182, ENSBTAG00000045351, ENSBTAG00000051336, MRPS23, CUEDC1 | 15 | Reproduction |
| MILK | 1867 | 20 | 31,609,872 | 3.36 × 10⁻³² | NIM1K, ENSBTAG00000042376, ZNF131, ENSBTAG00000054352, ENSBTAG00000052195, ENSBTAG00000051111 | 27 | Milk |
| MILK | 27 | 21 | 33,151,073 | 6.13 × 10⁻⁶ | ENSBTAG00000051111, ODF3L1, CSPG4, SNX33 | 2 | Health |
| MILK | 6 | 22 | 21,859,149 | 4.59 × 10⁻⁶ | bta-mir-2285am, U6, SUMF1 | 0 | - |
| MILK | 436 | 23 | 12,589,558 | 6.37 × 10⁻⁸ | GLO1, DNAH8 | 0 | - |
| MILK | 6 | 24 | 21,019,665 | 7.60 × 10⁻⁶ | MOCOS, ELP2, SLC39A6, RPRD1A | 0 | - |
| MILK | 40 | 28 | 18,592,444 | 1.03 × 10⁻⁶ | ZNF365 | 5 | Milk |
| MILK | 16 | 29 | 9,512,241 | 6.55 × 10⁻⁶ | PICALM | 9 | Milk |
| FAT | 30 | 1 | 126,143,578 | 8.14 × 10⁻⁸ | ENSBTAG00000038111, PCOLCE2 | 3 | Reproduction |
| FAT | 46 | 2 | 67,353,179 | 3.19 × 10⁻⁶ | DPP10, ENSBTAG00000050341, | 0 | - |
| FAT | 15 | 4 | 28,468,986 | 5.19 × 10⁻⁸ | POLR1F, ENSBTAG00000050341, TMEM196 | 0 | - |
| FAT | 1580 | 5 | 93,627,511 | 8.00 × 10⁻²⁶ | SLC15A5 | 167 | Milk |
| FAT | 31 | 6 | 36,205,216 | 1.00 × 10⁻⁷ | HERC3, PIGY, HERC5 | 202 | Milk |
| FAT | 18 | 7 | 21,215,200 | 5.74 × 10⁻⁶ | GADD45B, LMNB2, TIMM13, TMPRSS9, SPPL2B, LSM7, LINGO3, PEAK3, OAZ1 | 23 | Reproduction |
| FAT | 8 | 8 | 42,176,903 | 6.89 × 10⁻⁶ | ENSBTAG00000051041 | 7 | Milk |
| FAT | 26 | 10 | 86,711,416 | 4.16 × 10⁻⁶ | JDP2, bta-mir-10162, BATF, FLVCR2 | 3 | Health |
| FAT | 1275 | 11 | 95,801,995 | 2.86 × 10⁻⁹ | NR6A1, bta-mir-181a-2, bta-mir-181b-2, OLFML2A, U6, WDR38, RPL35, ARPC5L, GOLGA1 | 1 | Production |
| FAT | 12 | 12 | 69,122,129 | 1.67 × 10⁻⁵ | ENSBTAG00000051519, 5S_rRNA, TGDS, GPR180, U2, SOX21 | 1 | Exterior |
| FAT | 322 | 13 | 54,614,993 | 1.43 × 10⁻⁷ | DIDO1, TCFL5, COL9A3, OGFR, MRGBP, NTSR1, SLCO4A1, ENSBTAG00000051754, ENSBTAG00000051012 | 3 | Milk |
| FAT | 4490 | 14 | 465,742 | 2.08 × 10−183 | ARHGAP39, bta-mir-2308, C14H8orf82, LRRC24, LRRC14, RECQL4, MFSD3, GPT, PPP1R16A, FOXH1, KIFC2, CYHR1, TONSL, VPS28, ENSBTAG00000053637, SLC39A4, CPSF1, ADCK5 | 765 | Milk |
| FAT | 181 | 15 | 74,165,872 | 1.09 × 10⁻⁹ | ACCSL, ACCS, EXT2 | 6 | Reproduction |
| FAT | 260 | 16 | 61,287,081 | 9.53 × 10⁻⁹ | CEP350, QSOX1 | 0 | - |
| FAT | 12 | 18 | 60,972,942 | 2.06 × 10⁻⁵ | bta-mir-371, NLRP12, MGC157082, ENSBTAG00000014953 | 50 | Milk |
| FAT | 35 | 19 | 34,952,167 | 1.85 × 10⁻⁶ | NT5M, COPS3, FLCN, PLD6, MPRIP | 7 | Production |
| FAT | 18 | 22 | 27,251,453 | 4.27 × 10⁻⁶ | CNTN3 | 3 | Health |
| FAT | 13 | 23 | 11,102,541 | 3.20 × 10⁻⁶ | ENSBTAG00000048838, PIM1, ENSBTAG00000045936, TMEM217, TBC1D22B | 0 | - |
| FAT | 639 | 26 | 21,354,112 | 1.07 × 10⁻⁹ | PKD2L1, SCD, bta-mir-12016, WNT8B, SEC31B, NDUFB8, HIF1AN | 296 | Milk |
| FAT | 6 | 28 | 34,969,442 | 7.51 × 10⁻⁶ | ZMIZ1, PPIF, ZCCHC24 | 2 | Production |
| FAT | 20 | 29 | 49,353,940 | 1.30 × 10⁻⁶ | TSPAN32, ASCL2, TH, INS, IGF2 | 8 | Milk |
| FAT% | 8 | 1 | 1,025,407 | 1.89 × 10⁻⁵ | RCAN1, KCNE1, ENSBTAG00000026259, ENSBTAG00000051226, FAM243A, SMIM11A, KCNE2 | 6 | Milk |
| FAT% | 47 | 2 | 128,607,054 | 8.79 × 10⁻⁷ | STPG1, GRHL3, U6 | 2 | Milk |
| FAT% | 29 | 4 | 106,456,105 | 6.10 × 10⁻⁶ | ENSBTAG00000049510, ENSBTAG00000048380, ENSBTAG00000053286, OR6V1, ENSBTAG00000052365, PIP, ENSBTAG00000050494 | 0 | - |
| FAT% | 2070 | 5 | 93,627,511 | 3.55 × 10⁻³⁴ | SLC15A5 | 167 | Milk |
| FAT% | 41 | 6 | 36,205,216 | 5.31 × 10⁻¹² | HERC3, PIGY, HERC5 | 202 | Milk |
| FAT% | 19 | 7 | 21,215,200 | 2.60 × 10⁻⁵ | GADD45B, LMNB2, TIMM13, TMPRSS9, SPPL2B, LSM7, LINGO3, PEAK3, OAZ1 | 23 | Reproduction |
| FAT% | 11 | 8 | 88,461,261 | 8.40 × 10⁻⁸ | GADD45G | 10 | Reproduction |
| FAT% | 20 | 9 | 61,950,514 | 9.91 × 10⁻⁷ | SPACA1 | 0 | - |
| FAT% | 3 | 10 | 77,587,306 | 4.17 × 10⁻⁶ | FUT8 | 4 | Meat/Carcass |
| FAT% | 2365 | 11 | 105,500,024 | 6.21 × 10⁻⁶ | COL5A1, FCN1, ENSBTAG00000054425, OLFM1, ENSBTAG00000052600 | 15 | Milk |
| FAT% | 6 | 12 | 70,194,006 | 2.47 × 10⁻⁶ | ENSBTAG00000047383 | 0 | - |
| FAT% | 161 | 13 | 47,813,637 | 3.64 × 10⁻⁷ | GPCPD1, ENSBTAG00000054005, ENSBTAG00000051557 | 7 | Milk |
| FAT% | 6274 | 14 | 465,742 | 2.82 × 10−317 | ARHGAP39, bta-mir-2308, C14H8orf82, LRRC24, LRRC14, RECQL4, MFSD3, GPT, PPP1R16A, FOXH1, KIFC2, CYHR1, TONSL, VPS28, ENSBTAG00000053637, SLC39A4, CPSF1, ADCK5 | 765 | Milk |
| FAT% | 789 | 15 | 51,993,618 | 9.14 × 10⁻⁹ | CLPB, PDE2A, ENSBTAG00000050827 | 2 | Production |
| FAT% | 714 | 16 | 61,059,994 | 7.32 × 10⁻¹⁰ | FAM163A, TOR1AIP2, TOR1AIP1, U6 | 11 | Reproduction |
| FAT% | 33 | 17 | 65,230,489 | 1.97 × 10⁻⁶ | KIAA1671, 7SK, ENSBTAG00000053952, CRYBB3, CRYBB2 | 18 | Reproduction |
| FAT% | 215 | 19 | 35,457,767 | 2.41 × 10⁻⁷ | KCNJ12, UTP18, MBTD1 | 0 | - |
| FAT% | 1293 | 20 | 29,991,518 | 2.95 × 10⁻²³ | ENSBTAG00000054476, MRPS30 | 179 | Milk |
| FAT% | 6 | 25 | 11,488,475 | 4.73 × 10⁻⁶ | CPPED1 | 0 | - |
| FAT% | 8 | 26 | 51,156,653 | 5.45 × 10⁻⁶ | INPP5A, ENSBTAG00000051139, BNIP3, ENSBTAG00000050527 | 2 | Reproduction |
| FAT% | 3 | 27 | 36,400,257 | 1.07 × 10⁻⁵ | 5S_rRNA, GOLGA7, GINS4 | 27 | Milk |
| FAT% | 13 | 28 | 26,978,779 | 1.00 × 10⁻⁵ | ADAMTS14, TBATA, SGPL1, ENSBTAG00000054819, PCBD1 | 18 | Milk |
| TRAIT | N 1 | Chr 2 | Position (bp) | p-Value | Genes (Within ±100 Kb) | QTL 3 | QTL_Type 4 |
|---|---|---|---|---|---|---|---|
| PROT | 236 | 1 | 117,208,394 | 1.39 × 10⁻⁷ | CLRN1 | 1 | Reproduction |
| PROT | 12 | 2 | 1,465,207 | 8.33 × 10⁻⁶ | AMER3 | 3 | Reproduction |
| PROT | 16 | 3 | 42,939,326 | 8.31 × 10⁻⁸ | CDC14A, ENSBTAG00000054319, ENSBTAG00000015759, RTCA | 0 | - |
| PROT | 61 | 4 | 106,606,419 | 8.84 × 10⁻⁶ | ENSBTAG00000050494, TAS2R39, TAS2R40, GSTK1, TMEM139, CASP2, CLCN1 | 0 | - |
| PROT | 72 | 5 | 91,526,305 | 5.46 × 10⁻⁶ | PIK3C2G, ENSBTAG00000046178 | 23 | Milk |
| PROT | 65 | 6 | 86,795,218 | 4.49 × 10⁻⁷ | SLC4A4 | 278 | Milk |
| PROT | 6 | 7 | 93,911,428 | 1.49 × 10⁻⁵ | KIAA0825, SLF1 | 0 | - |
| PROT | 30 | 8 | 948,000 | 6.96 × 10⁻⁷ | PALLD, 5S_rRNA | 16 | Production |
| PROT | 21 | 10 | 10,774,713 | 1.37 × 10⁻⁶ | CMYA5, SNORA72, ENSBTAG00000049054 | 0 | - |
| PROT | 121 | 11 | 77,730,244 | 1.57 × 10⁻⁷ | TDRD15 | 4 | Production |
| PROT | 8 | 12 | 77,353,297 | 8.04 × 10⁻⁶ | TMTC4, ENSBTAG00000053717 | 0 | - |
| PROT | 489 | 13 | 33,556,356 | 2.02 × 10⁻⁹ | ARHGAP12 | 5 | Reproduction |
| PROT | 1541 | 14 | 827,938 | 3.24 × 10⁻²² | MAF1, ENSBTAG00000051469, SHARPIN, CYC1, GPAA1, EXOSC4, OPLAH, ENSBTAG00000015040, SPATC1, GRINA, PARP10, PLEC, bta-mir-2309 | 670 | Milk |
| PROT | 32 | 15 | 41,254,106 | 5.23 × 10⁻⁷ | GALNT18 | 1 | Milk |
| PROT | 22 | 17 | 65,001,641 | 5.01 × 10⁻⁶ | ENSBTAG00000054184, PIWIL3, SGSM1, TMEM211 | 3 | Reproduction |
| PROT | 48 | 18 | 36,657,423 | 1.48 × 10⁻⁶ | CYB5B, ENSBTAG00000052086, NFAT5 | 0 | - |
| PROT | 37 | 19 | 42,052,275 | 6.05 × 10⁻⁶ | JUP, P3H4, FKBP10, NT5C3B, KLHL10, KLHL11, ACLY, ENSBTAG00000050335, TTC25, CNP, DNAJC7 | 2 | Milk |
| PROT | 7 | 21 | 10,379,606 | 2.70 × 10⁻⁶ | ENSBTAG00000049351 | 8 | Reproduction |
| PROT | 30 | 22 | 23,112,217 | 3.53 × 10⁻⁶ | CRBN, TRNT1, IL5RA | 4 | Milk |
| PROT | 628 | 23 | 5,551,604 | 3.67 × 10⁻⁷ | FAM83B | 2 | Milk |
| PROT | 31 | 24 | 21,507,281 | 1.32 × 10⁻⁶ | GALNT1, INO80C | 0 | - |
| PROT | 9 | 25 | 10,257,579 | 5.43 × 10⁻⁶ | ENSBTAG00000050716, ENSBTAG00000050363, LITAF | 2 | Milk |
| PROT | 8 | 26 | 15,946,065 | 5.94 × 10⁻⁶ | PLCE1, NOC3L, U6, TBC1D12, ENSBTAG00000051299, ENSBTAG00000049089, HELLS, 7SK | 13 | Milk |
| PROT | 15 | 28 | 1,284,944 | 1.04 × 10⁻⁶ | RAB4A, CCSAP, ENSBTAG00000048654, ENSBTAG00000050985 | 7 | Milk |
| PROT% | 56 | 1 | 142,907,564 | 3.41 × 10⁻⁶ | SLC37A1, PDE9A | 98 | Milk |
| PROT% | 106 | 3 | 9,965,020 | 5.49 × 10⁻¹⁰ | FCRL6, DUSP23, CRP | 9 | Milk |
| PROT% | 39 | 4 | 9,165,220 | 3.80 × 10⁻⁶ | ENSBTAG00000052341, MTERF1 | 0 | - |
| PROT% | 828 | 5 | 93,655,680 | 1.81 × 10⁻¹² | SLC15A5 | 172 | Milk |
| PROT% | 696 | 6 | 36,205,216 | 1.28 × 10⁻¹⁸ | HERC3, PIGY, HERC5 | 202 | Production |
| PROT% | 6 | 7 | 104,076,138 | 1.10 × 10⁻⁵ | U6 | 0 | - |
| PROT% | 16 | 8 | 1,868,612 | 2.86 × 10⁻⁶ | MFAP3L, ENSBTAG00000051098, AADAT | 6 | Reproduction |
| PROT% | 61 | 9 | 26,103,917 | 4.56 × 10⁻⁸ | TPD52L1, RNF217 | 0 | - |
| PROT% | 36 | 10 | 40,647,347 | 2.08 × 10⁻⁶ | ENSBTAG00000034580 | 3 | Reproduction |
| PROT% | 1309 | 11 | 63,476,482 | 1.52 × 10⁻¹⁰ | SLC1A4, CEP68, RAB1A | 26 | Milk |
| PROT% | 5 | 12 | 76,184,908 | 2.08 × 10⁻⁵ | UBAC2, GPR18, GPR183, ENSBTAG00000038268 | 4 | Milk |
| PROT% | 100 | 13 | 46,366,498 | 2.96 × 10⁻⁷ | ADARB2, ENSBTAG00000054346, WDR37, IDI1, GTPBP4, U6, LARP4B, ENSBTAG00000051962 | 15 | Milk |
| PROT% | 5949 | 14 | 465,742 | 2.75 × 10−122 | ARHGAP39, bta-mir-2308, C14H8orf82, LRRC24, LRRC14, RECQL4, MFSD3, GPT, PPP1R16A, FOXH1, KIFC2, CYHR1, TONSL, VPS28, ENSBTAG00000053637, SLC39A4, CPSF1, ADCK5 | 765 | Milk |
| PROT% | 2221 | 15 | 51,232,796 | 1.85 × 10⁻¹³ | STIM1, RHOG, PGAP2, NUP98 | 14 | Health |
| PROT% | 749 | 16 | 60,724,655 | 2.34 × 10⁻⁹ | SOAT1, AXDND1, NPHS2, TDRD5 | 4 | Milk |
| PROT% | 997 | 19 | 35,457,767 | 4.58 × 10⁻⁹ | KCNJ12, UTP18, MBTD1 | 0 | - |
| PROT% | 2201 | 20 | 31,391,058 | 5.47 × 10−45 | PAIP1, ENSBTAG00000049623, C20H5orf34, TMEM267, CCL28, HMGCS1, ENSBTAG00000048672, NIM1K | 72 | Milk |
| PROT% | 40 | 22 | 54,244,267 | 3.21 × 10⁻⁶ | CLEC3B, EXOSC7, ZDHHC3, TMEM42, GHRL, SEC13 | 3 | Milk |
| PROT% | 554 | 23 | 47,176,195 | 8.66 × 10⁻¹⁰ | SLC35B3 | 0 | - |
| PROT% | 25 | 24 | 56,331,031 | 3.77 × 10⁻⁶ | WDR7 | 0 | - |
| PROT% | 5 | 25 | 14,923,140 | 2.20 × 10⁻⁶ | ENSBTAG00000051040 | 6 | Milk |
| PROT% | 281 | 26 | 23,088,324 | 2.56 × 10⁻⁸ | GBF1, NFKB2, PSD, FBXL15, CUEDC2, bta-mir-146b, MFSD13A, ACTR1A, SUFU | 40 | Milk |
| PROT% | 26 | 28 | 35,624,139 | 1.40 × 10⁻⁵ | ENSBTAG00000048082, SFTPD, MBL1, SFTPA1, ENSBTAG00000052322, MAT1A, DYDC1 | 2 | Health |
| PROT% | 686 | 29 | 40,803,159 | 4.78 x10⁻¹⁰ | ASRGL1, ENSBTAG00000042287, SCGB1A1, AHNAK | 19 | Milk |
| LP | 2 | 4 | 19,848,832 | 1.74 × 10⁻⁶ | THSD7A | 2 | Milk |
| LP | 23 | 6 | 104,139,800 | 6.86 × 10⁻⁶ | STK32B, 5S_rRNA, CYTL1 | 8 | Milk |
| LP | 3 | 7 | 2,852,946 | 9.20 × 10⁻⁶ | ENSBTAG00000051744, ENSBTAG00000052719, ENSBTAG00000049190 | 1 | Milk |
| LP | 3 | 8 | 59,108,254 | 1.81 × 10⁻⁶ | ENSBTAG00000042498, ENSBTAG00000049991, FAM205C | 0 | - |
| LP | 2 | 9 | 11,532,901 | 2.65 × 10⁻⁵ | RIMS1 | 1 | Reproduction |
| LP | 5 | 12 | 68,955,769 | 1.48 × 10⁻⁵ | ENSBTAG00000054671, ENSBTAG00000051263, DCT, ENSBTAG00000051519, 5S_rRNA | 8 | Milk |
| LP | 0 | 14 | 10,086,164 | 9.93 × 10⁻⁶ | - | 17 | Milk |
| LP | 2 | 15 | 17,222,016 | 1.88 × 10⁻⁵ | ELMOD1, SLN | 3 | Reproduction |
| LP | 0 | 17 | 35,605,687 | 1.69 × 10⁻⁵ | - | 0 | - |
| LP | 26 | 18 | 54,117,753 | 8.56 × 10⁻⁷ | ARHGAP35, NPAS1, TMEM160, ZC3H4, SAE1 | 4 | Production |
| LP | 25 | 19 | 36,768,672 | 5.36 × 10⁻⁶ | DLX4, ENSBTAG00000045805, U6, ENSBTAG00000053450, ENSBTAG00000049677, KAT7, ENSBTAG00000052793 | 20 | Milk |
| LP | 4 | 21 | 31,125,876 | 2.14 × 10⁻⁵ | UBE2Q2, ENSBTAG00000048528, FBXO22, ENSBTAG00000043187 | 0 | - |
| LP | 3 | 22 | 48,814,749 | 1.19 × 10⁻⁶ | POC1A, DUSP7 | 4 | Milk |
| LP | 16 | 23 | 15,502,651 | 1.39 × 10⁻⁵ | FOXP4, MDFI, TFEB, PGC, FRS3, ENSBTAG00000038916, TOMM6 | 3 | Milk |
| LP | 15 | 26 | 51,053,430 | 5.16 × 10⁻⁶ | INPP5A, ENSBTAG00000054967 | 0 | - |
| LP | 2 | 27 | 35,948,511 | 3.46 × 10⁻⁵ | ZMAT4 | 1 | Meat/Carcass |
| LP | 2 | 28 | 34,869,857 | 5.28 × 10⁻⁷ | ZMIZ1, PPIF | 5 | Milk |
| LP | 1 | 29 | 22,382,652 | 2.17 × 10⁻⁵ | SLC17A6 | 0 | - |
| Trait | GO | Term | p-Value | Genes |
|---|---|---|---|---|
| MILK | GO:0004890 | GABA-A receptor activity | 2.4 × 10⁻⁴ | GABRA2, GABRG1, GABRA4, GABRB1, and GABRD |
| MILK | GO:0006749 | Glutathione metabolic process | 6.7 × 10⁻⁴ | OPLAH, ALDH5A1, CLIC5, GSTA2, GSTA3, GSTA4, GSTK1, and MGST1 |
| MILK | GO:0005230 | Extracellular ligand-gated ion channel activity | 7.9 × 10⁻⁴ | GABRA2, GABRG1, GABRA4, GABRB1, and GABRD |
| MILK | GO:1903496 | Response to 11-deoxycorticosterone | 1.4 × 10⁻³ | CSN1S1, CSN1S2, CSN2, and CSN3 |
| MILK | GO:0007605 | sensory perception of sound | 3.2 × 10⁻³ | BARHL1, EYA4, FBXO11, NIPBL, USH1G, CLIC5, CHD7, COL2A1, DCDC2, MYH14, SNAI2, SLC1A3, and TUB |
| MILK | GO:0005513 | Detection of calcium ion | 7.0 × 10⁻³ | CALM2, CALM3, KCNMB4, and STIM1 |
| MILK | GO:0043950 | Positive regulation of cAMP-mediated signaling | 7.0 × 10⁻³ | CXCL10, CXCL11, CXCL9, and PTGIR |
| MILK | GO:0003273 | Cell migration involved in endocardial cushion formation | 8.3 × 10⁻³ | DCHS1, NOTCH1, and SNAI2 |
| MILK | GO:0071479 | Cellular response to ionizing radiation | 9.4 × 10⁻³ | FBXO4, RAD1, CLOCK, EEF1D, SPIDR, and SNAI2 |
| MILK | GO:0004364 | Glutathione transferase activity | 1.0 × 10⁻³ | CLIC5, GSTA2, GSTA3, GSTA4, GSTA5, GSTK1, and MGST1 |
| FAT | GO:0015125 | Bile acid transmembrane transporter activity | 4.1 × 10⁻⁴ | SLCO1A2, SLCO1B3, SLCO1C1, and SLCO2B1 |
| FAT | GO:0055089 | Fatty acid homeostasis | 5.4 × 10⁻⁴ | POLD1, DGAT1, GOT1, GPAM, and INS |
| FAT | GO:0030154 | Cell differentiation | 6.1 × 10⁻⁴ | DHCR7, EHF, ETV6, EYA3, HCK, SPIB, CREBL2, EXT2, GADD45B, GADD45G, MGP, NR5A1, PPDPF, PRRC2B, PTK2, PTK6, RGS19, SCX, SFRP5, STYK1, SNAPC4, SRMS, TRAPPC9, and TTF1 |
| FAT | GO:0007275 | Multicellular organism development | 2.4 × 10⁻³ | ALX4, DDX1, EYA3, SUFU, TNFRSF1A, TNFRSF6B, GADD45B, GADD45G, LBH, LTBR, PPDPF, PLCZ1, SFRP5, STRBP, SPRED2, TPI1, TRIM5,4 and ZFAT |
| FAT | GO:0000978 | RNA polymerase II core promoter proximal region sequence-specific DNA binding | 2.7 × 10⁻³ | AEBP2, EHF, ETV6, FEZF2, FOSL2, JDP2, MAFA, MXD1, MEIS1, NACC2, SOX18, TLX1, ASCL2, BHLHE41, BATF, CHD7, FOXJ2, GMEB2, HSF1, HHEX, NR1H2, NR6A1, OTX1, TP73, and ZGPAT |
| FAT | GO:0042127 | Regulation of cell proliferation | 4.3 × 10⁻³ | DHCR7, HCK, NDRG1, NKX2-3, SRC, TNFRSF1A, TNFRSF6B, APOBEC1, GUCY2C, HHEX, LTBR, PTGS1, PTK2, PTK6, STYK1, and SRMS |
| FAT | GO:0016509 | Long-chain-3-hydroxyacyl-CoA dehydrogenase activity | 6.5 × 10⁻³ | HADHA, HADHB, and HSD17B12 |
| FAT | GO:0036094 | Small molecule binding | 7.2 × 10⁻³ | LCN2, LCN9, PAEP, and RBP4 |
| FAT | GO:0001671 | ATPase activator activity | 9.9 × 10⁻³ | AHSA2, ATP1B3, TOR1AIP1, and TOR1AIP2 |
| FAT% | GO:0005149 | Interleukin-1 receptor binding | 8.5 × 10⁻⁸ | IL1A, IL1B, IL1F10, IL1RN, IL36RN, IL36A, IL36B, IL36G, and IL37 |
| FAT% | GO:0007585 | Respiratory gaseous exchange | 7.6 × 10⁻⁴ | PBX3, TLX3, CHST11, FUT8, GRIN1, SFTPB, and SFTPD |
| FAT% | GO:0015125 | Bile acid transmembrane transporter activity | 9.1 × 10⁻⁴ | SLCO1A2, SLCO1B3, SLCO1C1, and SLCO2B1 |
| FAT% | GO:0015459 | Potassium channel regulator activity | 3.6 × 10⁻³ | DPP6, LRRC26, KCNMB4, KCNIP4, KCNE1, KCNE2, and KCNE3 |
| FAT% | GO:0005031 | Tumor necrosis factor-activated receptor activity | 5.1 × 10⁻³ | RELT, TNFRSF1A, TNFRSF1B, TNFRSF8, LTBR, and NGFR |
| Trait | GO | Term | p-Value | Genes |
|---|---|---|---|---|
| PROT | GO:0008289 | Lipid binding | 1.7 × 10⁻⁵ | BPIFA1, BPIFA3, BPIFA2A, BPIFA2B, BPIFA2C, BPIFB1, BPIFB2, BPIFB3, BPIFB4, BPIFB6, ACBD7, and PLTP |
| PROT | GO:0016998 | Cell wall macromolecule catabolic process | 6.9 × 10⁻⁵ | LYSB, LYZ1, LYZ3, LYZ2, and LYZ |
| PROT | GO:0003796 | Lysozyme activity | 8.0 × 10⁻⁵ | LYSB, LYZ1, LYZ3, LYZ2, and LYZ |
| PROT | GO:0042742 | Defense response to bacterium | 1.2 × 10⁻⁴ | DEFB122, DEFB122A, CSN1S2, DEFB116, DEFB119, DEFB123, DEFB124, DEFB119, HSTN, LYZ1, and NOD2 |
| PROT | GO:0019835 | Cytolysis | 1.7 × 10⁻⁴ | LYSB, LYZ1, LYZ3, LYZ2, and LYZ |
| PROT | GO:1903496 | Response to 11-deoxycorticosterone | 2.4 × 10⁻⁴ | CSN1S1, CSN1S2, CSN2, and CSN3 |
| PROT | GO:0050829 | Defense response to Gram-negative bacterium | 8.5 × 10⁻⁴ | BPI, LYSB, LYZ1, LYZ3, LYZ2, and LYZ |
| PROT | GO:0045087 | Innate immune response | 2.7 × 10⁻³ | BPIFA1, BPIFB1, BPIFB3, CYLD, HCK, DEFB122, DEFB122A, DEFB116, DEFB119, DEFB123, DEFB124, NOD2, TRIM10, TRIM15, and TRIM31 |
| PROT | GO:0032570 | Response to progesterone | 3.4 × 10⁻³ | CSN1S1, CSN1S2, CSN2, and CSN3 |
| PROT | GO:0032355 | Response to estradiol | 3.4 × 10⁻³ | CSN1S1, CSN1S2, CSN2, and CSN3 |
| PROT | GO:0007586 | Digestion | 6.4 × 10⁻³ | LYZ1, LYZ3, LYZ2, and UCN3 |
| PROT | GO:0045028 | G-protein coupled purinergic nucleotide receptor activity | 6.4 × 10⁻³ | GPR171, GPR87, P2RY12, and P2RY14 |
| PROT | GO:0050830 | Defense response to Gram-positive bacterium | 9.2 × 10⁻³ | H2B, LYSB, LYZ1, LYZ3, LYZ2, and LYZ |
| PROT% | GO:0005149 | Interleukin-1 receptor binding | 9.0 × 10⁻⁸ | IL1A, IL1RN, IL36A, IL36B, IL37, IL1B, IL36G, IL36RN, IRAK4, and IL1F10 |
| PROT% | GO:1903496 | Response to 11-deoxycorticosterone | 3.5 × 10⁻⁴ | CSN1S2, CSN3, LALBA, CSN1S1, and CSN2 |
| PROT% | GO:1903494 | Response to dehydroepiandrosterone | 3.5 × 10⁻⁴ | CSN1S2, CSN3, LALBA, CSN1S1, and CSN2 |
| PROT% | GO:0005452 | Inorganic anion exchanger activity | 3.8 × 10⁻⁴ | SLC22A12, SLC4A8, SLC22A6, SLC22A8, SLC4A4, SLC22A10, SLC4A5, SLC22A9, and SLC22A11 |
| PROT% | GO:0032355 | Response to estradiol | 2.0 × 10⁻³ | STAT3, CSN1S2, CSN3, LALBA, CSN1S1, and CSN2 |
| PROT% | GO:0015347 | Sodium-independent organic anion transmembrane transporter activity | 2.2 × 10⁻³ | SLC22A12, SLC22A6, SLCO4A1, SLCO2B1, SLC22A8, SLC22A10, SLC22A9, and SLC22A11 |
| PROT% | GO:0046983 | Protein dimerization activity | 2.6 × 10⁻³ | TFAP2A, PPP3CA, STAT5B, HEY1, MYC, ID2, TCF23, STAT3, ANO4, and E2F6 |
| PROT% | GO:0043252 | Sodium-independent organic anion transport | 3.0 × 10⁻³ | SLC22A12, SLC22A6, SLCO4A1, SLCO2B1, SLC22A8, SLC22A10, SLC22A9, and SLC22A11 |
| PROT% | GO:0043153 | Entrainment of circadian clock by photoperiod | 3.3 × 10⁻³ | PPP1CB, PER1, RBM4, ID2, CRY1, RBM4B, and TP53 |
| PROT% | GO:0007595 | Lactation | 3.9 × 10⁻³ | STAT5A, STAT5B, VDR, NEURL1, ATP2B2, CSN3, CSN2, and PRLR |
| PROT% | GO:0007259 | JAK-STAT cascade | 4.8 × 10⁻³ | STAT5A, STAT5B, CTR9, IL31RA, PRLR, and SOCS5 |
| PROT% | GO:0030282 | Bone mineralization | 5.1 × 10⁻³ | KLF10, CLEC3B, WNT11, PKDCC, RSPO2, FBXL15, IFITM5, and LGR4 |
| PROT% | GO:0048013 | Ephrin receptor signaling pathway | 6.2 × 10⁻³ | EPHB6, EFNA1, EFNA3, EFNB3, NCK2, EFNA4, and PTK2 |
| PROT% | GO:0010628 | Positive regulation of gene expression | 6.4 × 10⁻³ | CRP, SEC16B, OSR2, RAMP2, PRKAA1, ODAM, ROCK2, RBM4B, SCX, SERPINB9, LRRC32, WNT11, FGF8, FABP4, ID2, KIT, RPS3, DROSHA, STAP1, KRAS, APOB, IL7R, ZBTB7B, and ZPR1 |
| PROT% | GO:0008380 | RNA splicing | 6.5 × 10⁻³ | RBFOX2, MTERF3, PRPF4B, MAGOHB, JMJD6, RBM4, RBMXL2, PUF60, C1QBP, SRSF2, LUC7L3, PABPC1, SRSF7, and ZPR1 |
| PROT% | GO:0005344 | Oxygen transporter activity | 6.9 × 10⁻³ | MB, HBE2, HBE1, HBE4, HBB, and CYGB |
| PROT% | GO:0006397 | mRNA processing | 7.1 × 10⁻³ | RNASEL, RBFOX2, DDX1, PRPF4B, HNRNPLL, MAGOHB, JMJD6, RBM4, RBMXL2, ALKBH5, PUF60, C1QBP, SRSF2, PABPC1, AURKAIP1, SRSF7, and ZPR1 |
| PROT% | GO:0048704 | Embryonic skeletal system morphogenesis | 7.8 × 10⁻³ | OSR2, COL11A1, PCGF2, HOXB4, HOXB3, HOXB2, HOXB1, HOXB7, and DSCAML1 |
| LP | GO:0030334 | Regulation of cell migration | 1.3 × 10⁻¹ | ABI3 and LDB2 |
| LP | GO:1903955 | Positive regulation of protein targeting to mitochondrion | 1.5 × 10⁻¹ | ELMOD1 and SAE1 |
| LP | GO:0004867 | Serine-type endopeptidase inhibitor activity | 1.9 × 10⁻¹ | SERPINB6 and SERPINB9 |
Publisher’s Note: MDPI stays neutral with regard to jurisdictional claims in published maps and institutional affiliations. |
© 2021 by the authors. Licensee MDPI, Basel, Switzerland. This article is an open access article distributed under the terms and conditions of the Creative Commons Attribution (CC BY) license (https://creativecommons.org/licenses/by/4.0/).
Share and Cite
Pedrosa, V.B.; Schenkel, F.S.; Chen, S.-Y.; Oliveira, H.R.; Casey, T.M.; Melka, M.G.; Brito, L.F. Genomewide Association Analyses of Lactation Persistency and Milk Production Traits in Holstein Cattle Based on Imputed Whole-Genome Sequence Data. Genes 2021, 12, 1830. https://doi.org/10.3390/genes12111830
Pedrosa VB, Schenkel FS, Chen S-Y, Oliveira HR, Casey TM, Melka MG, Brito LF. Genomewide Association Analyses of Lactation Persistency and Milk Production Traits in Holstein Cattle Based on Imputed Whole-Genome Sequence Data. Genes. 2021; 12(11):1830. https://doi.org/10.3390/genes12111830
Chicago/Turabian StylePedrosa, Victor B., Flavio S. Schenkel, Shi-Yi Chen, Hinayah R. Oliveira, Theresa M. Casey, Melkaye G. Melka, and Luiz F. Brito. 2021. "Genomewide Association Analyses of Lactation Persistency and Milk Production Traits in Holstein Cattle Based on Imputed Whole-Genome Sequence Data" Genes 12, no. 11: 1830. https://doi.org/10.3390/genes12111830
APA StylePedrosa, V. B., Schenkel, F. S., Chen, S.-Y., Oliveira, H. R., Casey, T. M., Melka, M. G., & Brito, L. F. (2021). Genomewide Association Analyses of Lactation Persistency and Milk Production Traits in Holstein Cattle Based on Imputed Whole-Genome Sequence Data. Genes, 12(11), 1830. https://doi.org/10.3390/genes12111830