
Noninvasive Genetic Assessment Is an Effective Wildlife Research Tool When Compared with Other Approaches


Abstract
1. Introduction
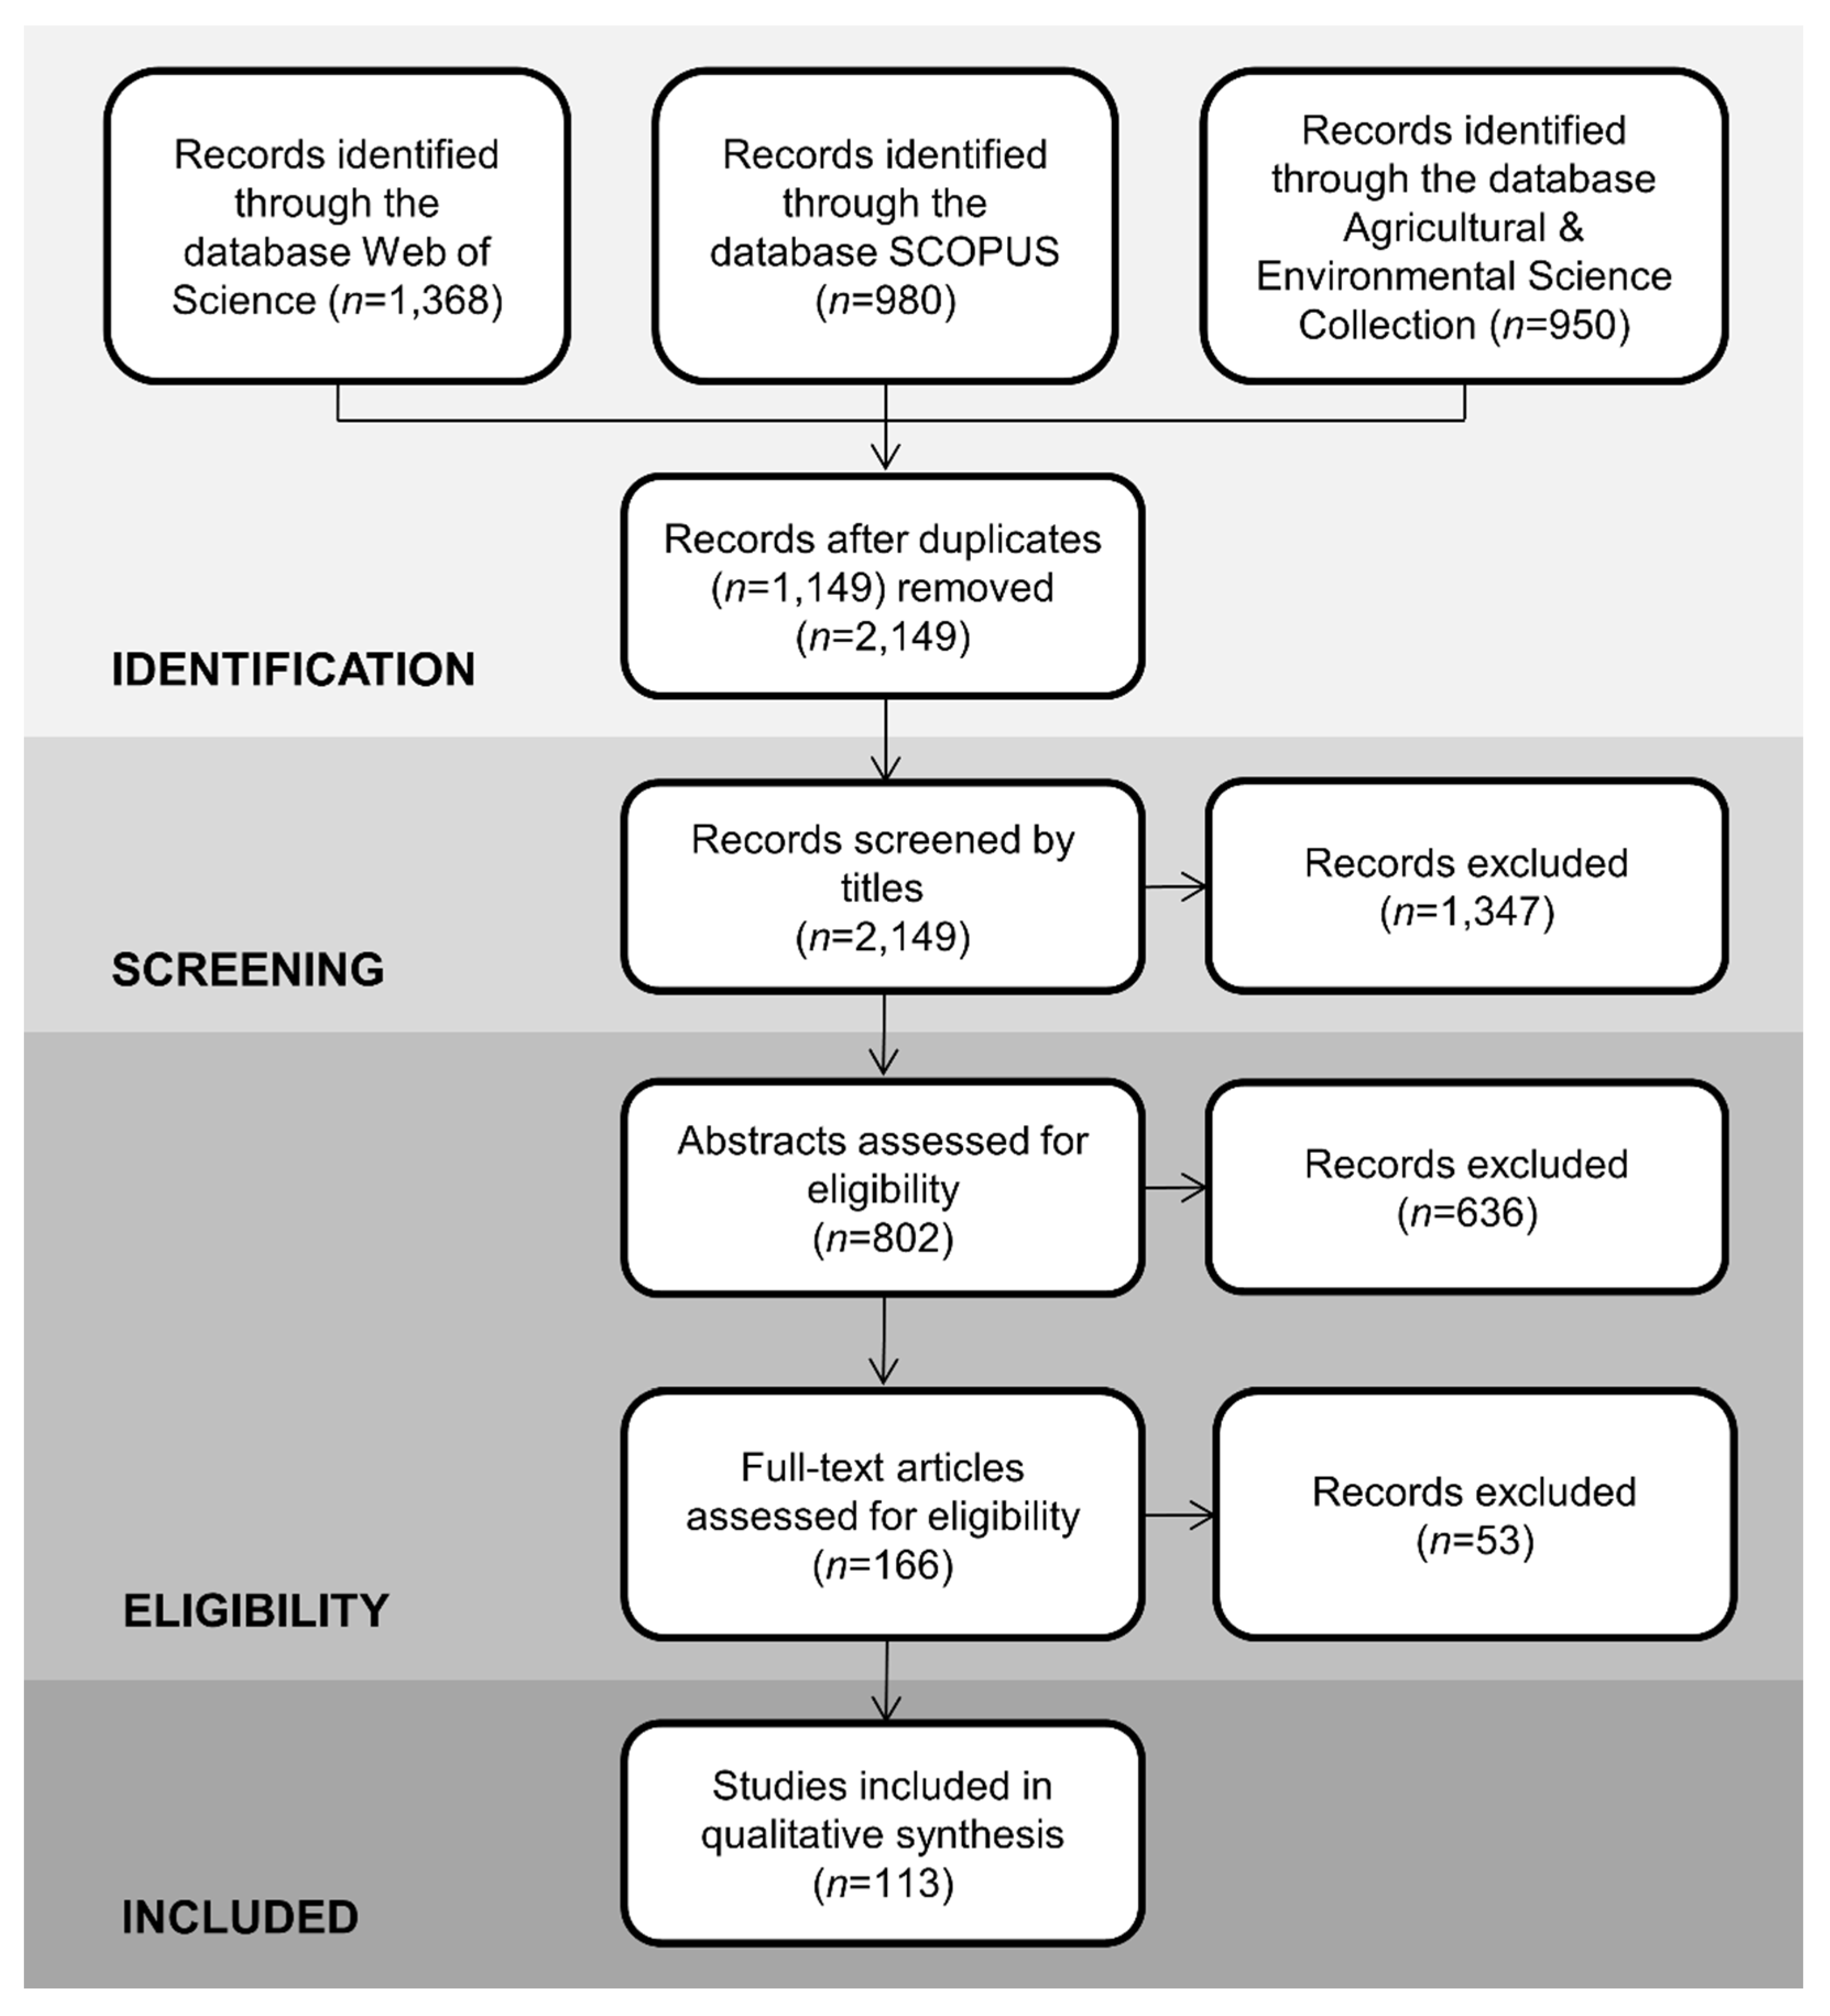
2. Materials and Methods
3. Results
3.1. Geographical and Temporal Patterns
3.2. General Characteristics of the Included Studies
3.3. Performance of Noninvasive Genetic Assessment
3.3.1. Comparison of Genotyping Success
3.3.2. Species Detection
3.3.3. Population Size Estimation
3.3.4. Diet Analysis
3.3.5. Species Identification
3.3.6. Health Monitoring
3.3.7. Individual Identification
3.4. Costs and Time Effort
4. Discussion
4.1. Efficacy of Noninvasive Genetic Assessment
4.1.1. Noninvasive vs. Invasive Genetic Assessment
4.1.2. Noninvasive Genetic Assessment vs. Other Research Approaches
4.2. Species Bias
4.3. Animal Welfare Considerations
4.4. Cost and Time Effort Advantages
4.5. Study Limitations
5. Conclusions
Supplementary Materials
Funding
Data Availability Statement
Acknowledgments
Conflicts of Interest
References
- Díaz, S.; Zafra-Calvo, N.; Purvis, A.; Verburg, P.H.; Obura, D.; Leadley, P.; Chaplin-Kramer, R.; De Meester, L.; Dulloo, E.; Martín-López, B.; et al. Set ambitious goals for biodiversity and sustainability. Science 2020, 370, 411. [Google Scholar] [CrossRef]
- Pradel, R. Utilization of capture-mark-recapture for the study of recruitment and population growth rate. Biometrics 1996, 52, 703–709. [Google Scholar] [CrossRef]
- Verfuss, U.K.; Aniceto, A.S.; Harris, D.V.; Gillespie, D.; Fielding, S.; Jiménez, G.; Johnston, P.; Sinclair, R.R.; Sivertsen, A.; Solbø, S.A.; et al. A review of unmanned vehicles for the detection and monitoring of marine fauna. Mar. Pollut. Bull. 2019, 140, 17–29. [Google Scholar] [CrossRef]
- Smith, J.A.; Suraci, J.P.; Hunter, J.S.; Gaynor, K.M.; Keller, C.B.; Palmer, M.S.; Atkins, J.L.; Castañeda, I.; Cherry, M.J.; Garvey, P.M.; et al. Zooming in on mechanistic predator–prey ecology: Integrating camera traps with experimental methods to reveal the drivers of ecological interactions. J. Anim. Ecol. 2020, 89, 1997–2012. [Google Scholar] [CrossRef]
- Höfle, U.; Millán, J.; Gortázar, C.; Buenestado, F.J.; Marco, I.; Villafuerte, R. Self-injury and capture myopathy in net-captured juvenile red-legged partridge with necklace radiotags. Wildl. Soc. Bull. 2004, 32, 344–350. [Google Scholar] [CrossRef]
- Atuo, F.A.; Roberts, K.; Whitmore, S.; Dotters, B.P.; Raphael, M.G.; Sawyer, S.C.; Keane, J.J.; Gutierrez, R.J.; Peery, M.Z. Resource selection by GPS-tagged California spotted owls in mixed-ownership forests. For. Ecol. Manag. 2019, 433, 295–304. [Google Scholar] [CrossRef]
- Cromsigt, J.P.G.M.; van Rensburg, S.J.; Etienne, R.S.; Olff, H. Monitoring large herbivore diversity at different scales: Comparing direct and indirect methods. Biodivers. Conserv. 2009, 18, 1219–1231. [Google Scholar] [CrossRef]
- Lioy, S.; Braghiroli, S.; Dematteis, A.; Meneguz, P.G.; Tizzani, P. Faecal pellet count method: Some evaluations of dropping detectability for Capreolus capreolus Linnaeus, 1758 (Mammalia: Cervidae), Cervus elaphus Linnaeus, 1758 (Mammalia: Cervidae) and Lepus europaeus Pallas, 1778 (Mammalia: Leporidae). Ital. J. Zool. 2015, 82, 231–237. [Google Scholar]
- Zemanova, M.A. Poor implementation of non-invasive sampling in wildlife genetics studies. Rethink. Ecol. 2019, 4, 119–132. [Google Scholar] [CrossRef]
- Sollmann, R.; Torres, N.M.; Furtado, M.M.; de Almeida Jacomo, A.T.; Palomares, F.; Roques, S.; Silveira, L. Combining camera-trapping and noninvasive genetic data in a spatial capture-recapture framework improves density estimates for the jaguar. Biol. Conserv. 2013, 167, 242–247. [Google Scholar] [CrossRef]
- Aleix-Mata, G.; Adrados, B.; Boos, M.; Marty, E.; Mourieres, P.; Tucat, G.; Thion, N.; Mossoll-Torres, M.; Pérez, J.M.; Sánchez, A. Comparing methods for estimating the abundance of western capercaillie Tetrao urogallus males in Pyrenean leks: Singing counts versus genetic analysis of non-invasive samples. Bird Study 2019, 66, 565–569. [Google Scholar] [CrossRef]
- Rosellini, S.; Osorio, E.; Ruiz-Gonzalez, A.; Isabel, A.P.; Barja, I. Monitoring the small-scale distribution of sympatric European pine martens (Martes martes) and stone martens (Martes foina): A multievidence approach using faecal DNA analysis and camera-traps. Wildl. Res. 2008, 35, 434–440. [Google Scholar] [CrossRef]
- Wadley, J.J.; Austin, J.J.; Fordham, D.A. Genetic inference as a method for modelling occurrence: A viable alternative to visual surveys. Austral Ecol. 2014, 39, 952–962. [Google Scholar] [CrossRef]
- Monteiro, N.M.; Silva, R.M.; Cunha, M.; Antunes, A.; Jones, A.G.; Vieira, M.N. Validating the use of colouration patterns for individual recognition in the worm pipefish using a novel set of microsatellite markers. Mol. Ecol. Resour. 2014, 14, 150–156. [Google Scholar] [CrossRef]
- DeMay, S.M.; Rachlow, J.L.; Waits, L.P.; Becker, P.A. Comparing telemetry and fecal DNA sampling methods to quantify survival and dispersal of juvenile pygmy rabbits. Wildl. Soc. Bull. 2015, 39, 413–421. [Google Scholar] [CrossRef]
- Deagle, B.E.; Gales, N.J.; Evans, K.; Jarman, S.N.; Robinson, S.; Trebilco, R.; Hindell, M.A. Studying seabird diet through genetic analysis of faeces: A case study on macaroni penguins (Eudyptes chrysolophus). PLoS ONE 2007, 2, e831. [Google Scholar] [CrossRef]
- Gosselin, E.N.; Lonsinger, R.C.; Waits, L.P. Comparing morphological and molecular diet analyses and fecal DNA sampling protocols for a terrestrial carnivore. Wildl. Soc. Bull. 2017, 41, 362–369. [Google Scholar] [CrossRef]
- Thalinger, B.; Oehm, J.; Obwexer, A.; Traugott, M. The influence of meal size on prey DNA detectability in piscivorous birds. Mol. Ecol. Resour. 2017, 17, e174–e186. [Google Scholar] [CrossRef]
- Babb, P.L.; McIntosh, A.M.; Fernandez-Duque, E.; Di Fiore, A.; Schurr, T.G. An optimized microsatellite genotyping strategy for assessing genetic identity and kinship in Azara’s owl monkeys (Aotus azarai). Folia Primatol. 2011, 82, 107–117. [Google Scholar] [CrossRef]
- Wedrowicz, F.; Mosse, J.; Wright, W.; Hogan, F.E. Validating the use of non-invasively sourced DNA for population genetic studies using pedigree data. Web Ecol. 2017, 17, 9–18. [Google Scholar] [CrossRef]
- Funfstuck, T.; Arandjelovic, M.; Morgan, D.B.; Sanz, C.; Breuer, T.; Stokes, E.J.; Reed, P.; Olson, S.H.; Cameron, K.; Ondzie, A.; et al. The genetic population structure of wild western lowland gorillas (Gorilla gorilla gorilla) living in continuous rain forest. Am. J. Primatol. 2014, 76, 868–878. [Google Scholar] [CrossRef]
- Balme, G.; Rogan, M.; Thomas, L.; Pitman, R.; Mann, G.; Whittington-Jones, G.; Midlane, N.; Broodryk, M.; Broodryk, K.; Campbell, M.; et al. Big cats at large: Density, structure, and spatio-temporal patterns of a leopard population free of anthropogenic mortality. Popul. Ecol. 2019, 61, 256–267. [Google Scholar] [CrossRef]
- Bhattacharyya, S.; Ishtiaq, F. Noninvasive sampling reveals population genetic structure in the Royle’s pika, Ochotona roylei, in the western Himalaya. Ecol. Evol. 2019, 9, 180–191. [Google Scholar] [CrossRef] [PubMed]
- Pauli, J.N.; Moss, W.E.; Manlick, P.J.; Fountain, E.D.; Kirby, R.; Sultaire, S.M.; Perrig, P.L.; Mendoza, J.E.; Pokallus, J.W.; Heaton, T.H. Examining the uncertain origin and management role of martens on Prince of Wales Island, Alaska. Conserv. Biol. 2015, 29, 1257–1267. [Google Scholar] [CrossRef]
- Stevenson-Holt, C.D.; Sinclair, W. Assessing the geographic origin of the invasive grey squirrel using DNA sequencing: Implications for management strategies. Glob. Ecol. Conserv. 2015, 3, 20–27. [Google Scholar] [CrossRef][Green Version]
- Zemanova, M.A.; Knop, E.; Heckel, G. Phylogeographic past and invasive presence of Arion pest slugs in Europe. Mol. Ecol. 2016, 25, 5747–5764. [Google Scholar] [CrossRef]
- Zemanova, M.A.; Broennimann, O.; Guisan, A.; Knop, E.; Heckel, G. Slimy invasion: Climatic niche and current and future biogeography of Arion slug invaders. Divers. Distrib. 2018, 24, 1627–1640. [Google Scholar] [CrossRef]
- Facon, B.; Jarne, P.; Pointier, J.P.; David, P. Hybridization and invasiveness in the freshwater snail Melanoides tuberculata: Hybrid vigour is more important than increase in genetic variance. J. Evol. Biol. 2005, 18, 524–535. [Google Scholar] [CrossRef] [PubMed]
- Garroway, C.J.; Bowman, J.; Cascaden, T.J.; Holloway, G.L.; Mahan, C.G.; Malcolm, J.R.; Steele, M.A.; Turner, G.; Wilson, P.J. Climate change induced hybridization in flying squirrels. Glob. Chang. Biol. 2010, 16, 113–121. [Google Scholar] [CrossRef]
- Crossman, C.A.; Taylor, E.B.; Barrett-Lennard, L.G. Hybridization in the Cetacea: Widespread occurrence and associated morphological, behavioral, and ecological factors. Ecol. Evol. 2016, 6, 1293–1303. [Google Scholar] [CrossRef]
- Zemanova, M.A.; Knop, E.; Heckel, G. Introgressive replacement of natives by invading Arion pest slugs. Sci. Rep. 2017, 7, 14908. [Google Scholar] [CrossRef] [PubMed]
- Garza, J.C.; Williamson, E.G. Detection of reduction in population size using data from microsatellite loci. Mol. Ecol. 2001, 10, 305–318. [Google Scholar] [CrossRef]
- Estoup, A.; Beaumont, M.; Sennedot, F.; Moritz, C.; Cornuet, J.M. Genetic analysis of complex demographic scenarios: Spatially expanding populations of the cane toad, Bufo marinus. Evolution 2004, 58, 2021–2036. [Google Scholar] [CrossRef] [PubMed]
- Pavlacky, D.C.; Goldizen, A.W.; Prentis, P.J.; Nicholls, J.A.; Lowe, A.J. A landscape genetics approach for quantifying the relative influence of historic and contemporary habitat heterogeneity on the genetic connectivity of a rainforest bird. Mol. Ecol. 2009, 18, 2945–2960. [Google Scholar] [CrossRef] [PubMed]
- Quemere, E.; Crouau-Roy, B.; Rabarivola, C.; Louis, E.E.; Chikhi, L. Landscape genetics of an endangered lemur (Propithecus tattersalli) within its entire fragmented range. Mol. Ecol. 2010, 19, 1606–1621. [Google Scholar] [CrossRef]
- Engler, J.O.; Balkenhol, N.; Filz, K.J.; Habel, J.C.; Rodder, D. Comparative landscape genetics of three closely related sympatric Hesperid butterflies with diverging ecological traits. PLoS ONE 2014, 9, e106526. [Google Scholar] [CrossRef]
- Ogden, R.; Langenhorst, T.; McEwing, R.; Woodfine, T. Genetic markers and sample types for pedigree reconstruction in Grevy’s zebra (Equus grevyi). Der Zool. Gart. 2007, 77, 29–35. [Google Scholar] [CrossRef]
- Balestrieri, A.; Ruiz-González, A.; Vergara, M.; Capelli, E.; Tirozzi, P.; Alfino, S.; Minuti, G.; Prigioni, C.; Saino, N. Pine marten density in lowland riparian woods: A test of the Random Encounter Model based on genetic data. Mamm. Biol. 2016, 81, 439–446. [Google Scholar] [CrossRef]
- Moqanaki, E.M.; Jiménez, J.; Bensch, S.; José Vicente, L.-B. Counting bears in the Iranian Caucasus: Remarkable mismatch between scientifically-sound population estimates and perceptions. Biol. Conserv. 2018, 220, 182–191. [Google Scholar] [CrossRef]
- Zemanova, M.A. Towards more compassionate wildlife research through the 3Rs principles: Moving from invasive to non-invasive methods. Wildl. Biol. 2020, 1, wlb.00607. [Google Scholar] [CrossRef]
- Lefort, M.C.; Cruickshank, R.H.; Descovich, K.; Adams, N.J.; Barun, A.; Emami-Khoyi, A.; Ridden, J.; Smith, V.R.; Sprague, R.; Waterhouse, B.; et al. Blood, sweat and tears: A review of non-invasive DNA sampling. bioRxiv 2019, 385120. [Google Scholar] [CrossRef]
- Morin, P.A.; Wallis, J.; Moore, J.J.; Chakraborty, R.; Woodruff, D.S. Noninvasive sampling and DNA amplification for paternity exclusion, community structure, and phylogeography in wild chimpanzees. Primates 1993, 34, 347–356. [Google Scholar] [CrossRef]
- Hoss, M.; Kohn, M.; Paabo, S.; Knauer, F.; Schroder, W. Excrement analysis by PCR. Nature 1992, 359, 199. [Google Scholar] [CrossRef] [PubMed]
- Carroll, E.L.; Bruford, M.W.; DeWoody, J.A.; Leroy, G.; Strand, A.; Waits, L.; Wang, J.L. Genetic and genomic monitoring with minimally invasive sampling methods. Evol. Appl. 2018, 11, 1094–1119. [Google Scholar] [CrossRef] [PubMed]
- Lopes, C.M.; Sasso, T.; Valentini, A.; Dejean, T.; Martins, M.; Zamudio, K.R.; Haddad, C.F.B. eDNA metabarcoding: A promising method for anuran surveys in highly diverse tropical forests. Mol. Ecol. Resour. 2017, 17, 904–914. [Google Scholar] [CrossRef]
- Gillet, B.; Cottet, M.; Destanque, T.; Kue, K.; Descloux, S.; Chanudet, V.; Hughes, S. Direct fishing and eDNA metabarcoding for biomonitoring during a 3-year survey significantly improves number of fish detected around a South East Asian reservoir. PLoS ONE 2018, 13, e0208592. [Google Scholar] [CrossRef] [PubMed]
- Leempoel, K.; Hebert, T.; Hadly, E.A. A comparison of eDNA to camera trapping for assessment of terrestrial mammal diversity. Proc. R. Soc. B 2020, 287, 20192353. [Google Scholar] [CrossRef] [PubMed]
- Adams, C.I.M.; Knapp, M.; Gemmell, N.J.; Jeunen, G.-J.; Bunce, M.; Lamare, M.D.; Taylor, H.R. Beyond biodiversity: Can environmental DNA (eDNA) cut it as a population genetics tool? Genes 2019, 10, 192. [Google Scholar] [CrossRef] [PubMed]
- Liberati, A.; Altman, D.G.; Tetzlaff, J.; Mulrow, C.; Gotzsche, P.C.; Ioannidis, J.P.A.; Clarke, M.; Devereaux, P.J.; Kleijnen, J.; Moher, D. The PRISMA statement for reporting systematic reviews and meta-analyses of studies that evaluate health care interventions: Explanation and elaboration. PLoS Med. 2009, 6, e1000100. [Google Scholar] [CrossRef]
- Bramer, W.M.; Rethlefsen, M.L.; Kleijnen, J.; Franco, O.H. Optimal database combinations for literature searches in systematic reviews: A prospective exploratory study. Syst. Rev. 2017, 6, 245. [Google Scholar] [CrossRef] [PubMed]
- Martin, L.J.; Blossey, B.; Ellis, E. Mapping where ecologists work: Biases in the global distribution of terrestrial ecological observations. Front. Ecol. Environ. 2012, 10, 195–201. [Google Scholar] [CrossRef]
- Karlsson, S.; Larsen, B.M.; Eriksen, L.; Hagen, M. Four methods of nondestructive DNA sampling from freshwater pearl mussels Margaritifera margaritifera L. (Bivalvia: Unionoida). Freshw. Sci. 2013, 32, 525–530. [Google Scholar] [CrossRef]
- Duenas, J.F.; Cruickshank, R.; Ross, J. Optimisation of a microsatellite panel for the individual identification of brushtail possums using low template DNA. N. Z. J. Ecol. 2015, 39, 93–102. [Google Scholar]
- Ringler, E. Testing skin swabbing for DNA sampling in dendrobatid frogs. Amphib.-Reptil. 2018, 39, 245–251. [Google Scholar] [CrossRef]
- Fisher, J.T.; Bradbury, S. A multi-method hierarchical modeling approach to quantifying bias in occupancy from noninvasive genetic tagging studies. J. Wildl. Manag. 2014, 78, 1087–1095. [Google Scholar] [CrossRef]
- Monterroso, P.; Rich, L.N.; Serronha, A.; Ferreras, P.; Alves, P.C. Efficiency of hair snares and camera traps to survey mesocarnivore populations. Eur. J. Wildl. Res. 2014, 60, 279–289. [Google Scholar] [CrossRef]
- Ruibal, M.; Peakall, R.; Claridge, A.; Murray, A.; Firestone, K. Advancement to hair-sampling surveys of a medium-sized mammal: DNA-based individual identification and population estimation of a rare Australian marsupial, the spotted-tailed quoll (Dasyurus maculatus). Wildl. Res. 2010, 37, 27–38. [Google Scholar] [CrossRef]
- Baek, H.E.; Bandivadekar, R.R.; Pandit, P.; Mah, M.; Sehgal, R.N.M.; Tell, L.A. TaqMan quantitative real-time PCR for detecting avipoxvirus DNA in various sample types from hummingbirds. PLoS ONE 2020, 15, e0230701. [Google Scholar] [CrossRef]
- Wu, Q.; Conway, J.; Phillips, K.M.; Stolen, M.; Durden, W.N.; Fauquier, D.; McFee, W.E.; Schwacke, L. Detection of Brucella spp. in bottlenose dolphins Tursiops truncatus by a real-time PCR using blowhole swabs. Dis. Aquat. Org. 2016, 120, 241–244. [Google Scholar] [CrossRef]
- Bertram, M.R.; Hamer, G.L.; Snowden, K.F.; Hartup, B.K.; Hamer, S.A. Coccidian parasites and conservation implications for the endangered whooping crane (Grus americana). PLoS ONE 2015, 10, e0127679. [Google Scholar] [CrossRef]
- Martinsen, E.S.; Brightman, H.; Fleischer, R.C. Fecal samples fail in PCR-based diagnosis of malaria parasite infection in birds. Conserv. Genet. Resour. 2015, 7, 15–17. [Google Scholar] [CrossRef]
- Stenglein, J.L.; Waits, L.P.; Ausband, D.E.; Zager, P.; Mack, C.M. Estimating gray wolf pack size and family relationships using noninvasive genetic sampling at rendezvous sites. J. Mammal. 2011, 92, 784–795. [Google Scholar] [CrossRef]
- Johnson, C.J.; Hodder, D.P.; Crowley, S. Assessing noninvasive hair and fecal sampling for monitoring the distribution and abundance of river otter. Ecol. Res. 2013, 28, 881–892. [Google Scholar] [CrossRef]
- Casper, R.M.; Jarrnan, S.N.; Deagle, B.E.; Gales, N.J.; Hindell, M.A. Detecting prey from DNA in predator scats: A comparison with morphological analysis, using Arctocephalus seals fed a known diet. J. Exp. Mar. Biol. Ecol. 2007, 347, 144–154. [Google Scholar] [CrossRef]
- Espunyes, J.; Espunya, C.; Chaves, S.; Calleja, J.A.; Bartolomé, J.; Serrano, E. Comparing the accuracy of PCR-capillary electrophoresis and cuticle microhistological analysis for assessing diet composition in ungulates: A case study with Pyrenean chamois. PLoS ONE 2019, 14, e0216345. [Google Scholar] [CrossRef]
- King, S.R.B.; Schoenecker, K.A. Comparison of methods to examine diet of feral horses from noninvasively collected fecal samples. Rangel. Ecol. Manag. 2019, 72, 661–666. [Google Scholar] [CrossRef]
- Gold, Z.; Wall, A.R.; Curd, E.E.; Kelly, R.P.; Pentcheff, N.D.; Ripma, L.; Barber, P.H.; Wetzer, R. eDNA metabarcoding bioassessment of endangered fairy shrimp (Branchinecta spp.). Conserv. Genet. Resour. 2020, 12, 685–690. [Google Scholar] [CrossRef]
- Weldon, L.; Ciara, O.L.; Steer, M.; Newton, L.; Macdonald, H.; Sargeant, S.L. A comparison of European eel Anguilla anguilla eDNA concentrations to fyke net catches in five Irish lakes. Environ. DNA 2020, 2, 587–600. [Google Scholar] [CrossRef]
- Pierson, T.W.; McKee, A.M.; Spear, S.F.; Maerz, J.C.; Camp, C.D.; Glenn, T.C. Detection of an enigmatic plethodontid salamander using environmental DNA. Copeia 2016, 104, 78–82. [Google Scholar] [CrossRef]
- Smart, A.S.; Weeks, A.R.; van Rooyen, A.R.; Moore, A.; McCarthy, M.A.; Tingley, R. Assessing the cost-efficiency of environmental DNA sampling. Methods Ecol. Evol. 2016, 7, 1291–1298. [Google Scholar] [CrossRef]
- Cheng, E.; Hodges, K.E.; Sollmann, R.; Mills, L.S. Genetic sampling for estimating density of common species. Ecol. Evol. 2017, 7, 6210–6219. [Google Scholar] [CrossRef] [PubMed]
- Sabino-Marques, H.; Ferreira, C.M.; Paupério, J.; Costa, P.; Barbosa, S.; Encarnação, C.; Alpizar-Jara, R.; Alves, P.C.; Searle, J.B.; Mira, A.; et al. Combining genetic non-invasive sampling with spatially explicit capture-recapture models for density estimation of a patchily distributed small mammal. Eur. J. Wildl. Res. 2018, 64, 44. [Google Scholar] [CrossRef]
- Ford, B.; Govindarajulu, P.; Larsen, K.; Russello, M. Evaluating the efficacy of non-invasive genetic sampling of the Northern Pacific rattlesnake with implications for other venomous squamates. Conserv. Genet. Resour. 2017, 9, 13–15. [Google Scholar] [CrossRef]
- Kilpatrick, H.J.; Goodie, T.J.; Kovach, A.I. Comparison of live-trapping and noninvasive genetic sampling to assess patch occupancy by New England cottontail (Sylvilagus transitionalis) rabbits. Wildl. Soc. Bull. 2013, 37, 901–905. [Google Scholar] [CrossRef]
- Martin-Galvez, D.; Peralta-Sanchez, J.M.; Dawson, D.A.; Martin-Platero, A.M.; Martinez-Bueno, M.; Burke, T.; Soler, J.J. DNA sampling from eggshell swabbing is widely applicable in wild bird populations as demonstrated in 23 species. Mol. Ecol. Resour. 2011, 11, 481–493. [Google Scholar] [CrossRef]
- Ozana, S.; Pyszko, P.; Dolny, A. Determination of suitable insect part for non-lethal DNA sampling: Case study of DNA quality and regeneration capability of dragonflies. Insect Conserv. Divers. 2020, 13, 319–327. [Google Scholar] [CrossRef]
- Foote, A.D.; Thomsen, P.F.; Sveegaard, S.; Wahlberg, M.; Kielgast, J.; Kyhn, L.A.; Salling, A.B.; Galatius, A.; Orlando, L.; Gilbert, M.T.P. Investigating the potential use of environmental DNA (eDNA) for genetic monitoring of marine mammals. PLoS ONE 2012, 7, e41781. [Google Scholar] [CrossRef]
- Alldredge, M.W.; Blecha, T.; Lewis, J.H. Less invasive monitoring of cougars in colorado’s front range. Wildl. Soc. Bull. 2019, 43, 222–230. [Google Scholar] [CrossRef]
- von Thaden, A.; Nowak, C.; Tiesmeyer, A.; Reiners, T.E.; Alves, P.C.; Lyons, L.A.; Mattucci, F.; Randi, E.; Cragnolini, M.; Galián, J.; et al. Applying genomic data in wildlife monitoring: Development guidelines for genotyping degraded samples with reduced single nucleotide polymorphism panels. Mol. Ecol. Resour. 2020, 20, 662–680. [Google Scholar] [CrossRef]
- White, L.C.; Fontsere, C.; Lizano, E.; Hughes, D.A.; Angedakin, S.; Arandjelovic, M.; Granjon, A.C.; Hans, J.B.; Lester, J.D.; Rabanus-Wallace, M.T.; et al. A roadmap for high-throughput sequencing studies of wild animal populations using noninvasive samples and hybridization capture. Mol. Ecol. Resour. 2019, 19, 609–622. [Google Scholar] [CrossRef]
- Schmidt, D.A.; Campbell, N.R.; Govindarajulu, P.; Larsen, K.W.; Russello, M.A. Genotyping-in-Thousands by sequencing (GT-seq) panel development and application to minimally invasive DNA samples to support studies in molecular ecology. Mol. Ecol. Resour. 2020, 20, 114–124. [Google Scholar] [CrossRef] [PubMed]
- Chiou, K.L.; Bergey, C.M. Methylation-based enrichment facilitates low-cost, noninvasive genomic scale sequencing of populations from feces. Sci. Rep. 2018, 8, 1975. [Google Scholar] [CrossRef] [PubMed]
- Harper, L.R.; Bernd, H.; Sayer, C.D.; Read, D.S.; Li, J.; Harper, K.J.; Lawson Handley, L.; Griffiths, N.P.; Blackman, R.C. Development and application of environmental DNA surveillance for the threatened crucian carp (Carassius carassius). Freshw. Biol. 2019, 64, 93–107. [Google Scholar] [CrossRef]
- Velli, E.; Bologna, M.A.; Silvia, C.; Ragni, B.; Randi, E. Non-invasive monitoring of the European wildcat (Felis silvestris silvestris Schreber, 1777): Comparative analysis of three different monitoring techniques and evaluation of their integration. Eur. J. Wildl. Res. 2015, 61, 657–668. [Google Scholar] [CrossRef]
- Stat, M.; Harvey, E.S.; Jeffrey, J.; DiBattista, J.D.; Bunce, M.; Newman, S.J. Combined use of eDNA metabarcoding and video surveillance for the assessment of fish biodiversity. Conserv. Biol. 2019, 33, 196–205. [Google Scholar] [CrossRef] [PubMed]
- Welfelt, L.S.; Beausoleil, R.A.; Wielgus, R.B. Factors associated with black bear density and implications for management. J. Wildl. Manag. 2019, 83, 1527–1539. [Google Scholar] [CrossRef]
- Green, A.M.; Chynoweth, M.W.; Şekercioğlu, Ç.H. Spatially explicit capture-recapture through camera trapping: A review of benchmark analyses for wildlife density estimation. Front. Ecol. Evol. 2020, 8, 563477. [Google Scholar] [CrossRef]
- Kindberg, J.; Ericsson, G.; Swenson, J.E. Monitoring rare or elusive large mammals using effort-corrected voluntary observers. Biol. Conserv. 2009, 142, 159–165. [Google Scholar] [CrossRef]
- Barasona, J.A.; López-Olvera, J.R.; Beltrán-Beck, B.; Gortázar, C.; Vicente, J. Trap-effectiveness and response to tiletamine-zolazepam and medetomidine anaesthesia in Eurasian wild boar captured with cage and corral traps. BMC Vet. Res. 2013, 9, 107. [Google Scholar] [CrossRef]
- Henry, P.; Russello, M.A. Obtaining high-quality DNA from elusive small mammals using low-tech hair snares. Eur. J. Wildl. Res. 2011, 57, 429–435. [Google Scholar] [CrossRef]
- Ferreira, C.M.; Sabino-Marques, H.; Barbosa, S.; Costa, P.; Encarnação, C.; Alpizar-Jara, R.; Pita, R.; Beja, P.; Mira, A.; Searle, J.B.; et al. Genetic non-invasive sampling (gNIS) as a cost-effective tool for monitoring elusive small mammals. Eur. J. Wildl. Res. 2018, 64, 46. [Google Scholar] [CrossRef]
- Rosenthal, M.F.; Gertler, M.; Hamilton, A.D.; Prasad, S.; Andrade, M.C.B. Taxonomic bias in animal behaviour publications. Anim. Behav. 2017, 127, 83–89. [Google Scholar] [CrossRef]
- Titley, M.A.; Snaddon, J.L.; Turner, E.C. Scientific research on animal biodiversity is systematically biased towards vertebrates and temperate regions. PLoS ONE 2017, 12, e0189577. [Google Scholar] [CrossRef] [PubMed]
- Mammides, C. European Union’s conservation efforts are taxonomically biased. Biodivers. Conserv. 2019, 28, 1291–1296. [Google Scholar] [CrossRef]
- Gompper, M.E.; Kays, R.W.; Ray, J.C.; Lapoint, S.D.; Bogan, D.A.; Cryan, J.R. A comparison of noninvasive techniques to survey carnivore communities in northeastern North America. Wildl. Soc. Bull. 2006, 34, 1142–1151. [Google Scholar] [CrossRef]
- Costello, M.J.; Beard, K.H.; Corlett, R.T.; Cumming, G.S.; Devictor, V.; Loyola, R.; Maas, B.; Miller-Rushing, A.J.; Pakeman, R.; Primack, R.B. Field work ethics in biological research. Biol. Conserv. 2016, 203, 268–271. [Google Scholar] [CrossRef]
- Egloff, C.; Labrosse, A.; Hebert, C.; Crump, D. A nondestructive method for obtaining maternal DNA from avian eggshells and its application to embryonic viability determination in herring gulls (Larus argentatus). Mol. Ecol. Resour. 2009, 9, 19–27. [Google Scholar] [CrossRef]
- Schulte, U.; Gebhard, F.; Heinz, L.; Veith, M.; Hochkirch, A. Buccal swabs as a reliable non-invasive tissue sampling method for DNA analysis in the lacertid lizard Podarcis muralis. North-West. J. Zool. 2011, 7, 325–328. [Google Scholar]
- Scriven, J.J.; Woodall, L.C.; Goulson, D. Nondestructive DNA sampling from bumblebee faeces. Mol. Ecol. Resour. 2013, 13, 225–229. [Google Scholar] [CrossRef]
- Franco-Gutiérrez, L.J.; Álvarez-Cardona, J.; Soto-Calderón, I.D. Sex identification of neotropical macaws (Ara spp.) from invasive and non-invasive samples. Ornitol. Colomb. 2017, 2017, eNB03. [Google Scholar]
- Rasmussen, S.L.; Nielsen, J.L.; Jones, O.R.; Berg, T.B.; Pertoldi, C. Genetic structure of the European hedgehog (Erinaceus europaeus) in Denmark. PLoS ONE 2020, 15, e0227205. [Google Scholar] [CrossRef]
- Thomas, W.K.; Pääbo, S.; Villablanca, F.X.; Wilson, A.C. Spatial and temporal continuity of kangaroo rat populations shown by sequencing mitochondrial DNA from museum specimens. J. Mol. Evol. 1990, 31, 101–112. [Google Scholar] [CrossRef] [PubMed]
- Hieb, E.E.; Nelson, D.H.; Morris, A.B. Oviductal eggs from road-kill turtles provide a novel source of DNA for population studies of the Alabama red-bellied turtle. Conserv. Genet. Resour. 2014, 6, 837–839. [Google Scholar] [CrossRef]
- Breed, D.; Meyer, L.C.R.; Steyl, J.C.A.; Goddard, A.; Burroughs, R.; Kohn, T.A. Conserving wildlife in a changing world: Understanding capture myopathy—A malignant outcome of stress during capture and translocation. Conserv. Physiol. 2020, 7, coz027. [Google Scholar] [CrossRef] [PubMed]
- Nuvoli, S.; Burrai, G.P.; Secci, F.; Columbano, N.; Careddu, G.M.; Mandas, L.; Sanna, M.A.; Pirino, S.; Antuofermo, E. Capture myopathy in a corsican red deer Cervus elaphus corsicanus (Ungulata: Cervidae). Ital. J. Zool. 2014, 81, 457–462. [Google Scholar] [CrossRef]
- Wearn, O.R.; Glover-Kapfer, P. Snap happy: Camera traps are an effective sampling tool when compared with alternative methods. R. Soc. Open Sci. 2019, 6, 181748. [Google Scholar] [CrossRef]
- Arrendal, J.; Vila, C.; Bjorklund, M. Reliability of noninvasive genetic census of otters compared to field censuses. Conserv. Genet. 2007, 8, 1097–1107. [Google Scholar] [CrossRef]
- Hajkova, P.; Zemanova, B.; Roche, K.; Hajek, B. An evaluation of field and noninvasive genetic methods for estimating Eurasian otter population size. Conserv. Genet. 2009, 10, 1667–1681. [Google Scholar] [CrossRef]
- Solberg, K.H.; Bellemain, E.; Drageset, O.M.; Taberlet, P.; Swenson, J.E. An evaluation of field and non-invasive genetic methods to estimate brown bear (Ursus arctos) population size. Biol. Conserv. 2006, 128, 158–168. [Google Scholar] [CrossRef]
- Hedges, S.; Johnson, A.; Ahlering, M.; Tyson, M.; Eggert, L.S. Accuracy, precision, and cost-effectiveness of conventional dung density and fecal DNA based survey methods to estimate Asian elephant (Elephas maximus) population size and structure. Biol. Conserv. 2013, 159, 101–108. [Google Scholar] [CrossRef]
- Hobbs, J.; Round, J.M.; Allison, M.J.; Helbing, C.C. Expansion of the known distribution of the coastal tailed frog, Ascaphus truei, in British Columbia, Canada, using robust eDNA detection methods. PLoS ONE 2019, 14, e0213849. [Google Scholar] [CrossRef] [PubMed]
- Janecka, J.E.; Munkhtsog, B.; Jackson, R.M.; Naranbaatar, G.; Mallon, D.P.; Murphy, W.J. Comparison of noninvasive genetic and camera-trapping techniques for surveying snow leopards. J. Mammal. 2011, 92, 771–783. [Google Scholar] [CrossRef]
- Burgar, J.M.; Stewart, F.E.C.; Volpe, J.P.; Fisher, J.T.; Burton, A.C. Estimating density for species conservation: Comparing camera trap spatial count models to genetic spatial capture-recapture models. Glob. Ecol. Conserv. 2018, 15, e00411. [Google Scholar] [CrossRef]
- Boston, E.S.M.; Puechmaille, S.J.; Scott, D.D.; Buckley, D.J.; Lundy, M.G.; Montgomery, I.W.; Prodöhl, P.A.; Teeling, E.C. Empirical assessment of non-invasive population genetics in bats: Comparison of DNA quality from faecal and tissue samples. Acta Chiropterol. 2012, 14, 45–52. [Google Scholar] [CrossRef]


| Database | Search String | Limited to |
|---|---|---|
| Web of Science | AB = ((non-invasive OR noninvasive OR minimally invasive) AND (genetic* OR genomic OR DNA OR eDNA) AND (efficien* OR efficacy OR effect* OR perform* OR compar* OR validat* OR suitab*)) | Research Areas: Zoology, Biodiversity Conservation, Evolutionary Biology, Environmental Sciences, Ecology, Genetics and Heredity |
| SCOPUS | ABS ((non-invasive OR noninvasive OR minimally invasive) AND (genetic* OR genomic OR DNA OR eDNA) AND (efficien* OR efficacy OR effect* OR perform* OR compar* OR validat* OR suitab*)) | Research Areas: Agricultural and Biological Sciences, Environmental Science |
| Agricultural and Environmental Science Collection | ABSTRACT: ((non-invasive OR noninvasive OR minimally invasive) AND (genetic* OR genomic OR DNA OR eDNA) AND (efficien* OR efficacy OR effect* OR perform* OR compar* OR validat* OR suitab*)) | Topics: Population Genetics, Invasiveness, Conservation, Wildlife, Genetic Diversity, Wildlife Conservation, Carnivores, Wildlife Management, Animal Populations, Biodiversity, Genetic Variation, Mammals, Endangered Species, Population |
Publisher’s Note: MDPI stays neutral with regard to jurisdictional claims in published maps and institutional affiliations. |
© 2021 by the author. Licensee MDPI, Basel, Switzerland. This article is an open access article distributed under the terms and conditions of the Creative Commons Attribution (CC BY) license (https://creativecommons.org/licenses/by/4.0/).
Share and Cite
Zemanova, M.A. Noninvasive Genetic Assessment Is an Effective Wildlife Research Tool When Compared with Other Approaches. Genes 2021, 12, 1672. https://doi.org/10.3390/genes12111672
Zemanova MA. Noninvasive Genetic Assessment Is an Effective Wildlife Research Tool When Compared with Other Approaches. Genes. 2021; 12(11):1672. https://doi.org/10.3390/genes12111672
Chicago/Turabian StyleZemanova, Miriam A. 2021. "Noninvasive Genetic Assessment Is an Effective Wildlife Research Tool When Compared with Other Approaches" Genes 12, no. 11: 1672. https://doi.org/10.3390/genes12111672
APA StyleZemanova, M. A. (2021). Noninvasive Genetic Assessment Is an Effective Wildlife Research Tool When Compared with Other Approaches. Genes, 12(11), 1672. https://doi.org/10.3390/genes12111672