Article

Identifying Risk Genes and Interpreting Pathogenesis for Parkinson’s Disease by a Multiomics Analysis

Hubei Key Laboratory of Agricultural Bioinformatics, College of Informatics, Huazhong Agricultural University, Wuhan 430070, China
*
Author to whom correspondence should be addressed.
Genes 2020, 11(9), 1100; https://doi.org/10.3390/genes11091100
Submission received: 30 August 2020 / Revised: 17 September 2020 / Accepted: 18 September 2020 / Published: 21 September 2020
(This article belongs to the Section Human Genomics and Genetic Diseases)

Abstract

:
Genome-wide association studies (GWAS) have identified tens of genetic variants associated with Parkinson’s disease (PD). Nevertheless, the genes or DNA elements that affect traits through these genetic variations are usually undiscovered. This study was the first to combine meta-analysis GWAS data and expression data to identify PD risk genes. Four known genes, CRHR1, KANSL1, NSF and LRRC37A, and two new risk genes, STX4 and BST1, were identified. Among them, CRHR1 is a known drug target, indicating that hydrocortisone may become a potential drug for the treatment of PD. Furthermore, the potential pathogenesis of CRHR1 and LRRC37A was explored by applying DNA methylation (DNAm) data, indicating a pathogenesis whereby the effect of a genetic variant on PD is mediated by genetic regulation of transcription through DNAm. Overall, this research identified the risk genes and pathogenesis that affect PD through genetic variants, which has significance for the diagnosis and treatment of PD.

1. Introduction

Parkinson’s disease (PD) is called the “undead cancer” and is the second most common progressive neurodegenerative disease affecting the elderly population [1]. The global prevalence of PD is expected to double from 6.2 million cases in 2015 to 12.9 million in 2040 [2]. The complexity of PD leads to severe challenges, such as the ambiguity of early diagnosis and later symptoms that are difficult to control [3]. Therefore, finding effective genetic markers and analyzing their pathogenesis have become the focus of future clinical research on PD.
Genome-wide association studies (GWAS) identified tens of genetic variants associated with PD, most of which are from patients of European ancestry, and there is relatively little knowledge about PD in other populations [3]. We have a limited understanding of the biological functions of the risk alleles that have been identified, although PD risk variants seem to be in close proximity to known PD genes and lysosomal-related genes. Recently, Nalls et al. examined the risk relationships between PD and other phenotypes based on these genetic variants [4]. However, the pathogenic mechanisms of these genetic variations remain obscure, especially how the variants influence the gene expression through methylation [5]. In fact, the determination of genotype–phenotype causality based on GWAS still faces many difficulties: (i) most of the mutation sites are located in noncoding regions of the genome and are not protein-coding sequences [5]; (ii) the linkage disequilibrium (LD) effect of adjacent single nucleotide polymorphisms (SNPs) will produce a noncausality between genotype and phenotype [6]; and (iii) the limitation of sample size reduces the statistical effect of GWAS. Rare and low frequency variations may not reach the statistical threshold [7,8].
In the past decade, researchers have made many efforts to study the genetic structure of human traits or diseases. The development of emerging technologies such as single-cell sequencing, high-throughput screening, and machine learning algorithms will enhance our understanding of genetic risks. Recently, Zhu et al. developed the summary data-based Mendelian randomization (SMR) and heterogeneity in dependent instruments (HEIDI) methods [9], which provide a way forward for identifying functional genes and potential functional elements of genetic variation. The fundamental idea is that GWAS identifies SNPs related to phenotypes, and expression quantitative trait locus (eQTL) analysis obtains SNPs related to gene expression and then obtains risk genes that affect phenotypes by SNPs [10]. SMR allows for the use of GWAS, eQTL and methylation quantitative trait locus (mQTL) from independent studies to aggregate data, so it can expand a sufficient sample size to enhance statistical capabilities [11].
In this study, by integrating GWAS, eQTL and mQTL, the risk genes of PD were identified, and their potential pathogenesis was analyzed. First, we integrated two sets of GWAS data based on meta-analysis and found that the data can reflect the pathological features of PD by using Gene Ontology (GO) enrichment. Second, SMR and HEIDI were used to combine the meta-analysis GWAS result with eQTL data to identify risk genes that affect PD through genetic variation. Last, this study combined GWAS, eQTL and mQTL data to analyze the pathogenesis of risk genes. To determine the functional elements that regulate gene expression, this paper used epigenetic annotation data from the Roadmap Epigenomics Mapping Consortium (REMC) to locate the function of DNAm sites [12,13]. In summary, this research identified the risk genes and potential pathogenesis that affect PD, which has significance for the diagnosis and treatment of PD.

2. Materials and Methods

2.1. GWAS Analysis of Whole-Genome Data from PPMI

The whole-genome sequencing (WGS) data used in this study were derived from 606 individuals (412 PD patients and 194 controls) in the Parkinson’s Progression Marker Initiative (PPMI) database [14]. We used PLINK v1.07 toolset [15] for a standard case–control association analysis with age and gender as covariates. In the quality control phase, we selected SNPs with detection rates greater than 95%, sample detection rates greater than 95%, minimum allele frequencies greater than 5 × 10⁻², and Hardy–Weinberg equilibrium less than 1 × 10⁻⁴.

2.2. Meta-Analysis Based on Effect Size

Meta-analysis was used to integrate two sets of GWAS data, including the above-mentioned summary-GWAS results from PPMI and GWAS summary data from another group of 4238 PD patients and 4239 controls, respectively, and meta-analysis was used in METAL tool [16] using an effect-based approach. A total of more than 6 million SNPs were obtained by meta-analysis GWAS, of which 1678 significant SNPs (Bonferroni-corrected p-value < 7.83 × 10⁻⁹) were associated with PD.

2.3. Summary Data-Based Mendelian Randomization Analysis

For the identification of PD risk genes based on GWAS and eQTL using SMR analysis, y was the phenotype, x was the gene expression, z was the genetic variation, and b x y ( b x y = b z y / b z x ) represent a non-confounding effect of gene expression on PD. The effect of SNPs on gene expression ( b z x , with a positive or negative sign) was the effect value of eQTL, and the effect of SNPs on PD ( b z y ) was the effect value of meta-analysis GWAS. FDR adjustment at p-value < 5 × 10⁻² was the threshold of SMR. Simultaneously, this study also infers the positive or negative effect of genes on PD (bxy < 0 means negative effect, otherwise the opposite).
The HEIDI test can exclude causality caused by LD in SMR analysis and obtain pleiotropic mutation sites (i.e., causality between two genomes is caused by the same genetic mutation) [17]. This study used the Bonferroni correction p-value as the threshold for HEIDI. Therefore, for each significant eQTL probe detected by SMR, we detected the b x y of multiple SNPs in the eQTL region to exclude false-positive genes.
In addition, the QTL data used are the aggregate data compiled by Zhu et al. [9,10]. The original eQTL summary data from the Westra et al. study included an eQTL meta-analysis of 5311 samples from peripheral blood [18] and a summary of the meta-analysis of Europeans from the Brisbane System Genetics Study (n = 614) and the Losian Birth Cohorts of 1921 and 193,631 (n = 1366) [19,20]. After exclusion of probes in the MHC areas and threshold screening (p-value < 5 × 10⁻⁸), a total of 5967 eQTL probes and 73,973 DNAm probes were obtained.

2.4. Enrichment Test of Functional Categories

In the public data of the REMC database at http://compbio.mit.edu/roadmap/, we downloaded the epigenetic annotation files of 25 chromatin states of 23 blood cells in 127 epigenomics studies [12,13]. The 14 main functional categories were obtained by merging 25 chromatin states with functionally related annotation categories into a single functional category. These annotation files were used to locate the 14 main functional regions of each methylation probe. After functional location of the DNAm probe, we quantified the ratio of transcript-associated DNAm significant probes to all probes in 14 major functional categories. Finally, the chi-square test was used to test the significance and positive or negative effects of enrichment with these significant methylation probes in each domain.

3. Results

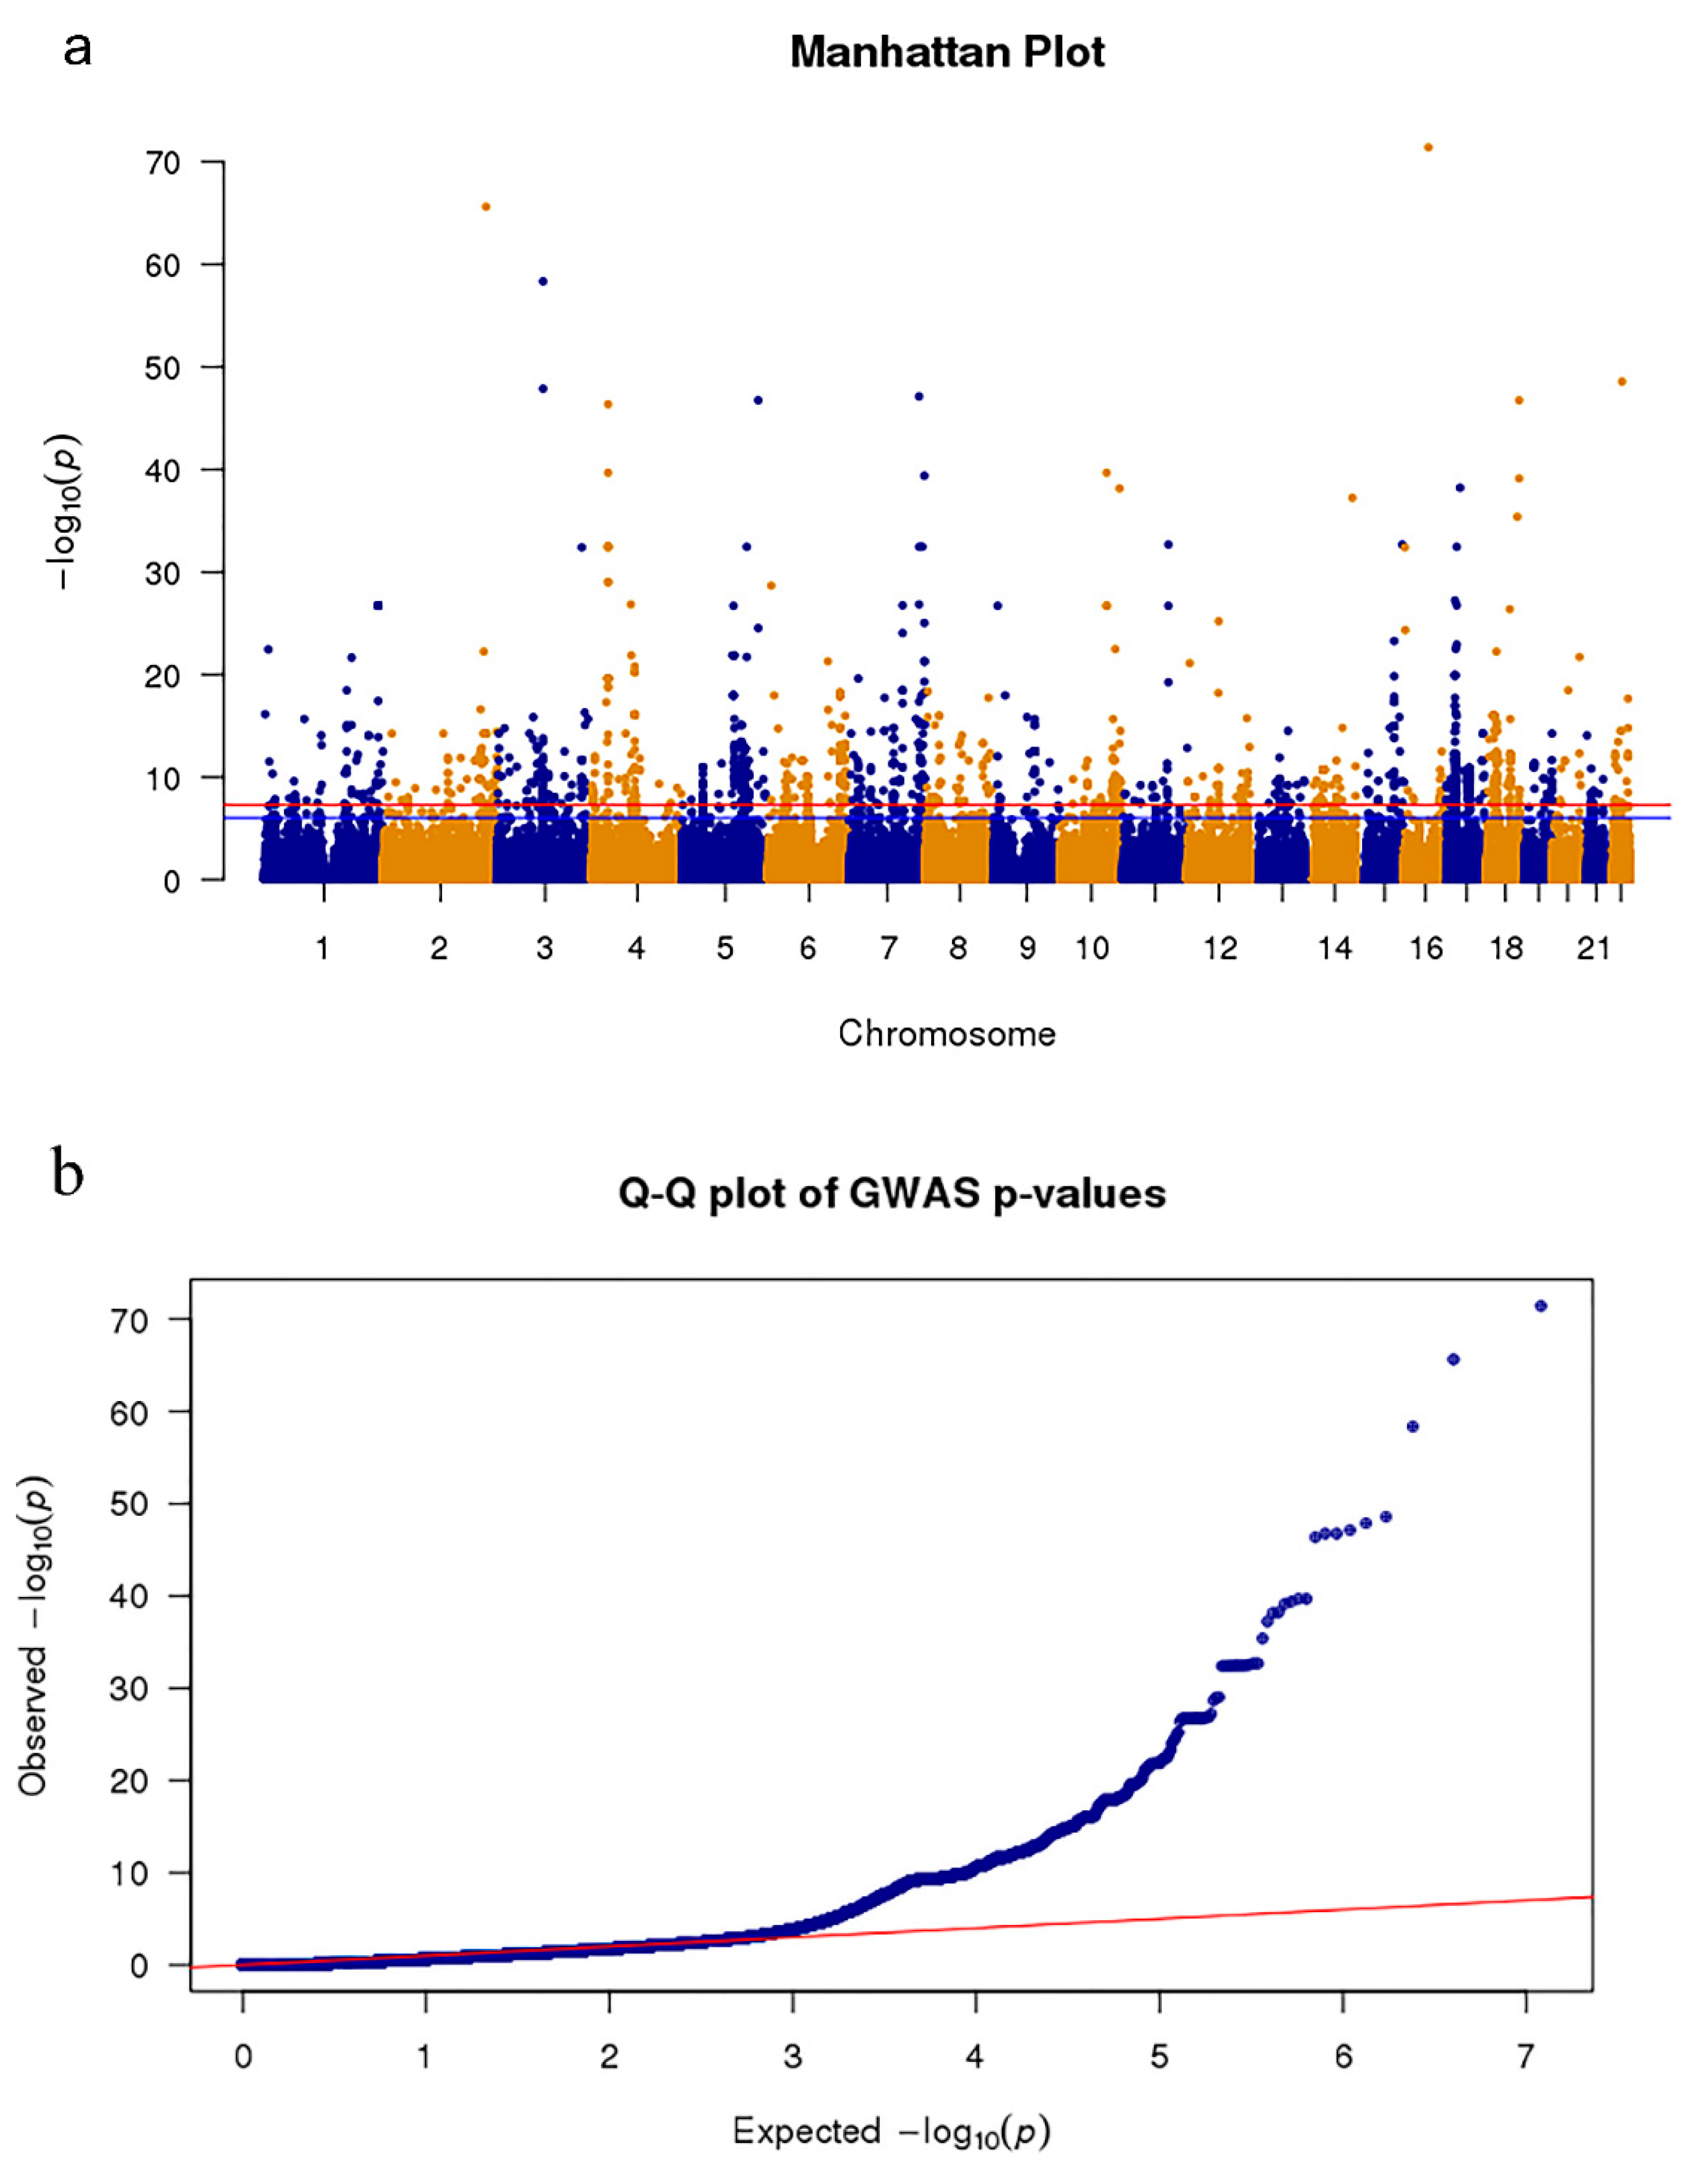
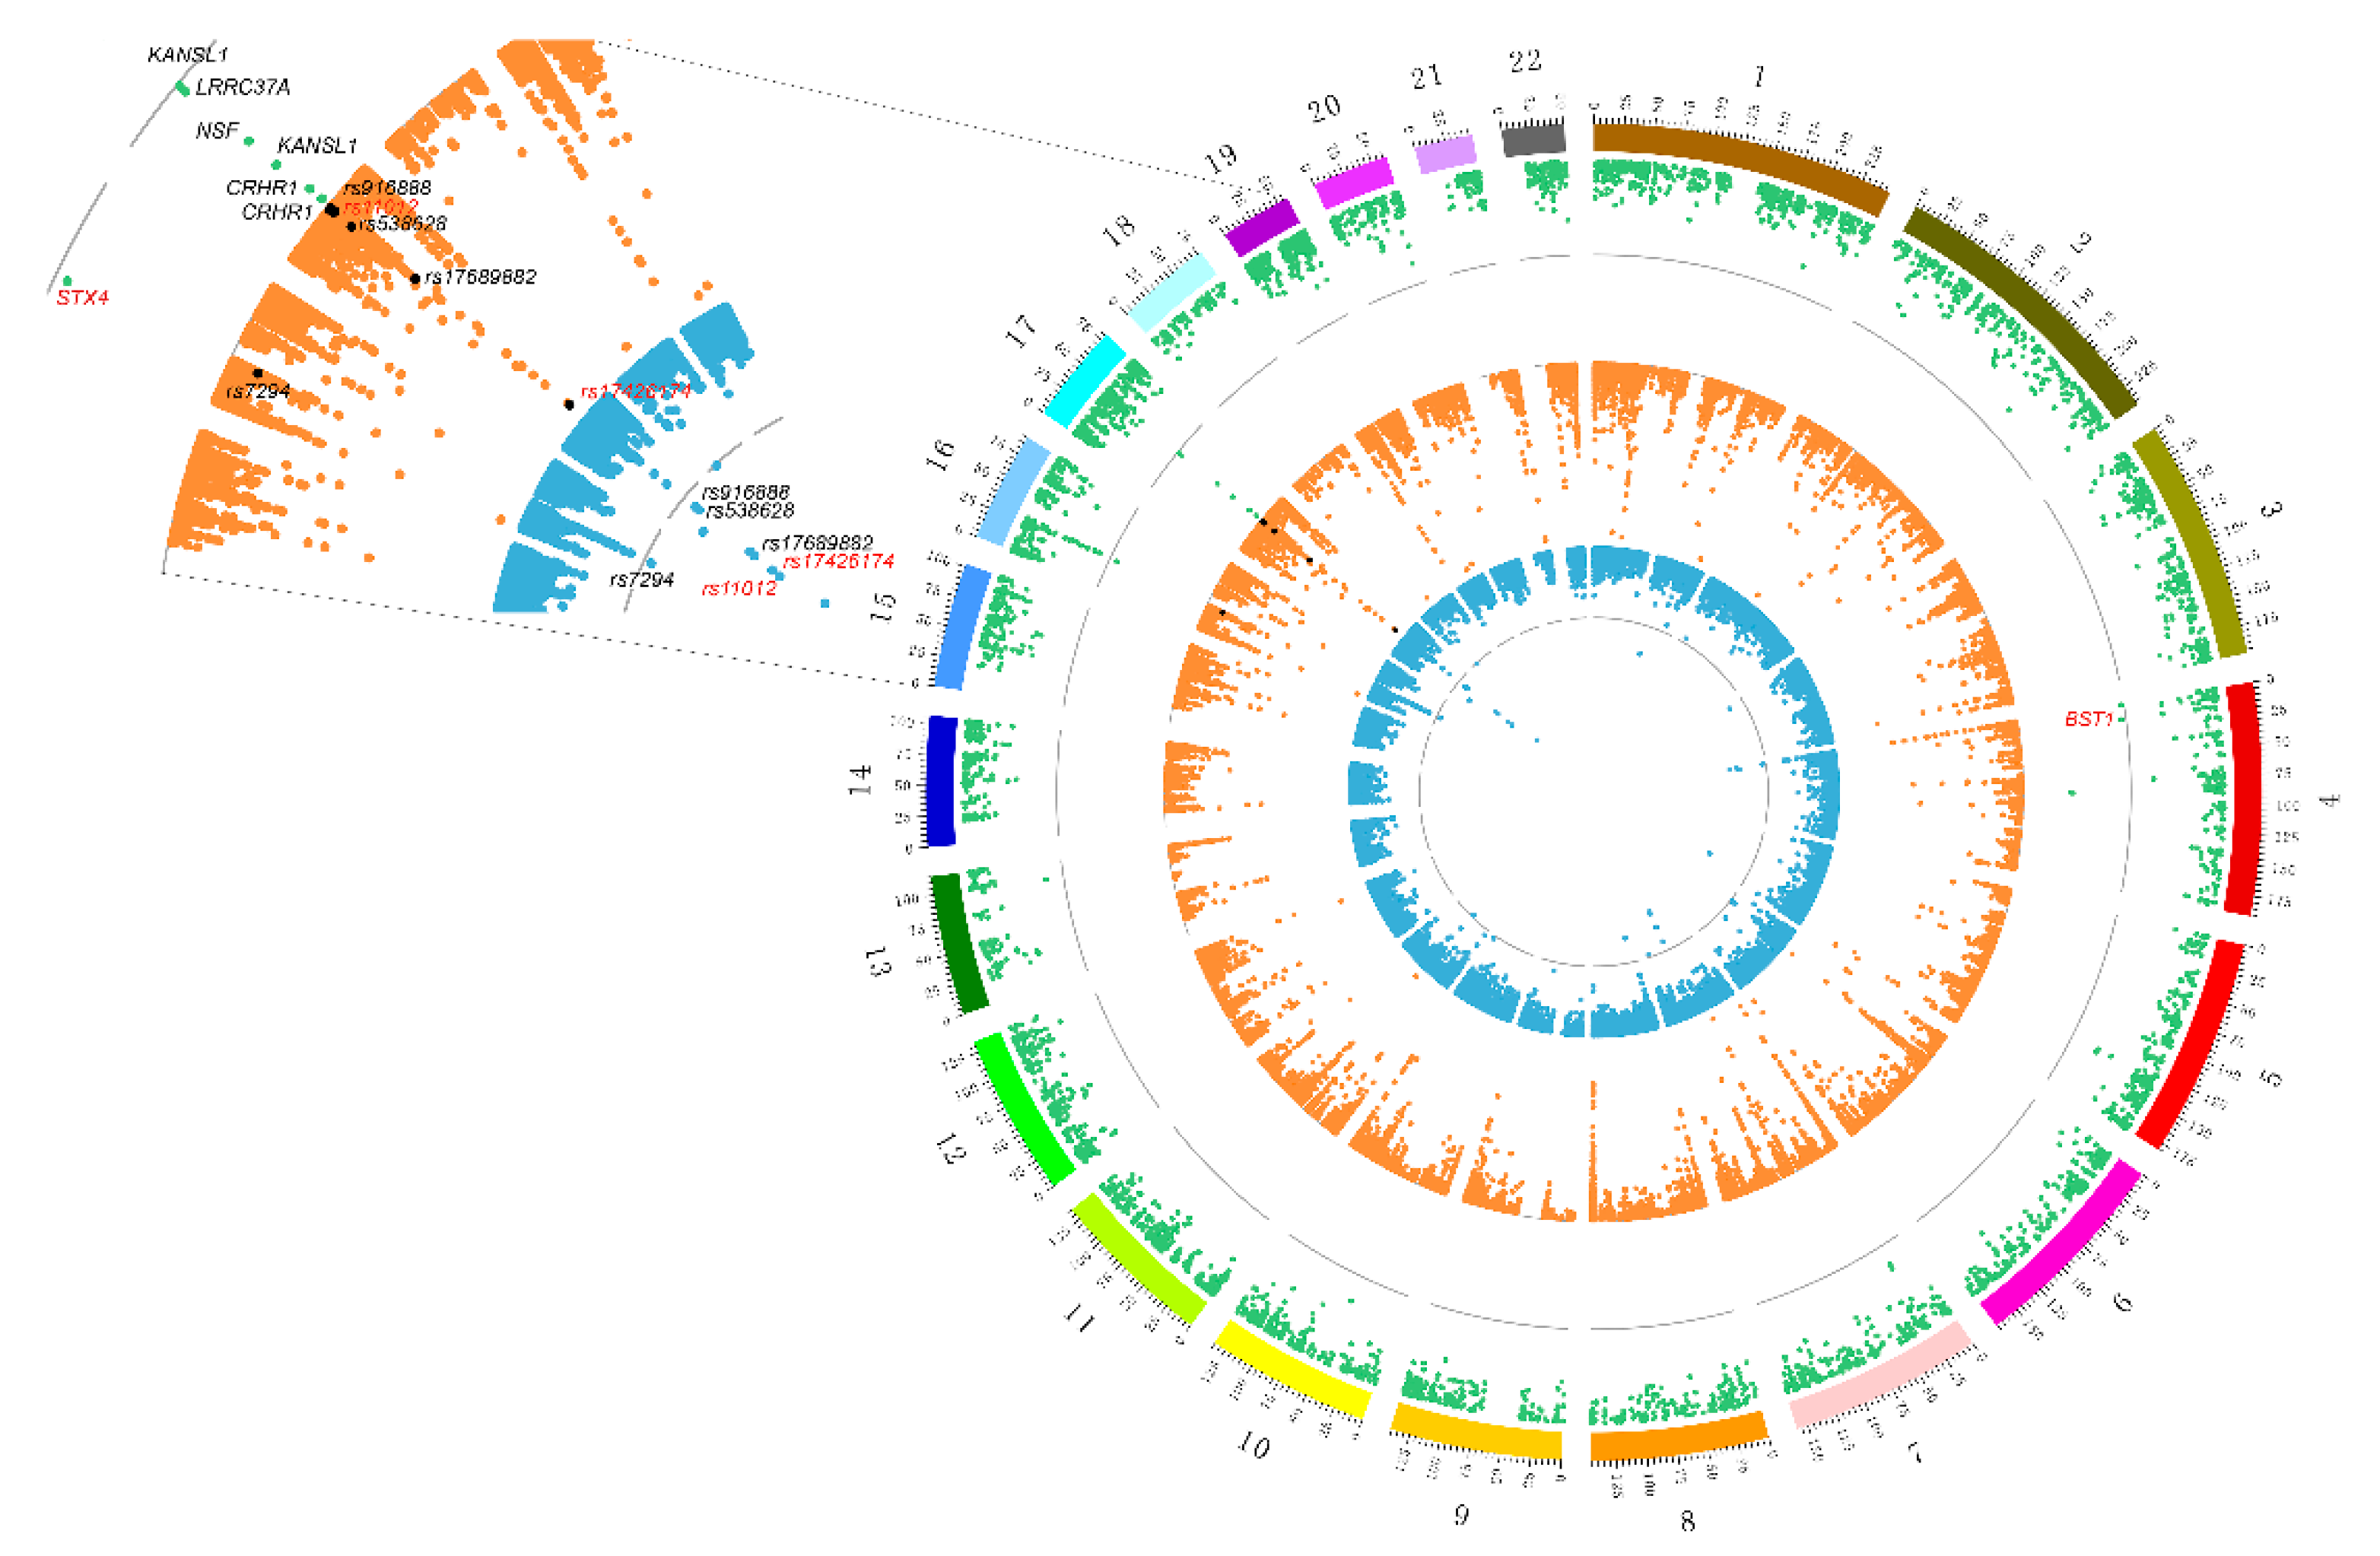
3.1. Screening SNPs of PD Based on Meta-Analysis GWAS Data

We performed a GWAS using WGS data from the PPMI database including 412 PD patients and 194 controls [14]. Age and gender were used as covariates to obtain GWAS summary data through PLINK [15]. There were 48 SNPs significantly related to PD (p-value range was from 1.25 × 10⁻⁷ to 9.21 × 10⁻⁷).
The effect-based meta-analysis was then used to integrate GWAS data from PPMI with other aggregated GWAS data, which included 4238 PD patients and 4239 controls [21]. The results of the meta-analysis for GWAS obtained more than 6 million SNPs, where 1678 SNPs (Bonferroni-corrected p-value < 0.05/6,385,696 = 7.83 × 10⁻⁹) were significantly associated with PD (Figure 1).
Mapping the significant SNPs to the gene domain of the hg38 reference genome in a 10 kb interval [22], the GO enrichment results showed that six biological functional regions were significantly enriched (Bonferroni-corrected p-value < 8 × 10⁻³, Supplementary Table S1). Four significantly enriched biologically functional regions have been reported to be associated with PD, including the axon [23], neuron-to-neuron synapse [24], asymmetric synapse [25] and gamma aminobutyric acid (GABA)-ergic synapse [26] (Figure 2). Therefore, these results indicate that the meta-analysis of GWAS data reflects the pathological features of PD.

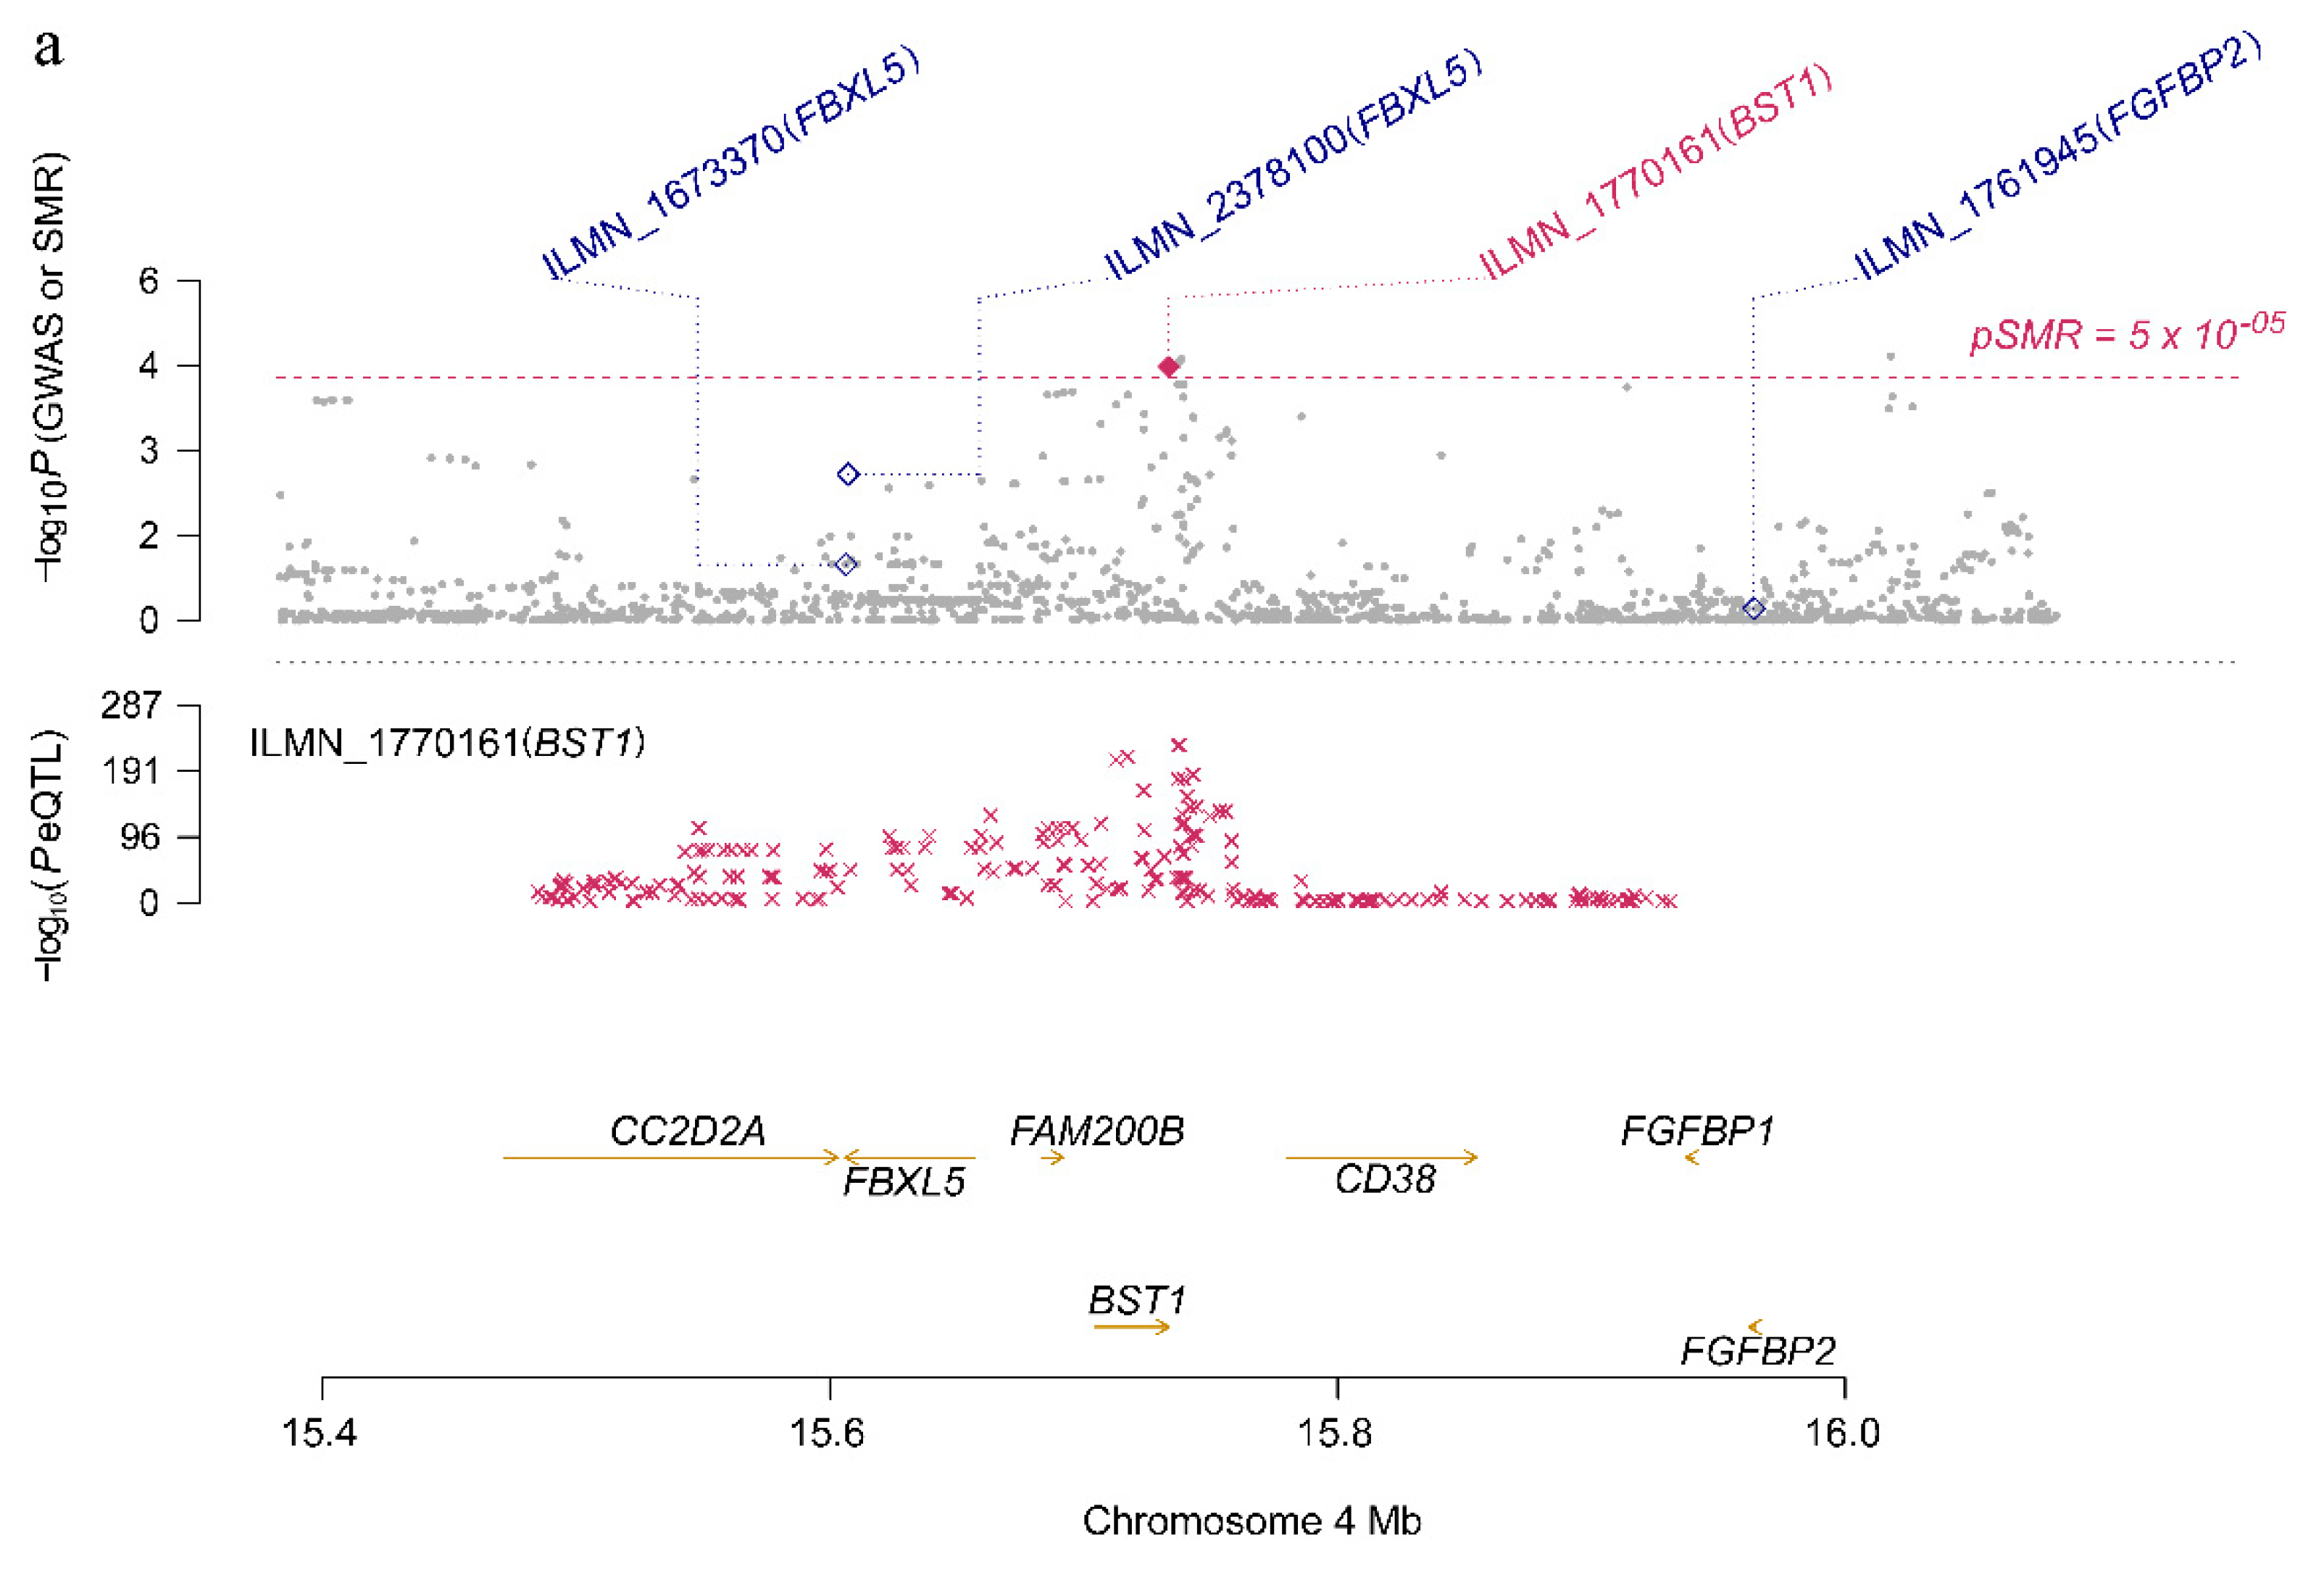
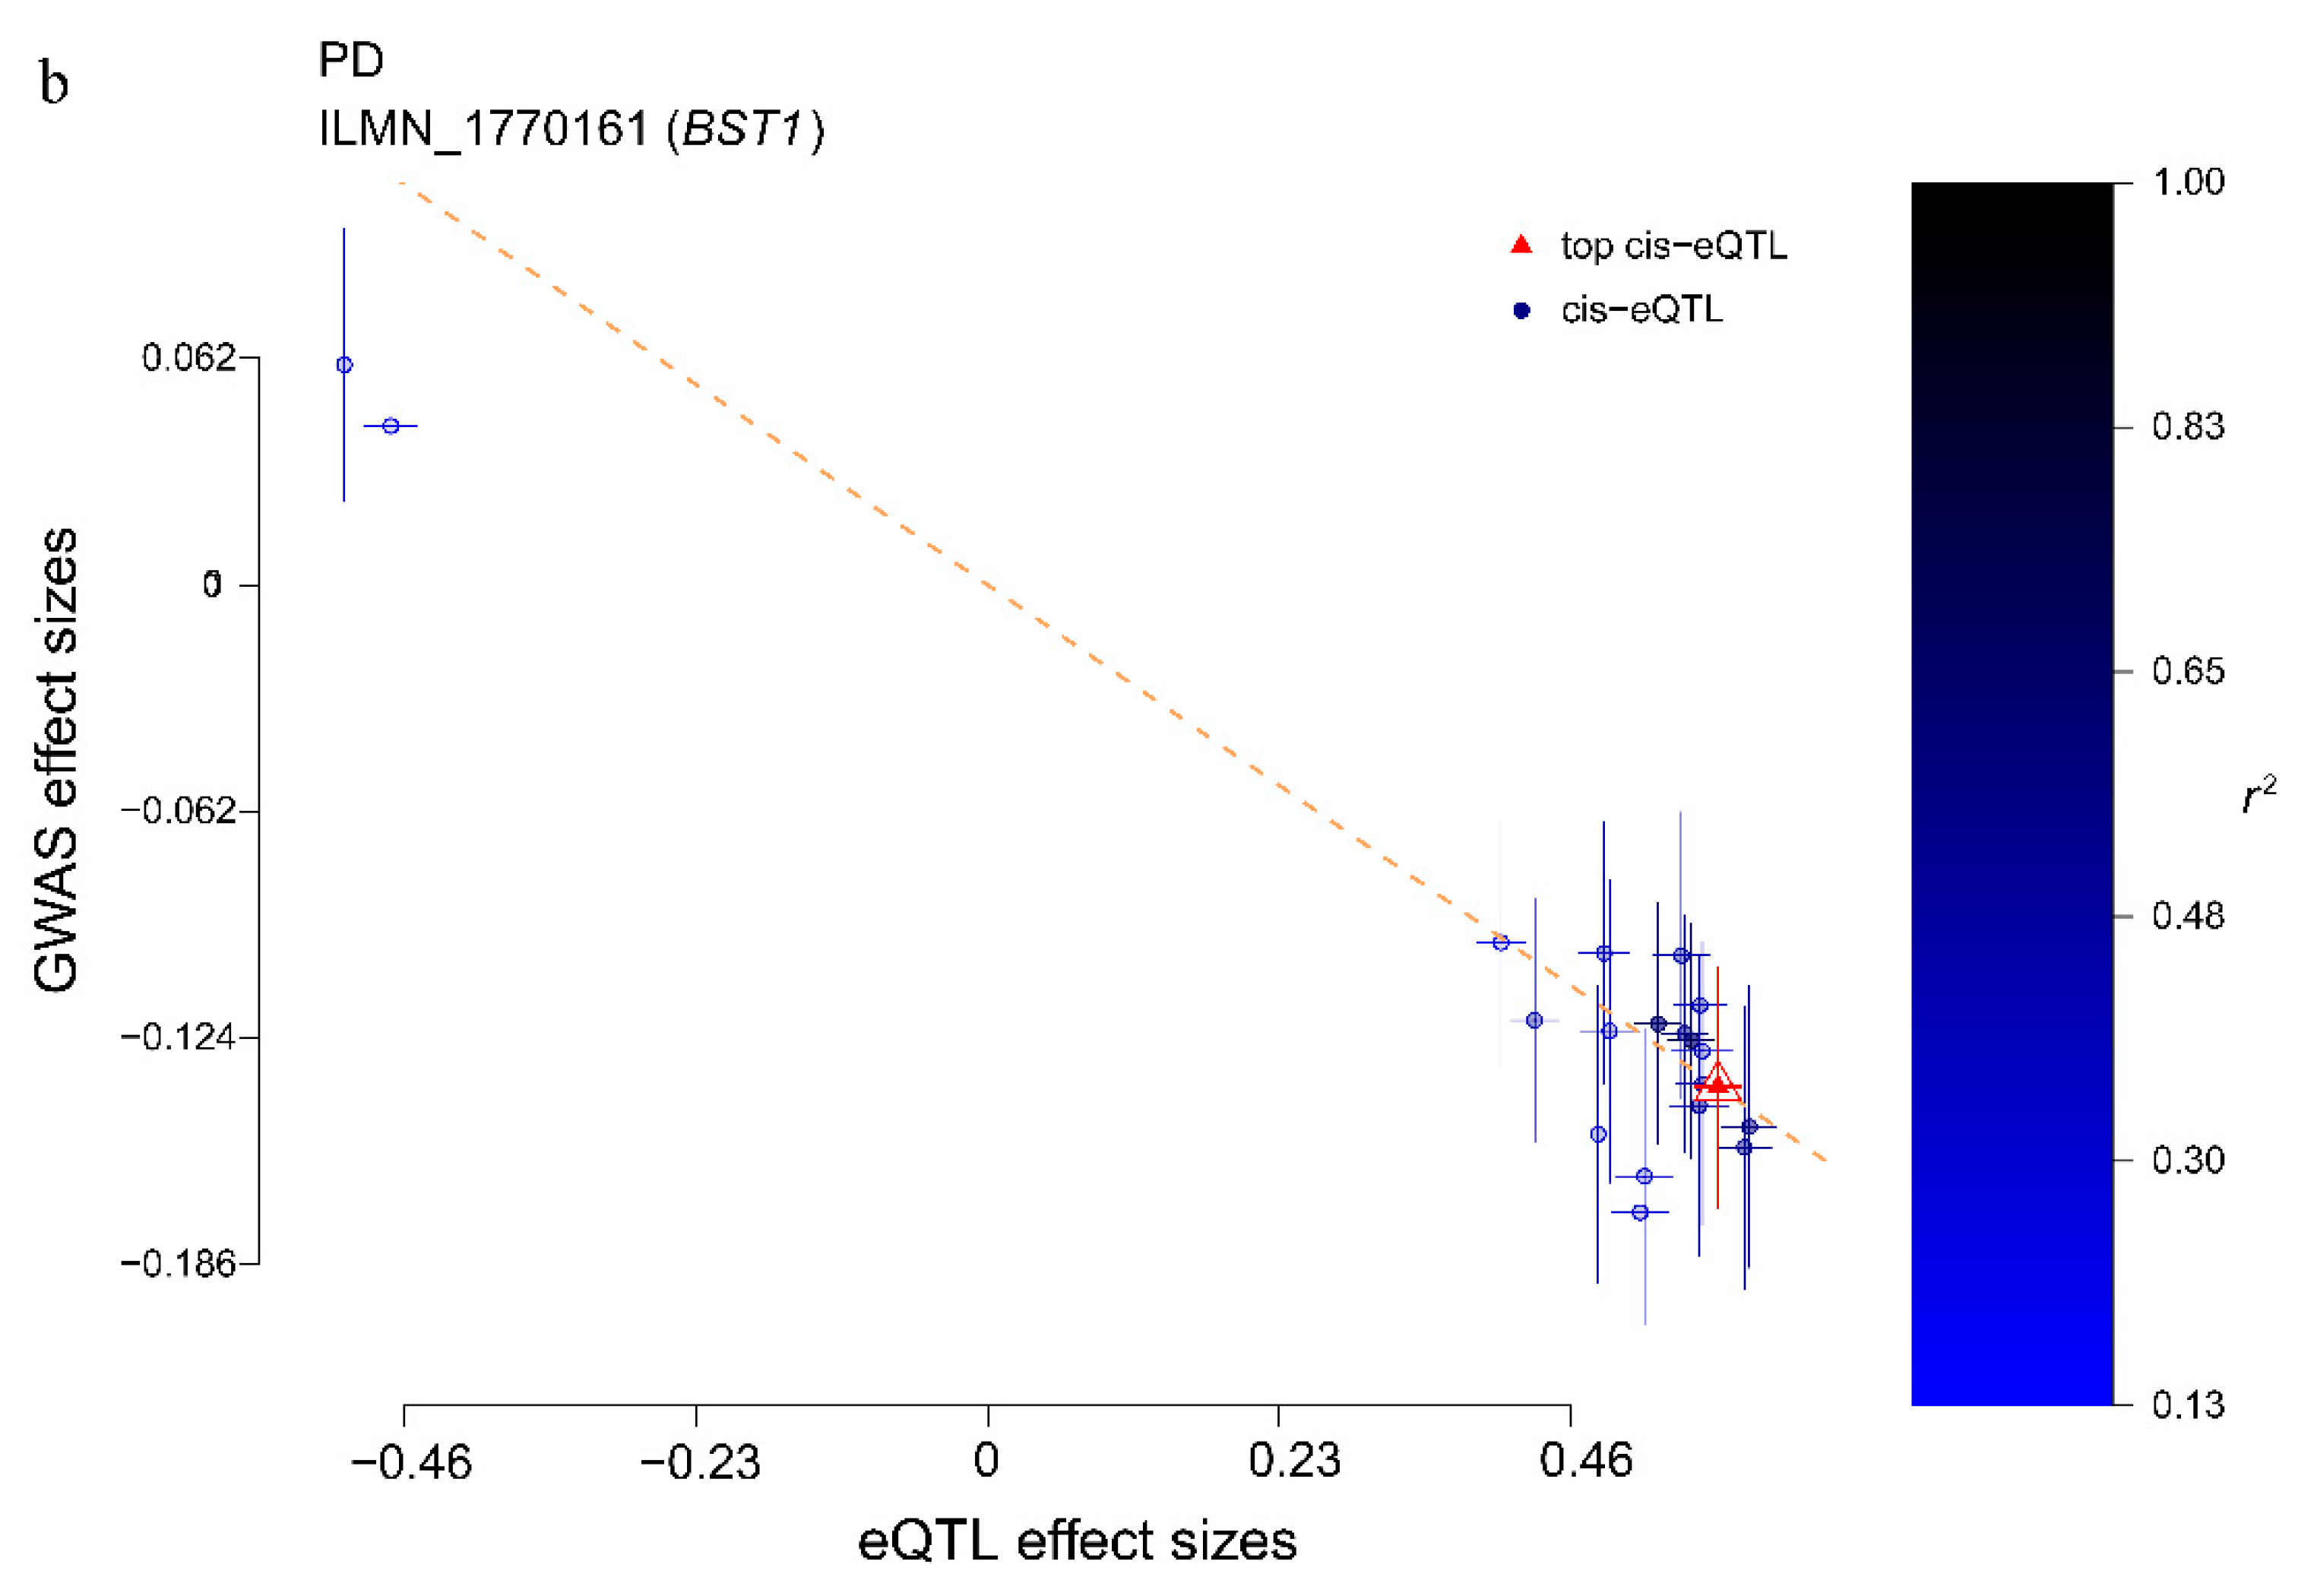
3.2. Identifying PD Risk Genes Based on GWAS and eQTL Data

SMR was used to integrate more than 6 million SNPs of meta-analysis GWAS data and 5966 cis-eQTL probes. After false discovery rate (FDR) adjustment at p-value < 5 × 10⁻², we found eight genes (tagged by 11 probes) in the genome-wide region (Table 1). For each gene that passed the SMR, the HEIDI test was used to exclude the genes with an LD effect, and six (Bonferroni-corrected PHEIDI ≥ 0.006) pleiotropic causal genes were found. As shown in Table 1 and Figure 3, the six risk genes were CRHR1, KANSL1, NSF, LRRC37A, STX4 and BST1. Importantly, there is evidence that CRHR1 [27,28], KANSL1 [27], LRRC37A [29] and BST1 [30,31,32] are associated with PD. Notably, a recent genetic analysis involving 8725 PD patients and 17,079 controls found that BST1 is a susceptibility gene for PD [33], and previous experiments in BST1 knockout mice suggested that the gene might be beneficial in promoting treatment for PD [34]; the top negatively related gene CRHR1, as a target for a hydrocortisone drug for Cushing’s disease [35], is also known as the corticotropin releasing factor (CRF) receptor 1, and there is evidence that CRF and its receptors protect neurons [36,37]. In addition, animal experimental evidence shows that hydrocortisone can stimulate the expression of Parkin through the CREB pathway, and the induced expression of Parkin is the cause of its neuroprotective effect [38].
We also found two new genes (STX4 and BST1) in the above analysis, which are not the closest annotated genes to GWAS-significant SNPs. The reliability of these two new risk genes was verified from two aspects. On the one hand, we performed a protein–protein interaction (PPI) network analysis using STRING v11.0 database [39] to explore the association of six risk genes with known PD genes. The known functional genes were from the PD-Gene database (http://www.pdgene.org/). The results showed that five of the six genes interacted with known genes, including the new STX4 gene (Figure 4b). On the other hand, the independent GWAS summary data from the latest analyses of PD were analyzed, and we found that STX4 and BST1 were significant (p-value = 3.18 × 10⁻⁹ and 1.22 × 10⁻¹⁹, respectively) in this GWAS dataset [40]. As shown in Figure 4a and Supplementary Table S2, after SMR and HEIDI analysis of the latest GWAS data, the STX4 and BST1 genes were still in the intersection range. These results not only provide trustworthy evidence for the newly discovered STX4 and BST1 genes but also demonstrate the reliability of the six PD risk genes found in this study.
As shown in Supplementary Table S3 and Supplementary Figures S1–S6, the effect size of the six risk genes is summarized, indicating the effect and direction of the gene expression level on the risk of PD. When the effect value b S M R > 0 , it means that the gene expression is positively associated with disease risk; b S M R < 0 means that the gene expression is negatively associated with disease risk; b S M R = 0 means that the gene expression is irrelevant. For example, BST1 is a risk gene located on Chr4 (FDR PSMR = 0.0214, PHEIDI = 0.738), and its corresponding eQTL probe has a significant p-value of 1.01 × 10−229 (Figure 5a). In addition, according to the effect value of eQTL ( b z x = 0.58) and the effect value of the SNP in the GWAS of the phenotype ( b z y = −0.14), SMR estimates that b x y = −0.24 can represent no confounding effect of gene expression on PD (Figure 5b). A negative estimate of the effect of gene expression on PD (bSMR = −0.24) indicates the inhibitory effect of BST1 expression.

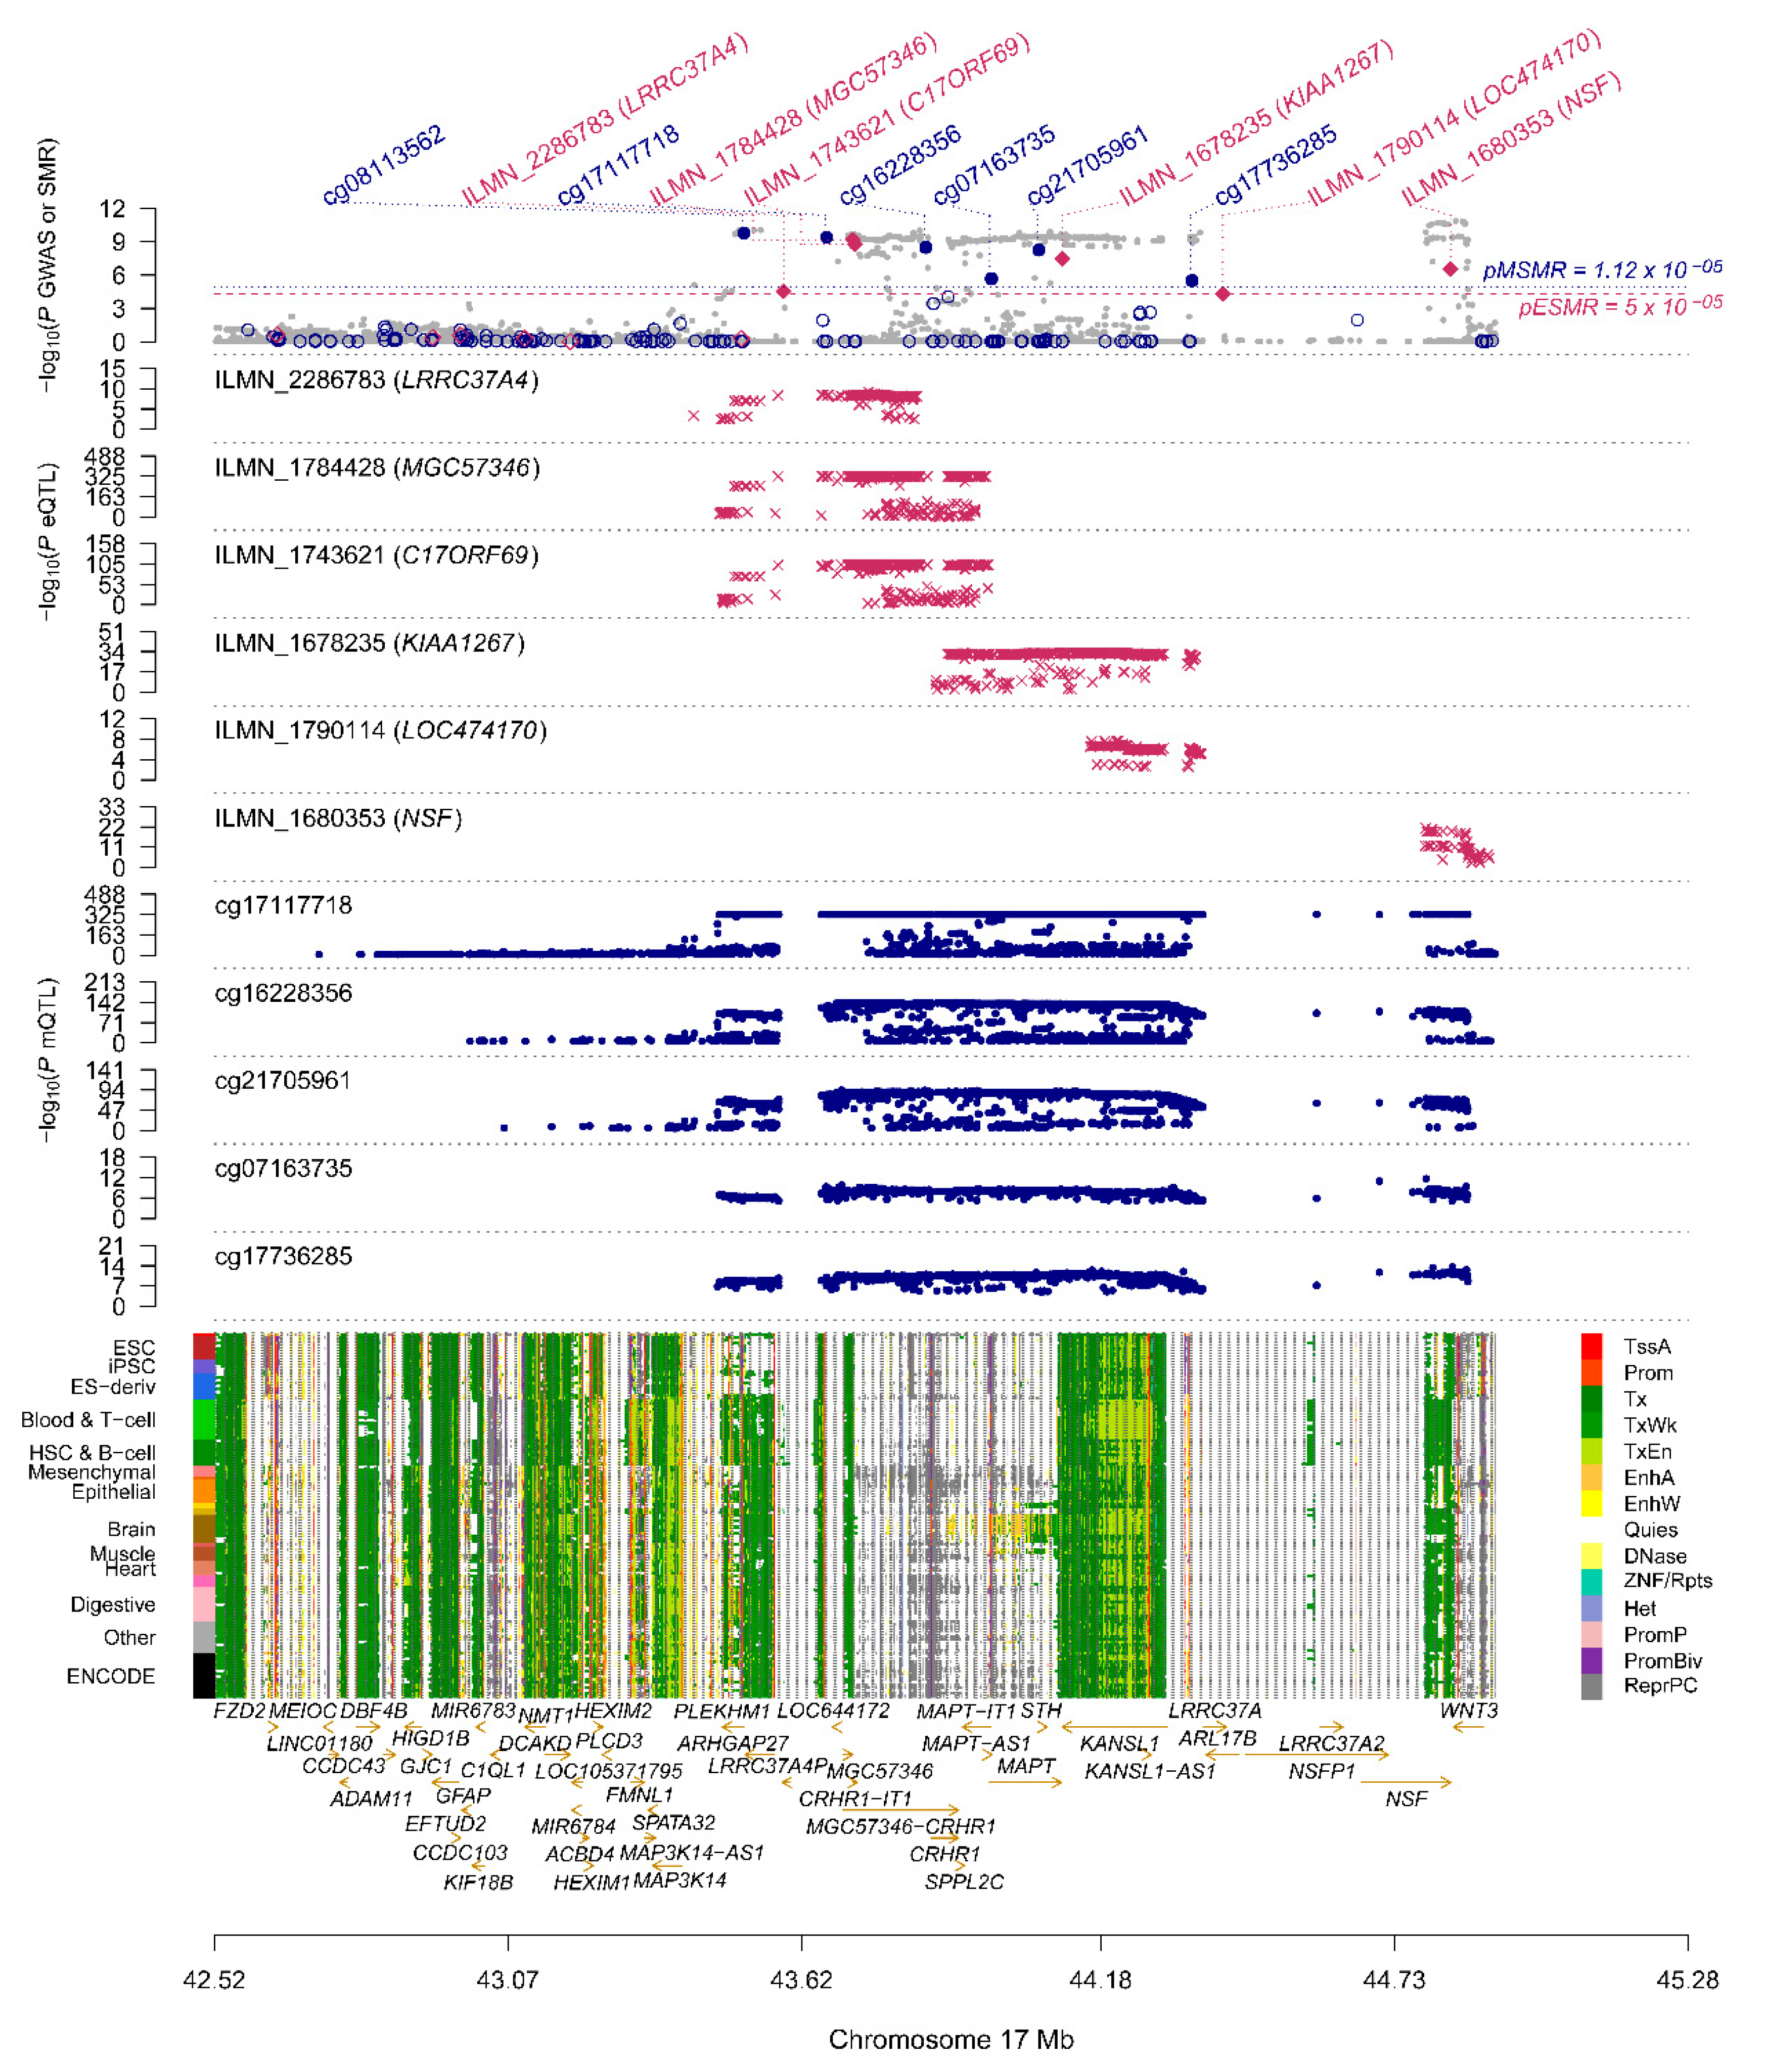
3.3. Elucidating the Pathogenesis of Two Risk Genes

We combined GWAS, eQTL and mQTL data to conduct a pairwise analysis to explore whether there are consistent signals at multi-omics levels (Figure 3). In the first step, significant eQTL data were used as an instrumental variable combined with GWAS data to identify a total of six risk genes associated with PD. The second step was to calculate the causality between DNAm and its neighboring genes (within 2 Mb of each DNAm probe). The third step was to perform pleiotropic association analysis between the DNAm site and the meta-analysis GWAS data to prioritize the DNAm loci.
Using aggregated mQTL data compiled by Wu et al. [10], we screened for significant SNPs (p-value < 5 × 10⁻⁵) within 2 Mb of each probe as instrumental variables with at least one cis-mQTL at p-value < 5 × 10⁻⁸. As shown in Table 2 and Figure 3, after mQTL-eQTL analysis, a total of 51,940 DNAm probes were identified as being related to eQTL probes. In the DNAm-PD analysis, 24 PD-related DNAm probes were detected, of which 13 DNAm probes were not rejected by HEIDI (Table 2 and Figure 3).
To explore whether the DNAm locus is in the regulatory region of genes, we used 14 major functional annotation categories from the REMC to functionally locate DNAm probes [41] (Supplementary Figure S7). Apparent functional annotation was performed on all 73,973 DNAm probes, and the enrichment of expression-related DNAm probes was analyzed using the chi-square test, including promoter (fold-change = 1.27, p-value = 1.01 × 10−54), strong transcription (Tx, fold-change = 1.32, p-value = 2.44 × 10⁻²⁷), strong transcription and Enhancer (TxEn, fold-change = 1.31, p-value = 3.88 × 10⁻²⁸) and other functions that promote expression. In addition, there was significant non-enrichment of these 51,940 DNAm probes in the transcriptional repression region, such as repressed polycomb (ReprPC, fold-change = 0.79, p-value = 1.32 × 10⁻²⁷) and quites (fold-change = 0.70, p-value = 1.03 × 10−98) (Supplementary Table S4).
As shown in Figure 3, by combining the results of SMR analysis in paired omics, five genes (corresponding to eight DNAm probes and seven eQTL probes) with pleiotropic causality were found to produce strong signals of multiomics, including C17ORF69 (CRHR1), KIAA1267 (KANSL1), LRRC37A4 (LRRC37A), MGC57346 (CRHR1), NSF and STX4. Figure 6 shows the p-values of these genes in three omics analyses, and we can observe that the C17ORF69 (CRHR1), KIAA1267 (KANSL1), LRRC37A4 (LRRC37A), MGC57346 (CRHR1) and NSF genes on Chr17 are important. Supplementary Figure S8 shows a summary of the cross-omics correlation of STX4 on Chr16.
We found that the two risk genes (CRHR1 and LRRC37A4) in the analysis of mQTL-GWAS and mQTL-eQTL were significant and consistent in SNP-associated signals. Its corresponding DNAm locus belongs to the promoter functional region, which suggests a possible biological pathway for regulating disease risk (Table 2): (i) As shown in Figure 7a, the rs17426174 mutation changes the level of DNAm, and when the DNAm level (cg17117718) of the CRHR1 promoter is low, the repressor binds to the promoter, thereby inhibiting the transcription of CRHR1 (DNAm–gene effect value bSMR = 0.33) and increasing the risk of PD (gene–PD effect value bSMR = −0.51); (ii) as shown in Figure 7b, genetic mutations (rs11012 or rs17426174, respectively) regulate methylation probes (cg08113562 or cg17117718, respectively) to change the degree of DNAm. When the DNAm level of the LRRC37A4 promoter is low, the transcription factor and promoter are combined, thereby promoting the expression of LRRC37A4 (DNAm–gene effect value bSMR = −0.1 and −0.09, respectively) and increasing the risk of PD (gene–PD effect value bSMR = 1.58).

4. Discussion

This study explored the risk genes and pathogenesis of PD by integrating a meta-analysis of GWAS, eQTL and mQTL data. Four known genes, CRHR1, KANSL1, NSF and LRRC37A, and two new risk genes, STX4 and BST1, were identified. Combined with the three omics datasets and the functional annotation of the DNAm locus, the underlying mechanism of two risk genes affecting PD risk was preliminarily clarified. Overall, this research identified the risk genes and potential pathogenesis that affect PD, which has significance for the diagnosis and treatment of PD.
The GWAS result was analyzed after the meta-analysis was used, which is a crucial step for subsequent SMR analysis. As shown in Figure 1a, we found that more than 1600 mutation sites in approximately 6 million genetic mutation sites were significantly related to PD, which improved the statistical power of this study. As shown in the quantile–quantile plot (Figure 1b), when the p-value < 1 × 10 −3, the GWAS result of the meta-analysis is clearly deviated from the uniform distribution, which indicates that the genotype may be affected by natural selection [42]. GO enrichment revealed that four out of six significantly enriched biologically functional regions have been reported to be associated with PD (Figure 2).
Relevant cellular or animal experiments have provided reliable evidence for the identification of risk genes. Of the eight genes analyzed by SMR, SNCA [43,44], CRHR1 [27,28], KANSL1 [27], LRRC37A [29], BST1 [30,31,32,33] and DGKQ [32] have been shown in previous studies to be related to PD at the genome-wide level (Table 1). Related reports have indicated that CRHR1 has a neuroprotective effect [36]; a recent genetic analysis found that BST1 is a susceptibility gene for PD [33], and previous experiments in BST1 knockout mice suggested that the gene might be beneficial in promoting treatment for PD [34].
Identifying new drug targets through risk genes is a highly effective drug discovery strategy, which is conducive to drug repositioning research for PD [45]. To assess the potential value of risk genes in drug discovery, this paper obtained all drug target genes from the major drug database DrugBank, which includes drugs approved in clinical trials or experimental drugs [46]. CRHR1 was found to overlap with the DrugBank drug target, which corresponds to hydrocortisone for Cushing’s disease [35]. The CRHR1 receptor can be combined with CRF, the main point regulator of the hypothalamic–pituitary–adrenal axis, to regulate a large amount of hormone cortisol released downstream, indicating that CRHR1 has a neuroprotective effect [36,37]. There is also evidence from animal experiments that hydrocortisone can stimulate the expression of Parkin through the CREB pathway, and the induced expression of Parkin is the cause of its neuroprotective effect [38]. Therefore, hydrocortisone, as a CRHR1 repositioning drug, may become a potential drug in the treatment of PD.
There are also some limitations to this study. First, this study did not perform tissue-specific identification. The expression data we used were derived from blood [18]; it will be better to analyze the expression data from brain tissue. However, some studies have shown that genetic influences on eQTL or mQTL data are highly correlated between independent brain and blood samples [47,48]. Zhu et al. found that expression data from brain tissue or blood did not significantly affect the gene recognition of schizophrenia [10]. Second, the HEIDI test is too conservative [9]. Therefore, we adopted a multiple test method to reduce the threshold of the HEIDI test to reduce the effect of possible false negative genes (Table 1).

5. Conclusions

In summary, the results suggest that CRHR1, KANSL1, NSF, LRRC37A and two new genes STX4 and BST1 are related to the risk of PD. In particular, the discovery of the CRHR1 target indicates that hydrocortisone may become a potential drug for the treatment of PD. In addition, the expression mechanism of CRHR1 and LRRC37A also illustrates the important role of DNAm in gene expression and disease occurrence. This study provides a process for analyzing disease genes and pathogenesis, which is of great significance in clinical treatment.

Supplementary Materials

The following are available online at https://www.mdpi.com/2073-4425/11/9/1100/s1, Table S1: Summary of biological function items by GO enrichment, Table S2: Summary of risk genes for independent GWAS datasets screened by SMR, Table S3: Summary of effect value information of PD risk genes, Table S4: Summary of transcription-related DNAm probe enrichment in 14 functional regions, Figure S1: Causal effect map of KIAA1267, Figure S2: Causal effect map of NSF gene, Figure S3: Causal effect map of LRRC37A4, Figure S4: Causal effect map of MGC57346, Figure S5: Causal effect map of C17ORF69, Figure S6: Causal effect map of STX4, Figure S7: Enrichment analysis of DNAm probes in 14 main functional annotation categories, Figure S8: Summary of SMR correlation analysis across mQTL, eQTL and GWAS on Chr16.

Author Contributions

H.-Y.Z. and Q.Z. conceived and designed the project; W.-W.C. performed and analyzed the data; W.-W.C. wrote the manuscript; and Q.Z. interpreted the data and revised the manuscript. All authors have read and agreed to the published version of the manuscript.

Funding

This research was supported by the National Natural Science Foundation of China (Grant No. 31670779) and the Fundamental Research Funds for the Central Universities (Grant No. 2662020XXPY06).

Acknowledgments

PPMI: a public–private partnership, is funded by the Michael J. Fox Foundation for Parkinson’s Research and funding partners, including abbVie, Avid, Biogen, Bristol-Myers Squibb, COVANCE, GE Healthcare, Genentech, GlaxoSmithKline, Lundbeck, Lilly, Merck, MesoScaleDiscovery, Pfizer, Piramal, Roche, Sanofi Genzyme, Servier, TEVA, and UCB.

Conflicts of Interest

The authors declare no conflict of interest.

References

  1. Armstrong, M.J.; Okun, M.S. Diagnosis and Treatment of Parkinson Disease: A Review. JAMA 2020, 323, 548–560. [Google Scholar] [CrossRef] [PubMed]
  2. Dorsey, E.R.; Bloem, B.R. The Parkinson Pandemic-A Call to Action. JAMA Neurol. 2018, 75, 9–10. [Google Scholar] [CrossRef] [PubMed]
  3. Blauwendraat, C.; Nalls, M.A.; Singleton, A.B. The genetic architecture of Parkinson’s disease. Lancet Neurol. 2020, 19, 170–178. [Google Scholar] [CrossRef]
  4. Nalls, M.A.; Blauwendraat, C.; Vallerga, C.L.; Heilbron, K.; Bandres-Ciga, S.; Chang, D.; Tan, M.; Kia, D.A.; Noyce, A.J.; Xue, A.; et al. Identification of novel risk loci, causal insights, and heritable risk for Parkinson’s disease: A meta-analysis of genome-wide association studies. Lancet Neurol. 2019, 18, 1091–1102. [Google Scholar] [CrossRef]
  5. Zheng, X.M.; Chen, J.; Pang, H.B.; Liu, S.; Gao, Q.; Wang, J.R.; Qiao, W.H.; Wang, H.; Liu, J.; Olsen, K.M.; et al. Genome-wide analyses reveal the role of noncoding variation in complex traits during rice domestication. Sci. Adv. 2019, 5, eaax3619. [Google Scholar] [CrossRef] [Green Version]
  6. Bulik-Sullivan, B.K.; Loh, P.R.; Finucane, H.K.; Ripke, S.; Yang, J.; Schizophrenia Working Group of the Psychiatric Genomics Consortium; Patterson, N.; Daly, M.J.; Price, A.L.; Neale, B.M. LD Score regression distinguishes confounding from polygenicity in genome-wide association studies. Nat. Genet. 2015, 47, 291–295. [Google Scholar] [CrossRef] [Green Version]
  7. Wu, Y.; Zheng, Z.; Visscher, P.M.; Yang, J. Quantifying the mapping precision of genome-wide association studies using whole-genome sequencing data. Genome Biol. 2017, 18, 86. [Google Scholar] [CrossRef] [Green Version]
  8. Farh, K.K.; Marson, A.; Zhu, J.; Kleinewietfeld, M.; Housley, W.J.; Beik, S.; Shoresh, N.; Whitton, H.; Ryan, R.J.; Shishkin, A.A.; et al. Genetic and epigenetic fine mapping of causal autoimmune disease variants. Nature 2015, 518, 337–343. [Google Scholar] [CrossRef]
  9. Zhu, Z.; Zhang, F.; Hu, H.; Bakshi, A.; Robinson, M.R.; Powell, J.E.; Montgomery, G.W.; Goddard, M.E.; Wray, N.R.; Visscher, P.M.; et al. Integration of summary data from GWAS and eQTL studies predicts complex trait gene targets. Nat. Genet. 2016, 48, 481–487. [Google Scholar] [CrossRef]
  10. Wu, Y.; Zeng, J.; Zhang, F.; Zhu, Z.; Qi, T.; Zheng, Z.; Lloyd-Jones, L.R.; Marioni, R.E.; Martin, N.G.; Montgomery, G.W.; et al. Integrative analysis of omics summary data reveals putative mechanisms underlying complex traits. Nat. Commun. 2018, 9, 918. [Google Scholar] [CrossRef]
  11. Rueger, S.; McDaid, A.; Kutalik, Z. Evaluation and application of summary statistic imputation to discover new height-associated loci. PLoS Genet. 2018, 14, e1007371. [Google Scholar] [CrossRef] [PubMed] [Green Version]
  12. Lloyd-Jones, L.R.; Holloway, A.; McRae, A.; Yang, J.; Small, K.; Zhao, J.; Zeng, B.; Bakshi, A.; Metspalu, A.; Dermitzakis, M.; et al. The genetic architecture of gene expression in peripheral blood. Am. J. Hum. Genet. 2017, 100, 371. [Google Scholar] [CrossRef] [PubMed] [Green Version]
  13. Consortium, E.P. An integrated encyclopedia of DNA elements in the human genome. Nature 2012, 489, 57–74. [Google Scholar] [CrossRef] [PubMed]
  14. Marek, K.; Chowdhury, S.; Siderowf, A.; Lasch, S.; Coffey, C.S.; Caspell-Garcia, C.; Simuni, T.; Jennings, D.; Tanner, C.M.; Trojanowski, J.Q.; et al. The Parkinson’s progression markers initiative (PPMI)—Establishing a PD biomarker cohort. Ann. Clin. Transl. Neurol. 2018, 5, 1460–1477. [Google Scholar] [CrossRef] [PubMed]
  15. Purcell, S.; Neale, B.; Todd-Brown, K.; Thomas, L.; Ferreira, M.A.; Bender, D.; Maller, J.; Sklar, P.; de Bakker, P.I.; Daly, M.J.; et al. PLINK: A tool set for whole-genome association and population-based linkage analyses. Am. J. Hum. Genet. 2007, 81, 559–575. [Google Scholar] [CrossRef] [PubMed] [Green Version]
  16. Willer, C.J.; Li, Y.; Abecasis, G.R. METAL: Fast and efficient meta-analysis of genomewide association scans. Bioinformatics 2010, 26, 2190–2191. [Google Scholar] [CrossRef] [PubMed]
  17. Pickrell, J.K.; Berisa, T.; Liu, J.Z.; Segurel, L.; Tung, J.Y.; Hinds, D.A. Detection and interpretation of shared genetic influences on 42 human traits. Nat. Genet. 2016, 48, 709–717. [Google Scholar] [CrossRef] [Green Version]
  18. Westra, H.J.; Peters, M.J.; Esko, T.; Yaghootkar, H.; Schurmann, C.; Kettunen, J.; Christiansen, M.W.; Fairfax, B.P.; Schramm, K.; Powell, J.E.; et al. Systematic identification of trans eQTLs as putative drivers of known disease associations. Nat. Genet. 2013, 45, 1238–1243. [Google Scholar] [CrossRef] [Green Version]
  19. Powell, J.E.; Henders, A.K.; McRae, A.F.; Caracella, A.; Smith, S.; Wright, M.J.; Whitfield, J.B.; Dermitzakis, E.T.; Martin, N.G.; Visscher, P.M.; et al. The brisbane systems genetics study: Genetical genomics meets complex trait genetics. PLoS ONE 2012, 7, e35430. [Google Scholar] [CrossRef]
  20. Chen, B.H.; Marioni, R.E.; Colicino, E.; Peters, M.J.; Horvath, S. DNA methylation-based measures of biological age: Meta-analysis predicting time to death. Aging 2016, 8, 1844–1865. [Google Scholar] [CrossRef] [Green Version]
  21. Pankratz, N.; Beecham, G.W.; DeStefano, A.L.; Dawson, T.M.; Doheny, K.F.; Factor, S.A.; Hamza, T.H.; Hung, A.Y.; Hyman, B.T.; Ivinson, A.J.; et al. Meta-analysis of Parkinson’s disease: Identification of a novel locus, RIT2. Ann. Neurol. 2012, 71, 370–384. [Google Scholar] [CrossRef] [PubMed] [Green Version]
  22. Ashburner, M.; Ball, C.A.; Blake, J.A.; Botstein, D.; Butler, H.; Cherry, J.M.; Davis, A.P.; Dolinski, K.; Dwight, S.S.; Eppig, J.T.; et al. Gene ontology: Tool for the unification of biology. The Gene Ontology Consortium. Nat. Genet. 2000, 25, 25–29. [Google Scholar] [CrossRef] [PubMed] [Green Version]
  23. Pelz, J.O.; Belau, E.; Fricke, C.; Classen, J.; Weise, D. Axonal degeneration of the vagus nerve in Parkinson’s disease-a high-resolution ultrasound study. Front. Neurol. 2018, 9, 951. [Google Scholar] [CrossRef] [PubMed] [Green Version]
  24. Corti, O. Neuronal mitophagy: Lessons from a pathway linked to Parkinson’s disease. Neurotox Res. 2019, 36, 292–305. [Google Scholar] [CrossRef]
  25. Elsworth, J.D.; Leranth, C.; Redmond, D.E., Jr.; Roth, R.H. Loss of asymmetric spine synapses in prefrontal cortex of motor-asymptomatic, dopamine-depleted, cognitively impaired MPTP-treated monkeys. Int. J. Neuropsychopharmacol. 2013, 16, 905–912. [Google Scholar] [CrossRef] [Green Version]
  26. Shetty, A.K.; Bates, A. Potential of GABA-ergic cell therapy for schizophrenia, neuropathic pain, and Alzheimer’s and Parkinson’s diseases. Brain Res. 2016, 1638, 74–87. [Google Scholar] [CrossRef] [Green Version]
  27. Witoelar, A.; Jansen, I.E.; Wang, Y.; Desikan, R.S.; Gibbs, J.R.; Blauwendraat, C.; Thompson, W.K.; Hernandez, D.G.; Djurovic, S.; Schork, A.J.; et al. Genome-wide pleiotropy between Parkinson disease and Autoimmune diseases. JAMA Neurol. 2017, 74, 780–792. [Google Scholar] [CrossRef]
  28. Ferrari, R.; Wang, Y.; Vandrovcova, J.; Guelfi, S.; Witeolar, A.; Karch, C.M.; Schork, A.J.; Fan, C.C.; Brewer, J.B.; International, F.T.D.G.C.; et al. Genetic architecture of sporadic frontotemporal dementia and overlap with Alzheimer’s and Parkinson’s diseases. J. Neurol. Neurosurg. Psychiatry 2017, 88, 152–164. [Google Scholar] [CrossRef]
  29. Latourelle, J.C.; Dumitriu, A.; Hadzi, T.C.; Beach, T.G.; Myers, R.H. Evaluation of Parkinson disease risk variants as expression-QTLs. PLoS ONE 2012, 7, e46199. [Google Scholar] [CrossRef] [Green Version]
  30. Foo, J.N.; Tan, L.C.; Irwan, I.D.; Au, W.L.; Low, H.Q.; Prakash, K.M.; Ahmad-Annuar, A.; Bei, J.; Chan, A.Y.; Chen, C.M.; et al. Genome-wide association study of Parkinson’s disease in East Asians. Hum. Mol. Genet. 2017, 26, 226–232. [Google Scholar] [CrossRef] [Green Version]
  31. Zhu, X.C.; Cao, L.; Tan, M.S.; Jiang, T.; Wang, H.F.; Lu, H.; Tan, C.C.; Zhang, W.; Tan, L.; Yu, J.T. Association of Parkinson’s Disease GWAS-Linked Loci with Alzheimer’s Disease in Han Chinese. Mol. Neurobiol. 2017, 54, 308–318. [Google Scholar] [CrossRef] [PubMed]
  32. Lill, C.M.; Roehr, J.T.; McQueen, M.B.; Kavvoura, F.K.; Bagade, S.; Schjeide, B.M.; Schjeide, L.M.; Meissner, E.; Zauft, U.; Allen, N.C.; et al. Comprehensive research synopsis and systematic meta-analyses in Parkinson’s disease genetics: The PDGene database. PLoS Genet. 2012, 8, e1002548. [Google Scholar] [CrossRef] [PubMed] [Green Version]
  33. Li, J.; Luo, J.; Liu, L.; Fu, H.; Tang, L. The association between CD157/BST1 polymorphisms and the susceptibility of Parkinson’s disease: A meta-analysis. Neuropsychiatr. Dis. Treat. 2019, 15, 1089–1102. [Google Scholar] [CrossRef] [PubMed] [Green Version]
  34. Kasai, S.; Yoshihara, T.; Lopatina, O.; Ishihara, K.; Higashida, H. Selegiline ameliorates Depression-like behavior in mice lacking the CD157/BST1 gene, a risk factor for Parkinson’s disease. Front. Behav. Neurosci. 2017, 11, 75. [Google Scholar] [CrossRef]
  35. Weber, H.; Richter, J.; Straube, B.; Lueken, U.; Domschke, K.; Schartner, C.; Klauke, B.; Baumann, C.; Pane-Farre, C.; Jacob, C.P.; et al. Allelic variation in CRHR1 predisposes to panic disorder: Evidence for biased fear processing. Mol. Psychiatry 2016, 21, 813–822. [Google Scholar] [CrossRef] [Green Version]
  36. Koutmani, Y.; Politis, P.K.; Elkouris, M.; Agrogiannis, G.; Kemerli, M.; Patsouris, E.; Remboutsika, E.; Karalis, K.P. Corticotropin-releasing hormone exerts direct effects on neuronal progenitor cells: Implications for neuroprotection. Mol. Psychiatry 2013, 18, 300–307. [Google Scholar] [CrossRef] [Green Version]
  37. Short, A.K.; Maras, P.M.; Pham, A.L.; Ivy, A.S.; Baram, T.Z. Blocking CRH receptors in adults mitigates age-related memory impairments provoked by early-life adversity. Neuropsychopharmacology 2020, 45, 515–523. [Google Scholar] [CrossRef]
  38. Ham, S.; Lee, Y.I.; Jo, M.; Kim, H.; Kang, H.; Jo, A.; Lee, G.H.; Mo, Y.J.; Park, S.C.; Lee, Y.S.; et al. Hydrocortisone-induced parkin prevents dopaminergic cell death via CREB pathway in Parkinson’s disease model. Sci. Rep. 2017, 7, 525. [Google Scholar] [CrossRef] [Green Version]
  39. Szklarczyk, D.; Gable, A.L.; Lyon, D.; Junge, A.; Wyder, S.; Huerta-Cepas, J.; Simonovic, M.; Doncheva, N.T.; Morris, J.H.; Bork, P.; et al. STRING v11: Protein-protein association networks with increased coverage, supporting functional discovery in genome-wide experimental datasets. Nucleic Acids Res. 2019, 47, D607–D613. [Google Scholar] [CrossRef] [Green Version]
  40. Chang, D.; Nalls, M.A.; Hallgrimsdottir, I.B.; Hunkapiller, J.; van der Brug, M.; Cai, F.; International Parkinson’s Disease Genomics Consortium; 23andMe Research Team; Kerchner, G.A.; Ayalon, G.; et al. A meta-analysis of genome-wide association studies identifies 17 new Parkinson’s disease risk loci. Nat. Genet. 2017, 49, 1511–1516. [Google Scholar] [CrossRef]
  41. Roadmap Epigenomics, C.; Kundaje, A.; Meuleman, W.; Ernst, J.; Bilenky, M.; Yen, A.; Heravi-Moussavi, A.; Kheradpour, P.; Zhang, Z.; Wang, J.; et al. Integrative analysis of 111 reference human epigenomes. Nature 2015, 518, 317–330. [Google Scholar] [CrossRef] [Green Version]
  42. Schork, A.J.; Thompson, W.K.; Pham, P.; Torkamani, A.; Roddey, J.C.; Sullivan, P.F.; Kelsoe, J.R.; O’Donovan, M.C.; Furberg, H.; The Tobacco and Genetics Consortium; et al. All SNPs are not created equal: Genome-wide association studies reveal a consistent pattern of enrichment among functionally annotated SNPs. PLoS Genet. 2013, 9, e1003449. [Google Scholar] [CrossRef] [PubMed]
  43. Yang, Z.H.; Li, Y.S.; Shi, M.M.; Yang, J.; Liu, Y.T.; Mao, C.Y.; Fan, Y.; Hu, X.C.; Shi, C.H.; Xu, Y.M. SNCA but not DNM3 and GAK modifies age at onset of LRRK2-related Parkinson’s disease in Chinese population. J. Neurol. 2019, 266, 1796–1800. [Google Scholar] [CrossRef] [PubMed]
  44. Taguchi, T.; Ikuno, M.; Hondo, M.; Parajuli, L.K.; Taguchi, K.; Ueda, J.; Sawamura, M.; Okuda, S.; Nakanishi, E.; Hara, J.; et al. alpha-Synuclein BAC transgenic mice exhibit RBD-like behaviour and hyposmia: A prodromal Parkinson’s disease model. Brain 2020, 143, 249–265. [Google Scholar] [CrossRef]
  45. Pushpakom, S.; Iorio, F.; Eyers, P.A.; Escott, K.J.; Hopper, S.; Wells, A.; Doig, A.; Guilliams, T.; Latimer, J.; McNamee, C.; et al. Drug repurposing: Progress, challenges and recommendations. Nat. Rev. Drug Discov. 2019, 18, 41–58. [Google Scholar] [CrossRef]
  46. Knox, C.; Law, V.; Jewison, T.; Liu, P.; Ly, S.; Frolkis, A.; Pon, A.; Banco, K.; Mak, C.; Neveu, V.; et al. DrugBank 3.0: A comprehensive resource for ‘Omics’ research on drugs. Nucleic Acids Res. 2010, 39, D1035–D1041. [Google Scholar] [CrossRef] [Green Version]
  47. McKenzie, M.; Henders, A.K.; Caracella, A.; Wray, N.R.; Powell, J.E. Overlap of expression quantitative trait loci (eQTL) in human brain and blood. BMC Med. Genom. 2014, 7, 31. [Google Scholar] [CrossRef] [Green Version]
  48. Qi, T.; Wu, Y.; Zeng, J.; Zhang, F.; Xue, A.; Jiang, L.; Zhu, Z.; Kemper, K.; Yengo, L.; Zheng, Z.; et al. Identifying gene targets for brain-related traits using transcriptomic and methylomic data from blood. Nat. Commun. 2018, 9, 2282. [Google Scholar] [CrossRef] [Green Version]
Figure 1. Meta-analysis Genome-wide association studies (GWAS) results show single nucleotide polymorphisms (SNPs) associated with Parkinson’s disease (PD). (a) The Manhattan plot presents the p-value distribution of SNPs. The red line represents the significance level (p-value = 7.83 × 10⁻⁹) across the genome. (b) Quantile–quantile plot tests of the effectiveness of SNPs. The x-axis and y-axis represent the −log10 (p-values) of the expected SNPs and true SNPs, respectively.
Genes 11 01100 g001
Figure 2. Gene Ontology enrichment of meta-analysis GWAS results.
Genes 11 01100 g002
Figure 3. Prioritized risk genes and functional regions of PD with consistent association signals at the multiomics layers. The outermost green represents the results of expression quantitative trait locus (eQTL)-GWAS. Dots that exceed the gray line indicate that they have passed the SMR test. Marked dots represent six pleiotropic genes that passed the HEIDI test (black indicates four known genes; red indicates two new genes). The orange circle in the middle indicates the eQTL-methylation quantitative trait locus (mQTL) results. The innermost blue circle indicates the mutation site of mQTL-GWAS. In these two circles, the mutation sites that passed the SMR and HEIDI were marked, and the red-marked sites were potential mechanism regulatory sites.
Genes 11 01100 g003
Figure 4. Independent dataset validation of six identified risk genes. (a) Significant genetic intersection of independent GWAS data and meta-analysis GWAS data tested. The most significant genes of the latest GWAS data and the significant genes after SMR and HEIDI include STX4 and BST1, respectively. (b) Protein–protein interaction network of significant genes in the PD-Gene identified by SMR and HEIDI. STX4 interacts with known PD risk genes.
Genes 11 01100 g004
Figure 5. BST1 locus for PD. (a) The abscissa represents the coordinate axis on the chromosome interval. In the top graph, the brown dots indicate the p-values of each SNP in the GWAS meta-analysis, and the diamonds indicate the p-values of the probes in the SMR test. The figure below refers to the p-value of the cis-eQTL-labeled BST1 probe in eQTL data. BST1 loci that passed the SMR and HEIDI tests are highlighted with red dots. (b) The effect sizes of SNPs from GWAS and eQTL effects of SNPs. The orange dotted line indicates the most significant cis-eQTL effect value b x y , and b x y < 0 indicates that gene expression is negatively correlated with PD risk.
Genes 11 01100 g005aGenes 11 01100 g005b
Figure 6. Summary of SMR correlation analysis across GWAS, eQTL and mQTL on Chr17. The figure above shows the −log10 (p-values) of the SNPs from meta-analytic GWAS data. The middle two graphs are −log10 (p-values) of SNPs in eQTL and mQTL, respectively. The lower diagram shows chromatin status annotation information.
Genes 11 01100 g006
Figure 7. Potential regulatory mechanisms. (a) When the DNAm site in the promoter is high, the binding of the inhibitor and the promoter is prevented; the transcription factor normally binds to the promoter, and the expression of CRHR1 increases; when the DNAm site is low, the inhibitor binds to the promoter, and CRHR1 transcription is suppressed. (b) When DNAm in the promoter is high, the binding of transcription factors is disrupted, thereby suppressing the expression of LRRC37A4. When DNAm is low, transcription factors usually bind to the promoter, and the expression level of LRRC37A4 increases.
Genes 11 01100 g007
Table 1. Summary of risk genes identified by the summary data-based Mendelian randomization (SMR) and heterogeneity in dependent instruments (HEIDI) methods for PD.
ProbeIDChrGenetopSNPA1PGWASFDR PSMRPHEIDI
ILMN_178442817MGC57346
(CRHR1)
rs4074462T4.2 × 10−103.91 × 10−60.605
ILMN_174362117C17ORF69
(CRHR1)
rs17426195A3.53 × 10−104.91 × 10−60.507
ILMN_167823517KIAA1267
(KANSL1)
rs4630591T5.59 × 10−106.43 × 10−50.989
ILMN_168035317NSFrs183211A1.24 × 10−93 × 10−40.036
ILMN_168031316STX4rs8056842C1.39 × 10−52.14 × 10−40.732
ILMN_228678317LRRC37A4
(LRRC37A)
rs1635298T1.56 × 10−82.14 × 10−40.225
ILMN_17701614BST1rs4698412G2.83 × 10−52.14 × 10−40.738
ILMN_179011417LOC474170
(KANSL1)
rs9915547C2.85 × 10−92.48 × 10−40.551
Table 2. Gene loci that pass SMR and HEIDI at the level of DNAm, transcript and trait.
Methylation (M)—Trait (T)Methylation—Expression (E)Expression—Trait
Mprobel_RegionMprobeM_SNPMT_bSMREprobeE_SNPME_bSMRGeneET_bSMR
Promcg17117718rs17426174−0.17ILMN_1743621rs174261740.33C17ORF69
(CRHR1)
−0.51
ReprPCcg16228356rs176898820.27 rs17689882−0.54
TxWkcg21705961rs176898820.34 rs17689882−0.67
TssAcg07163735rs538628−0.97 rs176898822.25
Quiescg17736285rs9168880.88 rs1876831−1.88
Promcg08113562rs11012−0.22ILMN_1678235rs16940665−0.26KIAA1267
(KANSL1)
0.88
Promcg17117718rs17426174−0.17 rs16940665−0.18
ReprPCcg16228356rs176898820.27 rs176898820.31
TxWkcg21705961rs176898820.34 rs176898820.38
Quiescg17736285rs9168880.88 rs175755071.07
Promcg08113562rs11012−0.22ILMN_2286783rs11012−0.10LRRC37A4
(LRRC37A)
Promcg17117718rs17426174−0.17 rs17426174−0.09 1.58
ReprPCcg16228356rs176898820.27 rs174261740.15
TxWkcg21705961rs176898820.34 rs174261740.19
TssAcg07163735rs538628−0.97 rs17426174−0.63
Quiescg17736285rs9168880.88 rs174261740.54
Promcg17117718rs17426174−0.17ILMN_1784428rs174261740.57MGC57346
(CRHR1)
−0.3
ReprPCcg16228356rs176898820.27 rs17689882−0.93
TxWkcg21705961rs176898820.34 rs17689882−1.16
TssAcg07163735rs538628−0.97 rs176898823.91
Quiescg17736285rs9168880.88 rs1876831−3.27
Promcg08113562rs11012−0.22ILMN_1680353rs1994480.17NSF−1.09
Promcg17117718rs17426174−0.17 rs1994480.12
ReprPCcg16228356rs176898820.27 rs199448−0.2
TxWkcg21705961rs176898820.34 rs538628−0.25
TssAcg07163735rs538628−0.97 rs5386280.62
Quiescg17736285rs9168880.88 rs916888−0.62
Txcg01067137rs72940.29ILMN_1680313rs7294−0.57STX4−0.45
Mprobel_region = physical positions of methylation probes; Mprobe = ID of methylation probes; M_SNP = top significant SNP of methylation probes; MT_bSMR = SMR-estimated effect of DNA methylation on phenotype; ME_bSMR = SMR-estimated effect of DNA methylation on gene expression; ET_bSMR = SMR-estimated effect of gene expression on PD.

