Article

Analysis of Gene Expression of miRNA-106b-5p and TRAIL in the Apoptosis Pathway in Gastric Cancer

1
Marilia Medical School (FAMEMA), Marília, São Paulo 17519-030, Brazil
2
Department of Biosciences and Technology of Institute of Tropical Pathology and Public Health, Federal University of Goias (UFG), Goiânia, Goiás 74605-050, Brazil
3
Department of Morphology and Genetics, Escola Paulista de Medicina, Federal University of Sao Paulo (UNIFESP), São Paulo 04023-062, Brazil
*
Author to whom correspondence should be addressed.
Genes 2020, 11(4), 393; https://doi.org/10.3390/genes11040393
Submission received: 28 January 2020 / Revised: 30 March 2020 / Accepted: 1 April 2020 / Published: 5 April 2020
(This article belongs to the Special Issue microRNAs in Tumor Microenvironments)

Abstract

:
Helicobacter pylori (H. pylori) is one of the main causes of gastric gancer. TNF-related apoptosis-inducing ligand (TRAIL) is a protein able to promote apoptosis in cancer cells, however not in gastric cancer, which presents resistance to apoptosis via TRAIL. It is believed that MicroRNA-106b-5p might be involved in this resistance, although its role in Gastric Cancer is unclear. We aimed to determine the expression of microRNA-106b-5p and TRAIL in patients with gastric diseases, infected by H. pylori, and understand the relationship between these genes and their role in apoptosis and the gastric cancer pathways. H. pylori was detected by PCR, gene expression analysis was performed by real-time-qPCR, and bioinformatics analysis was performed using the Kyoto Encyclopedia of Genes and Genomes (KEGG) and Cytoscape software. A total of 244 patients were divided into groups (Control, Gastritis, and Cancer); H. pylori was detected in 42.2% of the samples. The cancer group had a poor expression of TRAIL (p < 0.0001) and overexpression of microRNA-106b-5p (p = 0.0005), however, our results confirmed that these genes are not directly related to each other although both are apoptosis-related regulators. Our results also indicated that H. pylori decreases microRNA-106b-5p expression and that this is a carcinogenic bacterium responsible for gastric diseases.

1. Introduction

Gastric cancer is one of the most commonly diagnosed types of cancer—the fifth most frequent worldwide, and the third highest cause of cancer-related death—and for many years, it has been considered a global health problem [1,2,3,4]. Gastric cancer is a multifactorial disease, depending on factors such as patients’ lifestyle, diet, and genetic characteristics [5]. Helicobacter pylori (H. pylori) has also been considered one of the main causes of gastric diseases, especially gastric cancer, considering that this Gram-negative bacterium successfully colonizes the stomach promoting intense inflammation and deregulating apoptosis process [6,7,8].
Apoptosis is a mechanism of programmed cell death; it is essential for the maintenance of gastric tissue by controlling cell proliferation, and is considered a defense mechanism against neoplastic processes [9,10,11]. The apoptosis process can be activated by two pathways: the mitochondrial pathway (intrinsic pathway) and the death receptor pathway (extrinsic pathway) [10]. The latter pathway depends on the link between specific ligands that leads to cell death [12].
TNF-related apoptosis-inducing ligand (TRAIL) is a transmembrane protein that promotes apoptosis by binding to its death receptors TRAIL-R1 (DR4) and TRAIL-R2 (DR5), targeting cancer cells and sparing healthy and normal cells [13,14,15]. TRAIL selectivity to cancer cells is justified by the high expression of DR4 and DR5 receptors in these cells, which facilitates TRAIL binding and the consequent activation of apoptosis [16]. However, some types of cancer have presented resistance to apoptosis via TRAIL, including gastric cancer [17,18].
MicroRNAs (miRNAs), small and non-coding RNAs, are molecules that bind to the 3‘-untranslated region (3′-UTR) of their corresponding target mRNAs and control the expression of specific genes [19,20]. These molecules are made up of about 20 nucleotides and participate in many different biological processes, such as cell proliferation, differentiation, and apoptosis; moreover, miRNAs are involved in the onset, progression, and metastasis of cancer [19,21]. Located on chromosome 7, microRNA-106b-5p (miR-106b-5p) has been considered an onco-miRNA due to its increased expression in different cancer types like hepatocellular carcinoma, breast cancer, osteosarcoma, and gastric cancer. It also plays a functional role in malignancy-associated processes including cell proliferation and migration [22,23,24,25].
Considering the above, this work aimed to determine the expression of miR-106b-5p and TRAIL in patients with gastric disease, including patients with gastric cancer, infected or not by H. pylori, We took miR-106b-5p as a focus of this study since only a few works correlated this gene to gastric cancer and the TRAIL, including the presence of H. pylori as a parameter to the analysis.

2. Materials and Methods

2.1. Patients and Tissue Samples

This study analyzed samples from 244 patients of both genders and over 18 years old. Three gastric biopsy samples were obtained from each patient: one for histopathological analysis to determine groups, one for DNA extraction, and one for RNA extraction. Samples were collected from patients who presented dyspeptic symptoms and were submitted to upper endoscopy, and from patients with gastric cancer submitted to surgery. Histopathological analysis was performed according to Sydney and Lauren’s criteria [5,26] to separate the patients into groups: Control (patients with healthy gastric mucosa), Gastritis, and Cancer. Details are described in Table 1.
All the patients involved in this research signed a consent form. Patients were excluded from this study who had received antimicrobial, anti-inflammatory, and chemotherapy within 30 days of the medical procedure. This research was approved by the Research Ethics Committee (number 1.119.830).
The samples from control patients and patients with gastritis were collected at the State Hospital of Bauru (HEB) and the Gastroenterology Center of the Clinical Hospital of Marilia Medical School (HC). The samples from patients with gastric cancer were obtained in collaboration with the Federal University of Sao Paulo (UNIFESP) and the Federal University of Goias (UFG).

2.2. DNA Extraction and Helicobacter Pylori Detection

DNA extraction was performed using QIAamp® DNA Mini Kit (Qiagen, Hilden, Germany, cat. No 51304,) according to the manufacturer’s instructions. H. pylori was diagnosed employing polymerase chain reaction (PCR) using the Hpx1 (CTGGAGARACTAAGYCCTCC) and Hpx2 (GAGGAATACTCATTGCGAAGGCGA) oligonucleotides, under conditions of 40 cycles: 94 °C, 1 min; 59 °C, 1 min, and 72 °C, 1 min. The diagnosis of H. pylori was obtained by electrophoresis, through which a fragment of 150 bp was visualized by agarose gel electrophoresis 2.5%, stained with ethidium bromide, and viewed and photographed in a transilluminator on the α Imager 2200 image capture system (α Innotech Corporation) [27].

2.3. RNA Extraction, cDNA Synthesis, and Real-Time Quantitative PCR (qPCR) Gene Expression Analysis

The samples collected for RNA extraction were stored in RNAlater® Tissue Collection (Ambion, Woodlands, TX, USA) at −20 °C. RNA extraction was performed using miRNeasy® Mini Kit 50 (Qiagen, cat. No 217004) according to the manufacturer’s protocol. The quality of RNA was confirmed using a Nanodrop ND-1000 (Thermo Fisher Scientific, Waltham, MA, USA).
Complementary DNA (cDNA) synthesis from total RNA was performed with the High-capacity cDNA Reverse Transcription Kit (Applied Biosystems™, Waltham, MA, USA) for expression analysis of TRAIL; the cDNA synthesis for microRNA analysis was performed using the TaqMan® MicroRNA Reverse Transcription Kit (Applied Biosystems™, USA). Both procedures were performed according to the manufacturer’s instructions.
The expression was determined by the ABI Prism 7500 Fast Sequence Detection System using TaqMan assays (Applied Biosystems). The qPCR used TRAIL (Hs00366278_m1) and hsa-miR-106b-5p (000442) as target genes. The reference genes for normalization were UBC (Hs00221499_m1) and TBP (Hs00187332_m1) for TRAIL, and for miR-106b-5p, RNU6B (Hs001093) and RNU48 (Hs001006) were employed. The relative quantification of the expression was calculated using the 2−ΔΔCt method [28].

2.4. Bioinformatics Analysis

2.4.1. Identification of miRNAs and Target Genes in Apoptosis

In order to clarify the role played by TRAIL and miR-106b-5p genes in the apoptosis pathway, bioinformatics analysis was performed using the Kyoto Encyclopedia of Genes and Genomes (KEGG) (https://www.genome.jp/kegg/) to first identify the genes involved in the apoptosis pathway (pathway: map04210). Then, considering only the apoptosis pathway, we used miRWalk online databases (http://zmf.umm.uni-heidelberg.de/apps/zmf/mirwalk2/index.html) to determine the target miR-106b-5p genes and the miRNAs that target the TRAIL gene. The interaction network was constructed using the Cytoscape software (version 3.7.2).

2.4.2. Screening for Differentially Expressed Genes (DEGs)

An in silico analysis was also performed to identify differentially expressed genes (DEGs) using two gene expression profiles between gastric cancer and normal gastric tissue samples from the GEO database ((https://www.ncbi. nlm.nih.gov/geo/) to confirm our preliminary results.
Using the keyword “apoptosis and gastric cancer” to search on the GEO Datasets database (https://www.ncbi.nlm.nih.gov/gds/?term=Apoptosis+and+gastric+cancer), a total of 27 series about human gastric cancer and apoptosis were retrieved from the database. After a careful review, two gene expression profiles on the GEO Datasets database (Accession: GSE103236 and Accession: GSE33651) were downloaded.
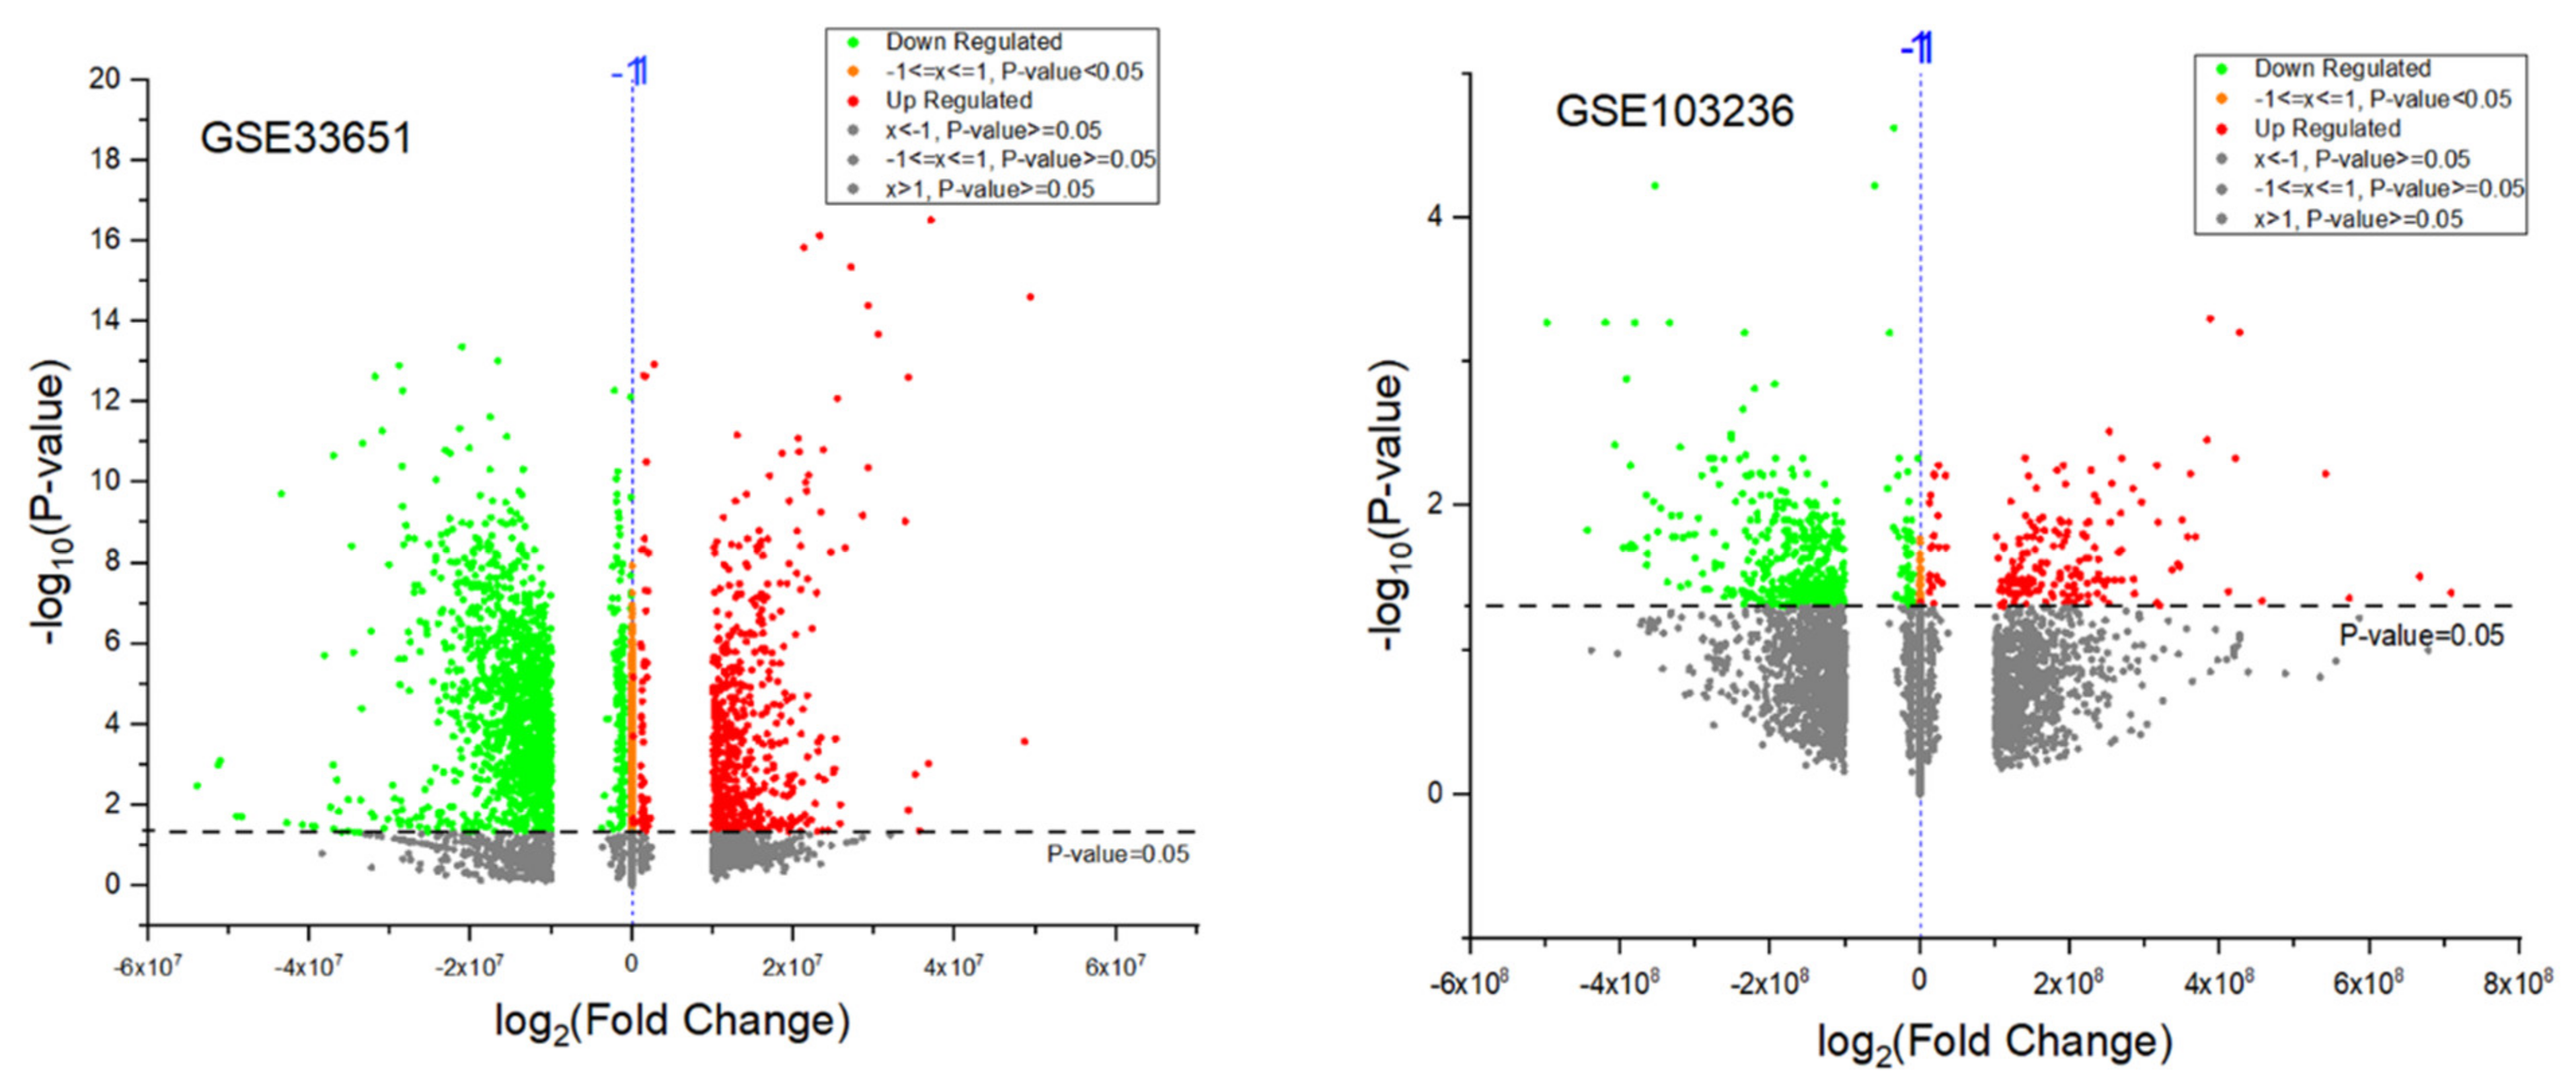
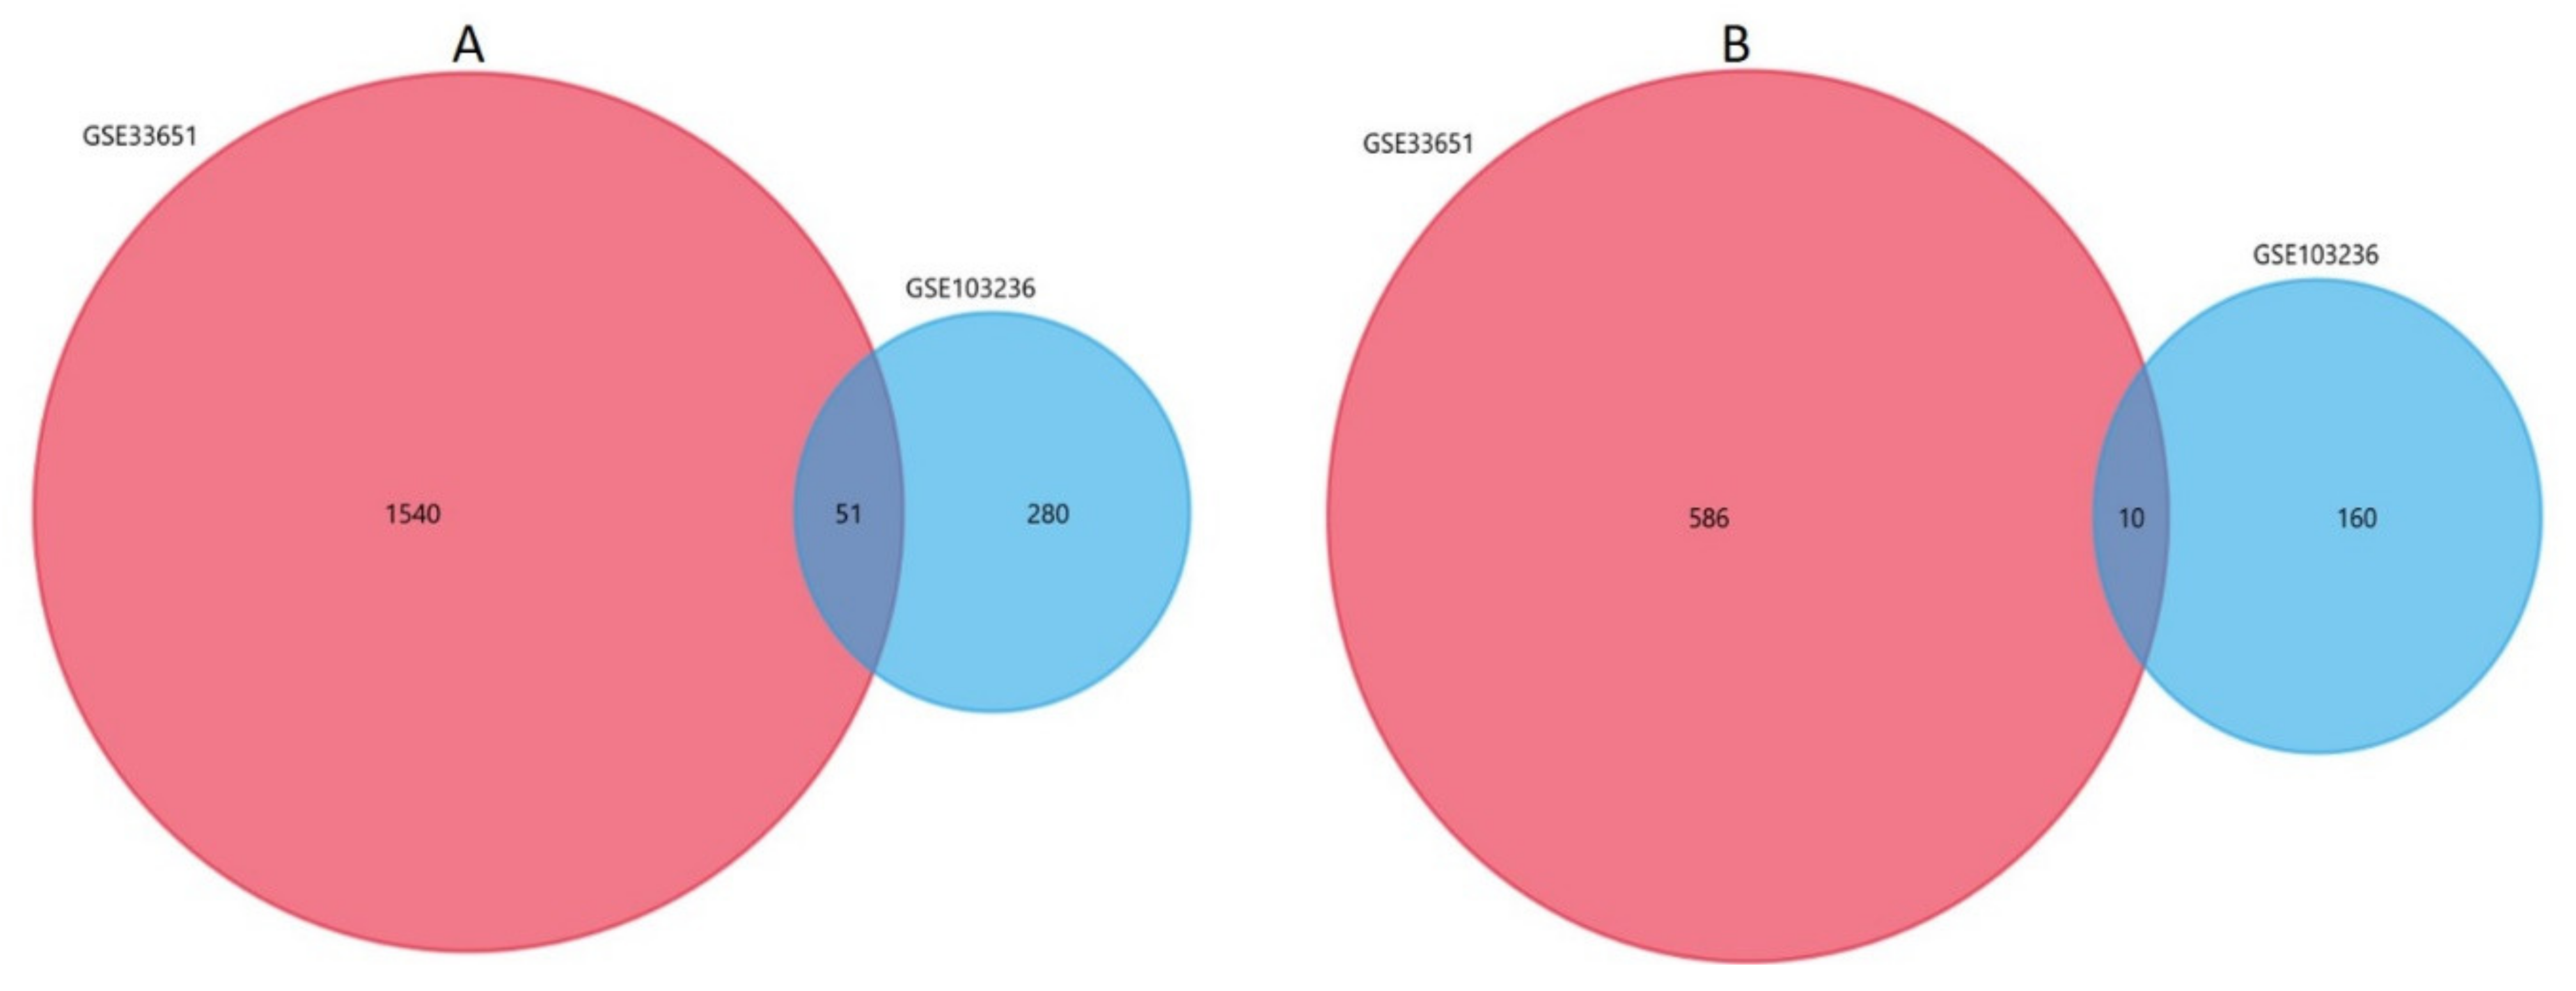
The DEGs analysis was performed using the GEO2R online analysis tool (http://www.ncbi.nlm.nih.gov/geo/geo2r), and the corrected p-values and |logFC| were calculated and used for the elaboration of volcano plot to determine differences in expression. The Venn diagram analysis was carried out for the intersection part via Funrich software (http://funrich.org/).

2.5. Statistical Analysis

The data were analyzed using GraphPad Prism 5. One-way analysis of variance (ANOVA), two-tailed Student’s t-test, and Fisher’s Exact test were employed. Significant results were considered those where p ≤ 0.05.

3. Results

3.1. Helicobacter Pylori Detection

After separating the groups by histopathological analysis, the first analysis performed was PCR for H. pylori detection. Using specific primers described in the Materials and Methods section, a 150 bp fragment corresponding to the bacterium was identified. H. pylori was detected in 42.2% of the samples. Our results indicate that this bacterium is related to the occurrence of gastric diseases including gastric cancer, considering that it was prevalent in the groups of patients with gastric injury and rare in healthy patients. Figure 1 illustrates the result of the electrophoresis (extra figures are available at Supplementary Materials) and Table 2 describes the details of positive samples for H. pylori.

3.2. Analysis of TRAIL and microRNA-106b-5p Gene Expression

For both TRAIL and miR-106b-5p, the expression levels were analyzed in two parts: first, the presence of Helicobacter pylori was not considered; thus, the Control, Gastritis, and Cancer groups consist of patients both infected and uninfected by the bacterium. Then, the second analysis was performed considering the presence of the bacterium; therefore, each group was divided into positive (Pos.) and negative (Neg.).
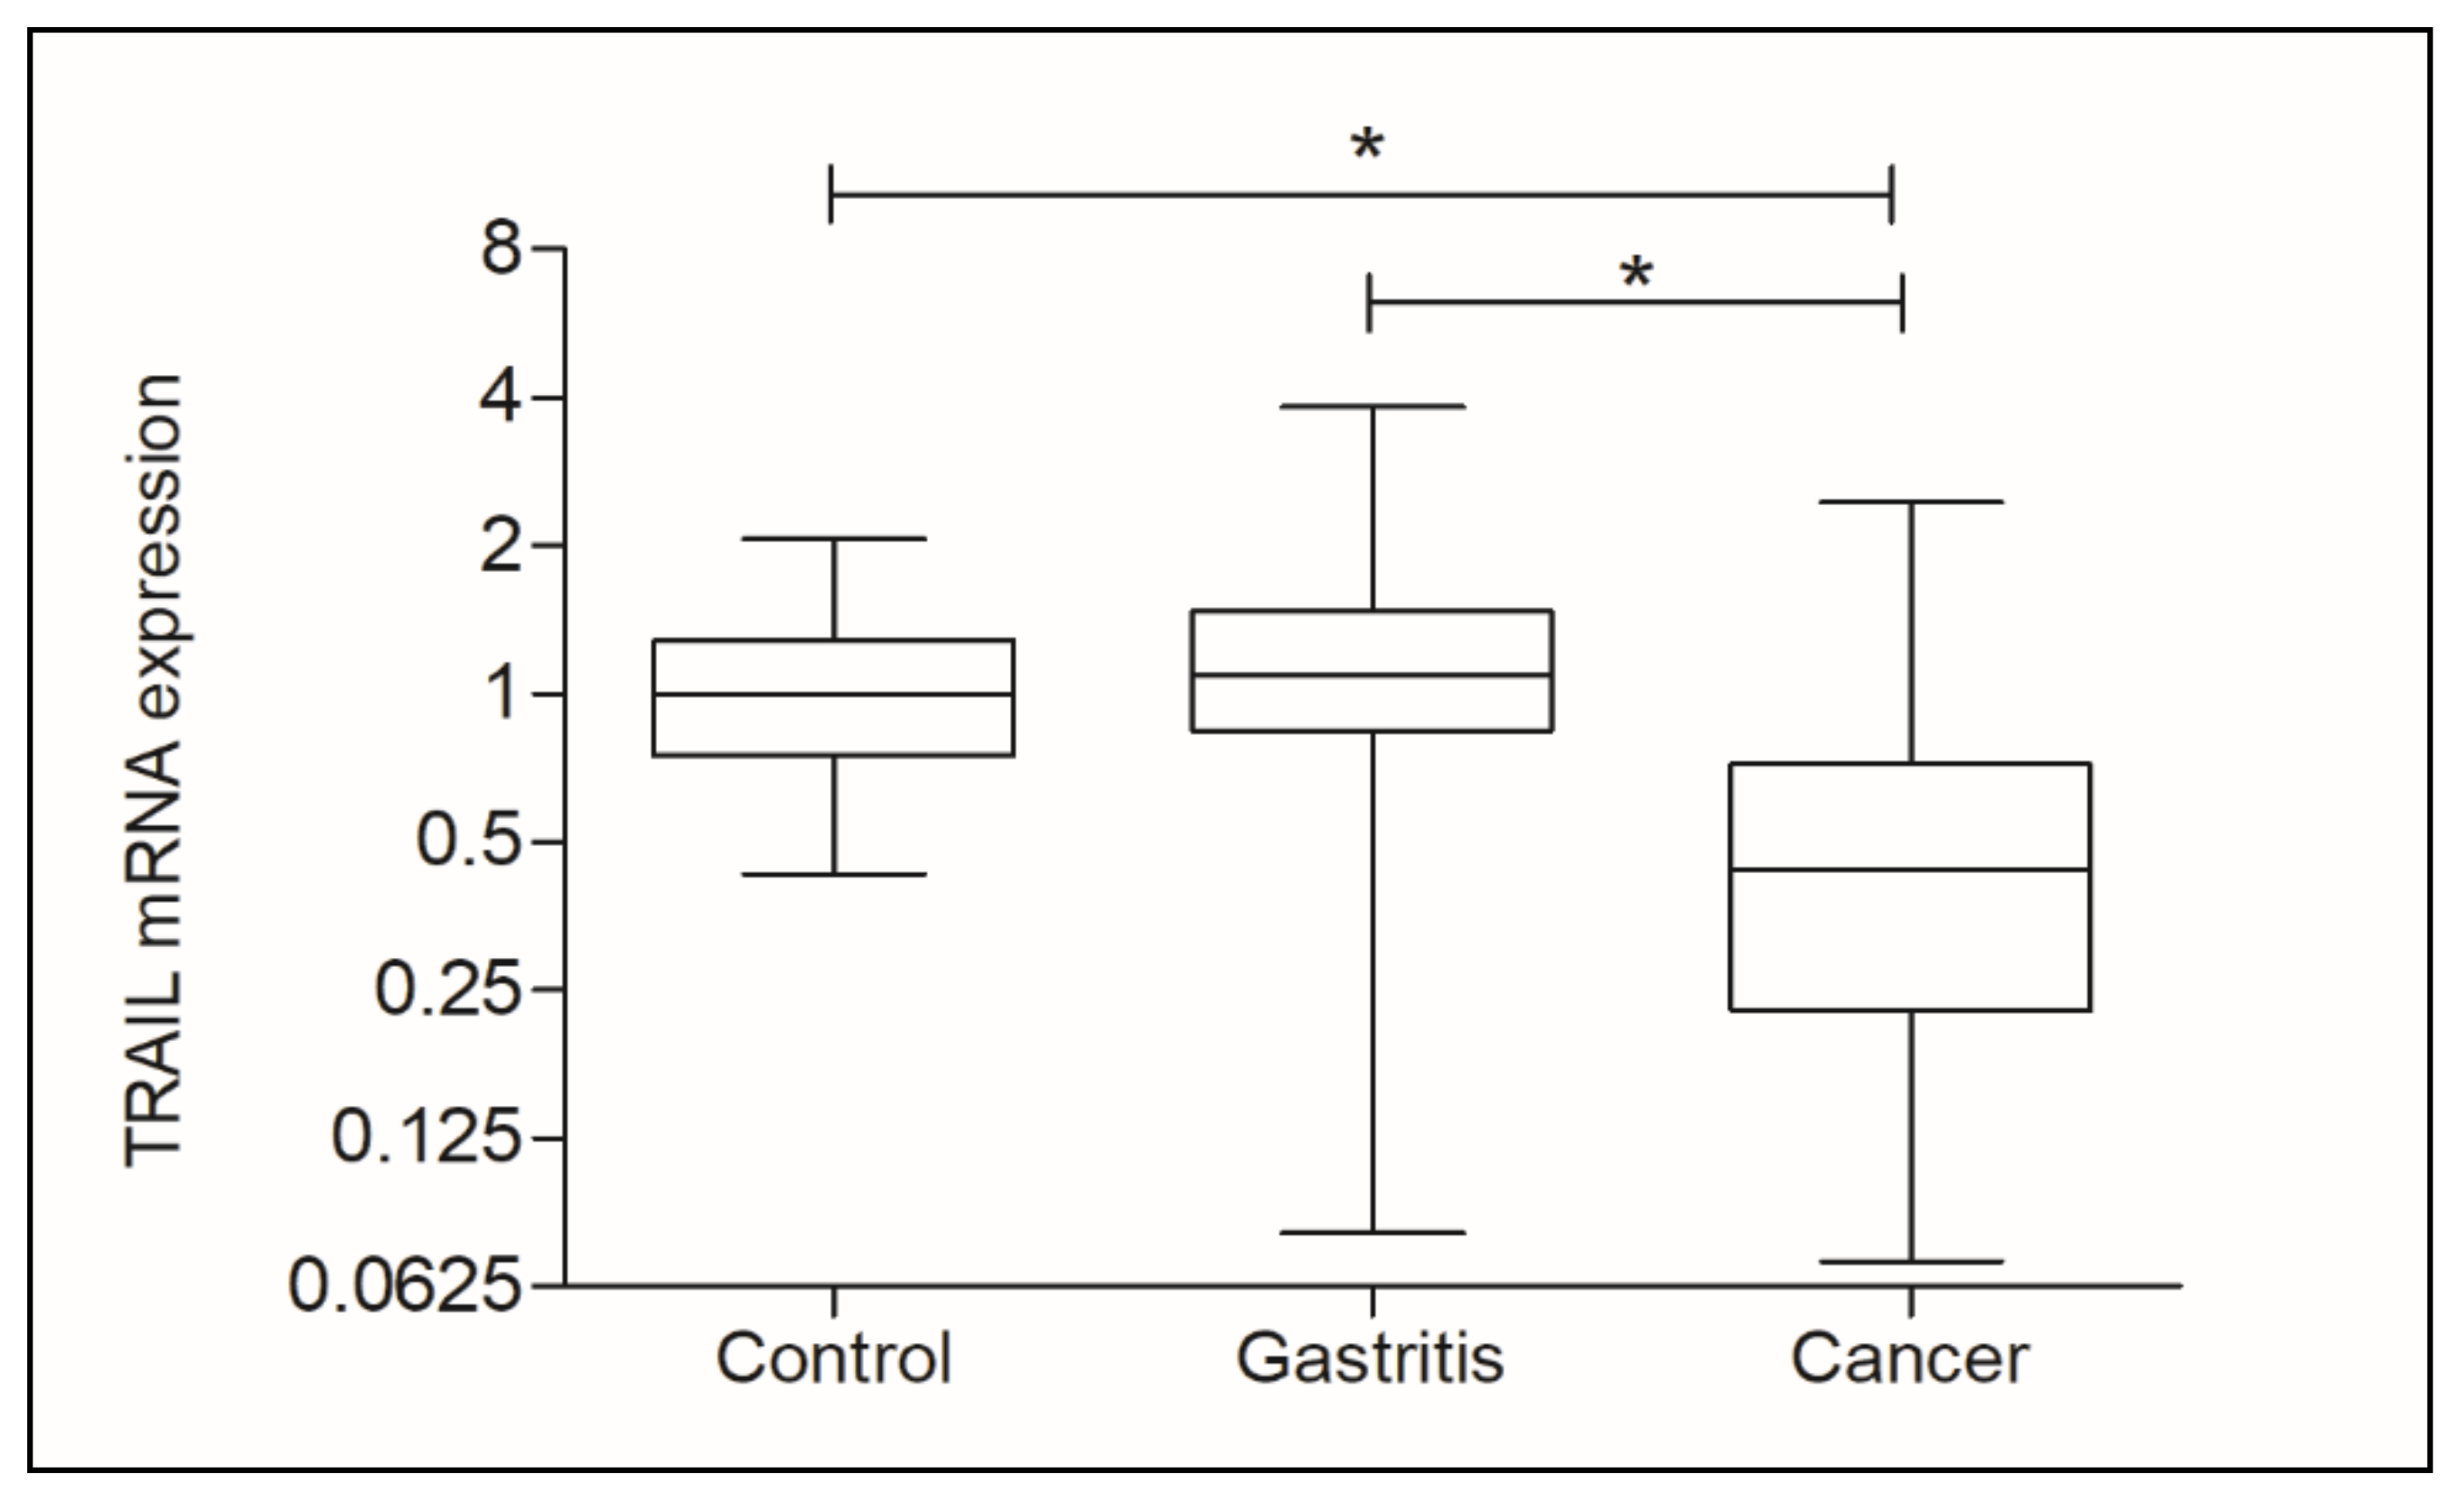
A statistically significant difference (p < 0.0001) was found between the three main groups of this study (Control, Gastritis, and cancer) in relation to TRAIL gene expression. Figure 2 shows that TRAIL expression was significantly decreased in the Cancer group (RQ mean: 0.4400) compared to the Control group (RQ mean: 1.000, p < 0.0001) and the Gastritis group (RQ mean: 1.090, p < 0.0001).
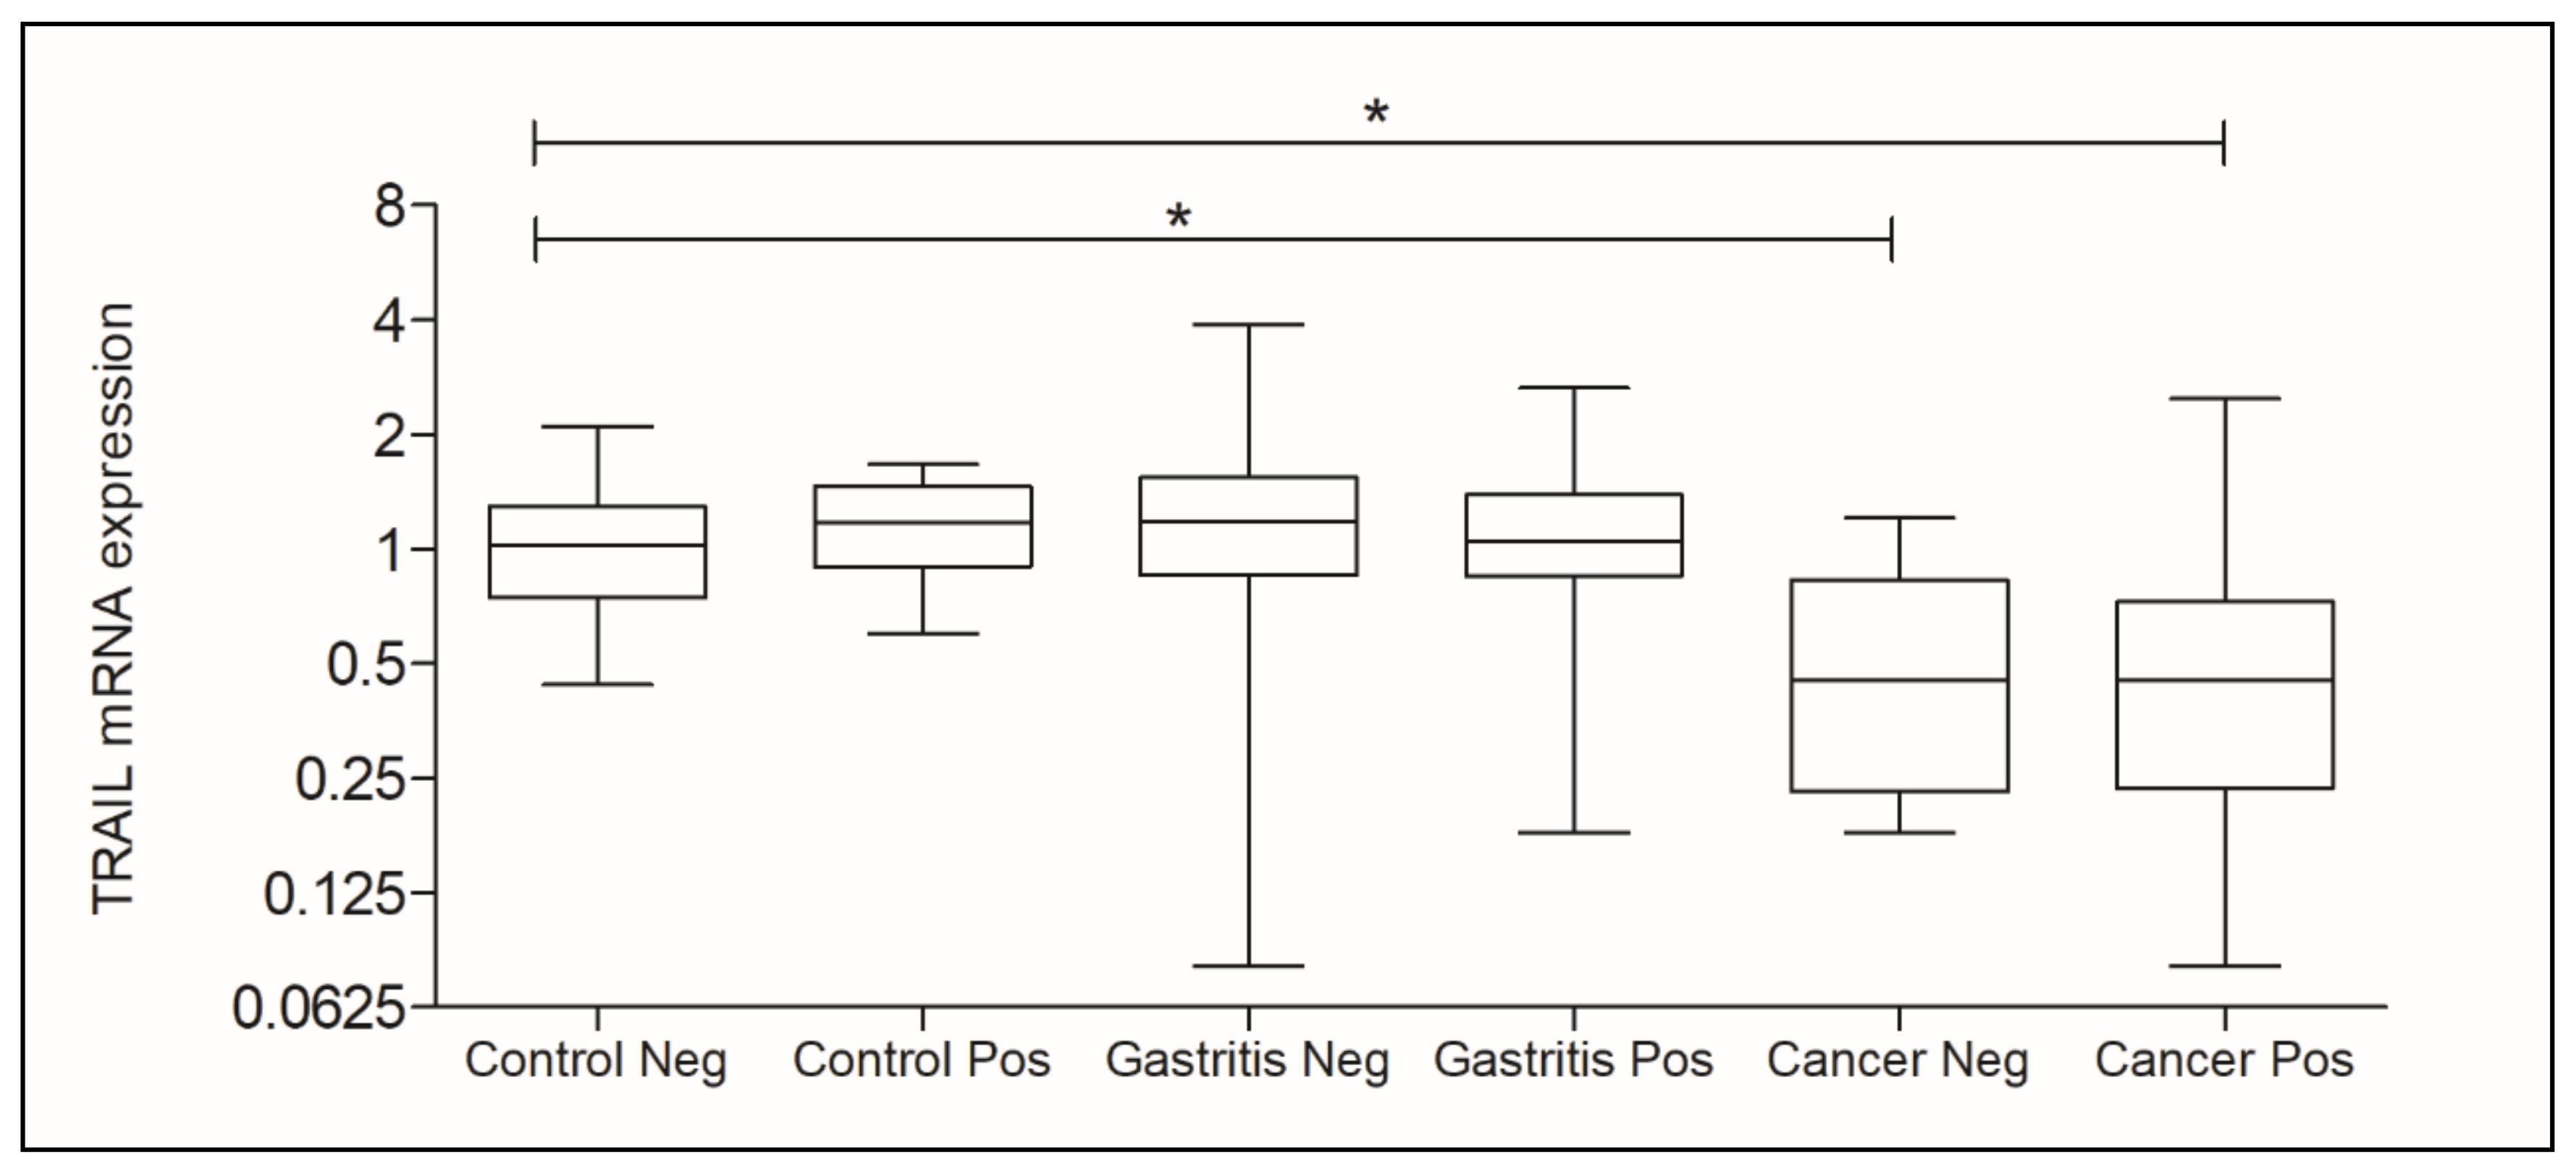
When considering the presence of H. pylori, each new group was compared with the Control Negative group (Control Neg.). There was a statistically significant difference when comparing the Control Neg. group (RQ mean: 1.020) to Cancer Neg. group (RQ mean: 0.4500, p = 0.0003) and the same Control Neg. group to Cancer Pos. group (RQ mean: 0.4500, p < 0.0001) as indicated in Figure 3.
Our results demonstrated that H. pylori does not interfere in the TRAIL gene expression, since the analysis did not present statistically significant differences when comparing the positive and negative groups. According to Figure 3, it is possible to notice that the expression levels of TRAIL are similar when the groups were compared to each other (Control Neg vs. Control Pos; Gastritis Neg vs. Gastritis Pos and Cancer Neg vs. Cancer Pos).
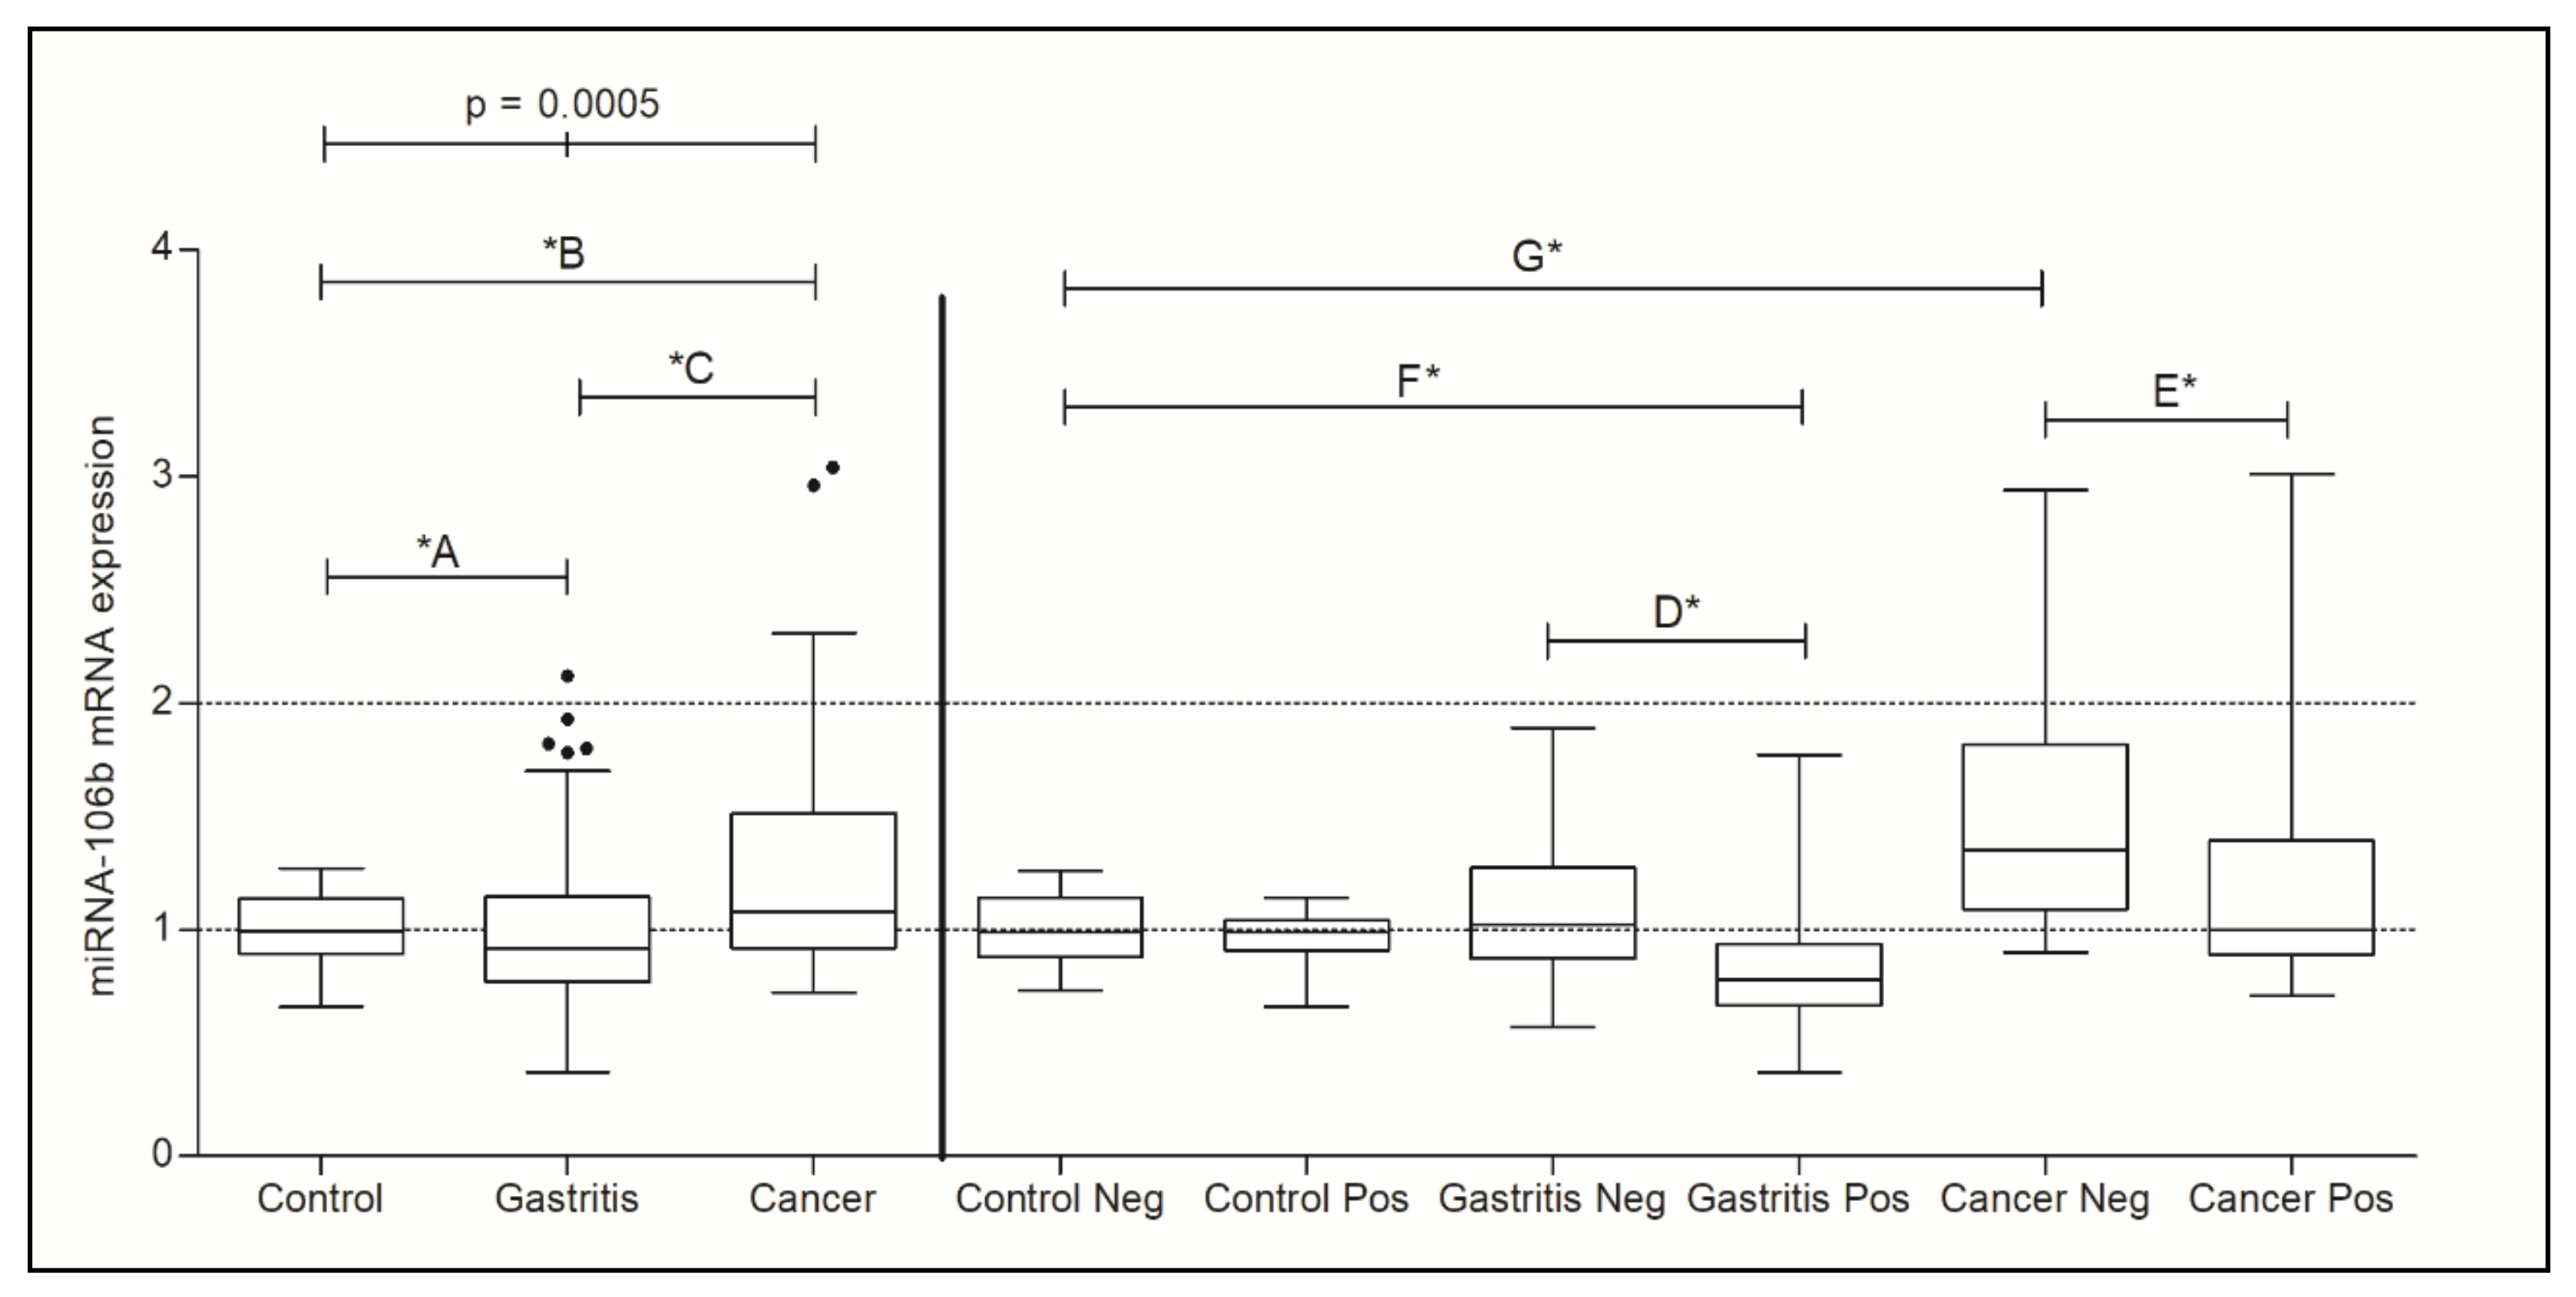
MiR-106b-5p gene expression was statistically different between the Control, Gastritis, and Cancer groups without considering the presence of H. pylori (p = 0.0005). The results of the comparisons between Control vs. Gastritis, Control vs. Cancer, and Gastritis vs. Cancer were all statistically significant as detailed in Table 2.
The presence of H. pylori was considered in the second part of the analysis; all groups were compared to Control Neg. group and the results for RQ mean and p-value are in Table 3. Figure 4 shows miR-106b-5p expression levels in all groups considered in this study.
When the groups of Gastritis Pos. were compared with Gastritis Neg and the groups of Cancer were compared to each other, both Gastritis Pos. (p < 0.0001 *D) and Cancer Pos. (p = 0.0192 *E) presented a decrease in miR-106b-5p expression and it seems that it is due to the presence of H. pylori, for this bacterium seems to be able to inhibit this miRNA expression.
Our results did not show any statistically significant difference when comparing the gene expression of TRAIL and miR-106b-5p with the parameters age and sex.

3.3. Bioinformatics Analysis and Interaction Network in the Apoptosis Pathway Considering TRAIL and miR-106b-5p Genes

It is known that both TRAIL and miR-106b-5p are related to the apoptosis process. In this work, we attempted to understand the relation between these genes and their function in the apoptosis pathway; therefore, bioinformatics analysis was performed to elucidate the interactions.
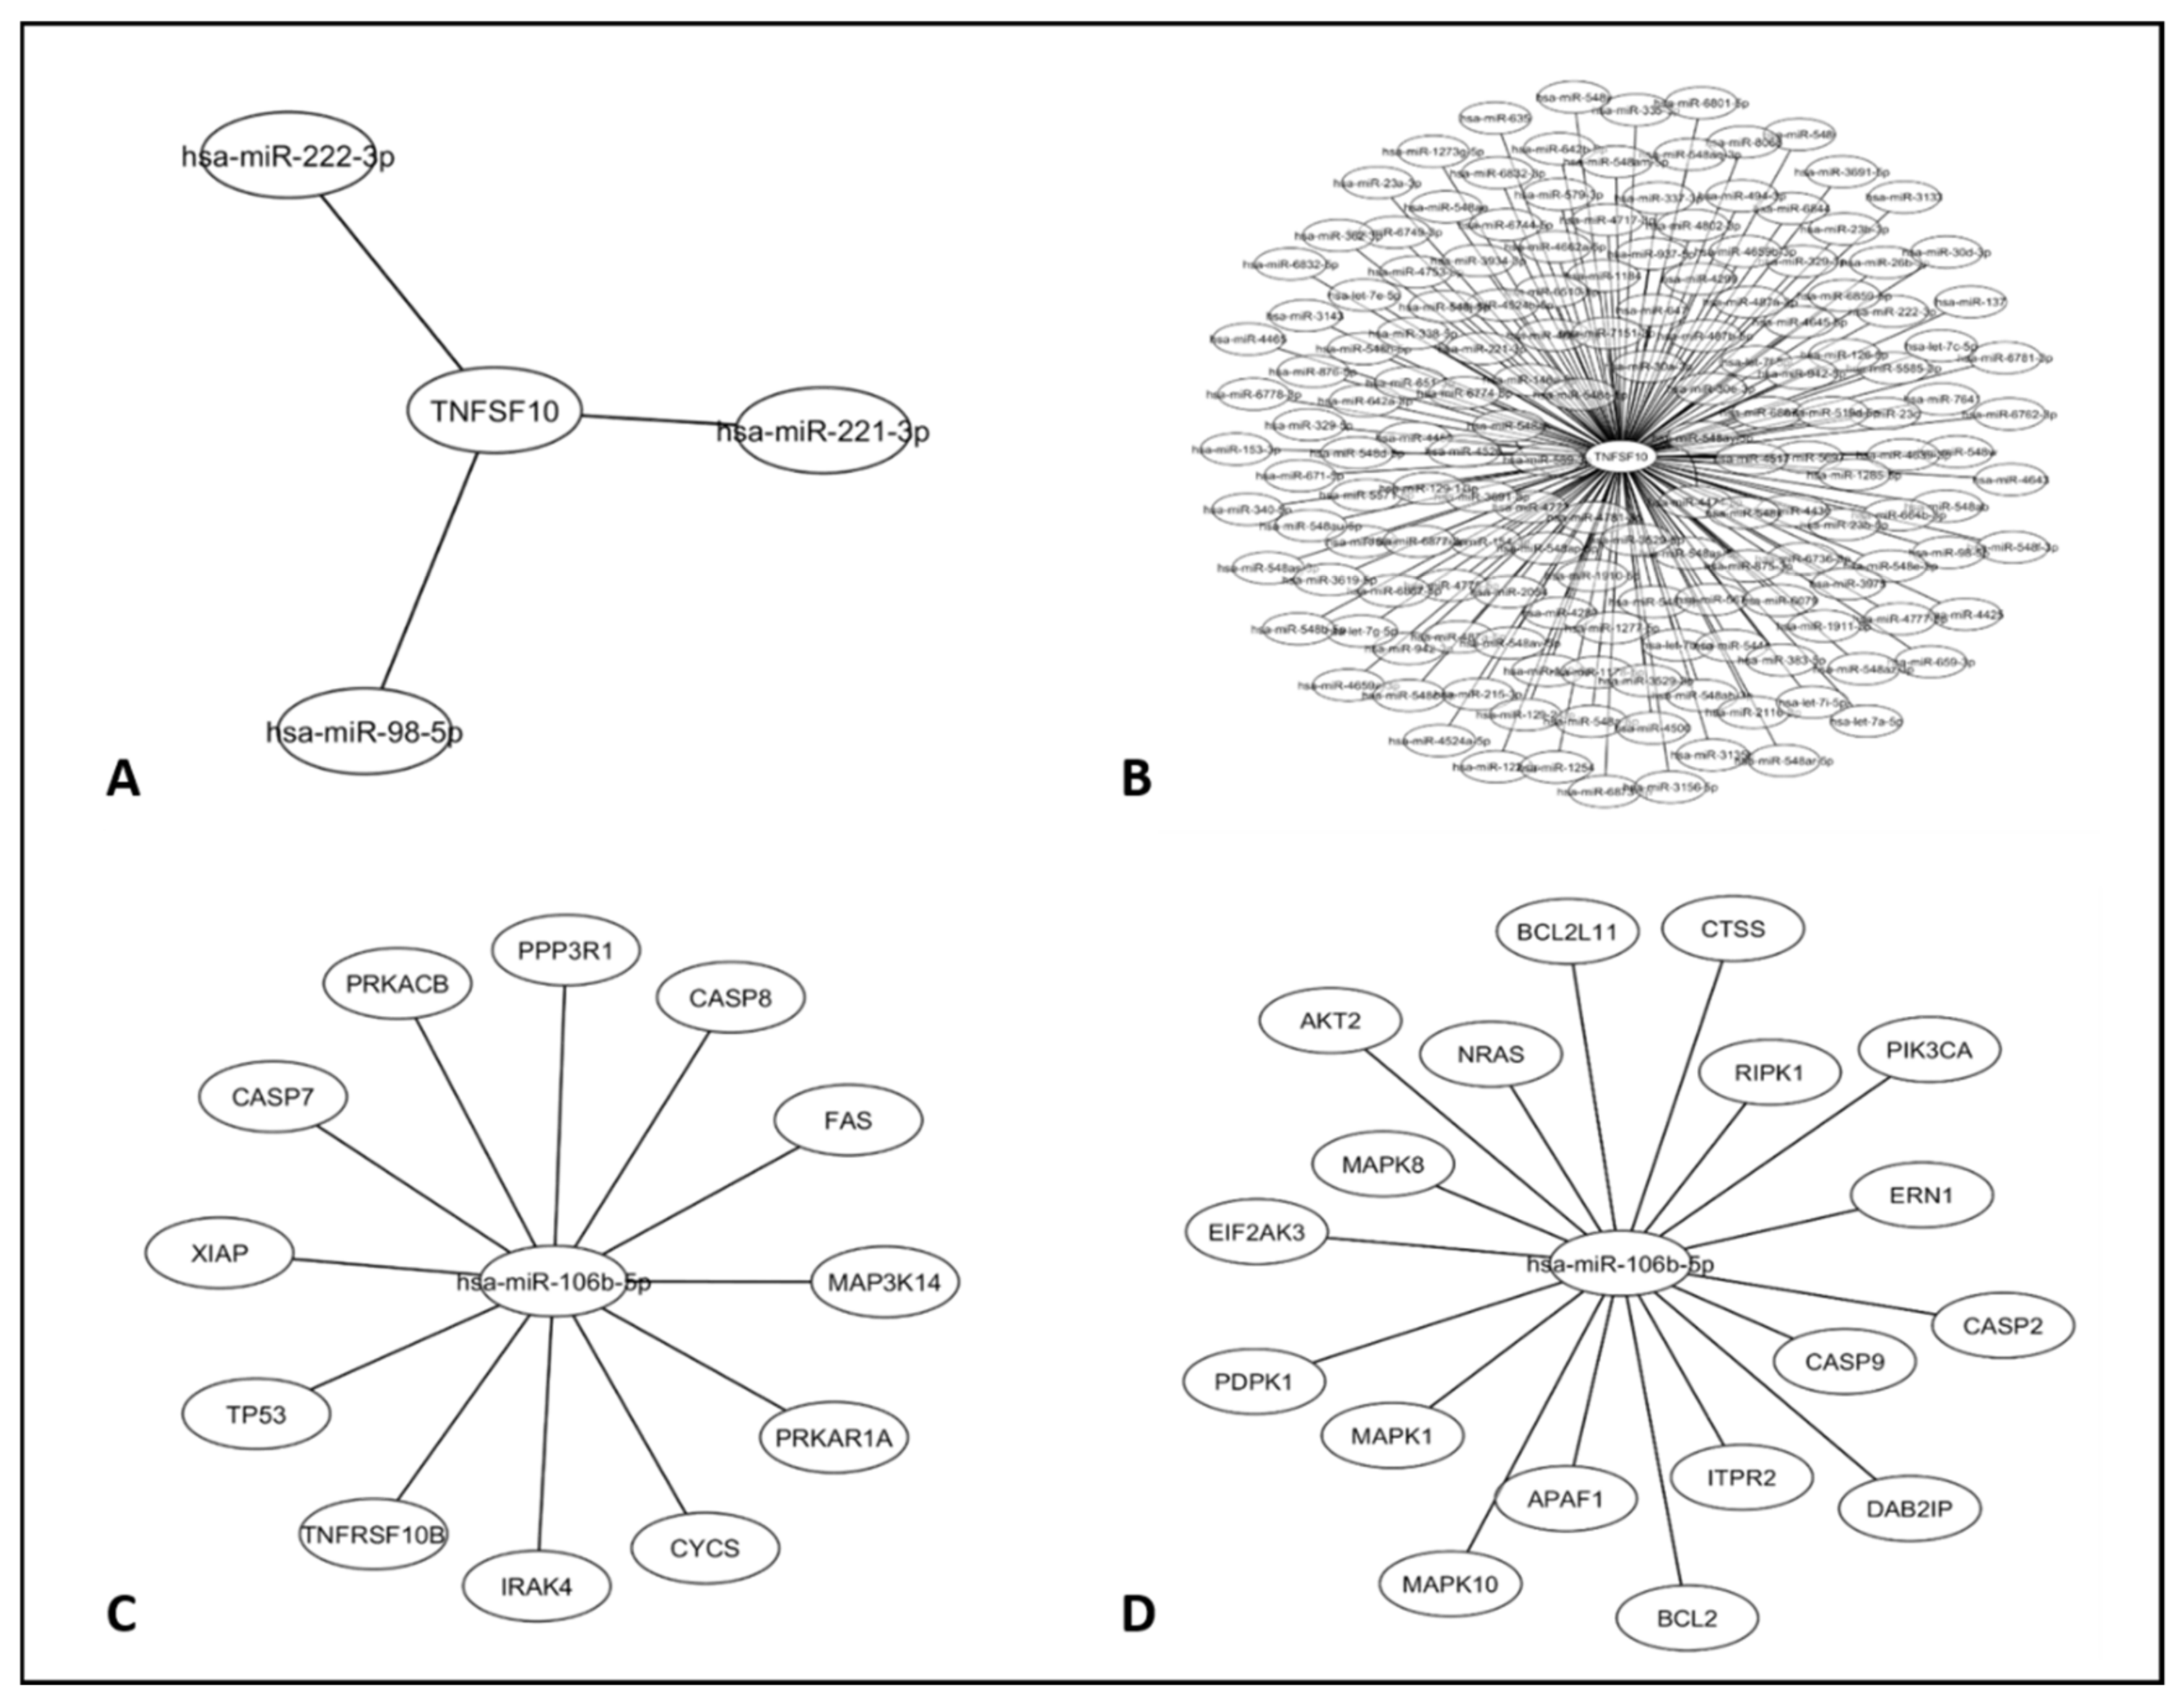
First, we took TRAIL (TNFSF10) as a reference gene in the apoptosis pathway and searched for miRNAs that had this gene as target. Figure 5A shows the miRNAs that were validated and Figure 5B shows the predicted ones. In this analysis, miR-106b-5p was not among the results of direct interaction with the TRAIL gene.
The second analysis was performed taking the miR-106b-5p as a reference gene and we searched for genes that were affected by this miRNA in the apoptosis pathway. Figure 5C shows the validated genes and Figure 5D shows the predicted ones. TRAIL is not one of the target genes of miR-106b-5p; however, this miRNA has other genes as target that make up this apoptosis pathway, such as Fas, Casp8, and Casp7, indicating that this miRNA, in fact, is able to control cell death.
Our results confirm that TRAIL and miR-106b-5p are apoptosis-related regulation, but they are not directly related to each other. TRAIL starts the apoptosis process by binding to its receptors and other genes continue the process inside the cell to reach the cell death, and these genes can be controlled by miR-106b-5p.

3.4. Identification of Differentially Expressed Genes (DEGs)

When the GSE103236 dataset was screened by GEO2R and then submitted to analysis, we verified that 199 genes were upregulated, and 532 genes were downregulated. Considering the GSE33651, 608 genes were found upregulated, and 1645 genes downregulated (Figure 6).
It is important to highlight that, considering the 1645 genes found in the GSE33651 dataset with a decrease of expression, the TRAIL gene was located at position 268, confirming our results for a decrease in the expression of this gene. On the other hand, for the TRAIL gene, although appearing in the GSE103236 dataset, an expression differential was not verified.
We generated a list of potential candidate genes that are differentially expressed in both datasets using Venn analysis (Figure 7). So, 61 DEGs were significantly differentially expressed between all two datasets, of which 10 were significantly upregulated genes and 51 were downregulated (Table 4).

4. Discussion

H. pylori infects the stomach of over 50% of the world’s population [6]. Since its discovery in 1983 [29], scientists have demonstrated that H. pylori is related to the occurrence of different types of gastric diseases including gastric cancer [30] through several mechanisms that this bacterium developed over the years [31]. In this study, H. pylori was identified in 42.2% of the 244 analyzed samples and its prevalence was 73.1% in the Cancer group. When compared to the other groups, this relevant result (p > 0.0001) confirms that H. pylori is, in fact, responsible for gastric diseases and is a carcinogenic bacterium. These findings are in agreement with other studies [32,33,34].
TRAIL is a pro-apoptotic protein that starts the apoptosis process by binding to its death receptors DR4 and DR5, targeting tumor cells without attacking healthy cells [35,36,37]. For this reason, TRAIL has been considered a promising cancer therapy [16]; however, some studies have shown that gastric cancer cells are resistant to this apoptosis pathway [13,17,18,38].
Our results for TRAIL expression found that this gene was poorly expressed in the Cancer group compared to Gastritis and Control groups. We suggest that this low expression of TRAIL is one of the causes for cancer, because a poorly expressed mRNA translates into low protein, which, in turn, is found in low levels, insufficient to act as expected for the promotion of apoptosis. Therefore, if apoptosis does not occur, cancer cells proliferate on a large scale.
The function of TRAIL can be decreased or inhibited through several different mechanisms, which include increased expression of decoy deceptors (DcR1 and DcR2) that compete with death receptors (DR4 and DR5) for binding with TRAIL; mutations in DR4 and DR5 or even their decreased expression; and increased expression of TRAIL inhibitors that are also called antiapoptotic proteins [39,40].
In this study, we considered that miR-106b-5p could be one of these antiapoptotic genes that interfere in the TRAIL apoptosis pathway. Unlike this gene, miR-106b-5p had an increased expression in the Cancer group, the same that presented low expression of TRAIL. Although the expression of these genes presents important statistical differences in the Cancer group, we confirmed that miR-106b-5p does not interfere directly in TRAIL but in genes activated from TRAIL signaling. Therefore, the establishment of cancer is probably due to the interference of miR-106b-5p in another gene in the apoptosis pathway other than TRAIL. MicroRNAs regulate functions for gene expression and they can be involved in carcinogenesis depending on their target [41]. In a more refined analysis, the miRWalk databases were used to determine validated targets miR-106b-5p genes involved in gastric carcinogenesis and 14 genes from this pathway were found: APC (regulator of the WNT signaling pathway), CCND1 (cyclin D1) CDKN1A (cyclin-dependent kinase inhibitor 1), E2F1, E2F2, E2F3 (transcription factor 1, 2, and 3, respectively), FZD9 (frizzled class receptor 9), MAPK1 (mitogen-activated protein kinase 1), MYC (proto-oncogene BHLH transcription factor), RB1 (transcriptional corepressor 1), SMAD4 (SMAD family member 4), TCF7L2 (transcription factor 7-like 2), TGFBR2 (transforming growth factor β receptor 2), and TP53 (tumor protein p53). Considering the main functions described in the process of carcinogenesis, these genes are involved in cell cycle regulation and tumor progression, cell growth, adhesion and migration, proliferation, differentiation, genome stability, DNA repair, and apoptosis [42,43,44,45,46,47,48,49].
Studies have demonstrated that miR-106b-5p is related to cell proliferation, invasion, and metastasis in the esophagus, gastric, breast, hepatic, renal, and lung cancer [50,51,52]. Fan et al. [41] concluded in their work that miR-106b-5p expression was increased in cervical cancer, and by suppressing this microRNA, cancer could be inhibited through apoptosis of the malignant cells. Similarly, Yin et al. [50] found an upregulation of miR-106b-5p in prostate cancer and concluded that inhibiting this microRNA could be an effective therapy against this cancer. We suggest that miR-106b-5p may act as an oncogene in gastric cancer, considering its high expression in the Cancer group and the ability to target genes in the apoptosis pathway and control them.
The results correlating TRAIL expression and H. pylori indicated that this bacterium does not influence this gene expression. Both results that considered or not the presence of H. pylori were similar and showed no difference for TRAIL expression, which was still decreased. On the other hand, H. pylori does influence miR-106b-5p expression, which was decreased in groups that were positives for the presence of the bacterium (Gastritis Pos. and Cancer Pos.).
Ye et al. [53] suggest that H. pylori’s lipopolysaccharides (LPS), a virulence factor of this bacterium, activate the toll-like receptor 4 (TLR4) signaling pathway, which is capable of downregulating the expression of miR-106b-5p, contributing to this miRNA-decreased expression. In addition, the authors confirm that JAK1 and STAT3 are target genes of miR-1006b-5p and that the JAK1/STAT3 pathway plays a part in gastric inflammation (gastritis establishment) and carcinogenesis.
The result for the presence of H. pylori in the Cancer group was already expected considering that the relationship of this bacterium with the occurrence of gastric neoplasia has already been proven [54,55,56]. Considering the bacterium and TRAIL, these two parameters are not related to each other on the onset of cancer. Taking the miR-106b-5p, this gene is able to start the oncogenic process due to its ability to control some genes that regulate the apoptosis, which is a defense mechanism against tumoral processes; we noticed that H. pylori is able to decrease this microRNA expression, therefore it might be able to avoid gastric cancer onset by this gene, but still, the presence of this bacterium by itself could be enough to promote the oncogenic process.
When the TRAIL gene was tested in silico considering samples of gastric cancer, was verified a decreased expression, in at least one database, confirming our results. The dysregulation of the TRAIL gene and in miR-106b-5p may suggest a double hit in an important pathway as apoptosis and gastric cancer.

5. Conclusions

Together, our results demonstrate that H. pylori is a risk to the development of gastric disease, a result that is already described in the literature. Furthermore, we verified a decrease of TRAIL gene expression in patients with gastric cancer, considering or not the presence of H. pylori. Interestingly, our results suggest that the expression of miR-106b-5p behaves differently in patients with gastritis and gastric cancer since we verified an increase of expression of miR-106b-5p in the Gastric Cancer group and a decrease of expression in the Gastritis group. An increase of expression of miR-106b-5p also found in patients with gastric cancer negative to H. pylori; on the other hand, an intense decrease of expression was found in patients with gastritis positive to H. pylori, suggesting the possible involvement of this bacterium in the control of miR-106b-5p expression.

Supplementary Materials

The following are available online at https://www.mdpi.com/2073-4425/11/4/393/s1, Figure S1: 2% agarose gel stained with ethidium bromide showing H. pylori PCR products (150bp) used to identify H. pylori in gastric biopsy samples from patients with gastrites. “Slots C+ and C-” Positive and Negative Controls, respectively. “Slot M” Ladder Marker 100 bp (Invitrogen). Water was used as negative control; as positive control, H. pylori DNA from culture was used. The band of approximately 1200bp is a non-specific band, not associated with H. pylori, Figure S2: agarose gel stained with ethidium bromide showing H. pylori PCR products (150bp) used to identify H. pylori in gastric biopsy samples from patients with gastric cancer. “Slots C+ and C-” Positive and Negative Controls, respectively. “Slot M” Ladder Marker 100 bp (Invitrogen). Water was used as negative control; as positive control, H. pylori DNA from culture was used. The band of approximately 1200bp is a non-specific band, not associated with H. pylori, Figure S3: 2% agarose gel stained with ethidium bromide showing H. pylori PCR products (150bp) used to identify H. pylori in gastric biopsy samples from patients with normal gastric tissue. “Slots C+ and C-” Positive and Negative Controls, respectively. “Slot M” Ladder Marker 100 bp (Invitrogen). Water was used as negative control; as positive control, H. pylori DNA from culture was used. The band of approximately 1200bp is a non-specific band, not associated with H. pylori, Figure S4: 2% agarose gel stained with ethidium bromide showing H. pylori PCR products (150bp) used to identify H. pylori in gastric biopsy samples from patients with normal gastric tissue (Slots 1-8) and gastrites (Slots 9-17). “Slots C+ and C-” Positive and Negative Controls, respectively. “Slot M” Ladder Marker 100 bp (Invitrogen). Water was used as negative control; as positive control, H. pylori DNA from culture was used. The band of approximately 1200bp is a non-specific band, not associated with H. pylori.

Author Contributions

Conceptualization, J.P. and L.R.; methodology, J.P. and L.R.; software, J.P. and L.R.; validation, L.R. and R.D.; formal analysis, J.P. and L.R.; investigation, J.P. and M.S. (Mônica Santos); resources, M.B., M.S. (Marília Smith) and S.P.; data curation, L.R.; writing—original draft preparation, J.P.; writing—review and editing, J.P. and L.R.; visualization, L.R.; supervision, L.R. and S.P.; project administration, L.R. and S.P.; funding acquisition, L.R. All authors have read and agreed to the published version of the manuscript.

Funding

This research was funded by Fundação de Amparo à Pesquisa do Estado de São Paulo (FAPESP) (Grant Nos. 2018/08481-1).

Conflicts of Interest

The authors declare no conflict of interest.

References

  1. Bozkurt, O.; Firat, S.T.; Dogan, E.; Cosar, R.; Inanc, M.; Ozkan, M. The prognostic value of the change in neutrophil-to-lymphocyte ratio during first-line palliative chemotherapy in patients with metastatic gastric cancer: A retrospective study. J. BUON 2019, 24, 1992–1999. [Google Scholar] [PubMed]
  2. Tai, Q.; Shao, H.; Liu, Y.; Li, E.; Zhao, R. A comparative analysis on clinical efficacy of FOLFOX6 regimen and DCF regimen as neoadjuvant chemotherapy combined with radical gastrectomy in treating advanced gastric cancer. J. BUON 2019, 24, 2006–2012. [Google Scholar] [PubMed]
  3. Huang, Y.; Zhang, J.; Hou, L.; Wang, G.; Liu, H.; Zhang, R.; Chen, X.; Zhu, J. LncRNA AK023391 promotes tumorigenesis and invasion of gastric cancer through activation of the PI3K/Akt signaling pathway. J. Exp. Clin. Cancer Res. 2017, 36, 194. [Google Scholar] [CrossRef] [PubMed]
  4. Xu, Y.H.; Li, Z.L.; Qiu, S.F. IFN-gamma Induces Gastric Cancer Cell Proliferation and Metastasis Through Upregulation of Integrin beta3-Mediated NF-kappaB Signaling. Transl. Oncol. 2018, 11, 182–192. [Google Scholar] [CrossRef] [PubMed]
  5. Hu, B.; El Hajj, N.; Sittler, S.; Lammert, N.; Barnes, R.; Meloni-Ehrig, A. Gastric cancer: Classification, histology and application of molecular pathology. J. Gastrointest. Oncol. 2012, 3, 251–261. [Google Scholar]
  6. Gall, A.; Gaudet, R.G.; Gray-Owen, S.D.; Salama, N.R. TIFA Signaling in Gastric Epithelial Cells Initiates the cag Type 4 Secretion System-Dependent Innate Immune Response to Helicobacter pylori Infection. MBio 2017, 8, e01168-17. [Google Scholar] [CrossRef] [PubMed] [Green Version]
  7. Gobert, A.P.; Verriere, T.; Asim, M.; Barry, D.P.; Piazuelo, M.B.; de Sablet, T.; Delgado, A.G.; Bravo, L.E.; Correa, P.; Peek, R.M., Jr.; et al. Heme oxygenase-1 dysregulates macrophage polarization and the immune response to Helicobacter pylori. J. Immunol. 2014, 193, 3013–3022. [Google Scholar] [CrossRef] [Green Version]
  8. Yang, Y.; Du, J.; Liu, F.; Wang, X.; Li, X.; Li, Y. Role of caspase-3/E-cadherin in helicobacter pylori-induced apoptosis of gastric epithelial cells. Oncotarget 2017, 8, 59204–59216. [Google Scholar] [CrossRef] [Green Version]
  9. Yang, Y.; Deng, C.S.; Peng, J.Z.; Wong, B.C.; Lam, S.K.; Xia, H.H. Effect of Helicobacter pylori on apoptosis and apoptosis related genes in gastric cancer cells. Mol. Pathol. 2003, 56, 19–24. [Google Scholar] [CrossRef] [Green Version]
  10. Yang, Y.; Huang, X.; Chen, S.; Ma, G.; Zhu, M.; Yan, F.; Yu, J. Resveratrol induced apoptosis in human gastric carcinoma SGC-7901 cells via activation of mitochondrial pathway. Asia Pac. J. Clin. Oncol. 2018, 14, e317–e324. [Google Scholar] [CrossRef]
  11. Jones, N.L.; Day, A.S.; Jennings, H.A.; Sherman, P.M. Helicobacter pylori induces gastric epithelial cell apoptosis in association with increased Fas receptor expression. Infect. Immun. 1999, 67, 4237–4242. [Google Scholar] [CrossRef] [PubMed] [Green Version]
  12. Grivicich, I.; Regner, A.; da Rocha, A.B. Morte celular por apoptose. Rev. Bras. Cancerol. 2007, 53, 335–343. [Google Scholar]
  13. Xu, L.; Zhang, Y.; Qu, X.; Che, X.; Guo, T.; Li, C.; Ma, R.; Fan, Y.; Ma, Y.; Hou, K.; et al. DR5-Cbl-b/c-Cbl-TRAF2 complex inhibits TRAIL-induced apoptosis by promoting TRAF2-mediated polyubiquitination of caspase-8 in gastric cancer cells. Mol. Oncol. 2017, 11, 1733–1751. [Google Scholar] [CrossRef] [PubMed] [Green Version]
  14. Wu, L.S.; Wang, X.W.; He, W.; Ma, X.T.; Wang, H.Y.; Han, M.; Li, B.H. TRAIL inhibits platelet-induced colorectal cancer cell invasion. J. Int. Med. Res. 2019, 47, 962–972. [Google Scholar] [CrossRef] [PubMed] [Green Version]
  15. Xu, L.; Qu, X.; Zhang, Y.; Hu, X.; Yang, X.; Hou, K.; Teng, Y.; Zhang, J.; Sada, K.; Liu, Y. Oxaliplatin enhances TRAIL-induced apoptosis in gastric cancer cells by CBL-regulated death receptor redistribution in lipid rafts. FEBS Lett. 2009, 583, 943–948. [Google Scholar] [CrossRef] [PubMed] [Green Version]
  16. Lim, S.C.; Han, S.I. MDL-12330A potentiates TRAIL-induced apoptosis in gastric cancer cells through CHOP-mediated DR5 upregulation. Korean J. Physiol. Pharmacol. 2017, 21, 397–405. [Google Scholar] [CrossRef] [Green Version]
  17. Fuentes, R.G.; Toume, K.; Arai, M.A.; Sadhu, S.K.; Ahmed, F.; Ishibashi, M. Scopadulciol, Isolated from Scoparia dulcis, Induces beta-Catenin Degradation and Overcomes Tumor Necrosis Factor-Related Apoptosis Ligand Resistance in AGS Human Gastric Adenocarcinoma Cells. J. Nat. Prod. 2015, 78, 864–872. [Google Scholar] [CrossRef]
  18. Xu, L.; Qu, X.; Luo, Y.; Zhang, Y.; Liu, J.; Qu, J.; Zhang, L.; Liu, Y. Epirubicin enhances TRAIL-induced apoptosis in gastric cancer cells by promoting death receptor clustering in lipid rafts. Mol. Med. Rep. 2011, 4, 407–411. [Google Scholar] [CrossRef]
  19. Macfarlane, L.A.; Murphy, P.R. MicroRNA: Biogenesis, Function and Role in Cancer. Curr. Genom. 2010, 11, 537–561. [Google Scholar] [CrossRef] [Green Version]
  20. Fan, L.; Zhu, C.; Qiu, R.; Zan, P.; Zheng, Z.; Xu, T.; Li, G. MicroRNA-661 Enhances TRAIL or STS Induced Osteosarcoma Cell Apoptosis by Modulating the Expression of Cytochrome c1. Cell. Physiol. Biochem. 2017, 41, 1935–1946. [Google Scholar] [CrossRef] [Green Version]
  21. Huang, G.; Chen, X.; Cai, Y.; Wang, X.; Xing, C. miR-20a-directed regulation of BID is associated with the TRAIL sensitivity in colorectal cancer. Oncol. Rep. 2017, 37, 571–578. [Google Scholar] [CrossRef] [PubMed]
  22. Yu, L.X.; Zhang, B.L.; Yang, M.Y.; Liu, H.; Xiao, C.H.; Zhang, S.G.; Liu, R. MicroRNA-106b-5p promotes hepatocellular carcinoma development via modulating FOG2. OncoTargets Ther. 2019, 12, 5639–5647. [Google Scholar] [CrossRef] [Green Version]
  23. Xu, K.; Xiong, W.; Zhao, S.; Wang, B. MicroRNA-106b serves as a prognostic biomarker and is associated with cell proliferation, migration, and invasion in osteosarcoma. Oncol. Lett. 2019, 18, 3342–3348. [Google Scholar] [CrossRef] [PubMed] [Green Version]
  24. Li, N.; Miao, Y.; Shan, Y.; Liu, B.; Li, Y.; Zhao, L.; Jia, L. MiR-106b and miR-93 regulate cell progression by suppression of PTEN via PI3K/Akt pathway in breast cancer. Cell Death Dis. 2017, 8, e2796. [Google Scholar] [CrossRef]
  25. Wang, M.; Yang, Y.O.; Jin, Q.; Shang, L.; Zhang, J. Function of miR-25 in the invasion and metastasis of esophageal squamous carcinoma cells and bioinformatical analysis of the miR-106b-25 cluster. Exp. Ther. Med. 2018, 15, 440–446. [Google Scholar] [CrossRef] [PubMed] [Green Version]
  26. Stolte, M.; Meining, A. The updated Sydney system: Classification and grading of gastritis as the basis of diagnosis and treatment. Can. J. Gastroenterol. 2001, 15, 591–598. [Google Scholar] [CrossRef] [PubMed] [Green Version]
  27. Pereira, J.; Orcini, W.; Peruquetti, R.; Cardoso Smith, M.; Payão, S.; Rasmussen, L. Prevalence of Helicobacter pylori cag A and sab A Genotypes in Patients with Gastric Disease. Adv. Microbiol. 2019, 9, 239–247. [Google Scholar] [CrossRef] [Green Version]
  28. Livak, K.J.; Schmittgen, T.D. Analysis of relative gene expression data using real-time quantitative PCR and the 2(-Delta Delta C(T)) Method. Methods 2001, 25, 402–408. [Google Scholar] [CrossRef]
  29. Warren, J.R.; Marshall, B. Unidentified curved bacilli on gastric epithelium in active chronic gastritis. Lancet 1983, 1, 1273–1275. [Google Scholar]
  30. Schulz, C.; Schutte, K.; Mayerle, J.; Malfertheiner, P. The role of the gastric bacterial microbiome in gastric cancer: Helicobacter pylori and beyond. Therap. Adv. Gastroenterol. 2019, 12, 1756284819894062. [Google Scholar] [CrossRef] [Green Version]
  31. Camilo, V.; Sugiyama, T.; Touati, E. Pathogenesis of Helicobacter pylori infection. Helicobacter 2017, 22, e12405. [Google Scholar] [CrossRef] [PubMed]
  32. Venerito, M.; Vasapolli, R.; Rokkas, T.; Delchier, J.C.; Malfertheiner, P. Helicobacter pylori, gastric cancer and other gastrointestinal malignancies. Helicobacter 2017, 22, e12413. [Google Scholar] [CrossRef] [PubMed]
  33. Kivrak Salim, D.; Sahin, M.; Koksoy, S.; Adanir, H.; Suleymanlar, I. Local Immune Response in Helicobacter pylori Infection. Medicine 2016, 95, e3713. [Google Scholar] [CrossRef] [PubMed]
  34. Suerbaum, S.; Michetti, P. Helicobacter pylori infection. N. Engl. J. Med. 2002, 347, 1175–1186. [Google Scholar] [CrossRef] [Green Version]
  35. Zhang, B.; Liu, B.; Chen, D.; Setroikromo, R.; Haisma, H.J.; Quax, W.J. Histone Deacetylase Inhibitors Sensitize TRAIL-Induced Apoptosis in Colon Cancer Cells. Cancers 2019, 11, 645. [Google Scholar] [CrossRef] [PubMed] [Green Version]
  36. Jo, E.B.; Lee, Y.S.; Lee, H.; Park, J.B.; Park, H.; Choi, Y.L.; Hong, D.; Kim, S.J. Combination therapy with c-met inhibitor and TRAIL enhances apoptosis in dedifferentiated liposarcoma patient-derived cells. BMC Cancer 2019, 19, 496. [Google Scholar] [CrossRef] [PubMed] [Green Version]
  37. Ma, W.; Cui, Y.; Liu, M.; Tan, Z.; Jiang, Y. Downregulation of miR-125b promotes resistance of glioma cells to TRAIL through overexpression of Tafazzin which is a mitochondrial protein. Aging 2019, 11, 2670–2680. [Google Scholar] [CrossRef]
  38. Xu, Y.; Gao, C.C.; Pan, Z.G.; Zhou, C.W. Irigenin sensitizes TRAIL-induced apoptosis via enhancing pro-apoptotic molecules in gastric cancer cells. Biochem. Biophys. Res. Commun. 2018, 496, 998–1005. [Google Scholar] [CrossRef]
  39. Thorburn, A. Tumor necrosis factor-related apoptosis-inducing ligand (TRAIL) pathway signaling. J. Thorac. Oncol. 2007, 2, 461–465. [Google Scholar] [CrossRef] [Green Version]
  40. Rasheduzzaman, M.; Moon, J.H.; Lee, J.H.; Nazim, U.M.; Park, S.Y. Telmisartan generates ROS-dependent upregulation of death receptor 5 to sensitize TRAIL in lung cancer via inhibition of autophagy flux. Int. J. Biochem. Cell Biol. 2018, 102, 20–30. [Google Scholar] [CrossRef]
  41. Fan, Y.; Sheng, W.; Meng, Y.; Cao, Y.; Li, R. LncRNA PTENP1 inhibits cervical cancer progression by suppressing miR-106b. Artif. Cells Nanomed. Biotechnol. 2020, 48, 393–407. [Google Scholar] [CrossRef] [PubMed]
  42. Fodde, R. The APC gene in colorectal cancer. Eur. J. Cancer 2002, 38, 867–871. [Google Scholar] [CrossRef]
  43. Fujimoto, T.; Tomizawa, M.; Yokosuka, O. SiRNA of frizzled-9 suppresses proliferation and motility of hepatoma cells. Int. J. Oncol. 2009, 35, 861–866. [Google Scholar] [CrossRef] [PubMed] [Green Version]
  44. Liu, N.; Qi, D.; Jiang, J.; Zhang, J.; Yu, C. Expression pattern of p-Smad2/Smad4 as a predictor of survival in invasive breast ductal carcinoma. Oncol. Lett. 2020, 19, 1789–1798. [Google Scholar] [CrossRef] [Green Version]
  45. Manicum, T.; Ni, F.; Ye, Y.; Fan, X.; Chen, B.C. Prognostic values of E2F mRNA expression in human gastric cancer. Biosci. Rep. 2018, 38, BSR20181264. [Google Scholar] [CrossRef] [Green Version]
  46. Marcolino, T.F.; Pimenta, C.A.M.; Artigiani Neto, R.; Castelo, P.; Silva, M.S.; Forones, N.M.; Oshima, C.T.F. p53, Cyclin-D1, beta-catenin, APC and c-myc in Tumor Tissue from Colorectal and Gastric Cancer Patients with Suspected Lynch Syndrome by the Bethesda Criteria. Asian Pac. J. Cancer Prev. 2020, 21, 343–348. [Google Scholar] [CrossRef]
  47. Min, K.W.; Kim, D.H.; Do, S.I.; Chae, S.W.; Kim, K.; Sohn, J.H.; Lee, H.J.; Do, I.G.; Pyo, J.S.; Kim, Y.; et al. Expression Pattern of Smad4/GATA3 as a Predictor of Survival in Invasive Ductal Carcinoma of the Breast. Pathobiology 2017, 84, 130–138. [Google Scholar] [CrossRef]
  48. Qu, Y.; Zhang, H.; Duan, J.; Liu, R.; Deng, T.; Bai, M.; Huang, D.; Li, H.; Ning, T.; Zhang, L.; et al. MiR-17-5p regulates cell proliferation and migration by targeting transforming growth factor-beta receptor 2 in gastric cancer. Oncotarget 2016, 7, 33286–33296. [Google Scholar] [CrossRef] [Green Version]
  49. Sun, D.; Chen, L.; Lv, H.; Gao, Y.; Liu, X.; Zhang, X. Circ_0058124 Upregulates MAPK1 Expression to Promote Proliferation, Metastasis and Metabolic Abilities in Thyroid Cancer Through Sponging miR-940. OncoTargets Ther. 2020, 13, 1569–1581. [Google Scholar] [CrossRef] [Green Version]
  50. Yin, W.; Chen, J.; Wang, G.; Zhang, D. MicroRNA106b functions as an oncogene and regulates tumor viability and metastasis by targeting LARP4B in prostate cancer. Mol. Med. Rep. 2019, 20, 951–958. [Google Scholar] [CrossRef] [Green Version]
  51. Li, Y.; Tian, J.; Guo, Z.J.; Zhang, Z.B.; Xiao, C.Y.; Wang, X.C. Expression of microRNAs-106b in nonsmall cell lung cancer. J. Cancer Res. Ther. 2018, 14, S295–S298. [Google Scholar] [CrossRef] [PubMed]
  52. Xu, C.; Shi, L.; Chen, W.; Fang, P.; Li, J.; Jin, L.; Pan, Z.; Pan, C. MiR-106b inhibitors sensitize TRAIL-induced apoptosis in hepatocellular carcinoma through increase of death receptor 4. Oncotarget 2017, 8, 41921–41931. [Google Scholar] [CrossRef] [PubMed] [Green Version]
  53. Ye, F.; Tang, C.; Shi, W.; Qian, J.; Xiao, S.; Gu, M.; Dang, Y.; Liu, J.; Chen, Y.; Shi, R.; et al. A MDM2-dependent positive-feedback loop is involved in inhibition of miR-375 and miR-106b induced by Helicobacter pylori lipopolysaccharide. Int. J. Cancer 2015, 136, 2120–2131. [Google Scholar] [CrossRef] [PubMed]
  54. Carrasco, G.; Corvalan, A.H. Helicobacter pylori-Induced Chronic Gastritis and Assessing Risks for Gastric Cancer. Gastroenterol. Res. Pract. 2013, 2013, 393015. [Google Scholar] [CrossRef] [Green Version]
  55. Li, M.; Zhou, Q.; Yang, K.; Brigstock, D.R.; Zhang, L.; Xiu, M.; Sun, L.; Gao, R.P. Rare case of Helicobacter pylori-positive multiorgan IgG4-related disease and gastric cancer. World J. Gastroenterol. 2015, 21, 3429–3434. [Google Scholar] [CrossRef]
  56. Targosz, A.; Brzozowski, T.; Pierzchalski, P.; Szczyrk, U.; Ptak-Belowska, A.; Konturek, S.J.; Pawlik, W. Helicobacter pylori promotes apoptosis, activates cyclooxygenase (COX)-2 and inhibits heat shock protein HSP70 in gastric cancer epithelial cells. Inflamm. Res. 2012, 61, 955–966. [Google Scholar] [CrossRef] [Green Version]
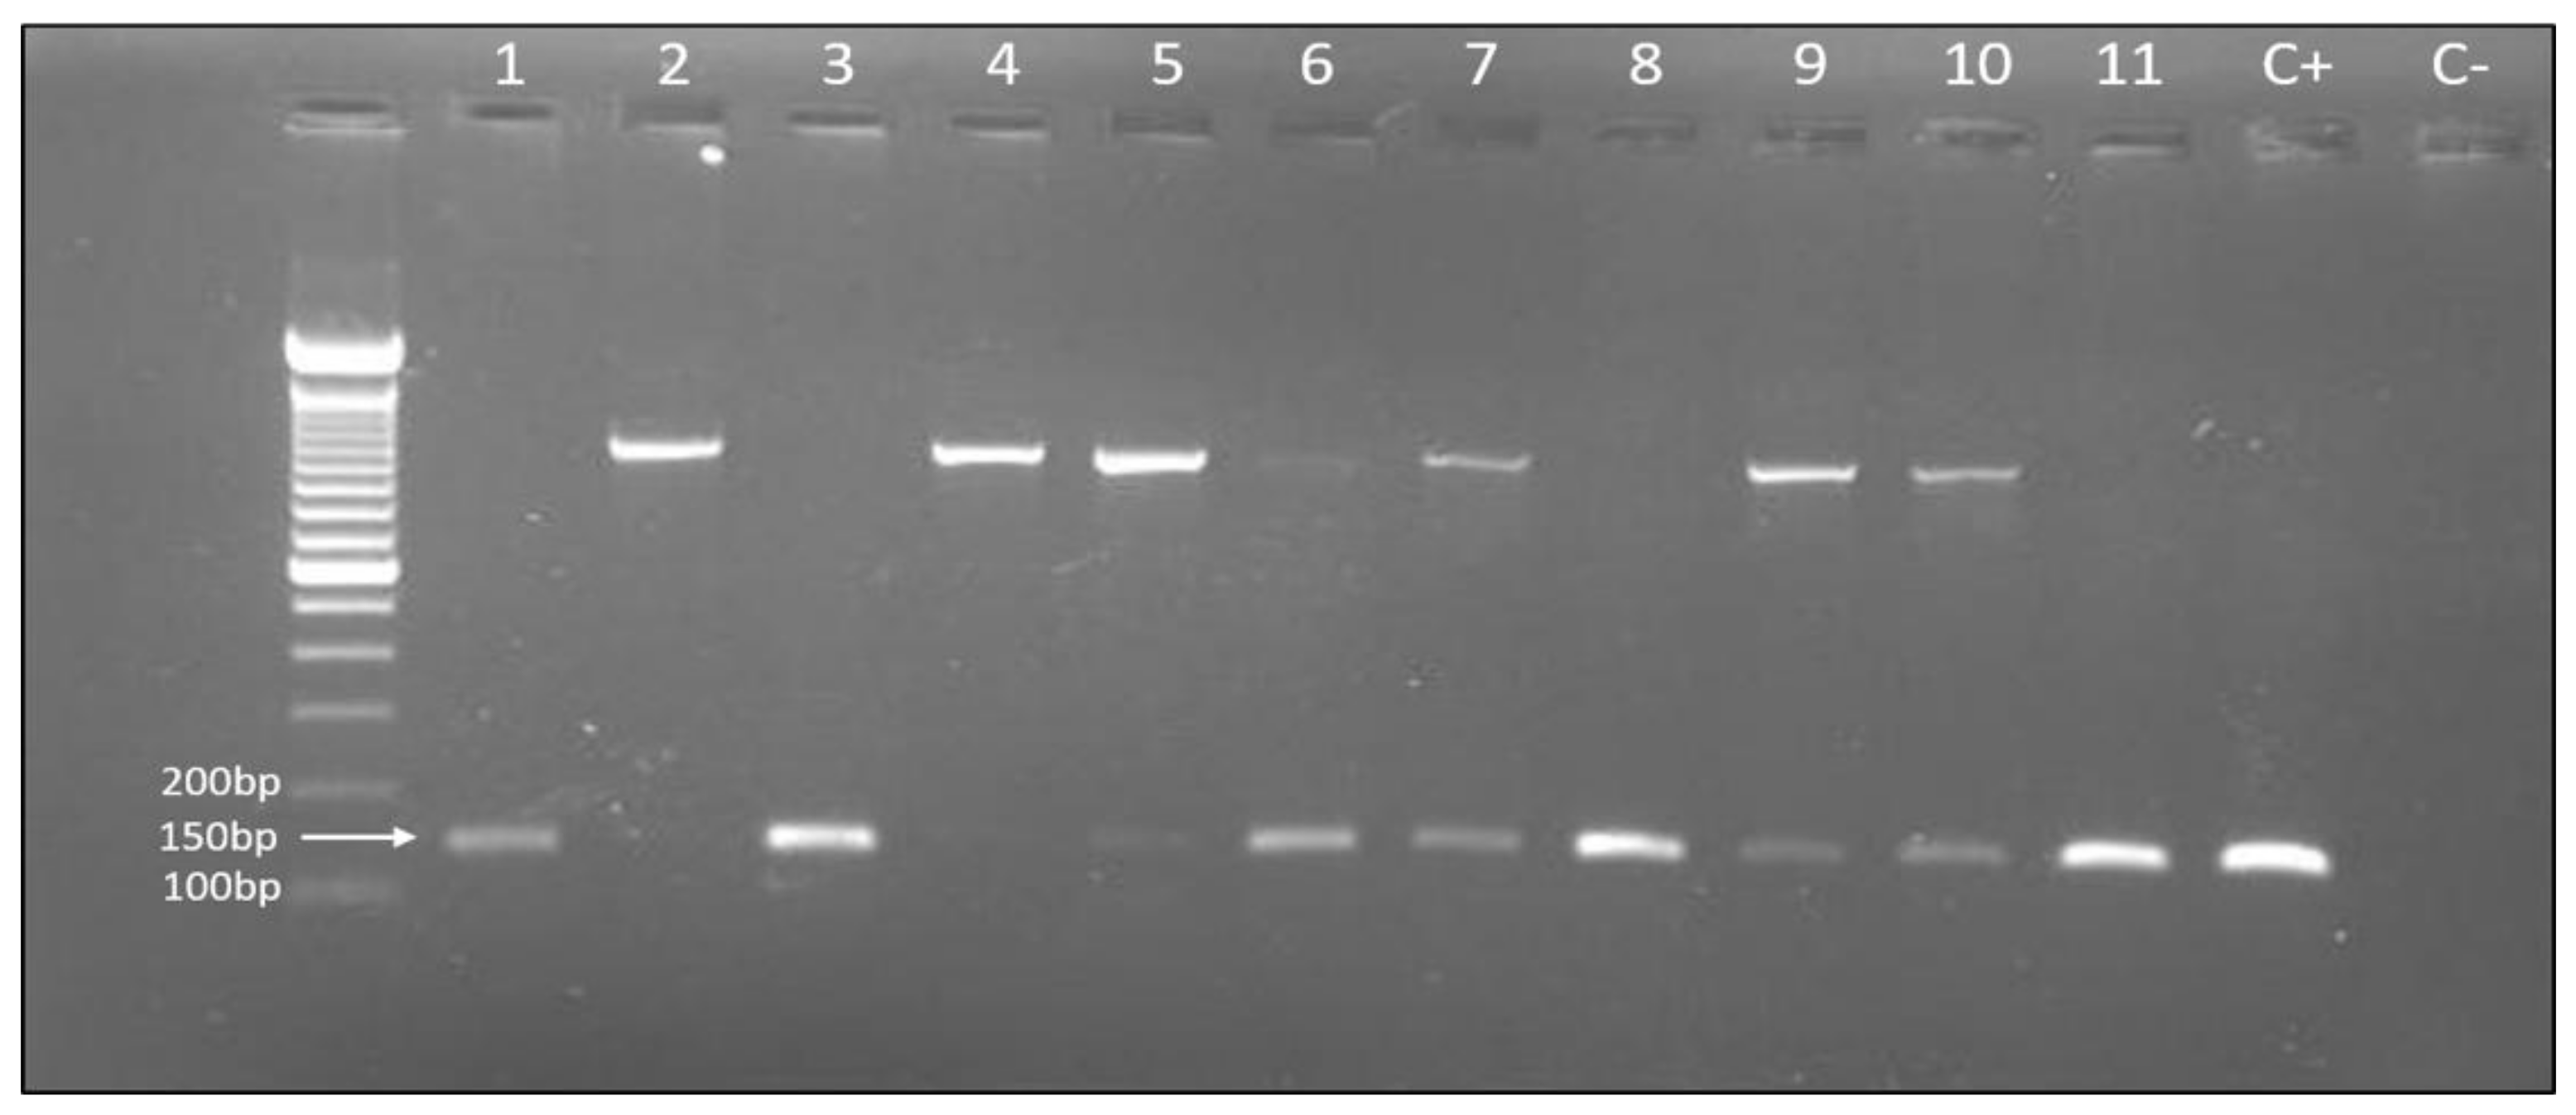
Figure 1. Two percent agarose gel stained with ethidium bromide showing H. pylori PCR products (150 bp) used to identify H. pylori in gastric biopsy samples from patients with normal gastric mucosa (1 to 3), gastritis (4 to 7), and gastric cancer (8 to 11). Water was used as negative control; as positive control, H. pylori DNA from culture was used. The band of approximately 1200 bp is a non-specific band, not associated with H. pylori.
Genes 11 00393 g001
Figure 2. Analysis of TNF-related apoptosis-inducing ligand (TRAIL) gene expression in Control, Gastritis, and Cancer groups, considering patients that were positive and negative for H. pylori infection in all groups. * statistically significant.
Genes 11 00393 g002
Figure 3. Analysis of TRAIL gene expression for the presence of H. pylori in Control, Gastritis, and Cancer groups. Legend: Neg.: Negative; Pos.: Positive. *statistically significant.
Genes 11 00393 g003
Figure 4. Analysis of miR-106b-5p gene expression not considering the presence of H. pylori in Control, Gastritis, and Cancer groups as well as analysis of miR-106b-5p gene expression with the presence of H. pylori. Legend: Neg.: Negative; Pos.: Positive. * statistically significant and p-values showed in Table 3.
Genes 11 00393 g004
Figure 5. Cytoscape analysis considering TRAIL and miR-106b-5p in the apoptosis pathway. (A) Validated miRNAs that interact with the TRAIL (TNFSF10) gene. (B) Predicted miRNAs that have TRAIL (TNFSF10) as target gene. (C) Validated genes controlled by miR-106b-5p. (D) Predicted genes controlled by miR-106b-5p.
Genes 11 00393 g005
Figure 6. The Volcano plots (GSE33651 and GSE103236) showed the differentially expressed genes (DEGs) between gastric cancer samples and normal samples.
Genes 11 00393 g006
Figure 7. Venn diagrams representing the overlaps between GSE33651 and GSE103236 datasets. (A) Venn diagrams illustrating the overlap of downregulated genes. (B) Venn diagrams illustrating the overlap of upregulated genes.
Genes 11 00393 g007
Table 1. Patient and group information.
GroupsControlGastritisCancerPatients Ethnic Origins (%)
Male (%)22 (36.7)53 (40.16)30 (57.7)European (95%)
Female (%)38 (63.3)79 (59.84)22 (42.3)Japanese (2.5%)
Total (%)60 (100)132 (100)52 (100)African (2.5%)
Mean Age ± SD55 ± 15.654 ± 1653 ± 10
Table 2. H. pylori detected in the Control, Gastritis, and Cancer groups.
Control (%)Gastritis (%)Cancer (%)Total (%)
H. pylori +11 (18.3)54 (40.9)38 (73.1)103 (42.2)
H. pylori −49 (81.7)78 (59.1)14 (26.9)141 (57.8)
OR (95% CI) 3.08 (1.45–6.64)12.09 (4.73–28.7)
p0.0028 *<0.0001 *
Total60 (100)132 (100)52 (100)244 (100)
* statistically significant.
Table 3. RQ mean for the groups considered in miR-106b-5p mRNA expression and p-value results for comparison between the groups.
Group (RQ Mean)Compared Groupsp-Value
Control (0.9950)Control vs. Gastritis0.0305 *A
Gastritis (0.9200)Control vs. Cancer0.0307 *B
Cancer (1.080)Gastritis vs. Cancer0.0004 *C
Control Neg. (0.9900)Control Neg. vs. Control Pos.0.4559
Control Pos. (0.9900)Gastritis Neg. vs. Gastritis Pos.<0.0001 *D
Gastritis Neg. (1.020)Cancer Neg. vs. Cancer Pos.0.0192 *E
Gastritis Pos. (0.7800)Control Neg. vs. Gastritis Neg.0.4068
Cancer Neg. (1.350)Control Neg. vs. Gastritis Pos.<0.0001 *F
Cancer Pos. (1.000)Control Neg. vs. Cancer Neg.0.0001 *G
Control Neg. vs. Cancer Pos.0.5370
* statistically significant. The p-values (*A–*G) refer to p-values of Figure 4.
Table 4. Screening DEGs in gastric cancer.
DEGsGenes
UpregulatedMT1E, C1orf132, SST, GPX3, MAL, ATP4B, RNASE1, SCUBE2, C16orf89, CHGA
DownregulatedIVNS1ABP, THY1, SMARCA4, HAVCR2, INHBA, GTPBP4, TMEM158, MFSD12, COL18A1, PLA2G7, SSR2, COL1A1, CTHRC1, SERPINH1, IFI30, OLFML2B, SOD2, SPARC, FAM20C, MFSD13A, MYO1B, C1orf112, AGPAT4, KIF26B, S100A10, SULF1, UCK2, CENPF, LOX, PMEPA1, NCR3LG1, CTSA, ANGPT2, CENPN, SPON2, NUF2, APOC1, PGM2L1, FAP, COL12A1, KIF18B, ARHGAP39, CKS1B, IGF2BP3, FRP4, MMP3, LRP8, CLDN4, SLC4A11, LINC01296, EPHB2