Genes and Eating Preferences, Their Roles in Personalized Nutrition


Abstract
1. Introduction
- 1)
- Searching for the scientific data about the genes, in which oligonucleotide polymorphisms affect metabolites absorption and overall well-being.
- 2)
- Searching for the information on the achievements in nutrigenetics contributing to the development of personalized diets.
2. Genes Responsible for Eating Preferences
2.1. Genes Responsible for the Digestion and Absorption of Carbohydrates and Fats
2.2. Genes Associated with Food Intolerances
2.3. Genes Responsible for the Metabolism of Vitamins
2.4. Genes Responsible for Taste Sensations
2.5. Genes Responsible for the Metabolism of Xenobiotics
2.6. Genes Responsible for Eating Preferences
2.7. Genes Responsible for Food Addiction
Achievements of Nutrigenetics for Personalized Diet Development
- Information architecture, i.e., protected databases, where the information about human genes and other personal data are collected.
- Service technology, a website or mobile app, where the questionnaires are placed; a program that analyzes all the data and gives general recommendations.
- Production technology (biologically active additives, functional products [131], new flavors, etc.).
- If the causes of overweight are associated with the polymorphism in TCF7L2 and FABP2 genes, then a 6-month diet with the limitation of saturated fats and prevention of type 2 diabetes is prescribed.
- If the causes of overweight are associated with the polymorphism in TCF7L2 and PPARG genes, then a 6-month diet preventive of type 2 diabetes with hunger days is prescribed.
- If the causes of overweight are associated with the polymorphism in TCF7L2 FABP2 and PPARG genes, then a 6-month low-fat diet with hunger days and preventive of type 2 diabetes is prescribed.
- If the causes of overweight are associated with the polymorphism in CF7L2 and ADRB2 genes, then a 6-month low-carbohydrate diet preventive of type 2 diabetes is prescribed.
- If the causes of overweight are associated with the polymorphism in TCF7L2 ADRB2 and PPARG genes, then a 6-month low-carbohydrate diet with hunger days and preventive of type 2 diabetes is prescribed. The list can be continued.
3. Conclusions
3.1. Genes Responsible for Eating Preferences
- obesity (ADRB2, FABP2, PPARG, ADRB3, LEPR, FTO, MC4R);
- type 2 diabetes (ADRB2, TCF7L2, FABP2, PPARG, CETP, GLUT2, CD36);
- cardiovascular diseases (CETP, ApoA5, ApoE, ADD1, CYP11B2, MnSOD);
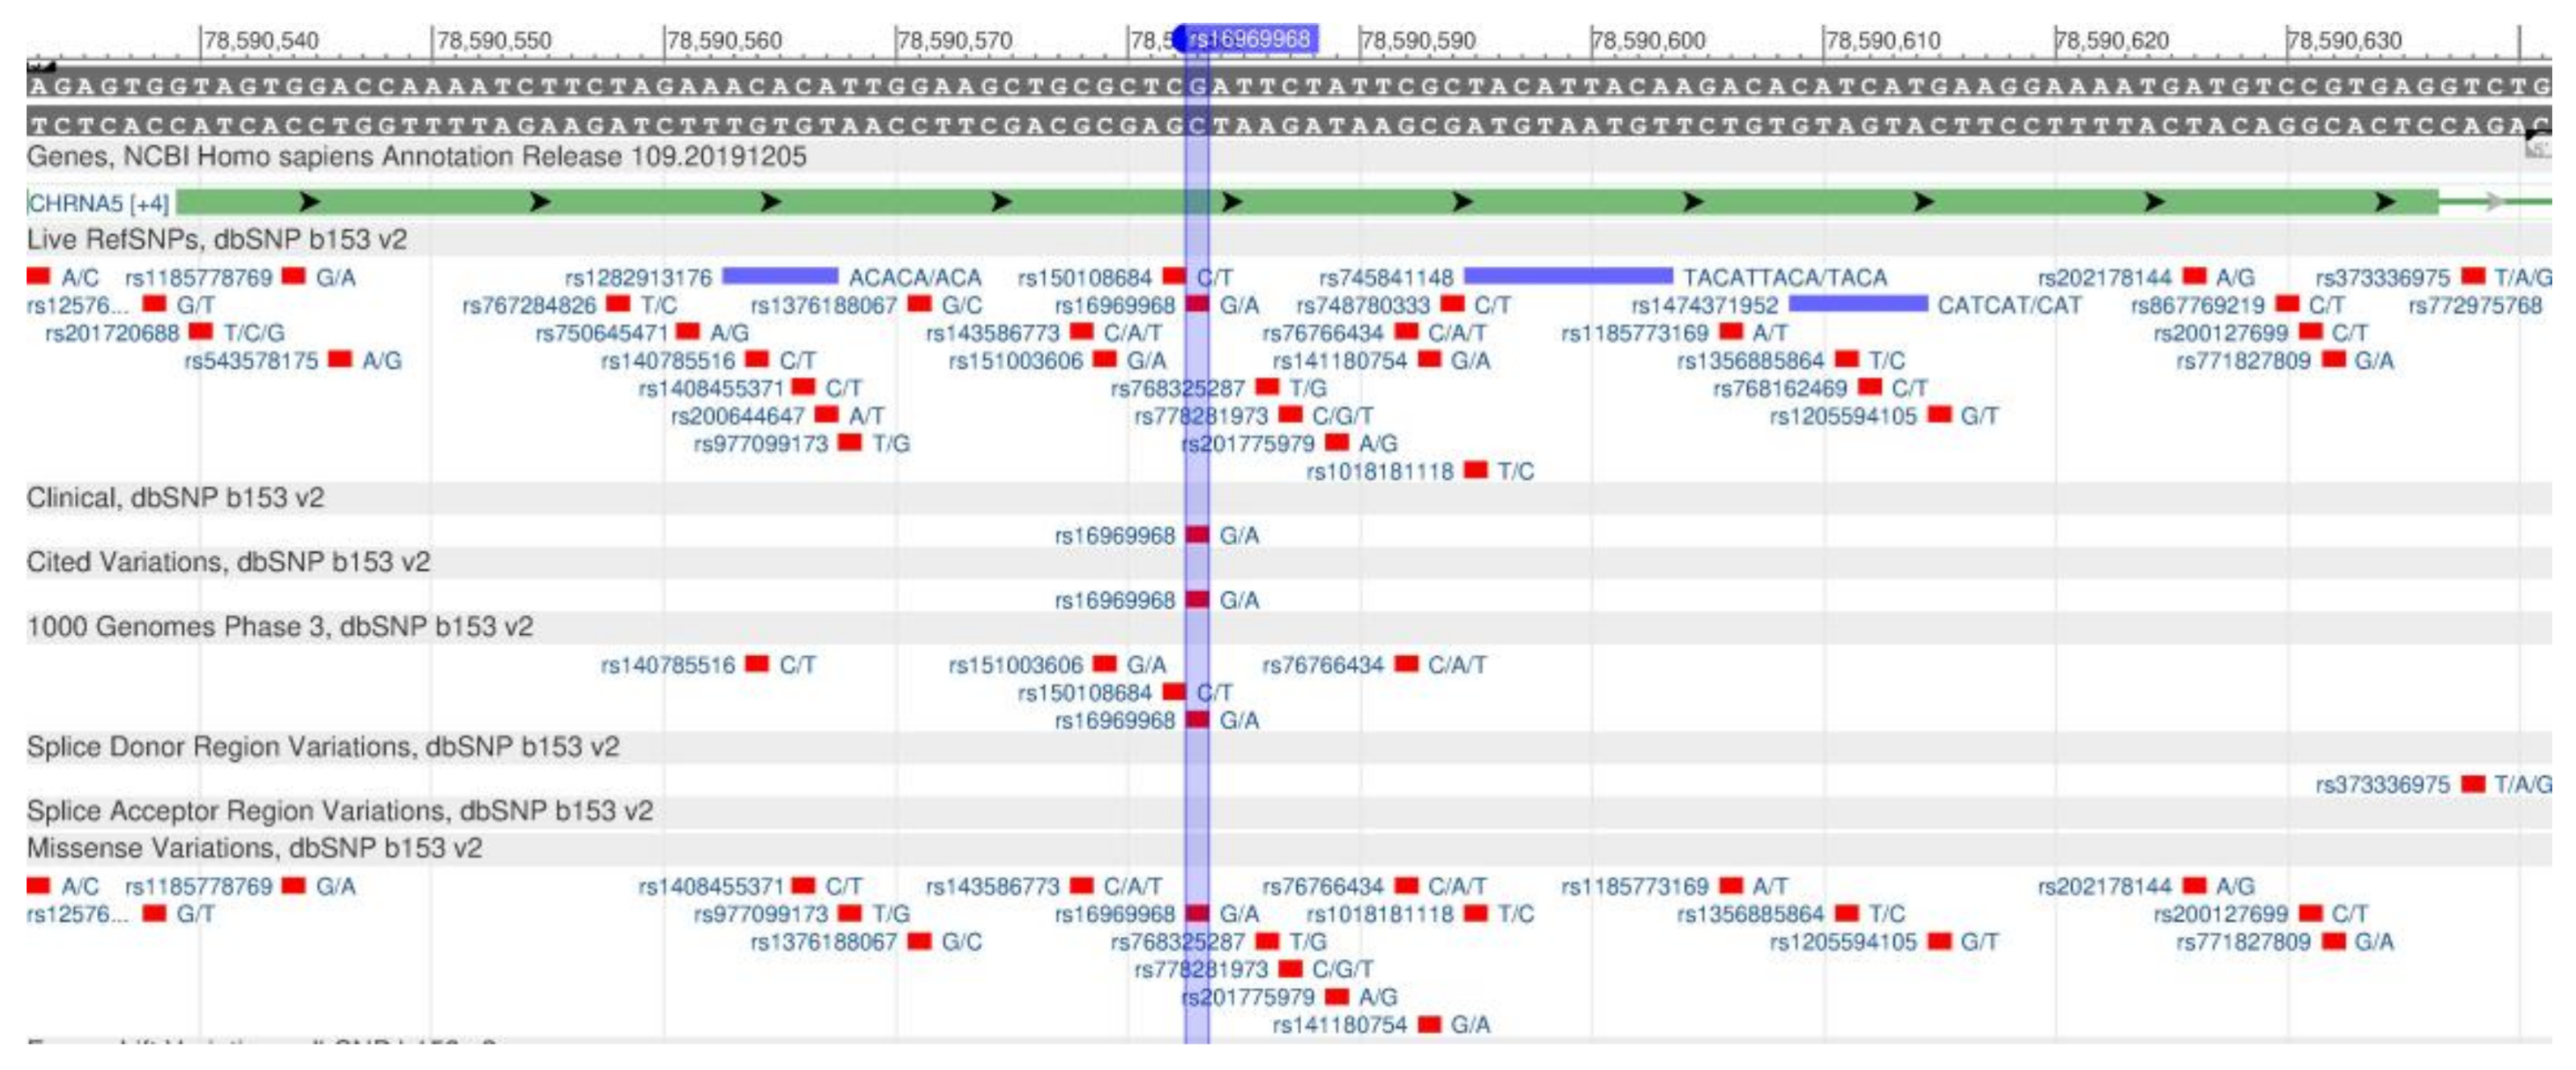
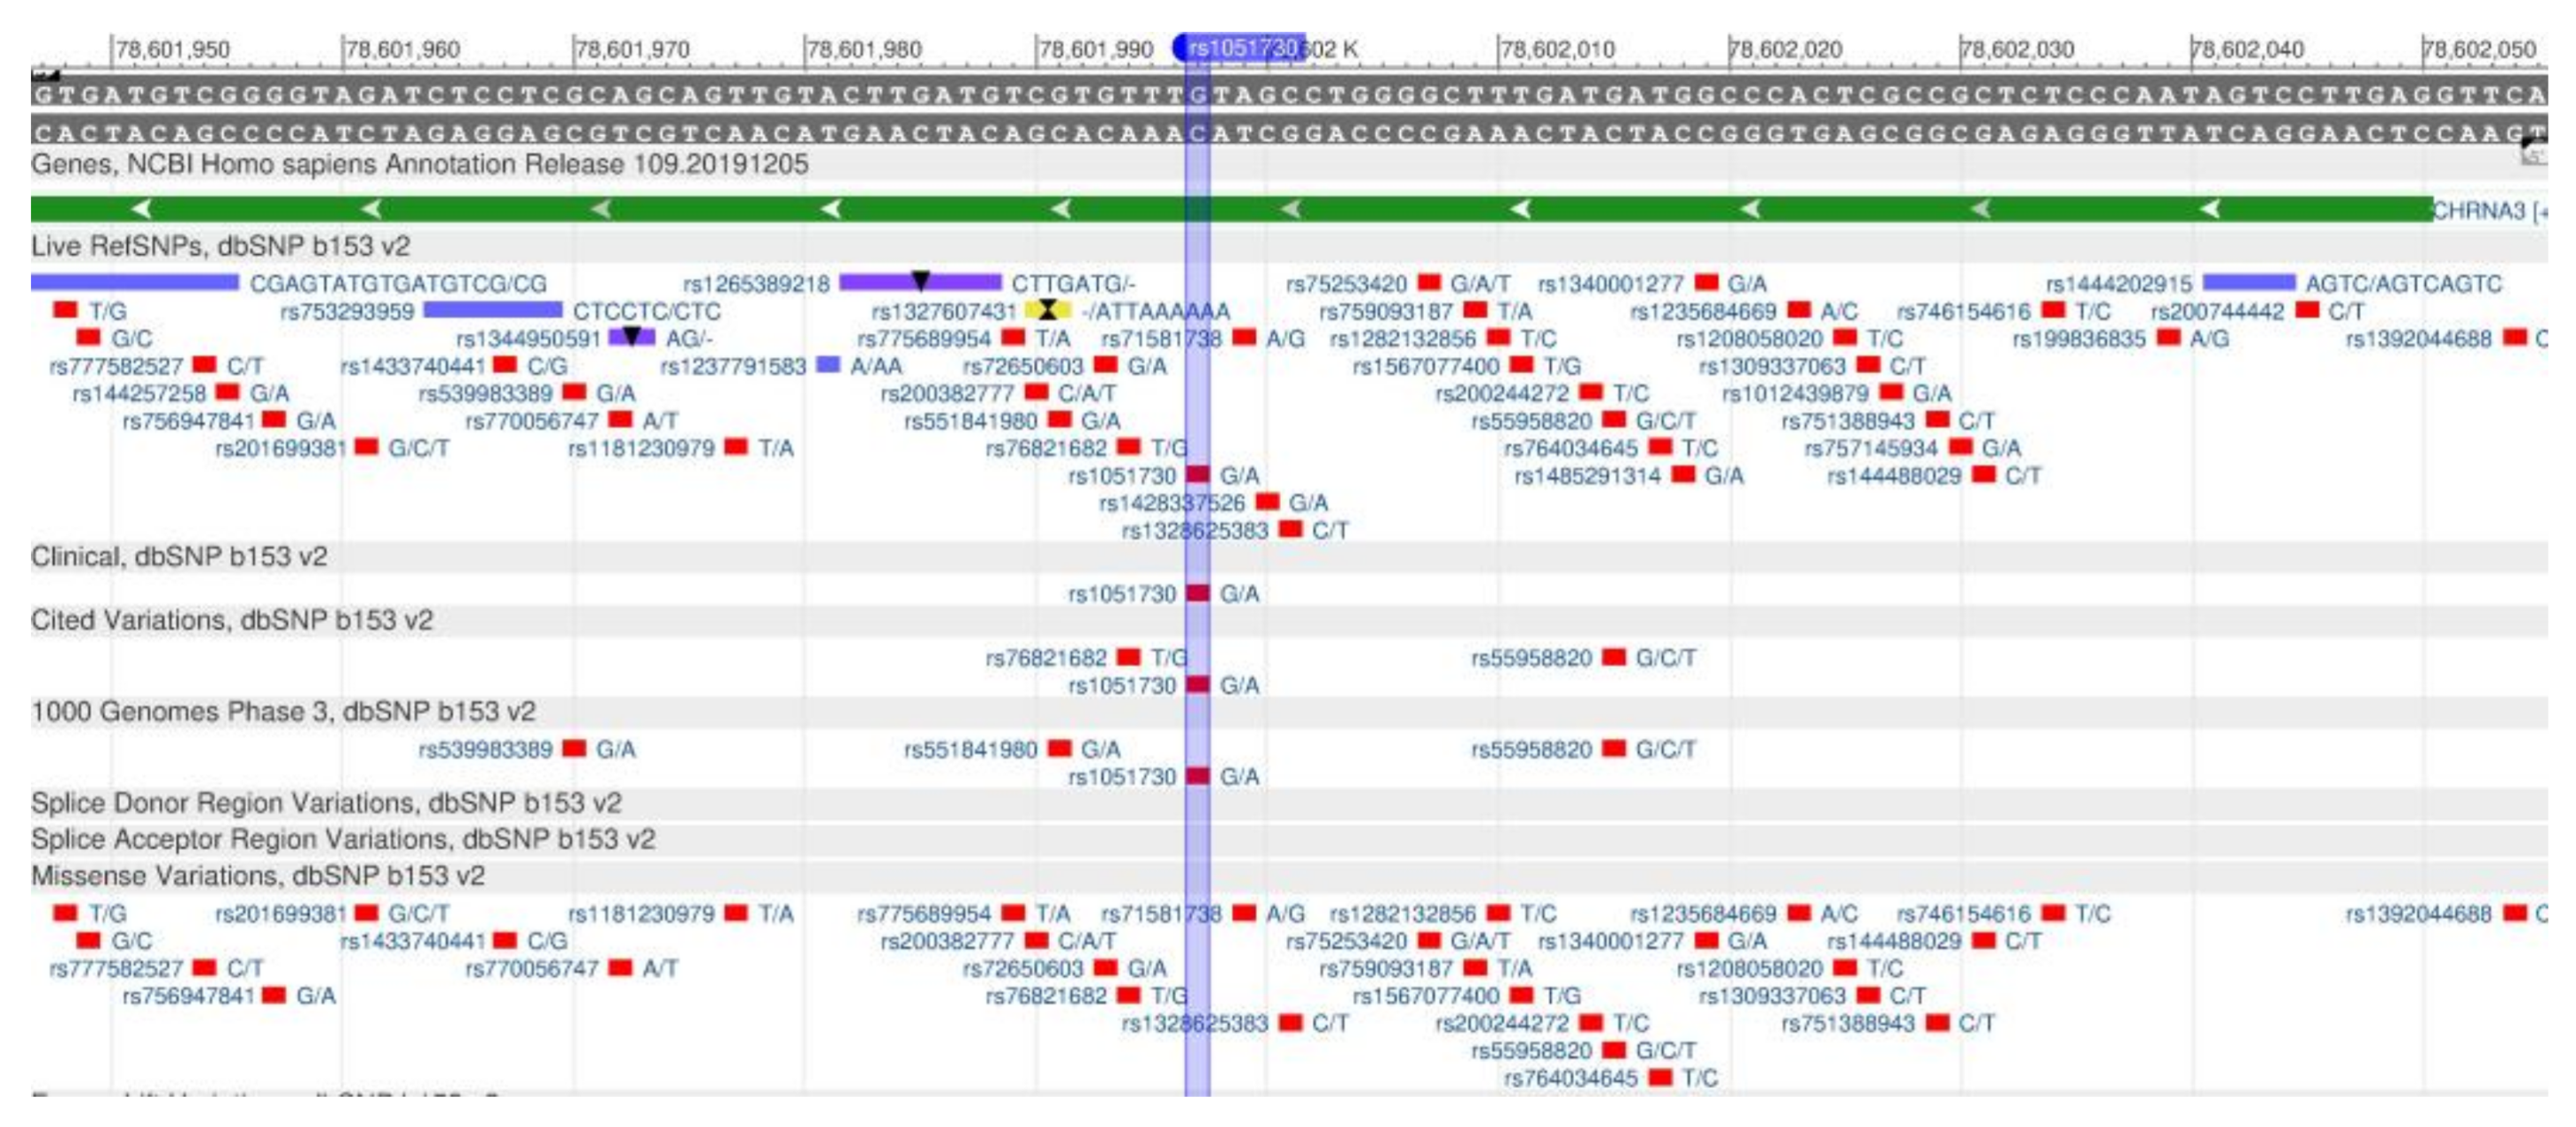
- cancer (MnSOD, GSTP1, CYP1A2, CHRNA5, CHRNA3);
- metabolic syndrome (ADRB2, TAS2R38, CD36).
- 1)
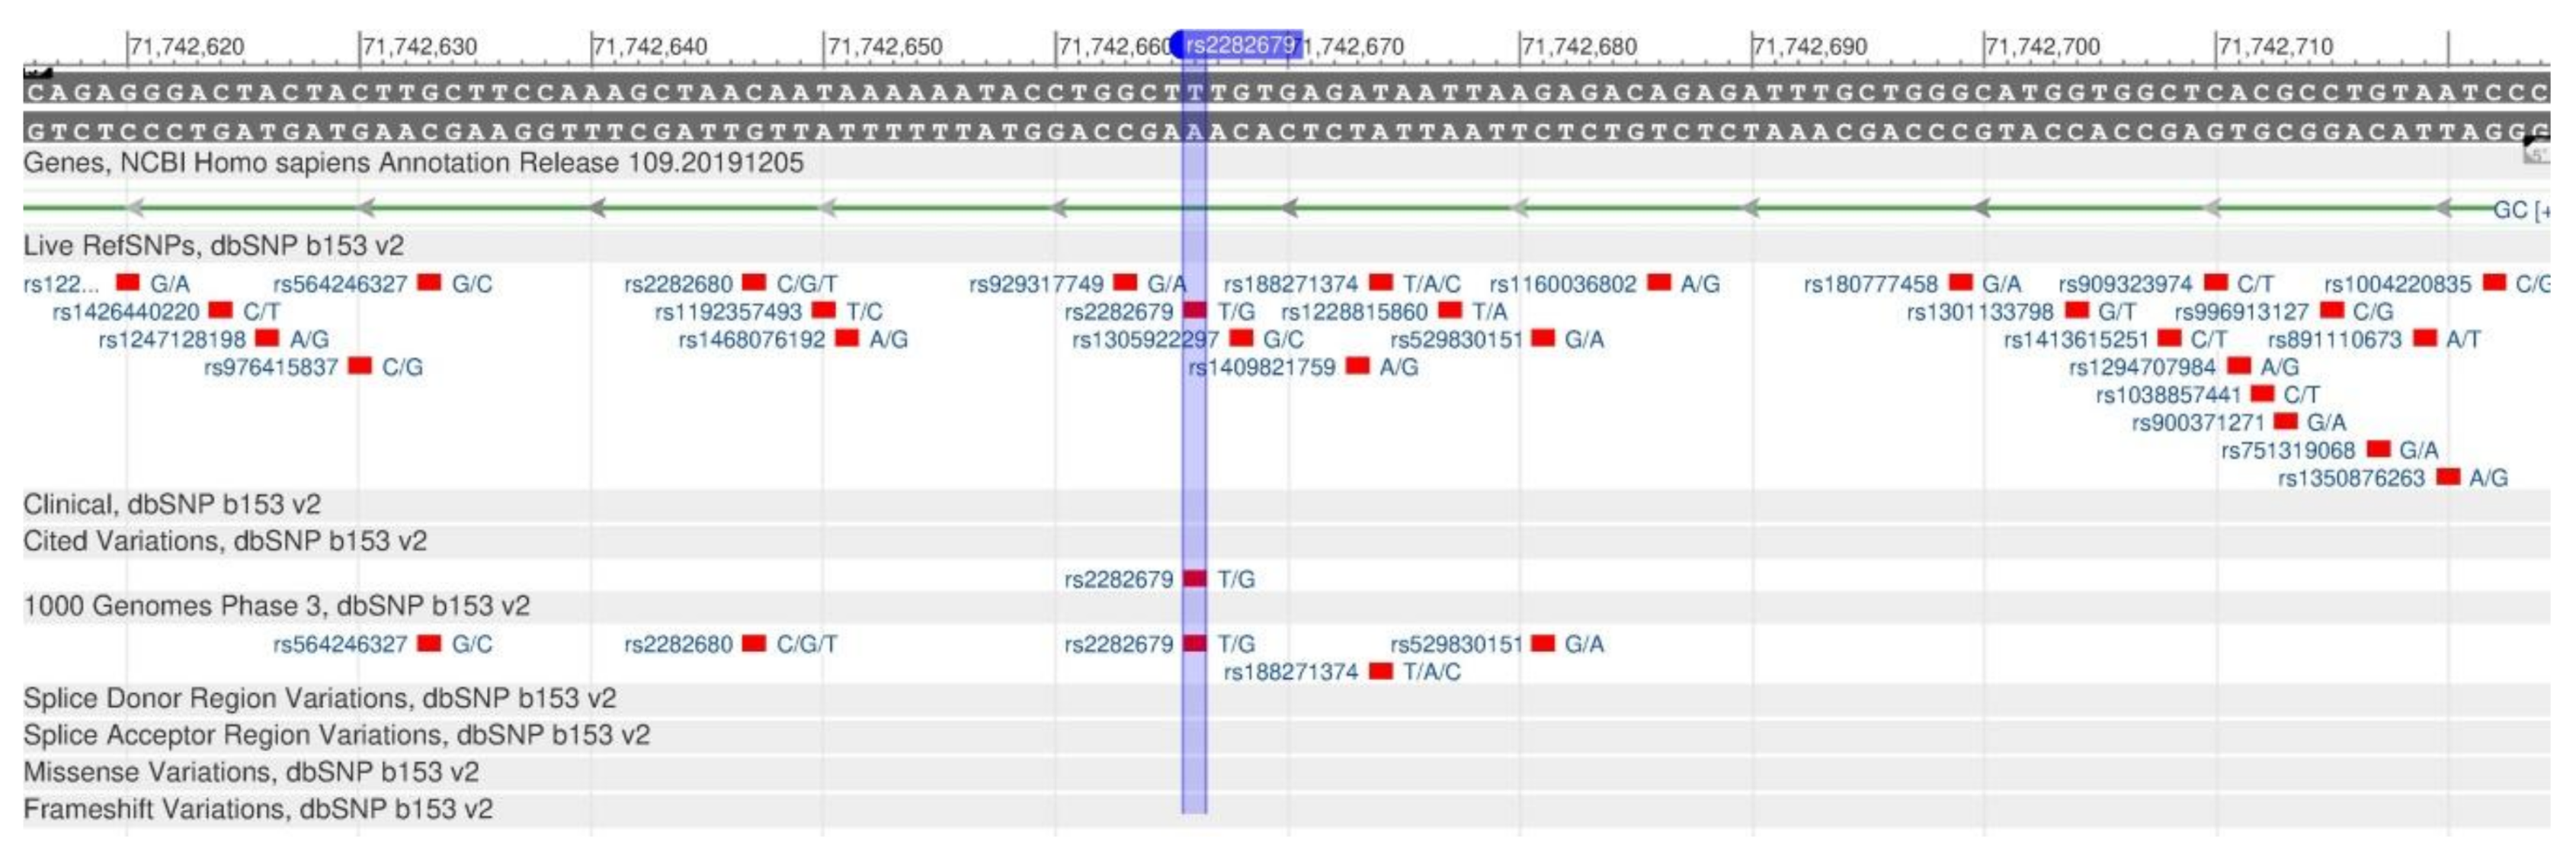
- For the African (AFR) population, it is not advisable to consider the following list of genes having a frequency of recessive allele occurrence less than 20%: ADRB2 (rs1042714), PPARG (rs1801282), ADRB3 (rs4994), ApoA5 (rs662799, rs3135506), ApoE (rs7412), MCM6 (rs4988235), BCMO1 (rs7501331, rs12934922, rs119478057), NBPF3 (rs4654748), MTNFR (rs1801133), GC (rs2282679), FADS1 (rs174547), ADD1 (rs4961), CYP11B2 (rs1799998), ADH1B (rs1229984), ALDH2 (rs671), CHRNA5 (rs16969968), CHRNA3 (rs1051730).
- 2)
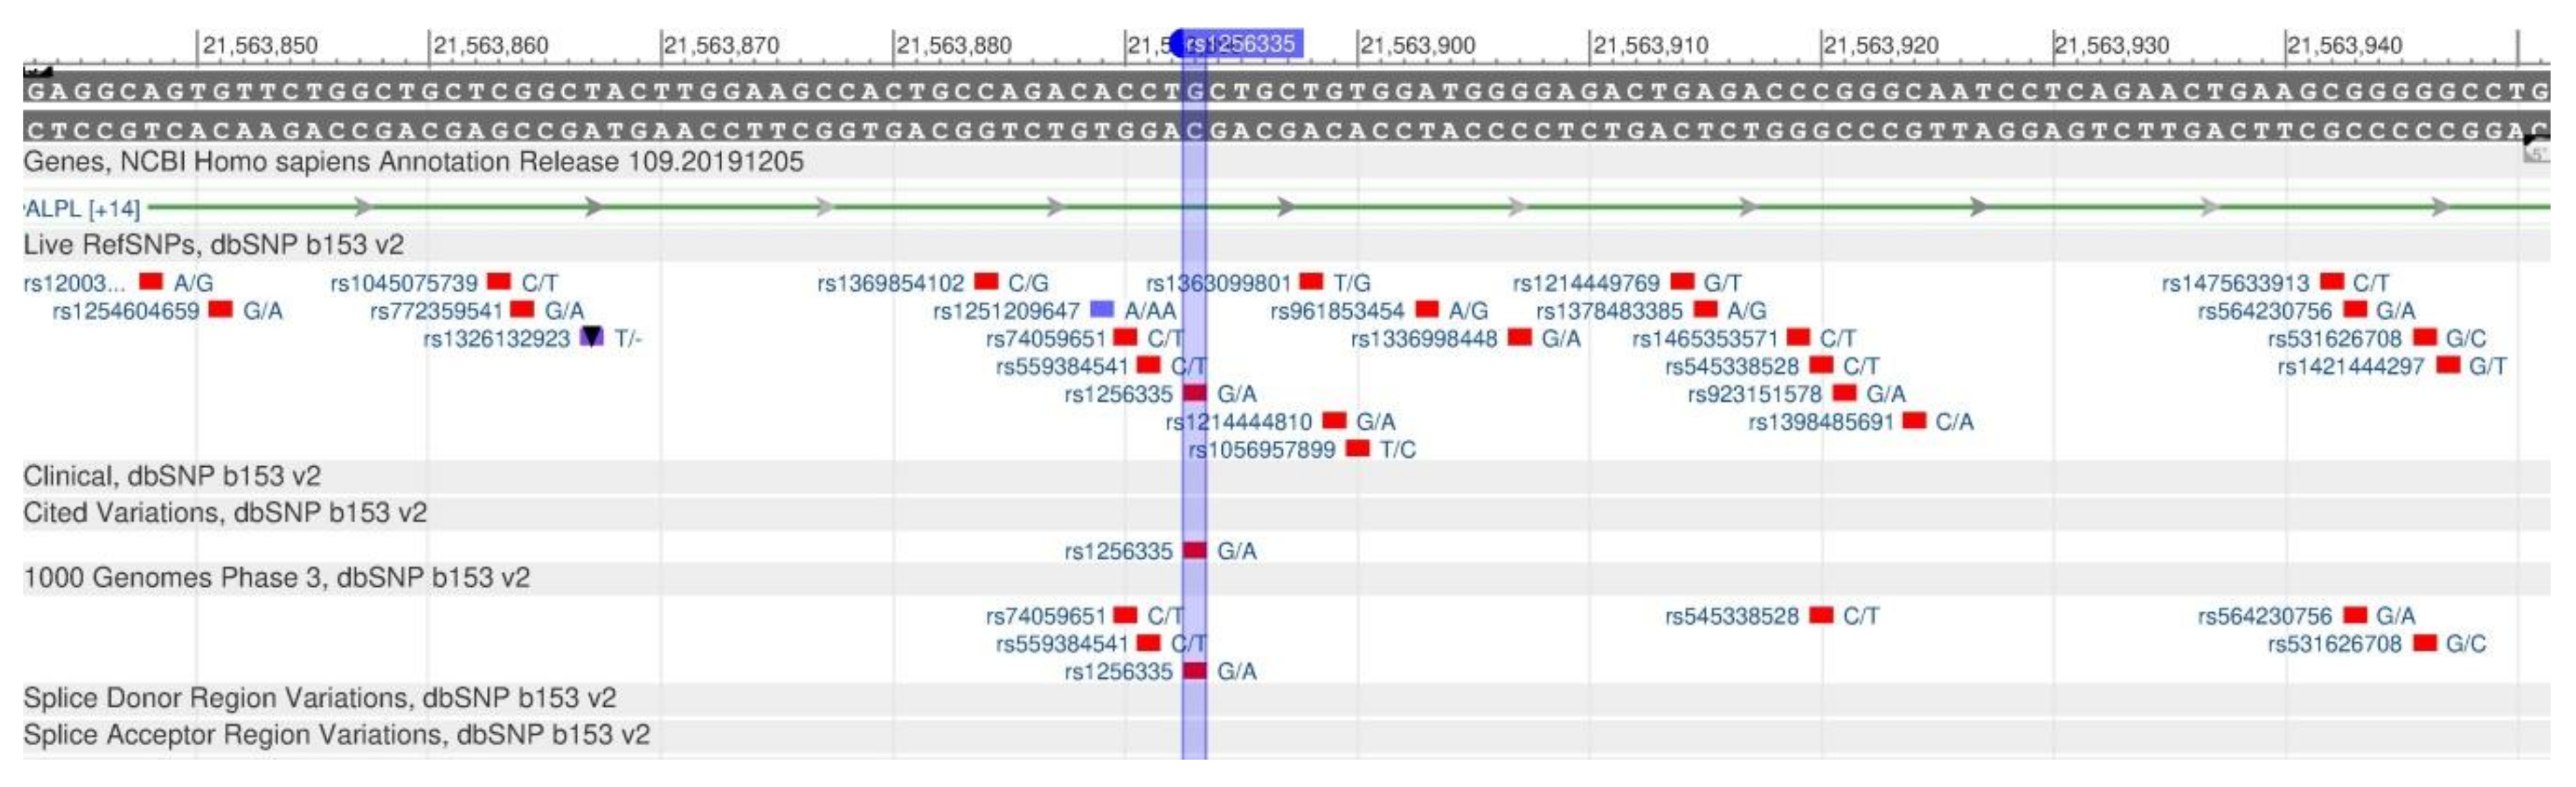
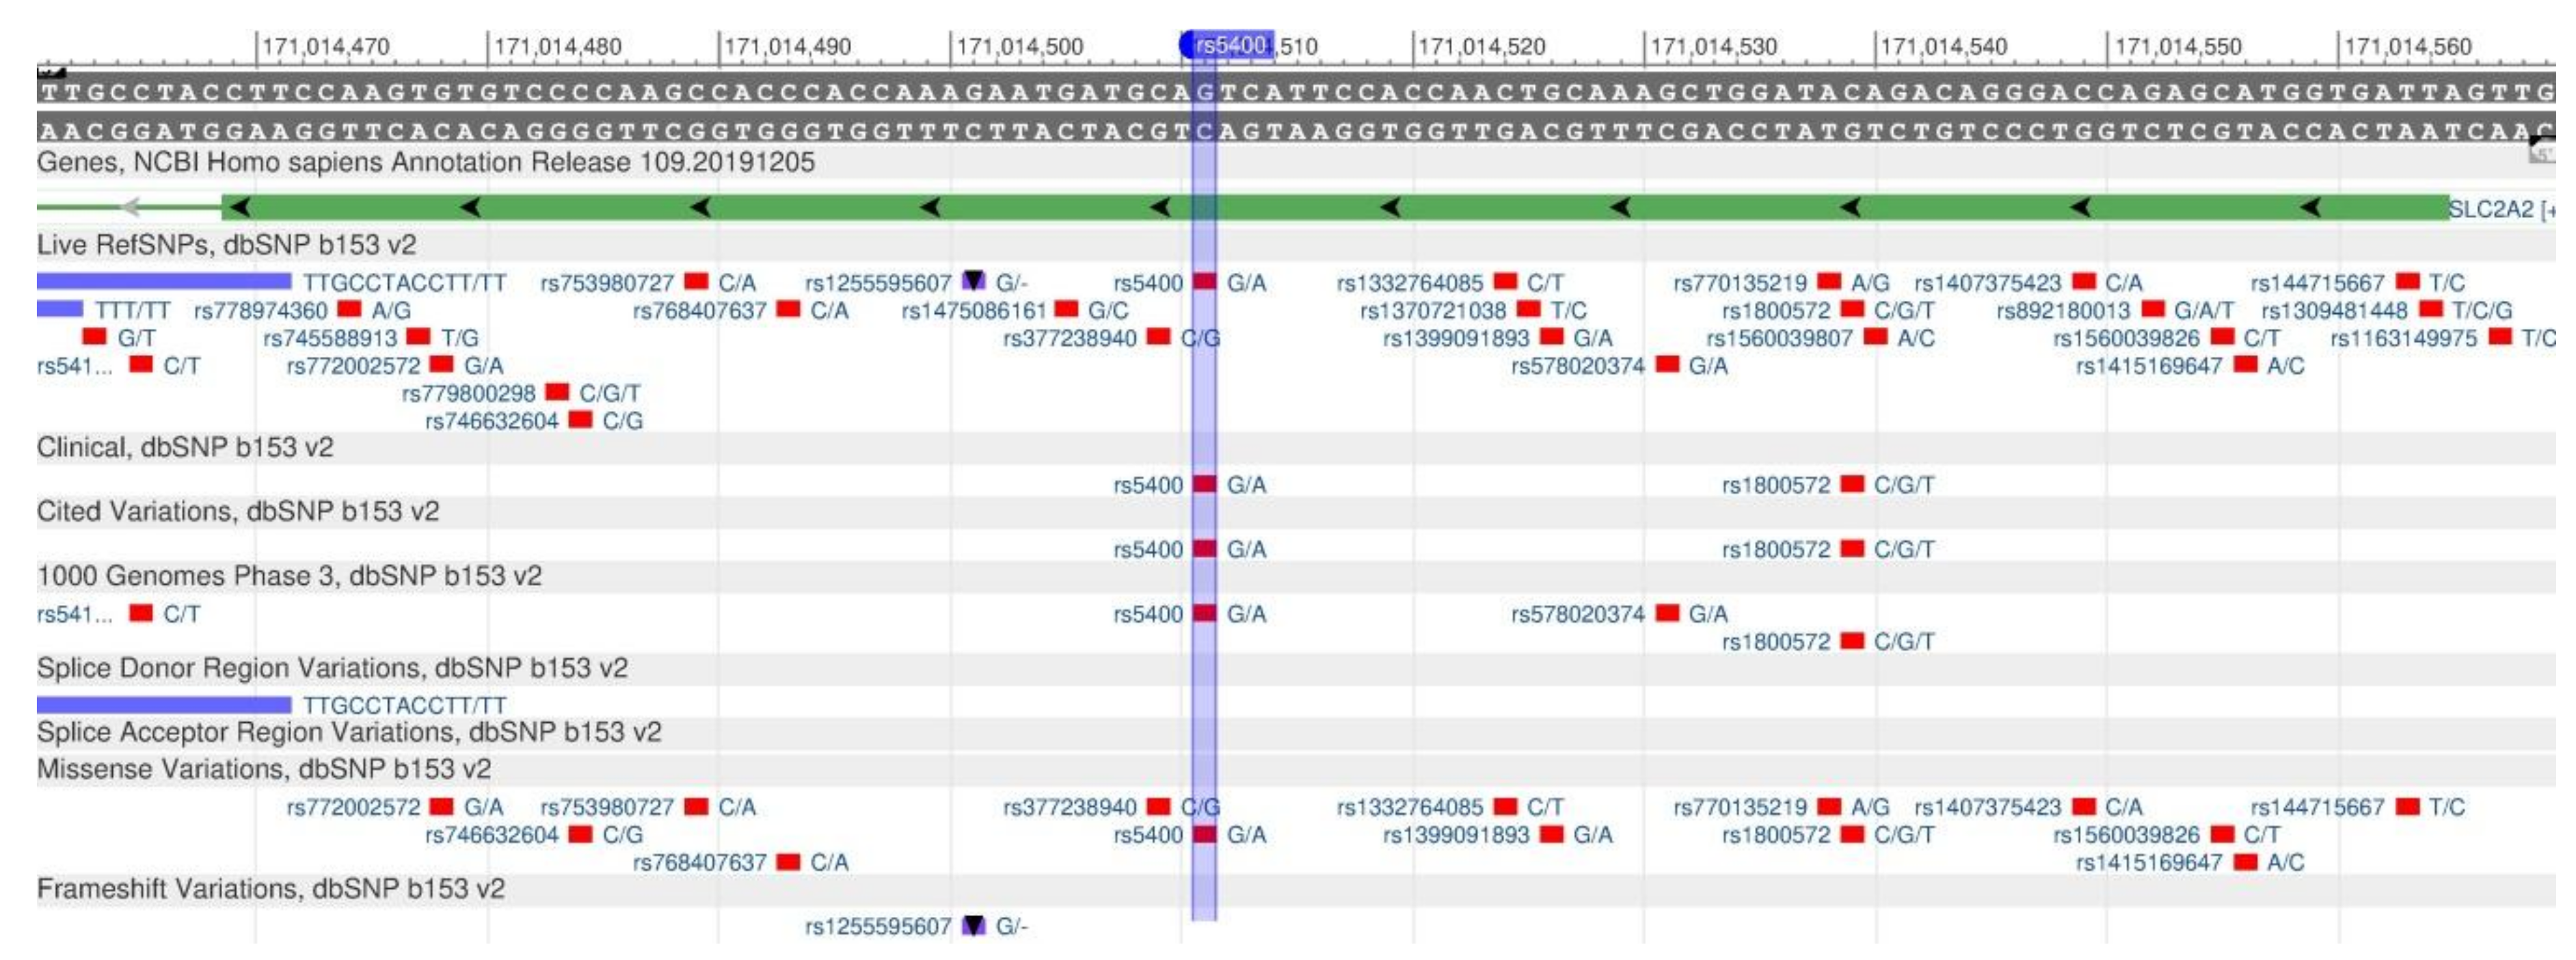
- For the American (AMR) population, it is not advisable to consider the following list of genes having a frequency of recessive allele occurrence less than 20%: PPARG (rs1801282), ADRB3 (rs4994), ApoA5 (rs662799, rs3135506), ApoE (rs429358, rs7412), BCMO1 (rs7501331, rs119478057), ALPL (rs1256335), GLUT2 (rs5400), ADD1 (rs4961), MC4R (rs17782313), ADH1B (rs1229984), ALDH2 (rs671).
- 3)
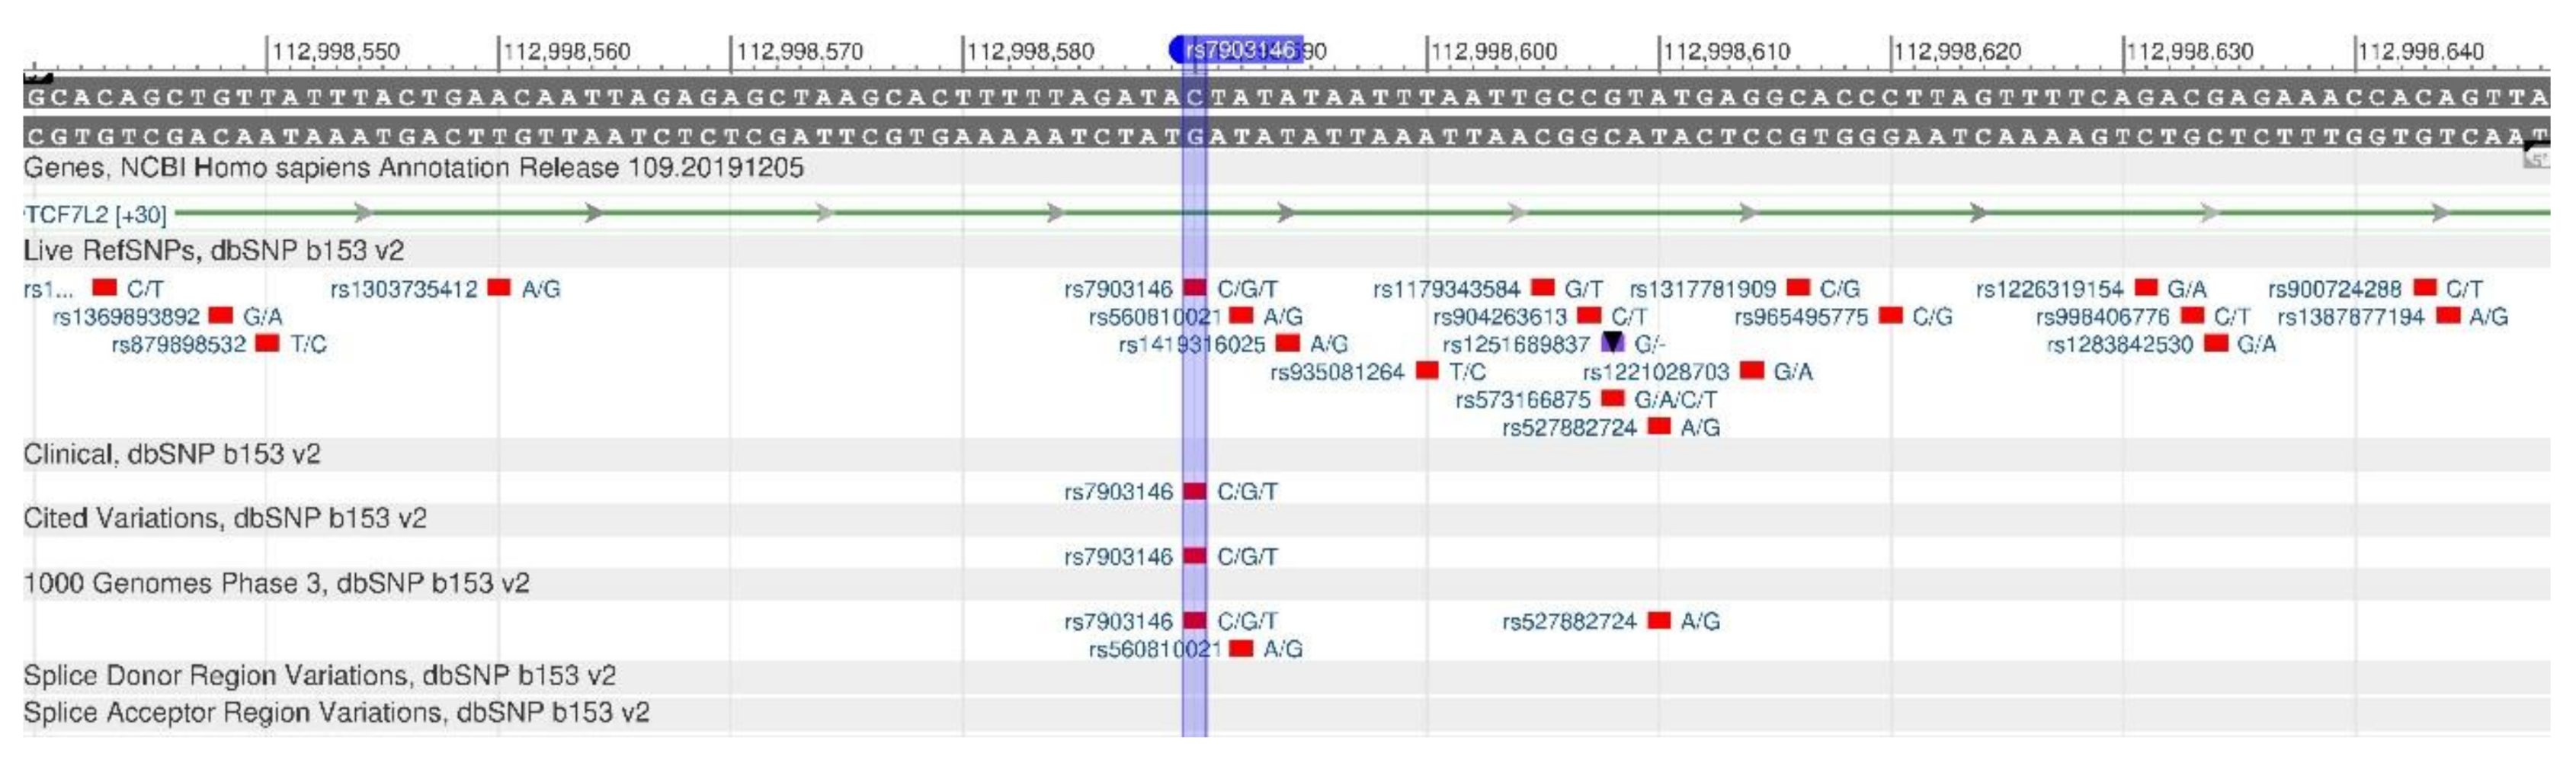
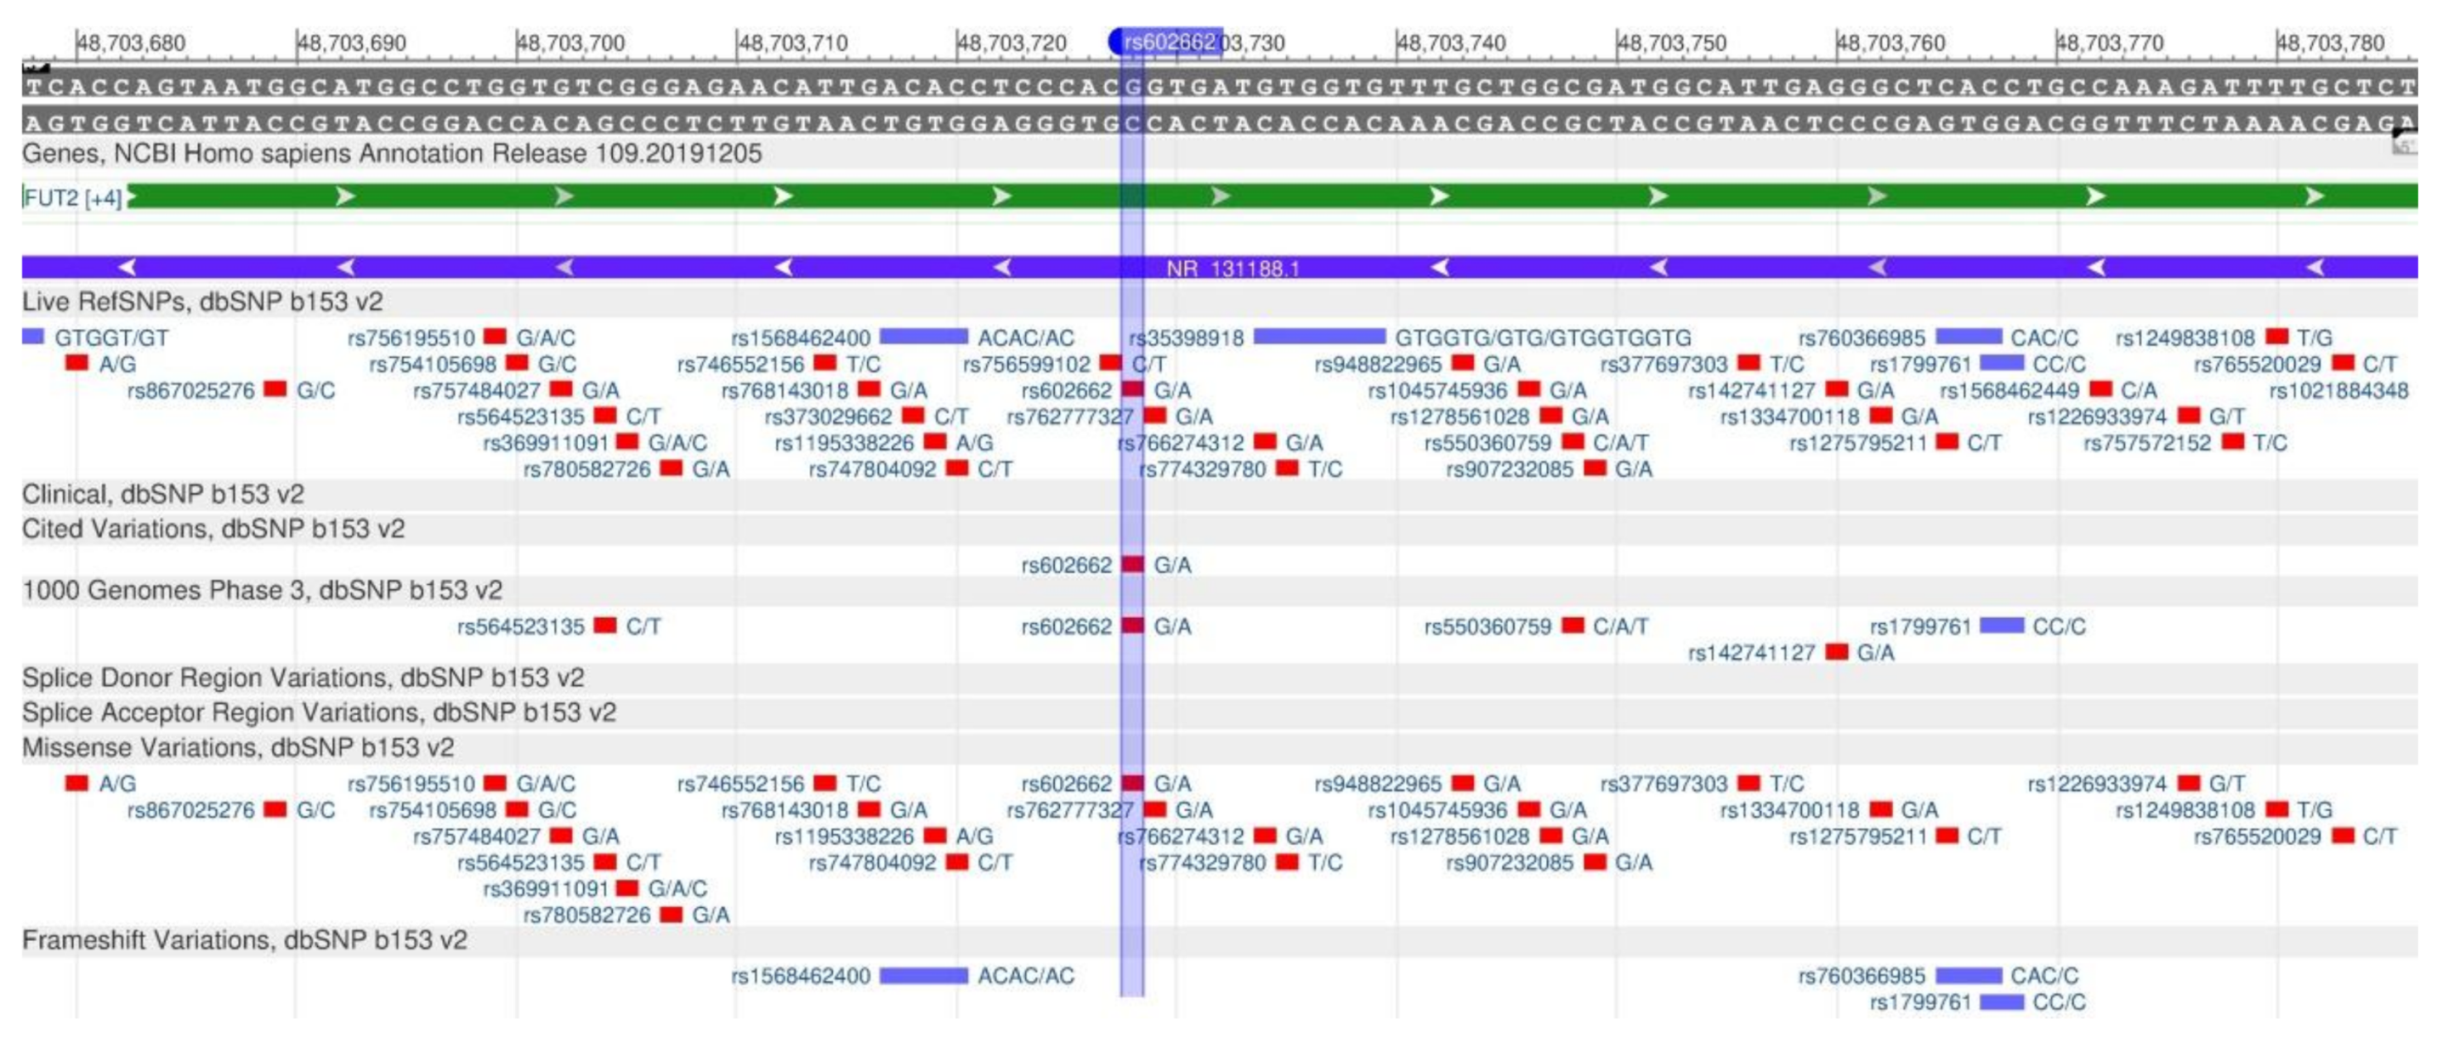
- For the East Asian population (EAS), a list of polymorphisms has been identified, and their effect in metabolism cannot be considered: TCF7L2 with the rs12255372 polymorphism, since the dominant allele has 90% frequency, and with the rs7903146 polymorphism, where the dominant allele has the 98% frequency; ApoA5 gene with the rs3135506 mutation, since the dominant allele occurrence frequency is 100%, the LEPR gene rs1137101, since the dominant allele frequency is 87%; the MCM6 rs4988235, since the dominant allele frequency is 100%. Furthermore, BCMO1 (rs119478057), ALPL (rs1256335), FUT2 (rs602662), VDR (rs1544410), MnSOD (rs4880), GSTP1 rs947894 (rs1695) are inappropriate to consider, since the recessive allele occurrence frequency is less than 20%.
- 4)
- For the European population (EUR), a list of polymorphisms has been identified, and their effect on the metabolism cannot be considered: PPARG (rs1801282), ADRB3 (rs4994), ApoA5 (rs662799, rs3135506), ApoE (rs429358, rs7412), BCMO1 (rs119478057), GLUT2 (rs5400), DRD2 (rs1800497), ADH91B (rs122929291B 84), ALDH2 (rs671).
- 5)
- For the South Asian population (SAS), a list of polymorphisms has been identified, and their effect on the metabolism cannot be considered: PPARG (rs1801282), ADRB3 (rs4994), ApoA5 (rs662799, rs3135506), ApoE (rs429358, rs7412), MCM6 (rs4988235), BCMO1 (rs119478057), MTNFR (rs1801133), FADS1 (rs1 (rs1801133) 174547), GLUT2 (rs5400), ADH1B (rs1229984), ALDH2 (rs671), CHRNA5 (rs16969968), CHRNA3 (rs1051730).
- 6)
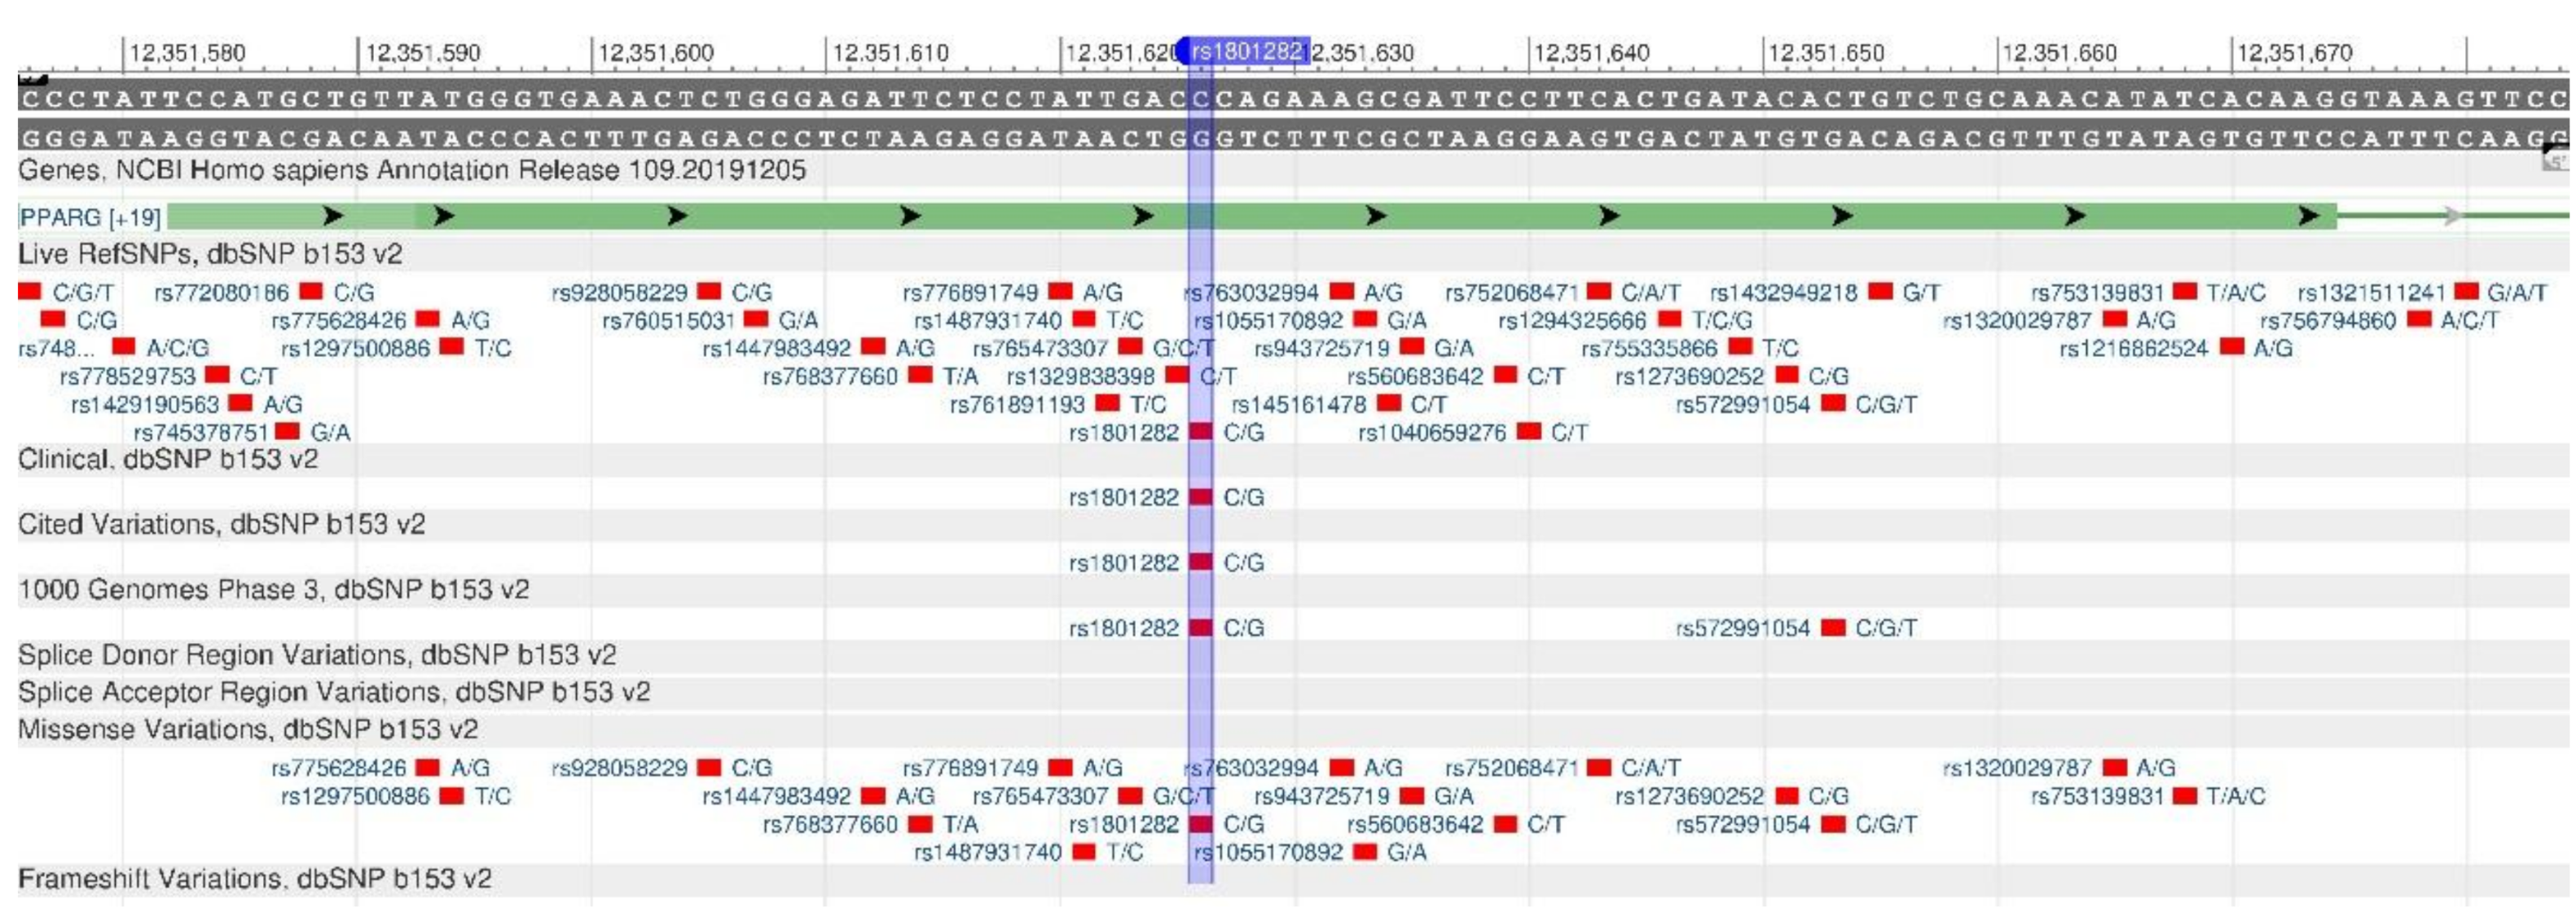
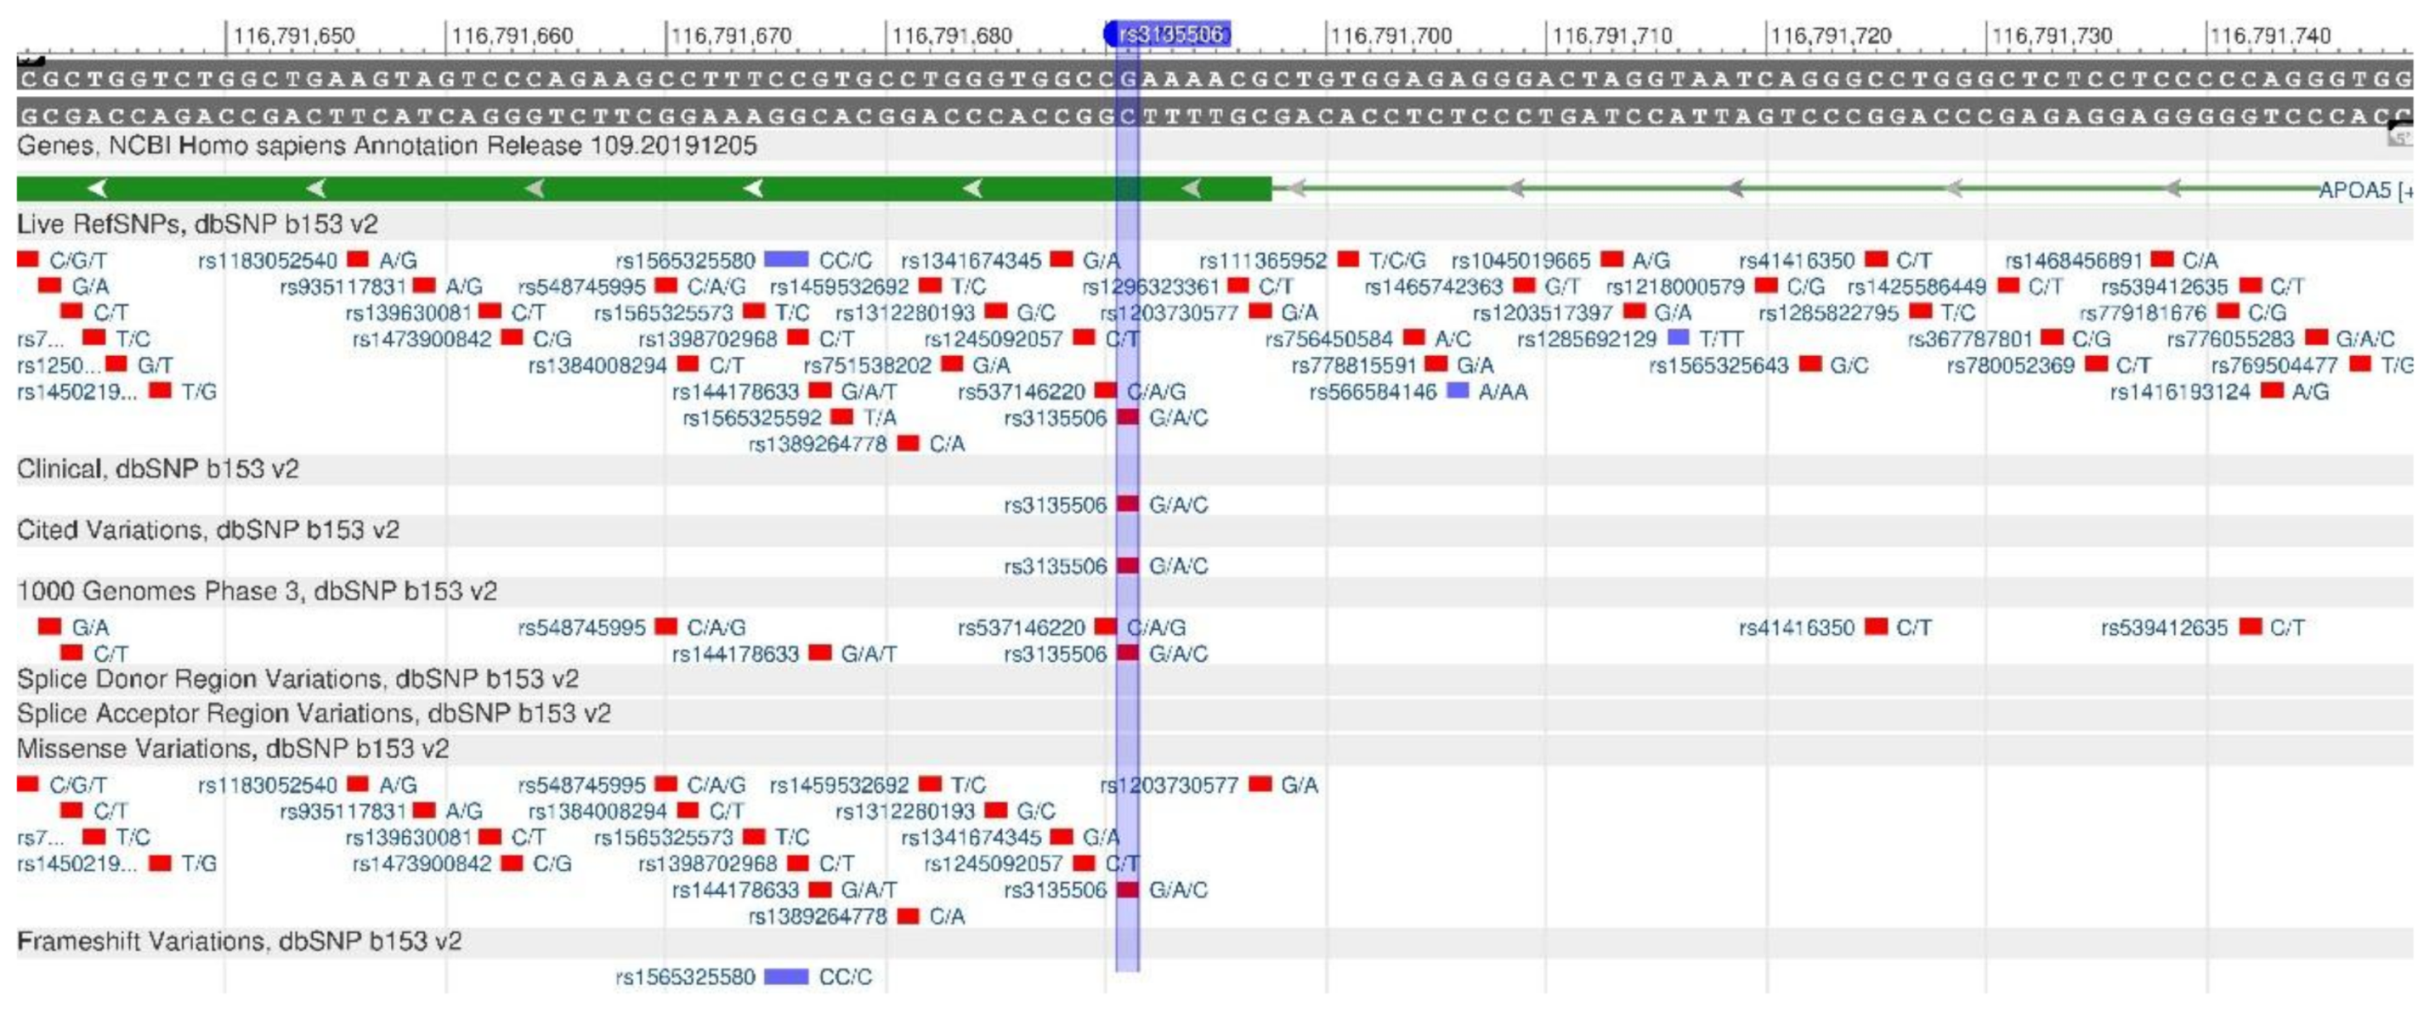
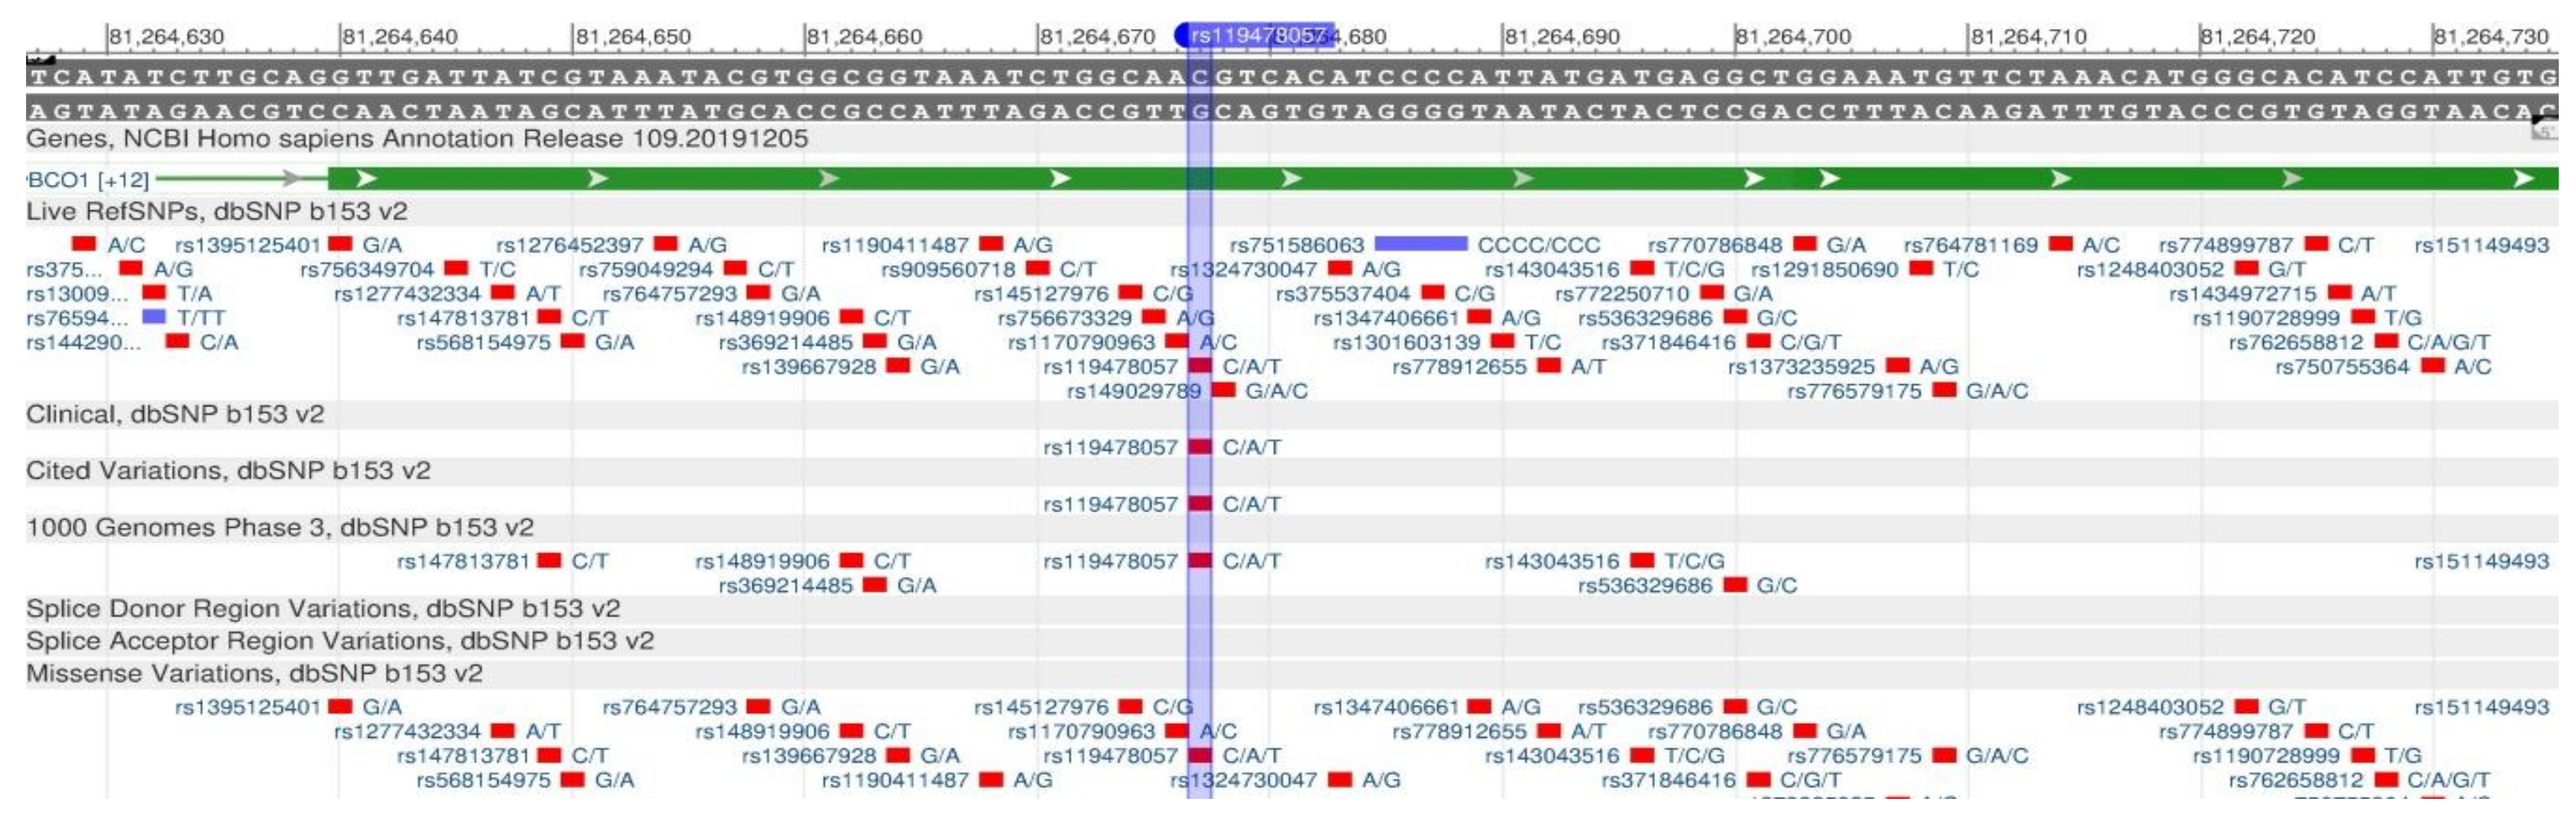
- For the six genes, it turns out to be inappropriate to consider how their oligonucleotide mutations affect eating preferences, as the allele occurrence dynamics is either minimal or absent. So, for PPARG rs1801282, the occurrence of allele G for all populations is 7%, and, therefore, the search for the recessive allele polymorphism will yield a negative result. The list also includes: ADRB3 (rs4994, recessive allele occurrence frequency 12%), ApoA5 (rs3135506, recessive allele occurrence frequency 6%), ApoE (rs7412, recessive allele occurrence frequency 8%), BCMO1 (rs119478057, recessive allele occurrence frequency 0%), ALDH2 (rs671, recessive allele occurrence frequency 4%).
- 7)
- Regarding the previous conclusion, the list of genes, in which the mutations play a role in polygenic diseases, changes:
- obesity (ADRB2, FABP2, LEPR, FTO, MC4R);
- type 2 diabetes (ADRB2, TCF7L2, FABP2, PPARG, CETP, GLUT2, CD36);
- cardiovascular diseases (CETP, ADD1, CYP11B2, MnSOD);
- cancer (MnSOD, GSTP1, CYP1A2, CHRNA5, CHRNA3);
- metabolic syndrome (ADRB2, TAS2R38, CD36).
3.2. Methods and Programs for Developing Personal Eating Plans
- 1)
- they do not consider genetic data;
- 2)
- the diets are difficult to follow (both in the choice of products and in the mode), therefore, a consumer often has to quit, and it is harmful for a body;
- 3)
- applications are not translated into an appropriate language;
- 4)
- they are mostly to be paid for;
- 5)
- the information on genetic predispositions is difficult to understand;
- 6)
- population genetics are not considered.
- 1)
- a questionnaire, where past medical history anamnesis, individual preferences (taste and religious ones), habitat and climatic zone of residence, and lifestyle are specified. All data must be filled in a secure database which will later be used for the analysis of DNA results;
- 2)
- DNA study. Depending on the purpose of a diet (to prevent obesity, diabetes, to improve well-being, etc.), a gene or a set of genes is chosen, taking into account the population genetics data. The material is collected (venous blood or saliva, buccal epithelium), DNA is extracted and the necessary polymorphisms are determined;
- 3)
- data analysis. The program analyzes all the data and produces the result;
- 4)
- developing nutritional strategies. An expert in nutrigenetics has all the data and develops a personal eating plan based on a genetic make-up.
- 5)
- developing a functional product. With a customer permission, the selection of optimal foods, nutrients and biologically active substances is made to develop a functional product on the basis of the genetic make-up and psycho-emotional preferences of a customer [139].
3.3. General Conclusions
- change the way of thinking, for both doctors and consumers, regarding dieting, since today one approach to all health and diet problems is prevalent, and it can only aggravate the body condition;
- create conditions for the cooperation of sciences (genetics, nutritiology, dietary science);
- make up genetics databases containing unified, clear and detailed information, for customers and prospective scientists;
- train new nutrigenetic specialists interested in carrying out research work and capable of giving competent interpretation results;
- establish a legal framework in the field of nutrigenetic research, including developing DNA-based diets;
- design a model for individual diets, based on a patient’s genetic makeup.
Author Contributions
Funding
Acknowledgments
Conflicts of Interest
References
- Bush, C.L.; Blumberg, J.B.; El-Sohemy, A.; Minich, D.M.; Ordovas, J.M.; Reed, D.G.; Behm, V.A.Y. Toward the definition of personalized nutrition: A proposal by the American nutrition association. J. Am. Coll. Nutr. 2020, 39, 5–15. [Google Scholar] [CrossRef] [PubMed]
- rs1042714 (SNP) – Population genetics− Homo_sapiens. Available online: https://clck.ru/MHVsj (accessed on 25 February 2020).
- rs1042713 (SNP) – Population genetics− Homo_sapiens. Available online: https://clck.ru/MHW2uj (accessed on 25 February 2020).
- rs12255372 (SNP) – Population genetics− Homo_sapiens. Available online: https://clck.ru/MHW2uj (accessed on 25 February 2020).
- rs7903146 (SNP) – Population genetics− Homo_sapiens. Available online: https://clck.ru/MHW48 (accessed on 25 February 2020).
- rs1799883 (SNP) – Population genetics− Homo_sapiens. Available online: https://clck.ru/MHW5Q (accessed on 25 February 2020).
- rs1801282 (SNP) – Population genetics− Homo_sapiens. Available online: https://clck.ru/MHW6C (accessed on 25 February 2020).
- rs5882 (SNP) – Population genetics− Homo_sapiens. Available online: https://clck.ru/MHW6v (accessed on 25 February 2020).
- rs4994 (SNP) – Population genetics− Homo_sapiens. Available online: https://clck.ru/MHW7w (accessed on 25 February 2020).
- rs662799 (SNP) – Population genetics− Homo_sapiens. Available online: https://clck.ru/MHW8v (accessed on 25 February 2020).
- rs3135506 (SNP) – Population genetics− Homo_sapiens. Available online: https://clck.ru/MHW9V (accessed on 25 February 2020).
- rs1137101 (SNP) – Population genetics− Homo_sapiens. Available online: https://clck.ru/MHWA9 (accessed on 25 February 2020).
- rs429358 (SNP) – Population genetics− Homo_sapiens. Available online: https://clck.ru/MHWAW (accessed on 25 February 2020).
- rs7412 (SNP) – Population genetics− Homo_sapiens. Available online: https://clck.ru/MHWBT (accessed on 25 February 2020).
- Litonjua, A.A.; Gong, L.; Duan, Q.L.; Shin, J.; Moore, M.J.; Weiss, S.T.; Johnson, J.A.; Klein, T.E.; Altman, R.B. Very important pharmacogene summary ADRB2. Pharmacogenet. Genomics 2010, 20, 64–69. [Google Scholar] [CrossRef] [PubMed]
- Pinelli, M.; Giacchetti, M.; Acquaviva, F.; Cocozza, S.; Donnarumma, G.; Lapice, E.; Riccardi, G.; Romano, G.; Vaccaro, O.; Monticelli, A. Beta2-adrenergic receptor and UCP3 variants modulate the relationship between age and type 2 diabetes mellitus. BMC Med. Genet. 2006, 7, 85. [Google Scholar] [CrossRef] [PubMed]
- Cropano, C.; Santoro, N.; Groop, L.; Dalla Man, C.; Cobelli, C.; Galderisi, A.; Kursawe, R.; Pierpont, B.; Goffredo, M.; Caprio, S. The rs7903146 variant in the TCF7L2 gene increases the risk of prediabetes/type 2 diabetes in obese adolescents by impairing β-cell function and hepatic insulin sensitivity. Diabetes Care 2017, 40, 1082–1089. [Google Scholar] [CrossRef] [PubMed]
- Lin, P.C.; Lin, W.T.; Yeh, Y.H.; Wung, S.F. Transcription factor 7-like 2 (TCF7L2) rs7903146 polymorphism as a risk factor for gestational diabetes mellitus: A meta-analysis. PLoS ONE 2016, 11, e0153044. [Google Scholar] [CrossRef]
- Turkovic, L.F.; Pizent, A.; Dodig, S.; Pavlovic, M.; Pasalic, D. FABP 2 gene polymorphism and metabolic syndrome in elderly people of Croatian descent. Biochem. Med. (Zagreb) 2012, 22, 217–224. [Google Scholar] [CrossRef]
- Liu, P.J.; Liu, Y.P.; Qin, H.K.; Xing, T.; Li, S.S.; Bao, Y.Y. Effects of polymorphism in FABP2 Ala54Thr on serum lipids and glycemic control in low glycemic index diets are associated with gender among Han Chinese with type 2 diabetes mellitus. Diabetes Metab. Syndr. Obes. 2019, 12, 413–421. [Google Scholar] [CrossRef]
- Kovtun, O.; Ustyuzhanina, M.A. The relationship of the carrier of polymorphism of the PPARG gene with the early debut of childhood obesity. Bull. Ural Med. Acad. Sci. 2018, 1, 42–47. [Google Scholar] [CrossRef]
- Wang, Y.Z.; Zhang, H.Y.; Liu, F.; Li, L.; Deng, S.M.; He, Z.Y. Association between PPARG genetic polymorphisms and ischemic stroke risk in a northern Chinese Han population: A case-control study. Neur. Regener. Res. 2019, 14, 1986–1993. [Google Scholar] [CrossRef]
- Bushueva, O.Y.; Stetskaya, T.A.; Korogodina, T.V.; Ivanov, V.P.; Polonikov, A.V. The study of the relationship of HindIII polymorphisms of the LPL gene and Taq1b of the CETP gene with the risk of developing atherothrombotic stroke in residents of Central Russia. Therap. Arch. 2015, 8, 86–91. [Google Scholar] [CrossRef]
- Wang, Q.; Zhou, S.B.; Wang, L.J.; Lei, M.M.; Wang, Y.; Miao, C.; Jin, Y.Z. Seven functional polymorphisms in the CETP gene and myocardial infarction risk: A meta-analysis and meta-regression. PLoS ONE 2014, 9, e88118. [Google Scholar] [CrossRef] [PubMed]
- Daghestani, M.; Daghestani, M.; Daghistani, M.; Eldali, A.; Hassan, Z.K.; Elamin, M.H.; Warsy, A. ADRB3 polymorphism rs4994 (Trp64Arg) associates significantly with bodyweight elevation and dyslipidaemias in Saudis but not rs1801253 (Arg389Gly) polymorphism in ARDB1. Lipids Health Dis. 2018, 17, 58. [Google Scholar] [CrossRef] [PubMed]
- Li, Y.Y.; Lu, X.Z.; Wang, H.; Zhou, Y.H.; Yang, X.X.; Geng, H.Y.; Gong, G.; Kim, H.J. ADRB3 Gene Trp64Arg Polymorphism and Essential Hypertension: A Meta-Analysis Including 9.555 Subjects. Front. Genet. 2018, 9, 106. [Google Scholar] [CrossRef] [PubMed]
- Wang, Y.; Lu, Z.; Zhang, J.; Yang, Y.; Shen, J.; Zhang, X.; Song, Y. The APOA5 rs662799 polymorphism is associated with dyslipidemia and the severity of coronary heart disease in Chinese women. Lipids Health Dis. 2016, 15, 170. [Google Scholar] [CrossRef] [PubMed]
- Ye, H.; Zhou, A.; Hong, Q.; Tang, L.; Xu, X.; Xin, Y.; Jiang, D.; Dai, D.; Li, Y.; Wang, D.W.; et al. Positive association between APOA5 rs662799 polymorphism and coronary heart disease: A case-control study and meta-analysis. PLoS ONE 2015, 10, e0135683. [Google Scholar] [CrossRef] [PubMed]
- Yang, Y.; Niu, T. A meta-analysis of associations of LEPR Q223R and K109R polymorphisms with Type 2 diabetes risk. PLoS ONE 2018, 13, e0189366. [Google Scholar] [CrossRef]
- Yang, M.M.; Wang, J.; Fan, J.J.; Ng, T.K.; Sun, D.J.; Guo, X.; Teng, Y.; Li, Y.B. Variations in the obesity gene "LEPR" contribute to risk of type 2 diabetes mellitus: Evidence from a meta-analysis. J. Diabetes Res. 2016, 2016, 5412084. [Google Scholar] [CrossRef]
- Paracchini, V.; Pedotti, P.; Taioli, E. Genetics of leptin and obesity: A HuGE review. Am. J. Epidemiol. 2005, 162, 101–114. [Google Scholar] [CrossRef]
- Yuan, L.; Liu, J.; Dong, L.; Cai, C.; Wang, S.; Wang, B.; Xiao, R. Effects of APOE rs429358, rs7412 and GSTM1/GSTT1 polymorphism on plasma and erythrocyte antioxidant parameters and cognition in old Chinese adults. Nutrients 2015, 7, 8261–8273. [Google Scholar] [CrossRef]
- Sofat, R.; Cooper, J.A.; Kumari, M.; Casas, J.P.; Mitchell, J.P.; Acharya, J.; Thom, S.; Hughes, A.D.; Humphries, S.E.; Hingorani, A.D. Circulating apolipoprotein E concentration and cardiovascular disease risk: Meta-analysis of results from three studies. PLoS Med. 2016, 13, e1002146. [Google Scholar] [CrossRef]
- Al-Hussaini, A.; Alharthi, H.; Osman, A.; Eltayeb-Elsheikh, N.; Chentoufi, A. Genetic susceptibility for celiac disease is highly prevalent in the Saudi population. Saudi J. Gastroenterol. 2018, 24, 268–273. [Google Scholar] [CrossRef] [PubMed]
- Stankovic, B.; Radlovic, N.; Lekovic, Z.; Ristic, D.; Radlovic, V.; Nikcevic, G.; Kotur, N.; Vucicevic, K.; Kostic, T.; Pavlovic, S.; et al. HLA genotyping in pediatric celiac disease patients. Bosn. J. Basic Med. Sci. 2014, 14, 171–176. [Google Scholar] [CrossRef] [PubMed]
- Abadie, V.; Sollid, L.M.; Barreiro, L.B.; Jabri, B. Integration of genetic and immunological insights into a model of celiac disease pathogenesis. Ann. Rev. Immunol. 2011, 29, 493–525. [Google Scholar] [CrossRef] [PubMed]
- Chin, E.L.; Huang, L.; Bouzid, Y.Y.; Kirschke, C.P.; Durbin-Johnson, B.; Baldiviez, L.M.; Bonnel, E.L.; Keim, N.L.; Korf, I.; Stephensen, C.B.; et al. Association of lactase persistence genotypes (rs4988235) and ethnicity with dairy intake in a healthy U.S. population. Nutrients 2019, 11, 1860. [Google Scholar] [CrossRef] [PubMed]
- Labrie, V.; Buske, O.J.; Oh, E.; Jeremian, R.; Ptak, C.; Gasiūnas, G.; Maleckas, A.; Petereit, R.; Žvirbliene, A.; Adamonis, K.; et al. Lactase nonpersistence is directed by DNA-variation-dependent epigenetic aging. Nat. Struct. Mol. Biol. 2016, 23, 566–573. [Google Scholar] [CrossRef]
- rs4988235 (SNP) - Population genetics− Homo_sapiens. Available online: http://grch37.ensembl.org/Homo_sapiens/Variation/Population?db=core;r=2:136608146-136609146;v=rs4988235;vdb=variation;vf=74412435 (accessed on 26 February 2020).
- rs7501331 (SNP) - Population genetics− Homo_sapiens. Available online: http://grch37.ensembl.org/Homo_sapiens/Variation/Population?db=core;r=16:81313996-81314996;v=rs7501331;vdb=variation;vf=242276280 (accessed on 26 February 2020).
- rs12934922 (SNP) - Population genetics− Homo_sapiens. Available online: http://grch37.ensembl.org/Homo_sapiens/Variation/Population?db=core;r=16:81301194-81302194;v=rs12934922;vdb=variation;vf=242383015 (accessed on 26 February 2020).
- rs119478057 (SNP) - Population genetics− Homo_sapiens. Available online: http://grch37.ensembl.org/Homo_sapiens/Variation/Population?db=core;r=16:81297782-81298782;v=rs119478057;vdb=variation;vf=242919064 (accessed on 26 February 2020).
- rs1256335 (SNP) - Population genetics− Homo_sapiens. Available online: .http://grch37.ensembl.org/Homo_sapiens/Variation/Population?db=core;r=1:21889886-21890886;v=rs1256335;vdb=variation;vf=154565840 (accessed on 26 February 2020).
- rs4654748 (SNP) - Population genetics− Homo_sapiens. Available online: http://grch37.ensembl.org/Homo_sapiens/Variation/Population?db=core;r=1:21785568-21786568;v=rs4654748;vdb=variation;vf=154747774 (accessed on 26 February 2020).
- rs1801133 (SNP) - Population genetics− Homo_sapiens. Available online: http://grch37.ensembl.org/Homo_sapiens/Variation/Population?db=core;r=1:11855878-11856878;v=rs1801133;vdb=variation;vf=154600269 (accessed on 26 February 2020).
- rs602662 (SNP) - Population genetics− Homo_sapiens. Available online: .http://grch37.ensembl.org/Homo_sapiens/Variation/Population?db=core;r=19:49206485-49207485;v=rs602662;vdb=variation;vf=584381614 (accessed on 26 February 2020).
- rs1544410 (SNP) - Population genetics− Homo_sapiens. Available online: http://grch37.ensembl.org/Homo_sapiens/Variation/Population?db=core;r=12:48239335-48240335;v=rs1544410;vdb=variation;vf=395709935 (accessed on 26 February 2020).
- rs2282679 (SNP) - Population genetics− Homo_sapiens. Available online: http://grch37.ensembl.org/Homo_sapiens/Variation/Population?db=core;r=4:72607883-72608883;v=rs2282679;vdb=variation;vf=512038060 (accessed on 26 February 2020).
- rs174547 (SNP) - Population genetics− Homo_sapiens. Available online: .http://grch37.ensembl.org/Homo_sapiens/Variation/Population?db=core;r=11:61570283-61571283;v=rs174547;vdb=variation;vf=3800 (accessed on 26 February 2020).
- Coronel, J.; Pinos, I.; Amengual, J. β-carotene in obesity research: Technical considerations and current status of the field. Nutrients 2019, 11, 842. [Google Scholar] [CrossRef]
- Yabuta, S.; Urata, M.; Wai Kun, R.Y.; Masaki, M.; Shidoji, Y. Common SNP rs6564851 in the BCO1 gene affects the circulating levels of β-carotene and the daily intake of carotenoids in healthy Japanese women. PLoS ONE 2016, 11, e0168857. [Google Scholar] [CrossRef]
- Tanaka, T.; Scheet, P.; Giusti, B.; Bandinelli, S.; Piras, M.G.; Usala, G.; Lai, S.; Mulas, A.; Corsi, A.M.; Vestrini, A.; et al. Genome-wide association study of vitamin B6, vitamin B12, folate, and homocysteine blood concentrations. Am. J. Hum. Genet. 2009, 84, 477–482. [Google Scholar] [CrossRef]
- Loohuis, L.M.; Albersen, M.; de Jong, S.; Wu, T.; Luykx, J.J.; Jans, J.J.M.; Verhoeven-Duif, N.M.; Ophoff, R.A. The Alkaline phosphatase (ALPL) locus is associated with B6 vitamer levels in CSF and plasma. Genes 2018, 10, 8. [Google Scholar] [CrossRef]
- Pogozheva, A.V.; Sorokina, E.Y.; Aristarkhova, T.V. A study of the relationship of the rs1801133 polymorphism of the MTHFR gene with folic acid deficiency in obese patients. Alman. Clin. Med. 2018, 3, 254–257. [Google Scholar] [CrossRef][Green Version]
- Luo, Z.; Lu, Z.; Muhammad, I.; Chen, Y.; Chen, Q.; Zhang, J.; Song, Y. Associations of the MTHFR rs1801133 polymorphism with coronary artery disease and lipid levels: A systematic review and updated meta-analysis. Lipids Health Dis. 2018, 17, 191. [Google Scholar] [CrossRef] [PubMed]
- Surendran, S.; Adaikalakoteswari, A.; Saravanan, P.; Shatwaan, I.A.; Lovegrove, J.A.; Vimaleswaran, K.S. An update on vitamin B12-related gene polymorphisms and B12 status. Genes Nutr. 2018, 13, 2. [Google Scholar] [CrossRef]
- Hazra, A.; Kraft, P.; Selhub, J.; Giovannucci, E.L.; Thomas, G.; Hoover, R.N.; Chanock, S.J.; Hunter, D.J. Common variants of FUT2 are associated with plasma vitamin B12 levels. Nat. Genet. 2008, 40, 1160–1162. [Google Scholar] [CrossRef] [PubMed]
- Christakos, S.; Dhawan, P.; Verstuyf, A.; Verlinden, L.; Carmeliet, G. Vitamin D: Metabolism, molecular mechanism of action, and pleiotropic effects. Physiol. Rev. 2016, 96, 365–408. [Google Scholar] [CrossRef] [PubMed]
- Tamura, M.; Ishizawa, M.; Isojima, T.; Özen, S.; Oka, A.; Makishima, M.; Kitanaka, S. Functional analyses of a novel missense and other mutations of the vitamin D receptor in association with alopecia. Sci. Rep. 2017, 7, 5102. [Google Scholar] [CrossRef]
- Wang, T.J.; Zhang, F.; Richards, J.B.; Kestenbaum, B.; van Meurs, J.B.; Berry, D.; Kiel, D.P.; Streeten, E.A.; Ohlsson, C.; Koller, D.L.; et al. Common genetic determinants of vitamin D insufficiency: A genome-wide association study. Lancet 2010, 376, 180–188. [Google Scholar] [CrossRef]
- Juan, J.; Huang, H.; Jiang, X.; Ardisson Korat, A.V.; Song, M.; Sun, Q.; Willett, W.C.; Jensen, M.K.; Kraft, P. Joint effects of fatty acid desaturase 1 polymorphisms and dietary polyunsaturated fatty acid intake on circulating fatty acid proportions. Am. J. Clin. Nutr. 2018, 107, 826–833. [Google Scholar] [CrossRef]
- Roke, K.; Walton, K.; Klingel, S.L.; Harnett, A.; Subedi, S.; Haines, J.; Mutch, D.M. Evaluating changes in omega-3 fatty acid intake after receiving personal FADS1 genetic information: A randomized nutrigenetic intervention. Nutrients 2017, 9, 240. [Google Scholar] [CrossRef]
- Ching, Y.K.; Chin, Y.S.; Appukutty, M.; Ramanchadran, V.; Yu, C.Y.; Ang, G.Y.; Gan, W.Y.; Chan, Y.M.; Teh, L.K.; Salleh, M.Z. Interaction of dietary linoleic acid and α-linolenic acids with rs174547 in FADS1 gene on metabolic syndrome components among vegetarians. Nutrients 2019, 11, 1686. [Google Scholar] [CrossRef]
- rs5400 (SNP) - Population genetics− Homo_sapiens. Available online: http://grch37.ensembl.org/Homo_sapiens/Variation/Population?db=core;r=1:21785568-21786568;v=rs4654748;vdb=variation;vf=154747774 (accessed on 26 February 2020).
- rs1726866 (SNP) - Population genetics− Homo_sapiens. Available online: http://grch37.ensembl.org/Homo_sapiens/Variation/Population?db=core;r=3:170731800-170732800;v=rs5400;vdb=variation;vf=323091205 (accessed on 26 February 2020).
- rs1761667 (SNP) - Population genetics− Homo_sapiens. Available online: 65.http://grch37.ensembl.org/Homo_sapiens/Variation/Population?db=core;r=HG7_PATCH:141672205-141673205;v=rs1726866;vdb=variation;vf=638703120 (accessed on 26 February 2020).
- rs4961 (SNP) - Population genetics− Homo_sapiens. Available online: 66.http://grch37.ensembl.org/Homo_sapiens/Variation/Population?db=core;r=7:80244439-80245439;v=rs1761667;vdb=variation;vf=38430382 (accessed on 26 February 2020).
- rs1799998 (SNP) - Population genetics− Homo_sapiens. Available online: 67.http://grch37.ensembl.org/Homo_sapiens/Variation/Population?db=core;r=4:2906207-2907207;v=rs4961;vdb=variation;vf=511944128 (accessed on 26 February 2020).
- Ruggiero, J.E.; Northrup, H.; Au, K.S. Association of facilitated glucose transporter 2 gene variants with the myelomeningocele phenotype. Birth Defects Res. A Clin. Mol. Teratol. 2015, 103, 479–487. [Google Scholar] [CrossRef]
- Igl, W.; Johansson, A.; Wilson, J.F.; Wild, S.H.; Polasek, O.; Hayward, C.; Vitart, V.; Hastie, N.; Rudan, P.; Gnewuch, C.; et al. Modeling of environmental effects in genome-wide association studies identifies SLC2A2 and HP as novel loci influencing serum cholesterol levels. PLoS Genet. 2010, 6, e1000798. [Google Scholar] [CrossRef] [PubMed]
- Michau, A.; Guillemain, G.; Grosfeld, A.; Vuillaumier-Barrot, S.; Grand, T.; Keck, M.; L’Hoste, S.; Chateau, D.; Serradas, P.; Teulon, J.; et al. Mutations in SLC2A2 gene reveal hGLUT2 function in pancreatic β cell development. J. Biol. Chem. 2013, 288, 31080–31092. [Google Scholar] [CrossRef] [PubMed]
- Boxer, E.E.; Garneau, N.L. Rare haplotypes of the gene TAS2R38 confer bitter taste sensitivity in humans. Springer Plus 2015, 4, 505. [Google Scholar] [CrossRef]
- Calancie, L.; Keyserling, T.C.; Taillie, L.S.; Robasky, K.; Patterson, C.; Ammerman, A.S.; Schisler, J.C. TAS2R38 Predisposition to Bitter Taste Associated with Differential Changes in Vegetable Intake in Response to a Community-Based Dietary Intervention. G3 – Genes Genom. Genet. 2018, 8, 2107–2119. [Google Scholar] [CrossRef] [PubMed]
- Sollai, G.; Melis, M.; Mastinu, M.; Pani, D.; Cosseddu, P.; Bonfiglio, A.; Crnjar, R.; Tepper, B. Human Tongue Electrophysiological Response to Oleic Acid and Its Associations with PROP Taster Status and the CD36 Polymorphism (rs1761667). Nutrients 2019, 11, 315. [Google Scholar] [CrossRef] [PubMed]
- Zhang, Y.; Ling, Z.Y.; Deng, S.B.; Du, H.A.; Yin, Y.H.; Yuan, J.; She, Q.; . Chen, Y.Q. Associations between CD36 gene polymorphisms and susceptibility to coronary artery heart disease. Braz. J. Med. Biol. Res. 2014, 47, 895–903. [Google Scholar] [CrossRef] [PubMed]
- Lee, M.; Sorn, S.R.; Lee, Y.; Kang, I. Salt induces adipogenesis/lipogenesis and inflammatory adipocytokines secretion in adipocytes. Int. J. Mol. Sci. 2019, 20, 160. [Google Scholar] [CrossRef] [PubMed]
- Ramu, P.; Umamaheswaran, G.; Shewade, D.G.; Swaminathan, R.P.; Balachander, J.; Adithan, C. Gly460Trp polymorphism of the ADD1 gene and essential hypertension in an Indian population: A meta-analysis on hypertension risk. Indian J. Hum. Genet. 2010, 16, 8–15. [Google Scholar] [CrossRef][Green Version]
- Liao, X.; Wang, W.; Zeng, Z.; Yang, Z.; Dai, H.; Lei, Y. Association of alpha-ADD1 gene and hypertension risk: A meta-analysis. Med. Sci. Monit. 2015, 21, 1634–1641. [Google Scholar] [CrossRef]
- Kelly, T.N.; Rice, T.K.; Gu, D.; Hixson, J.E.; Chen, J.; Liu, D.; Jaquish, C.E.; Bazzano, L.A.; Hu, D.; Ma, J.; et al. Novel genetic variants in the alpha-adducin and guanine nucleotide binding protein beta-polypeptide 3 genes and salt sensitivity of blood pressure. Am. J. Hypertens. 2010, 22, 985–992. [Google Scholar] [CrossRef]
- Kobuke, K.; Oki, K.; Gomez-Sanchez, C.E.; Gomez-Sanchez, E.P.; Ohno, H.; Itcho, K.; Yoshii, Y.; Yoneda, M.; Hattori, N. Calneuron 1 increased Ca2+ in the endoplasmic reticulum and aldosterone production in aldosterone-producing adenoma. Hypertension 2018, 71, 125–133. [Google Scholar] [CrossRef] [PubMed]
- Kim, Y.R.; Kim, S.H.; Kang, S.H.; Kim, H.J.; Kong, M.H.; Hong, S.H. Association of CYP11B2 polymorphisms with metabolic syndrome patients. Biomed. Rep. 2014, 2, 749–754. [Google Scholar] [CrossRef] [PubMed][Green Version]
- Abbasi, M.; Daneshpour, M.S.; Hedayati, M.; Mottaghi, A.; Pourvali, K.; Azizi, F. The relationship between MnSOD Val16Ala gene polymorphism and the level of serum total antioxidant capacity with the risk of chronic kidney disease in type 2 diabetic patients: A nested case-control study in the Tehran lipid glucose study. Nutr. Metab. (Lond.) 2018, 15, 25. [Google Scholar] [CrossRef] [PubMed]
- Yahya, M.J.; Ismail, P.B.; Nordin, N.B.; Akim, A.; Binti Md Yusuf, W.S.; Adam, N.; Zulkifli, N.F. CNDP1, NOS3, and MnSOD polymorphisms as risk factors for diabetic nephropathy among type 2 diabetic patients in Malaysia. J. Nutr. Metab. 2019, 2019, 8736215. [Google Scholar] [CrossRef]
- Bocedi, A.; Noce, A.; Marrone, G.; Noce, G.; Cattani, G.; Gambardella, G.; Di Lauro, M.; Di Daniele, N.; Ricci, G. Glutathione transferase P1-1 an enzyme useful in biomedicine and as biomarker in clinical practice and in environmental pollution. Nutrients 2019, 11, 1741. [Google Scholar] [CrossRef]
- Al-Ahmad, M.M.; Amir, N.; Dhanasekaran, S.; John, A.; Abdulrazzaq, Y.M.; Ali, B.R.; Bastaki, S. Genetic polymorphisms of cytochrome P450-1A2 (CYP1A2) among Emiratis. PLoS ONE 2017, 12, e0183424. [Google Scholar] [CrossRef]
- Southward, K.; Rutherfurd-Markwick, K.; Badenhorst, C.; Ali, A. The role of genetics in moderating the inter-individual differences in the ergogenicity of caffeine. Nutrients 2018, 10, 1352. [Google Scholar] [CrossRef]
- Sachse, C.; Brockmöller, J.; Bauer, S.; Roots, I. Functional significance of a C-->A polymorphism in intron 1 of the cytochrome P450 CYP1A2 gene tested with caffeine. Br. J. Clin. Pharmacol. 1999, 47, 445–449. [Google Scholar] [CrossRef]
- rs4880 (SNP) - Population genetics- Homo_sapiens. Available online: http://grch37.ensembl.org/Homo_sapiens/Variation/Population?db=core;r=6:160113372-160114372;v=rs4880;vdb=variation;vf=262766352 (accessed on 26 February 2020).
- rs947894 (SNP) - Population genetics- Homo_sapiens. Available online: http://grch37.ensembl.org/Homo_sapiens/Variation/Population?db=core;r=11:67352189-67353189;v=rs947894;vdb=variation;vf=2343 (accessed on 26 February 2020).
- rs762551 (SNP) - Population genetics- Homo_sapiens. Available online: http://grch37.ensembl.org/Homo_sapiens/Variation/Population?db=core;r=15:75041417-75042417;v=rs762551;vdb=variation;vf=445071068 (accessed on 26 February 2020).
- Khoshi, A.; Bajestani, M.K.; Shakeri, H.; Goodarzi, G.; Azizi, F. Association of omentin rs2274907 and FTO rs9939609 gene polymorphisms with insulin resistance in Iranian individuals with newly diagnosed type 2 diabetes. Lipids Health Dis. 2019, 18, 142. [Google Scholar] [CrossRef]
- West, N.R.; Dorling, J.; Thackray, A.E.; Hanson, N.C.; Decombel, S.E.; Stensel, D.J.; Grice, S.J. Effect of obesity-linked FTO rs9939609 variant on physical activity and dietary patterns in physically active men and women. J. Obes. 2018, 2018, 7560707. [Google Scholar] [CrossRef]
- Harbron, J.; van der Merwe, L.; Zaahl, M.G.; Kotze, M.J.; Senekal, M. Fat mass and obesity-associated (FTO) gene polymorphisms are associated with physical activity, food intake, eating behaviors, psychological health, and modeled change in body mass index in overweight/obese Caucasian adults. Nutrients 2014, 6, 3130–3152. [Google Scholar] [CrossRef] [PubMed]
- Wang, S.; Song, J.; Yang, Y.; Chawla, N.V.; Ma, J.; Wang, H. Rs12970134 near MC4R is associated with appetite and beverage intake in overweight and obese children: A family-based association study in Chinese population. PLoS ONE 2017, 12, e0177983. [Google Scholar] [CrossRef] [PubMed]
- Mozafarizadeh, M.; Mohammadi, M.; Sadeghi, S.; Hadizadeh, M.; Talebzade, T.; Houshmand, M. Evaluation of FTO rs9939609 and MC4R rs17782313 polymorphisms as prognostic biomarkers of obesity: A population-based cross-sectional study. Oman Med. J. 2019, 34, 56–62. [Google Scholar] [CrossRef] [PubMed]
- Drabsch, T.; Gatzemeier, J.; Pfadenhauer, L.; Hauner, H.; Holzapfel, C. Associations between single nucleotide polymorphisms and total energy, carbohydrate, and fat intakes: A systematic review. Adv. Nutr. 2018, 9, 425–453. [Google Scholar] [CrossRef]
- Sun, X.; Luquet, S.; Small, D.M. DRD2: Bridging the genome and ingestive behavior. Trends Cogn. Sci. 2017, 21, 372–384. [Google Scholar] [CrossRef] [PubMed]
- Sevgi, M.; Rigoux, L.; Kühn, A.B.; Mauer, J.; Schilbach, L.; Hess, M.E.; Gruendler, T.O.; Ullsperger, M.; Stephan, K.E.; Brüning, J.C.; et al. An obesity-predisposing variant of the FTO gene regulates D2R-dependent reward learning. J. Neurosci. 2015, 35, 12584–12592. [Google Scholar] [CrossRef] [PubMed]
- rs9939609 (SNP) - Population genetics - Homo_sapiens. Available online: http://grch37.ensembl.org/Homo_sapiens/Variation/Population?db=core;r=16:53820027-53821027;v=rs9939609;vdb=variation;vf=242319968 (accessed on 26 February 2020).
- rs17782313 (SNP) - Population genetics - Homo_sapiens. Available online: http://grch37.ensembl.org/Homo_sapiens/Variation/Population?db=core;r=18:57850597-57851597;v=rs17782313;vdb=variation;vf=203817959 (accessed on 26 February 2020).
- rs1800497 (SNP) - Population genetics - Homo_sapiens. Available online: http://grch37.ensembl.org/Homo_sapiens/Variation/Population?db=core;r=11:113270328-113271328;v=rs1800497;vdb=variation;vf=81982 (accessed on 26 February 2020).
- Hashimoto, M.; Watanabe, M.; Uematsu, Y.; Hattori, S.; Miyai, N.; Utsumi, M.; Oka, M.; Hayashida, M.; Kinoshita, K.; Arita, M.; et al. Relationships of alcohol dehydrogenase 1B (ADH1B) and aldehyde dehydrogenase 2 (ALDH2) genotypes with alcohol sensitivity, drinking behavior and problem drinking in Japanese older men. Environ. Health Prev. Med. 2016, 21, 138–148. [Google Scholar] [CrossRef]
- Polimanti, R.; Gelernter, J. ADH1B: From alcoholism, natural selection, and cancer to the human phenome. Am. J. Med. Genet. B Neuropsychiatr. Genet. 2018, 177, 113–125. [Google Scholar] [CrossRef]
- Wall, T.L.; Luczak, S.E.; Hiller-Sturmhöfel, S. Biology, Genetics, and Environment: Underlying Factors Influencing Alcohol Metabolism. Alcohol Res. 2016, 38, 59–68. [Google Scholar]
- Picciotto, M.R.; Kenny, P.J. Molecular mechanisms underlying behaviors related to nicotine addiction. Cold Spring Harb. Perspect Med. 2013, 3, a012112. [Google Scholar] [CrossRef]
- Jensen, K.P.; DeVito, E.E.; Herman, A.I.; Valentine, G.W.; Gelernter, J.; Sofuoglu, M. A CHRNA5 Smoking Risk Variant Decreases the Aversive Effects of Nicotine in Humans. Neuropsychopharmacology 2015, 40, 2813–2821. [Google Scholar] [CrossRef] [PubMed]
- Rajesh, D.; Azeem Mohiyuddin, S.M.; Balakrishna, S.; Kutty, A.V.M. Nicotinic acetylcholine receptor gene polymorphism is not associated with tobacco-related oral squamous cell carcinoma. Ind. J. Cancer 2018, 55, 399–403. [Google Scholar] [CrossRef]
- Munafo, M.R.; Johnstone, E.C.; Walther, D.; Uhl, G.R.; Murphy, M.F.; Aveyard, P. CHRNA3 rs1051730 genotype and short-term smoking cessation. Nicotine Tob Res. 2011, 13, 982–988. [Google Scholar] [CrossRef] [PubMed]
- rs1229984 (SNP) - Population genetics - Homo_sapiens. Available online: http://grch37.ensembl.org/Homo_sapiens/Variation/Population?db=core;r=4:100238819-100239819;v=rs1229984;vdb=variation;vf=511981363 (accessed on 26 February 2020).
- rs671 (SNP) - Population genetics - Homo_sapiens. Available online: http://grch37.ensembl.org/Homo_sapiens/Variation/Population?db=core;r=12:112241266-112242266;v=rs671;vdb=variation;vf=395664000 (accessed on 26 February 2020).
- rs16969968 (SNP) - Population genetics - Homo_sapiens. Available online: http://grch37.ensembl.org/Homo_sapiens/Variation/Population?db=core;r=15:78882425-78883425;v=rs16969968;vdb=variation;vf=445281927 (accessed on 25 February 2020).
- rs1051730 (SNP) - Population genetics - Homo_sapiens. Available online: http://grch37.ensembl.org/Homo_sapiens/Variation/Population?db=core;r=15:78893839-78894839;v=rs1051730;vdb=variation;vf=445076923 (accessed on 25 February 2020).
- Rs1799883. Available online: https://www.snpedia.com/index.php/Rs1799883 (accessed on 25 February 2020).
- Rs4994. Available online: https://www.snpedia.com/index.php/Rs4994 (accessed on 25 February 2020).
- Rs4988235. Available online: https://www.snpedia.com/index.php/Rs4988235 (accessed on 25 February 2020).
- Rs1801133. Available online: https://www.snpedia.com/index.php/Rs1801133 (accessed on 25 February 2020).
- Rs1544410. Available online: https://www.snpedia.com/index.php/Rs1544410 (accessed on 25 February 2020).
- Rs2282679. Available online: https://www.snpedia.com/index.php/Rs2282679 (accessed on 25 February 2020).
- Rs5400. Available online: https://www.snpedia.com/index.php/Rs5400 (accessed on 25 February 2020).
- Rs1726866. Available online: https://www.snpedia.com/index.php/Rs1726866 (accessed on 25 February 2020).
- Rs1799998. Available online: https://www.snpedia.com/index.php/Rs1799998 (accessed on 25 February 2020).
- Rs4880. Available online: https://www.snpedia.com/index.php/Rs4880 (accessed on 25 February 2020).
- Rs1800497. Available online: https://www.snpedia.com/index.php/Rs1800497 (accessed on 25 February 2020).
- Rs1229984. Available online: https://www.snpedia.com/index.php/Rs1229984 (accessed on 25 February 2020).
- Rs1051730. Available online: https://www.snpedia.com/index.php/Rs1051730 (accessed on 25 February 2020).
- Sycheva, O.V.; Starodubtseva, G.P.; Shlykov, S.N.; Anya, S.I.; Omarov, R.S. Development of theory and practice of the food industry. Agrar.-Food Innov. 2018, 4, 69–76. [Google Scholar] [CrossRef]
- Metabolic Balance. Available online: https://www.metabolic-balance.de/ (accessed on 26 February 2020).
- Martín-Hernández, R.; Reglero, G.; Ordovás, J.M.; Dávalos, A. NutriGenomeDB: A nutrigenomics exploratory and analytical platform. Database (Oxford) 2019, 2019, baz097. [Google Scholar] [CrossRef] [PubMed]
- NutriGenomeDB platform. Available online: http://nutrigenomedb.org/home (accessed on 24 February 2020).
- Layman, D.K. Eating patterns, diet quality and energy balance: a perspective about applications and future directions for the food industry. Physiol. Behav. 2014, 134, 126–130. [Google Scholar] [CrossRef]
- Sukhikh, S.A.; Astakhova, L.A.; Golubcova, Y.V.; Lukin, A.A.; Prosekova, E.A.; Milenteva, I.S.; Kostina, N.G. Functional dairy products enriched with plant ingredients. Foods Raw Mater. 2019, 2, 428–438. [Google Scholar] [CrossRef]
- LLC National Center for Genetic Research. The method of forming individual dietary recommendations based on DNA analysis, 2691145, Russian Federation.
- D’Auria, E.; Abrahams, M.; Zuccotti, G.V.; Venter, C. Personalized Nutrition Approach in Food Allergy: Is It Prime Time Yet? Nutrients 2019, 11, 359. [Google Scholar] [CrossRef]
- Comerford, K.B.; Pasin, G. Gene-Dairy Food Interactions and Health Outcomes: A Review of Nutrigenetic Studies. Nutrients 2017, 9, 710. [Google Scholar] [CrossRef]
- Matsuo, T.; Nakata, Y.; Katayama, Y.; Iemitsu, M.; Maeda, S.; Okura, T.; Kim, M.K.; Ohkubo, H.; Hotta, K.; Tanaka, K. PPARG genotype accounts for part of individual variation in body weight reduction in response to calorie restriction. Obesity 2009, 17, 1924–1931. [Google Scholar] [CrossRef]
- Arkadianos, I.; Valdes, A.M.; Marinos, E.; Florou, A.; Gill, R.D.; Grimaldi, K.A. Improved weight management using genetic information to personalize a calorie controlled diet. Nutr. J. 2007, 6, 29. [Google Scholar] [CrossRef] [PubMed]
- Neeha, V.S.; Kinth, P. Nutrigenomics research: A review. J. Food Sci. Technol. 2013, 50, 415–428. [Google Scholar] [CrossRef] [PubMed]
- Diószegi, J.; Llanaj, E.; Ádány, R. Genetic Background of Taste Perception, Taste Preferences, and Its Nutritional Implications: A Systematic Review. Front. Genet. 2019, 10, 1272. [Google Scholar] [CrossRef] [PubMed]
- Trihina, V.V.; Spirichev, V.B.; Koltun, V.Z.; Avstrievskih, A.N. Nutritional factor in ensuring health and reliability increase of professional activities of industrial workers. Foods Raw Mater. 2015, 1, 86–96. [Google Scholar] [CrossRef]


| Gene | Polymorphism | Alleli | Frequency of Occurrence in Populations | Reference | |||||
|---|---|---|---|---|---|---|---|---|---|
| all, % | AFR, % | AMR, % | EAS, % | EUR, % | SAS, % | ||||
| ADRB2 | rs1042714 | G: | 20 | 14 | 24 | 7 | 41 | 55 | [2] |
| C: | 80 | 86 | 76 | 93 | 59 | 45 | |||
| rs1042713 | G: | 52 | 48 | 54 | 45 | 61 | 55 | [3] | |
| A: | 48 | 52 | 46 | 55 | 39 | 45 | |||
| TCF7L2 | rs12255372 | G: | 79 | 70 | 78 | 99 | 71 | 78 | [4] |
| T: | 21 | 30 | 22 | 1 | 29 | 22 | |||
| rs7903146 | C: | 77 | 74 | 77 | 98 | 68 | 70 | [5] | |
| T: | 23 | 26 | 23 | 2 | 32 | 30 | |||
| FABP2 | rs1799883 | T: | 25 | 22 | 23 | 25 | 27 | 31 | [6] |
| C: | 75 | 78 | 77 | 75 | 73 | 69 | |||
| PPARG | rs1801282 | C: | 93 | 99 | 88 | 97 | 88 | 88 | [7] |
| G: | 7 | 1 | 12 | 3 | 12 | 12 | |||
| CETP | rs5882 | G: | 47 | 64 | 40 | 44 | 33 | 45 | [8] |
| A: | 53 | 36 | 60 | 56 | 67 | 55 | |||
| ADRB3 | rs4994 | A: | 88 | 91 | 88 | 87 | 92 | 84 | [9] |
| G: | 12 | 9 | 12 | 12 | 8 | 16 | |||
| ApoA5 | rs662799 | G: | 16 | 12 | 15 | 29 | 8 | 19 | [10] |
| A: | 84 | 88 | 85 | 71 | 92 | 81 | |||
| rs3135506 | G: | 94 | 93 | 88 | 100 | 93 | 96 | [11] | |
| C: | 6 | 7 | 12 | 0 | 7 | 4 | |||
| LEPR | rs1137101 | A: | 42 | 41 | 56 | 13 | 53 | 50 | [12] |
| G: | 58 | 59 | 44 | 87 | 47 | 50 | |||
| ApoE | rs429358 | T: | 85 | 73 | 90 | 91 | 85 | 91 | [13] |
| C: | 15 | 27 | 10 | 9 | 15 | 9 | |||
| rs7412 | C: | 92 | 90 | 95 | 90 | 94 | 96 | [14] | |
| T: | 8 | 10 | 5 | 10 | 6 | 4 | |||
| Gene | Polymorphism | Alleli | Frequency of Occurrence in Populations | Reference | |||||
|---|---|---|---|---|---|---|---|---|---|
| all, % | AFR, % | AMR, % | EAS, % | EUR, % | SAS, % | ||||
| MCM6 | rs4988235 | G: | 84 | 97 | 78 | 100 | 49 | 89 | [39] |
| A: | 16 | 3 | 22 | 0 | 51 | 11 | |||
| Gene | Polymorphism | Alleli | Frequency of Occurrence in Populations | Reference | |||||
|---|---|---|---|---|---|---|---|---|---|
| all, % | AFR, % | AMR, % | EAS, % | EUR, % | SAS, % | ||||
| BCMO1 | rs7501331 | C: | 85 | 99 | 83 | 81 | 77 | 79 | [40] |
| T: | 15 | 1 | 17 | 19 | 23 | 21 | |||
| rs12934922 | A: | 77 | 91 | 68 | 87 | 56 | 77 | [41] | |
| T: | 23 | 9 | 32 | 13 | 44 | 23 | |||
| rs119478057 | C | 100 | 100 | 100 | 100 | 100 | 100 | [42] | |
| T | 0 | 0 | 0 | 0 | 0 | 0 | |||
| ALPL | rs1256335 | G: | 17 | 24 | 14 | 2 | 22 | 21 | [43] |
| A: | 83 | 76 | 86 | 98 | 78 | 79 | |||
| NBPF3 | rs4654748 | C: | 62 | 94 | 57 | 42 | 53 | 56 | [44] |
| T: | 38 | 6 | 43 | 58 | 47 | 44 | |||
| MTNFR | rs1801133 | G: | 75 | 91 | 53 | 70 | 64 | 88 | [45] |
| A: | 24 | 9 | 47 | 30 | 36 | 12 | |||
| FUT2 | rs602662 | G: | 67 | 51 | 65 | 100 | 53 | 72 | [46] |
| A: | 33 | 49 | 35 | 0 | 47 | 28 | |||
| VDR | rs1544410 | C: | 70 | 73 | 74 | 94 | 60 | 52 | [47] |
| T: | 30 | 27 | 26 | 6 | 40 | 48 | |||
| GC | rs2282679 | T: | 80 | 95 | 79 | 74 | 75 | 70 | [48] |
| G: | 20 | 5 | 21 | 26 | 25 | 30 | |||
| FADS1 | rs174547 | T: | 70 | 98 | 41 | 43 | 65 | 86 | [49] |
| C: | 30 | 2 | 59 | 57 | 35 | 14 | |||
| Gene | Polymorphism | Alleli | Frequency of Occurrence in Populations | Reference | |||||
|---|---|---|---|---|---|---|---|---|---|
| all, % | AFR, % | AMR, % | EAS, % | EUR, % | SAS, % | ||||
| GLUT2 | rs5400 | G | 78 | 51 | 83 | 98 | 86 | 84 | [64] |
| A | 22 | 49 | 17 | 2 | 14 | 16 | |||
| TAS2R38 | rs1726866 | G: | 57 | 67 | 71 | 68 | 46 | 36 | [65] |
| A: | 43 | 33 | 29 | 32 | 54 | 64 | |||
| CD36 | rs1761667 | G: | 61 | 65 | 47 | 69 | 47 | 71 | [66] |
| A: | 39 | 35 | 53 | 31 | 53 | 29 | |||
| ADD1 | rs4961 | G: | 79 | 95 | 83 | 55 | 80 | 80 | [67] |
| T: | 21 | 5 | 17 | 45 | 20 | 20 | |||
| CYP11B2 | rs1799998 | A: | 65 | 81 | 53 | 71 | 51 | 61 | [68] |
| G: | 35 | 19 | 19 | 29 | 49 | 39 | |||
| Gene | Polymorphism | Alleli | Frequency of occurrence in populations | Reference | |||||
|---|---|---|---|---|---|---|---|---|---|
| all, % | AFR, % | AMR, % | EAS, % | EUR, % | SAS, % | ||||
| MnSOD | rs4880 | A: | 59 | 58 | 42 | 88 | 53 | 49 | [88] |
| G: | 41 | 42 | 58 | 12 | 47 | 51 | |||
| GSTP1 | rs947894(rs1695) | A: | 65 | 52 | 52 | 82 | 67 | 71 | [89] |
| G: | 35 | 48 | 48 | 18 | 33 | 29 | |||
| CYP1A2 | rs762551 | C: | 37 | 44 | 24 | 33 | 32 | 47 | [90] |
| A: | 63 | 56 | 76 | 67 | 68 | 53 | |||
| Gene | Polymorphism | Alleli | Frequency of Occurrence in Populations | Reference | |||||
|---|---|---|---|---|---|---|---|---|---|
| all, % | AFR, % | AMR, % | EAS, % | EUR, % | SAS, % | ||||
| FTO | rs9939609 | T: | 66 | 51 | 74 | 83 | 59 | 71 | [99] |
| A: | 34 | 49 | 26 | 17 | 41 | 29 | |||
| MC4R | rs17782313 | T: | 76 | 72 | 87 | 81 | 76 | 68 | [100] |
| C: | 24 | 28 | 13 | 19 | 24 | 32 | |||
| DRD2 | rs1800497 | G: | 67 | 61 | 69 | 59 | 81 | 69 | [101] |
| A: | 33 | 39 | 31 | 41 | 19 | 31 | |||
| Gene | Polymorphism | Alleli | Frequency of Occurrence in Populations | Reference | |||||
|---|---|---|---|---|---|---|---|---|---|
| all, % | AFR, % | AMR, % | EAS, % | EUR, % | SAS, % | ||||
| ADH1B | rs1229984 | T: | 16 | 0 | 6 | 70 | 3 | 2 | [109] |
| C: | 84 | 100 | 94 | 30 | 97 | 98 | |||
| ALDH2 | rs671 | G: | 96 | 100 | 100 | 83 | 100 | 100 | [110] |
| A: | 4 | 0 | 0 | 17 | 0 | 0 | |||
| CHRNA5 | rs16969968 | G: | 85 | 98 | 79 | 97 | 63 | 82 | [111] |
| A: | 15 | 2 | 21 | 3 | 37 | 18 | |||
| CHRNA3 | rs1051730 | G: | 83 | 91 | 78 | 97 | 63 | 82 | [112] |
| A: | 17 | 9 | 22 | 3 | 37 | 18 | |||
| Function | Reference | Gene | Polymorphism | Localization | Genotype | |||||
|---|---|---|---|---|---|---|---|---|---|---|
| norm/norm | norm /mut | mut/mut | ||||||||
| Fats and carbohydrates absorption | [2] | ADRB2 | rs1042714 | 5q32. | C/C | C/G | G/G | |||
| [3] | rs1042713 | G/G | G/A | A/A | ||||||
| [4] | TCF7L2 | rs12255372 | 10Q25.3 | G/G | G/T | T/T | ||||
| [5] | rs7903146 | C/C | C/T | T/T | ||||||
| [113] | FABP2 | rs1799883 | 4q26 | G/G | G/A | A/A | ||||
| [7] | PPARG | rs1801282 | 3p25.2 | C/C | C/G | G/G | ||||
| [8] | CETP | rs5882 | 16q13 | G/G | G/A | A/A | ||||
| [114] | ADRB3 | rs4994 | 8p11.23 | T/T | T/C | C/C | ||||
| [10] | ApoA5 | rs662799 | 11q23.3 | A/A | A/G | G/G | ||||
| [11] | rs3135506 | C/C | G/C | G/G | ||||||
| [12] | LEPR | rs1137101 | 1p31.3 | A/A | A/G | G/G | ||||
| [13] | ApoE | rs429358 | 19q13.32 | E2/2 | E2/3 | E3/3 | E4/2 | E4/3 | E4/4 | |
| T/T | T/T | T/T | C/T | C/T | C/C | |||||
| [14] | rs7412 | T/T | C/T | C/C | C/T | C/C | C/C | |||
| Food intolerances | [36] | HLA-DQ | HLA-DQA1 HLA-DQB1 | 6p21.3 | HLADQ2HLADQ8 | |||||
| [115] | MCM6 | rs4988235 | 2q21.3 | C/C | C/T | T/T | ||||
| Metabolism of vitamins | [40] | BCMO1 | rs7501331 | 16q23.2 | C/C | C/T | T/T | |||
| [41] | rs12934922 | A/A | A/T | T/T | ||||||
| [42] | rs119478057 | C/C | C/T | T/T | ||||||
| [43] | ALPL | rs1256335 | 1p36.12 | G/G | G/A | A/A | ||||
| [44] | NBPF3 | rs4654748 | C/C | C/T | T/T | |||||
| [116] | MTHFR | rs1801133 | 1p36.22 | C/C | C/T | T/T | ||||
| [46] | FUT2 | rs602662 | 19q13.33 | A/A | A/G | G/G | ||||
| [117] | VDR | rs1544410 | 12q13.11 | A/A | A/G | G/G | ||||
| [118] | GC | rs2282679 | 4p12 | A/A | A/C | C/C | ||||
| [49] | FADS1 | rs174547 | 9q31.3 | C/C | C/T | T/T | ||||
| Taste sensations | [119] | GLUT2 | rs5400 | 3q26.2 | C/C | C/T | T/T | |||
| [120] | TAS2R38 | rs1726866 | 7q34 | C/C | C/T | T/T | ||||
| [66] | CD36 | rs1761667 | 7q21.11 | G/G | G/A | A/A | ||||
| [67] | ADD1 | rs4961 | 4p16.3 | G/G | G/T | T/T | ||||
| [121] | CYP11B2 | rs1799998 | 8q24. 3 | C/C | C/T | T/T | ||||
| Metabolism of xenobiotics | [122] | MnSOD | rs4880 | 6q25.3 | C/C | C/T | T/T | |||
| [89] | GSTP1 | rs947894(rs1695) | 11q13.2 | A/A | A/G | G/G | ||||
| [90] | CYP1A2 | rs762551 | 15q24.1 | C/C orCYP1A2*1C | C/A | A/A or CYP1A2*1F | ||||
| Eating preferences | [99] | FTO | rs9939609 | 16q12.2 | T/T | T/A | A/A | |||
| [100] | MC4R | rs17782313 | 18q21.32 | T/T | T/C | C/C | ||||
| [123] | DRD2 | rs1800497 | 11q23.2 | C/C or A2/A2 | C/T or A2/A1 | T/T or A1/A1 | ||||
| Food addiction | [124] | ADH1B | rs1229984 | 4q23 | A/A or *1/*1 | A/G or*1/*2 | G/G*2/*2 | |||
| [110] | ALDH2 | rs671 | 12q24.12 | G/G or *1/*1 | G/A or*1/*2 | A/A or*2/*2 | ||||
| [111] | CHRNA5 | rs16969968 | 15q25.1 | A/A | A/G | G/G | ||||
| [125] | CHRNA3 | rs1051730 | C/C | C/T | T/T | |||||
© 2020 by the authors. Licensee MDPI, Basel, Switzerland. This article is an open access article distributed under the terms and conditions of the Creative Commons Attribution (CC BY) license (http://creativecommons.org/licenses/by/4.0/).
Share and Cite
Vesnina, A.; Prosekov, A.; Kozlova, O.; Atuchin, V. Genes and Eating Preferences, Their Roles in Personalized Nutrition. Genes 2020, 11, 357. https://doi.org/10.3390/genes11040357
Vesnina A, Prosekov A, Kozlova O, Atuchin V. Genes and Eating Preferences, Their Roles in Personalized Nutrition. Genes. 2020; 11(4):357. https://doi.org/10.3390/genes11040357
Chicago/Turabian StyleVesnina, Anna, Alexander Prosekov, Oksana Kozlova, and Victor Atuchin. 2020. "Genes and Eating Preferences, Their Roles in Personalized Nutrition" Genes 11, no. 4: 357. https://doi.org/10.3390/genes11040357
APA StyleVesnina, A., Prosekov, A., Kozlova, O., & Atuchin, V. (2020). Genes and Eating Preferences, Their Roles in Personalized Nutrition. Genes, 11(4), 357. https://doi.org/10.3390/genes11040357