Article

Identification, Expression, and Functions of the Somatostatin Gene Family in Spotted Scat (Scatophagus argus)

1
Fisheries College, Guangdong Ocean University, Zhanjiang 524088, China
2
Guangdong Research Center on Reproductive Control and Breeding Technology of Indigenous Valuable Fish Species, Zhanjiang 524088, China
3
Marine Ecology and Aquaculture Environment of Zhanjiang, Zhanjiang 524088, China
*
Author to whom correspondence should be addressed.
These authors contributed equally to this work.
Genes 2020, 11(2), 194; https://doi.org/10.3390/genes11020194
Submission received: 28 October 2019 / Revised: 31 January 2020 / Accepted: 7 February 2020 / Published: 12 February 2020
(This article belongs to the Section Animal Genetics and Genomics)

Abstract

:
Somatostatins (SSTs) are a family of proteins consisting of structurally diverse polypeptides that play important roles in the growth regulation in vertebrates. In the present study, four somatostatin genes (SST1, SST3, SST5, and SST6) were identified and characterized in the spotted scat (Scatophagus argus). The open reading frames (ORFs) of SST1, SST3, SST5, and SST6 cDNA consist of 372, 384, 321, and 333 bp, respectively, and encode proteins of 123, 127, 106, and 110 amino acids, respectively. Amino acid sequence alignments indicated that all SST genes contained conserved somatostatin signature motifs. Real-time PCR analysis showed that the SST genes were expressed in a tissue specific manner. When liver fragments were cultured in vitro with synthetic peptides (SST1, SST2, or SST6 at 1 μM or 10 μM) for 3 h or 6 h, the expression of insulin-like growth factor 1 and 2 (Igf-1 and Igf-2) in the liver decreased significantly. Treatment with SST5 had no significant effect on Igf-1 and Igf-2 gene expression. This study provides an enhanced understanding of the gene structure and expression patterns of the SST gene family in S. argus. Furthermore, this study provides a foundation for future exploration into the role of SST genes in growth and development.

1. Introduction

Somatostatins (SSTs) are cyclic regulatory peptides that play an important role in reproduction, metabolism, and the growth of vertebrates [1]. The expression of SST peptides is predominantly localized to the central nervous system and peripheral nerves, and secondarily in the intestine, stomach, and pancreas. These proteins function as both a hormone and a neurotransmitter [2]. First isolated from an ovine hypothalamus extract by Brazeau in 1973, the SS-14 amino acid was observed to inhibit the secretion of growth hormone (Gh) from the pituitary of rats [3]. It has been shown that SST not only directly inhibits the secretion of Gh, but also inhibits the growth of the body through the regulation of the Gh-Igf-1 system [4]. In teleost fishes, SSTs exert their effects through the regulation of Igf-1 synthesis and secretion in a tissue dependent manner. For example, in salmon (Salmo salar), secretion of SS-14 from the hypothalamus can inhibit the expression of Igf-1 in the liver [5,6]. In rainbow trout (Oncorhynchus mykiss), the expression of Igf-1 in plasma and liver was reduced by injection of SS-14 [6], and similarly inhibited Igf-1 in vitro in hepatocyte cultures [7]. However, the repertoire of SST genes in the spotted scat (Scatophagus argus), as well as the locations of their expression and the functions of the mature peptides, have not yet been studied.
It has been reported that different forms of SST in teleost species are the products of paralogous genes of at least six ancestral SST genes named SST1, SST2, SST3, SST4, SST5, and SST6. In vertebrate species, the SST gene family has been found to be widely distributed, being reported in cartilaginous fishes, ray-finned fishes, birds, reptiles, and amphibians [1,2,3]. The SST1 and SST2 genes likely arose through the 1R/2R whole genome duplications early in vertebrate evolution. The SST1 gene has been observed in both fish and mammals [3,8]. The SST2 gene, also known as cortistatin (CORT) in mammals, is expressed in many vertebrates such as human (Homo sapiens) [9,10], chicken (Gallus gallus) [11], and African lungfish (Protopterus annectens) [12]. In grouper (Epinephelus coioides) [13] and common carp (Cyprinus carpio) [14], three SST genes (SST1, SST3, and SST6) have been observed. In dogfish (Scylorhinus canicula) [15] and lamprey (Lampetra japonicum) [16], five SST genes (SST1, SST2, SST3, SST5, and SST6) and three SST genes (SSTa, SSTb, and SSTc) have been observed, respectively, although the phylogenetic relationship of the three lamprey SST genes remains unclear. Two forms of SST (SST1 and SST2) have been found in tetrapods [10,17,18,19]. In contrast, SST3 and SST6 are known in actinopterygians, SST4 in teleosts, and SST5 in Chondrichthyes, Actinopterygians, and Actinistia [20,21,22,23].
It has been proposed that the SST gene family was shaped by the two rounds of genome-wide duplication (1R and 2R) and the teleost fish-specific genome doubling (3R) [24,25,26,27]. SST1, SST2, and SST5 arose in 1R/2R and existed in the common ancestor of extant vertebrates. [21]. Subsequently, the SST4 gene arose during the tetraploidization (3R) of teleost fishes, approximately 350 million years ago, while the SST3 and SST6 genes were generated by tandem duplication of the SST1 and SST2 genes during the same period [28]. It is believed that the SST5 gene was lost in tetrapods [20], and the SST4 gene was thought to be lost in Scylorhinus canicula [27]. There seems to have been several differential losses of SST genes in different vertebrate lineages. Therefore, it is worth investigating whether the spotted scat has the full repertoire of genes present in other teleost fishes.
The spotted scat (S. argus), which belongs to the Perciformes, is an economically important species of marine fish for both the ornamental pet trade and human consumption. The species is mainly distributed throughout the Indian and Pacific Oceans [29]. Only one subspecies of S. argus can be found in the waters along the coast of China, and is restricted to the northern part of the South China Sea and the southern part of the East China Sea [30,31]. This species is rich in nutrients and has broad appeal as a food source in China. The genome and transcriptome of S. argus were recently sequenced (unpublished data), which set the stage for the analysis of the SST gene family reported here.
In the present study, four members of the SST gene family (SST1, SST3, SST5, and SST6) were identified in S. argus by phylogenetic and synteny analyses from representative vertebrate species and S. argus genome sequences (unpublished data, see Methods below). Then, the tissue differential expression of each SST gene was determined by qRT-PCR. Finally, liver tissue fragments were incubated in vitro with different concentrations of SSTs, and expression of Igf-1 and Igf-2 were measured at 3 and 6 h, respectively. This study improves the current understanding of the function of the SST gene family in teleost fishes, and establishes a foundation for future exploration of the growth and developmental mechanisms of S. argus. The nomenclature of the genes in the present study is based on the convention as proposed by Tostivint et al. (2019) [27].

2. Materials and Methods

2.1. Cloning of the Somatostatin Genes of S. argus

A total of 20 S. argus (150–200 g) were acquired from Donghai Island, Zhanjiang, Guangdong Province, China. All animal experiments were carried out in accordance with the guidelines and approval of the Animal Research and Ethics Committee of the Institute of Aquatic Economic Animals, Guangdong Ocean University (201903004). All fish were anesthetized with 100 mg/L of tricaine methane sulfonate (MS 222, Sigma, Saint Louis, MO, USA) and dissected. Total RNA was extracted from each pooled tissue sample. First strand cDNA synthesis was performed using the PrimeScript™ RT Reagent Kit (Takara, Otsu, Japan) in conjunction with the gDNA Eraser Kit, according to the manufacturer’s instructions. From each sample, 1 µg of RNA was set aside for cDNA synthesis, and stored at −20 °C until use. Based on published SST nucleotide sequences, four pairs of primers (Table S1) were designed to amplify the Open Reading Frames (ORFs) of the four SST genes. Next, Polymerase Chain Reaction (PCR) amplification was performed using 2 × PCR MIX (Dongsheng Biotechnology Co. Ltd., Guangzhou, China). The thermocycling protocol used was as follows: 94 °C (30 S); 58 °C (30 S), and 72 °C (30 S) for 35 cycles, followed by a final extension at 72 °C for 10 min. The amplified fragments were resolved by electrophoresis on 1.5% agarose gels. The target fragment was purified using a DNA Gel Extraction Kit (Guangzhou Dongsheng Biotech-Specializes in Molecular Biology, Guangzhou, China). The purified fragments were subsequently cloned into the pEASY-T3 (TransGen Biotech, China) plasmid for verification by sequencing (Sangon Biotech, Shanghai, China).

2.2. Identification of SSTs from Representative Vertebrate Species

The SST sequences of mandarin fish (Siniperca chuatsi) and zebrafish (Danio rerio) were downloaded from the National Center for Biotechnology Information (NCBI) database. Based on these SST sequences, four homologous genes were identified in the S. argus genomes and transcriptomes here using a local blast program [32] (Figure S3). Female adult spotted scats, reared in Zhanjiang Donghai Island Cultivation Base (Zhanjiang, Guangdong, China) were used for genome sequencing and assembly. The extracted muscle DNA molecules were sequenced with both Illumina HiSeq X Ten platform (Illumina Inc., San Diego, CA, USA) and PacBio Sequel platforms (Pacific Biosciences of California, Menlo Park, CA, USA). Using PacBio sequencing and the Hi-C technique to assemble the S. argus genome, the genome scale was 572.42 Mb with 240 contigs and contig N50 length of 19.60 Mb. A total of 187 contigs were reliably assembled into 24 chromosomes, representing 99.73% of the total genome. Among the 4584 total Benchmarking Universal Single Copy Orthologs (BUSCO) groups searched, more than 98.28% of the BUSCO genes were successfully detected in the genome. Specific primers were designed to verify the SST gene sequences in the genome and transcriptome by PCR amplification and cloning of genes. Finally, these cloned sequences (instead of predictions from the genome) were used for subsequent analysis. The amino acid, CDS (coding sequence) length, and number of chromosomal loci of the SST genes were noted based on the genomic database. The theoretical molecular weight (kDa) and pI (isoelectric points) of all identified proteins were calculated using the Lasergene v7.1.0 software.
The ORFs of gene orthologs in additional vertebrates, namely zebrafish (D. rerio), fugu (Takifugu rubripes), medaka (Oryzias latipes), tilapia (Oreochromis niloticus), coelacanth (Larimichthys crocea), stickleback (Gasterosteus aculeatus), Chinese sturgeon (Acipenser sinensis), African lungfish (P. annectens), mandarin fish (S. chuatsi), grouper (Epinephelus coioides), channel catfish (Ictalurus punctatus), dogfish (S. canicula), elephant shark (Callorhinchus milii), rainbow trout (O.rhynchus mykiss), tetraodon (Tetraodon nigroviridis), gold fish (Carassius auratus), white sucker (Catostomus commersonii), platyfish (Xiphophorus maculatus), fathead minnow (Pimephales promelas), American anglerfish (Lophius americanus), red-bellied piranha (Pygocentrus nattereri), frog (Xenopus laevis), lizard (Anolis carolinensis), chicken (G. gallus), human (H. sapiens), mouse (Mus musculus), and crab-eating macaque (Macaca fascicularis) were collected from the NCBI and Ensembl databases. Next, the translation program in ExPASy [33] was used to predict the amino acid sequences of S. argus SSTs. Signal peptide sequences and transmembrane domains were predicted online using the SignalP-5.0 Server [34]. Amino acid sequence identity comparisons were performed using the Clustal W algorithm in the Lasergene v7.1.0 software. The CDS of four SST genes were blasted with the genomic data to obtain the structure of introns and exons. In addition, a Simple Module Architecture Research Tool (SMART) [35] was used to identify the protein structures based on sequence homology.

2.3. Phylogenetic Analysis and Amino Acid Alignment

Multiple alignments of the analyzed SST protein sequences were performed using the Clustal W algorithm in the Lasergene v7.1.0 software. A phylogenetic tree was constructed using the maximum likelihood (ML) method using the Mega 7.0 software with the JTT + F model of substitution combined with the neighbor-joining interchange (NNI) method. The degree of confidence for each branch point was determined by bootstrap analysis (500 replicates).

2.4. Syntenic Analyses

In order to produce synteny maps of the SST genes in S. argus, syntenic analyses were performed by examining the conserved colocalization of adjacent genes in the reference genomic sequence of S. argus and the genomes of other selected species. Genes flanking the SST genes in other species (except S. argus) were identified from the Ensembl [36] and NCBI [37] databases. Genes surrounding each zebrafish SST gene were used to search for orthologs in the S. argus genome database by local BLAST and BLASTP. Non-protein-coding genes and genes encoding unknown proteins were excluded from further analysis.

2.5. Tissue Specific Analysis of SST Gene Expression by qRT-PCR

Total RNA was extracted from 11 tissues of each S. argus (hypothalamus, pituitary gland, gonad, liver, spleen, kidney, heart, muscle, gill, intestine, and stomach). In order to accurately verify the tissue distribution of different genes, qRT-PCR was employed. New specific primers were designed, and the expression of the corresponding genes was detected (Table S1). The reactions were performed using an ABI 7500 real-time theromcycler. A SYBR Green Real time PCR Master Mix (Toyobo, Japan) was used according to the manufacturer’s protocol. The thermocycling profile used was as follows: denaturation at 94 °C for 5 min, followed by 40 cycles at 94 °C for 15 s, 58 °C for 15 s, and 72 °C for 20 s. The 2ΔΔCt method was applied to calculate the relative expression of different genes in different tissues, with β-actin being used as the internal reference gene.

2.6. Expression of Igf-1 and Igf-2 in the Liver After Injection with SSTs

Liver tissue samples were cultured as previously described by Wang et al. [38]. Briefly, livers were carefully dissected, placed in a dish containing 2 mL of culture medium, and washed three times with M199 medium. The tissue was then cut into small pieces, and transferred into a 24-well culture plate. Each well contained 2 mL of M199 medium supplemented with penicillin (100 IU/mL) and streptomycin (100 μg/mL). Synthetic SST polypeptides were prepared (SST1-amide, AGCKNFFWKTFTSC-amide; SST3-amide, APCKNFFWKTFTSC-amide; SST5-amide, AGCRNFFWKTFTSC-amide; SST6-amide, AGCKNFYWKGFTSC-amide) from GL Biochem Ltd. (Shanghai, China). Next, SSTs were dissolved in M199 (Mediatech, Manassas, VA) at a stock concentration of 100 μM. After pre-incubation at 25 °C for 2 h in a 5% CO2 humidified incubator, the medium was replaced with fresh media containing the SST. Three concentrations of synthetic SST were tested (0.1, 1, and 10 μM) at one of two different incubation times (3 or 6 h), together with a control group. Each condition consisted of three replicates and this was repeated in triplicate. After incubation for 3 or 6 h, each liver sample was collected and stored at −80 °C for analysis of gene expression by qRT-PCR.

2.7. Statistical Analysis

Data were presented as the mean ± S.E.M. Significant differences in the data among groups were estimated using one-way analysis of variance (ANOVA) followed by Duncan’s post-hoc test using SPSS 18 software. Differences were considered to be statistically significant at p < 0.05.

3. Results

3.1. Identification of the SST Gene Family in S. argus

In the present study, four genes SST1, SST3, SST5, and SST6 were successfully identified in S. argus. The lengths of the cDNAs of these genes were 658, 790, 748, and 752 bp, respectively (Figure S1). The lengths of the SST proteins ranged from 101 to 127 amino acids, with putative molecular weights ranging from 11.59 to 14.19 kDa. The theoretical isoelectric points (pI) for these proteins were predicted to be between 5.14 and 9.06 (Table 1). Both SST1 and SST3 were located on linkage group 4 (Table 1), whereas SST5 and SST6 were located on linkage group 23 and linkage group 8, respectively. The SST1 sequence contained an arginine-lysine (R-K) and an arginine (R) recognition site, which are predicted to produce a 14-aa peptide somatostatin (SS-14) and a 30-aa peptide somatostatin (SS-30), respectively. The SST3 sequence included one arginine-lysine (R-K) and one arginine (R) recognition sites, which are predicted to produce 14- and 28-aa peptide somatostatins (SS-14 and SS-28). The SST5 sequence included an arginine-lysine (R-K) and an arginine (R) recognition site, which are predicted to produce 14- and 24-aa peptide somatostatins (SS-14 and SS-24), respectively. The SST6 sequence included an arginine-lysine (R-K) and an arginine (R) recognition site, potentially yielding mature 14- and 23-aa peptide somatostatins (SS-14 and SS-23) (Figure S1).

3.2. Gene Structures and Conserved Domains

The protein structures of the SST gene family were predicted using SMART (Figure 1). Both the SST1 and SST6 genes of S. argus contained a single intron and two exons. Both the SST3 and SST5 genes contained two introns and three exons (Figure 1). It was observed that each of the four SST genes contained a conserved domain (Pfam: Somatostatin region especially SS-14 amino acid), throughout their genetic evolution (Figure S2). The SS-14 amino acid sequence of the SST genes were highly conserved among different species. However, some domains were divergent between species. For example, the SST1 protein contained two regions of low-complexity, whereas all others examined contained only one low complexity region.

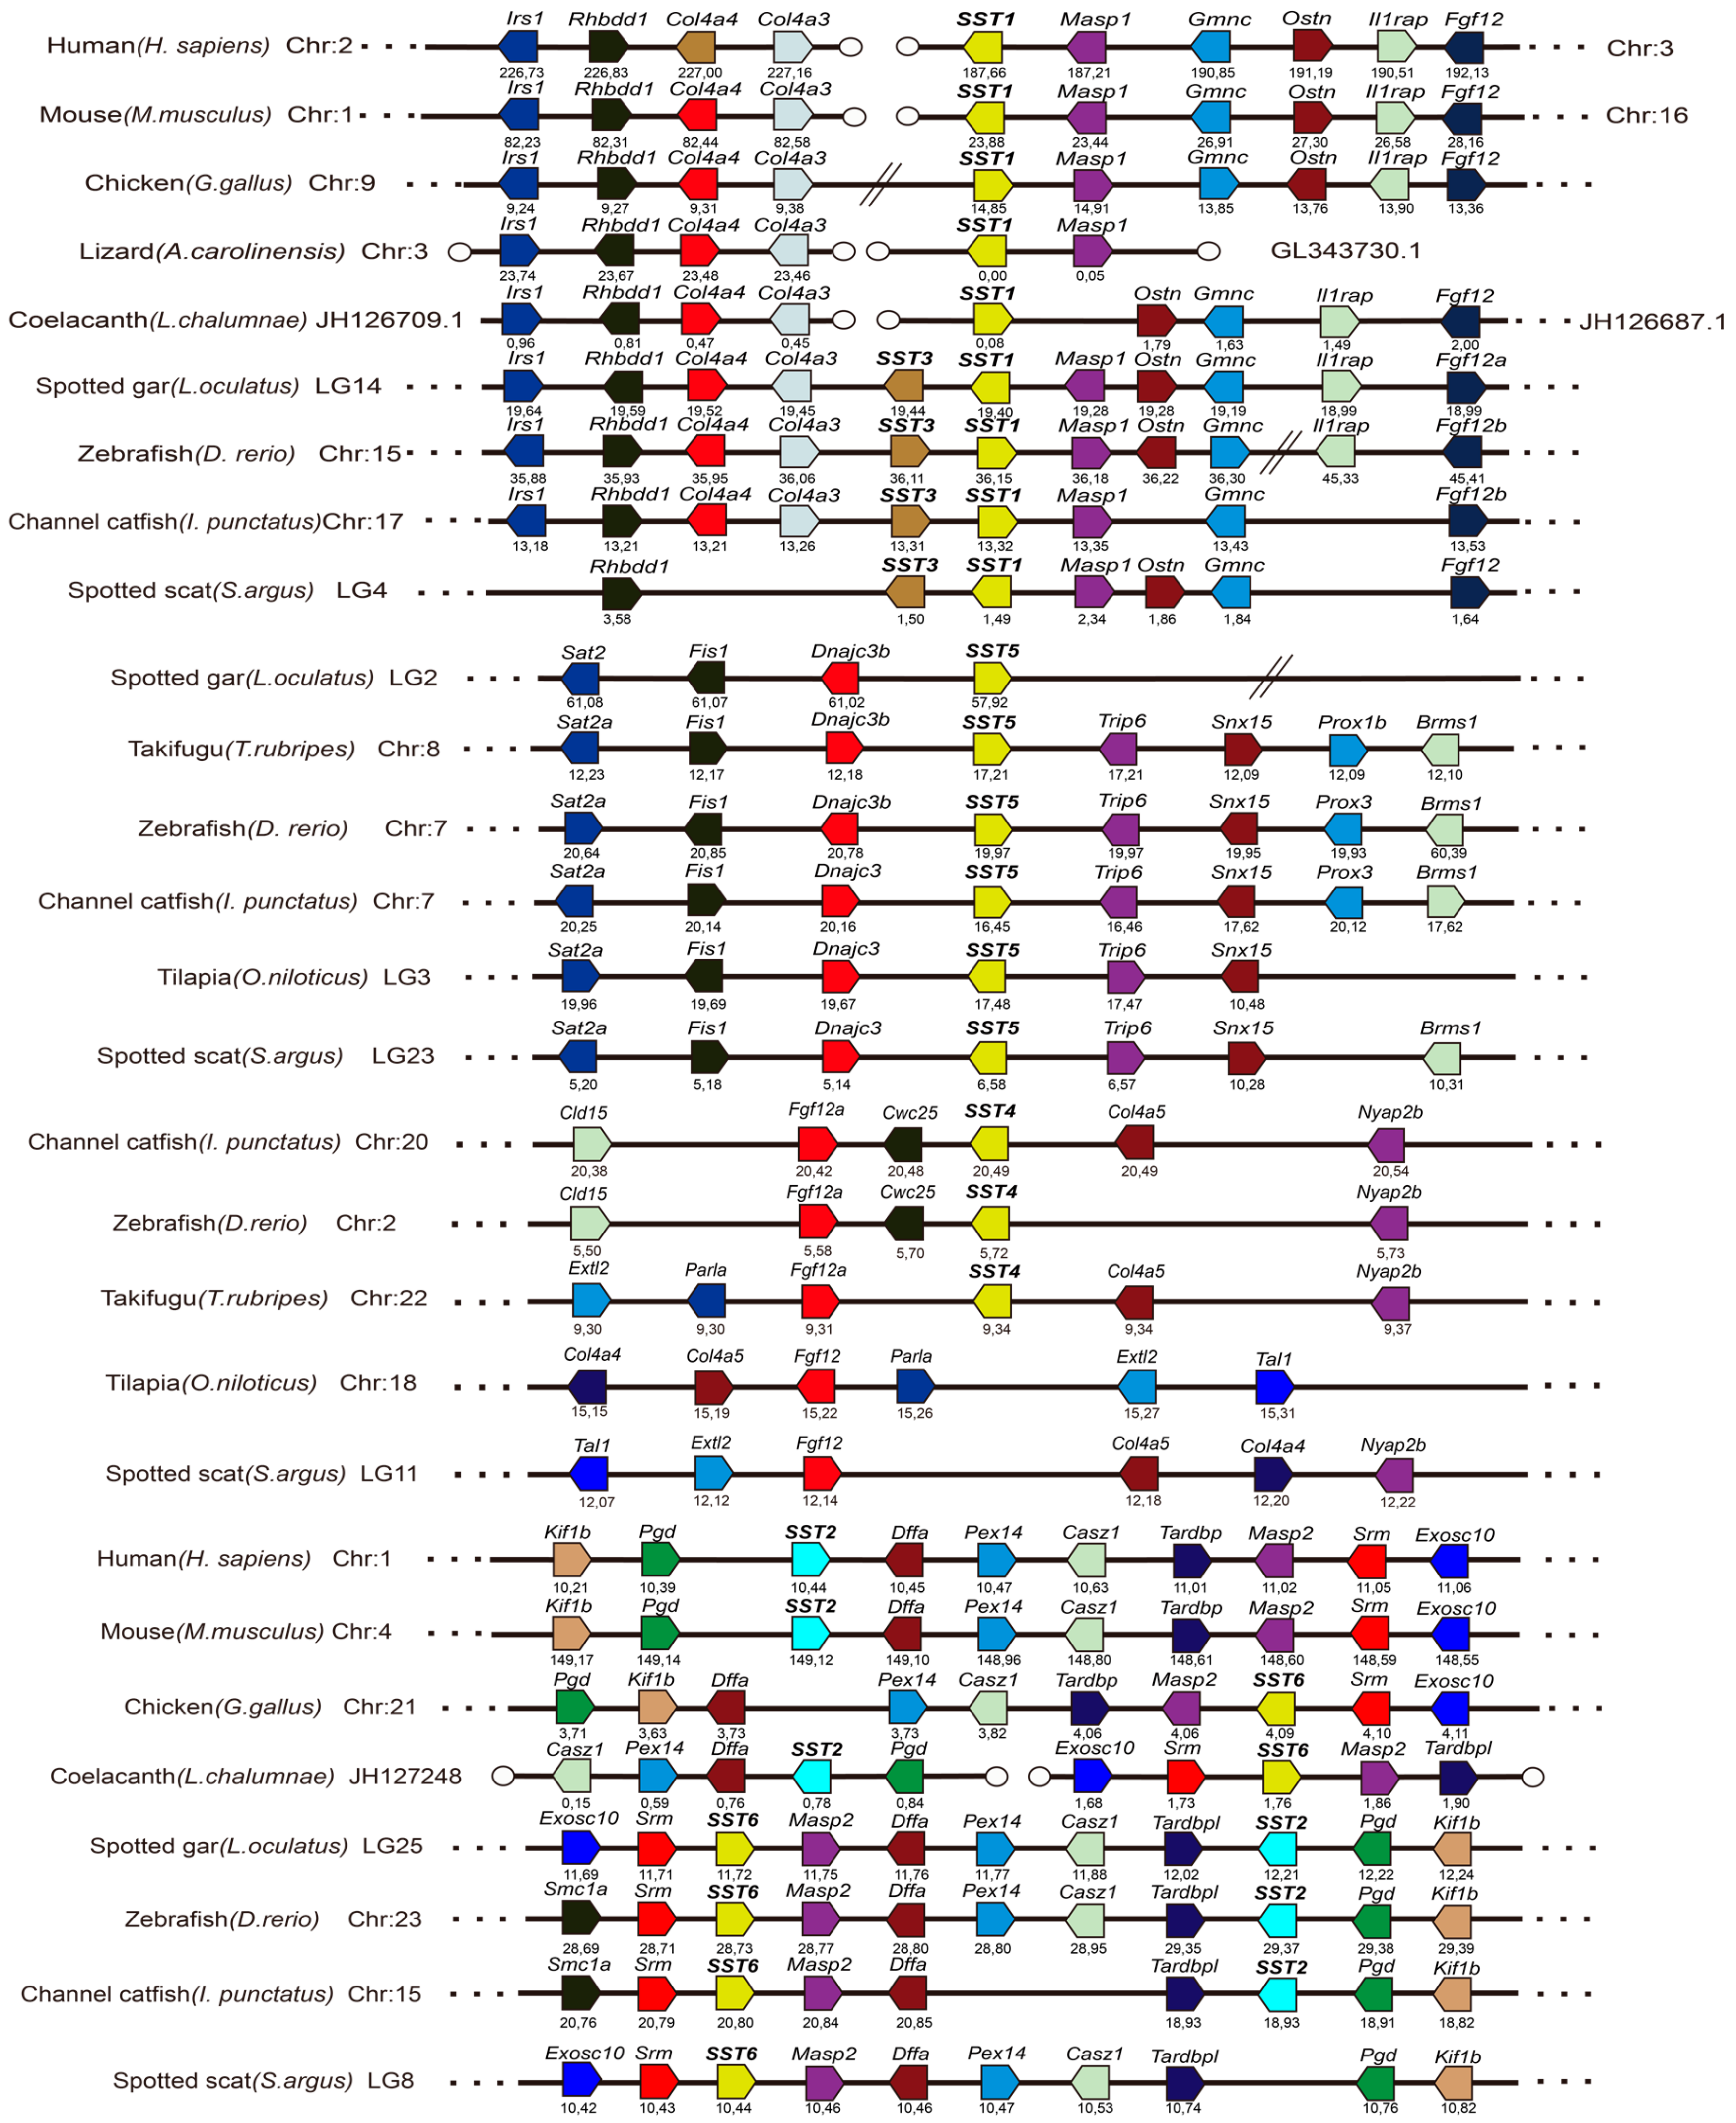
3.3. Phylogenetic and Syntenic Analyses of S. argus SST Genes

In order to analyze the evolutionary relationships of SST1, SST3, SST5, and SST6 in S. argus with other species, a phylogenetic tree based on the amino acid sequences was constructed (Figure 2). It was observed that the four SST genes from S. argus clustered into four distinct branches, along with orthologous genes of other vertebrate species, although the support for the SST3, SST5, and SST6 branches was low. Additionally, S. argus was most closely related to the scorpion fish. The SSTs exhibited high amino acid identity with other vertebrate species analyzed here. Specifically, SST1, SST3, SST5, and SST6 shared 45.2–93.5%, 47.4–92.1%, 40.2–77.9%, and 52.7–96.1% similarity to other known vertebrate SSTs (Table S2), respectively. The SST1 and SST3 amino acid sequences shared the highest sequence identities with their grouper (E. coioides) orthologs, which were 93.5% and 92.1%, respectively. The SST5 and SST6 shared the highest sequence identities with tilapia (O. niloticus) and grouper (E. coioides), which were 77.9% and 96.1%, respectively. For these four SST genes, syntenic analyses were carried out to lend additional support to the accuracy of the SST phylogenetic analysis. Conserved syntenic regions were identified, and the SST orthologs from S. argus and other species were determined. Taken together, these analyses suggest that the annotations attributed here were, in fact, appropriate (Figure 3).

3.4. Tissue Specific Distribution of SST Gene Expression

The mRNA expression levels of SSTs in different tissues were examined by qRT-PCR (Figure 4). It was observed that all four of the SSTs examined were abundantly expressed in the hypothalamus. However, specific genes were expressed differentially in a tissue dependent manner. For example, SST1 and SST3 were equally expressed in the liver and muscle, but the expression of SST3 in the hypothalamus was significantly higher than that of SST1. Furthermore, SST3 was expressed at modest levels in the ovaries and muscle of female fish, and modest expression was observed in the heart, liver, muscle, and other tissues of male fish. The expression of SST5 was gender-specific, being highly expressed in the ovaries of females and hypothalamus of males. In particular, the expression level of SST5 in the ovaries was much higher than was observed in the testis. Finally, SST6 exhibited the highest expression in the stomach, followed by the hypothalamus and intestine.

3.5. Effects of SSTs on the Expression of Igf-1 and Igf-2 in Liver Samples Incubated with S. argus In Vitro

Compared with the control group, SST1 significantly inhibited the expression of Igf-1 and Igf-2 in hepatocytes at different concentrations (control, 0.1, 1, or 10 μM) and incubation times (3 or 6 h) (Figure 5A). Similarly, SST3 inhibited Igf-1 and Igf-2 expression at 3 h. However, after 6 h of treatment, Igf-1 expression was significantly decreased in the 10 μM group only (Figure 5B). At 3 h of treatment, SST5 had no discernable effect on either Igf-1 or Igf-2. However, at 6 h, a significant increase in the expression of Igf-1 was observed (Figure 5C). The expression of Igf-1 and Igf-2 were significantly reduced at 3 h following incubation with SST6. After 6 h, incubation of hepatocytes with 10 μM SST6 resulted in a significant decrease in Igf-1, and a significant increase in Igf-2 expression (Figure 5D).

4. Discussion

In the present study, four members of the SST gene family (SST1, SST3, SST5, and SST6) were reported for the first time in S. argus. Gene structure analysis showed that SST1 and SST6 have two exons and one intron, SST3 has two exons and two introns, and SST5 has three exons and two introns. The amino acid sequences and protein domains of each SST genes were compared to those of other vertebrate species. The results showed that the mature peptides SS-14 were fully conserved in SST1 and SST6 in vertebrates (except in Acipenser sinensis), whereas the sequences of SST3 and SST5 varied by only 2–3 amino acids (Figure S2). These data suggest that the four SST genes are highly conserved among vertebrate species [39]. In S. argus, all four SST genes contain a signal peptide, a long intermediate segment, a putative cleavage site, and a C-terminal sequence [40]. However, different NH2 extension forms were observed in different SST genes including SS-30 residues for SST1; SS-28 for SST3, SS-24 and 28 for SST5; and SS-23 for SST6. Other types of SST peptides have similarly been observed in other teleost fish species including SS-30 in E. coioides, and SS-28 in A. transmontanus [41]. The diversity of SST peptide types in S. argus suggests that SST can participate in different aspects of physiological regulation and other biological functions.
Phylogenetic analysis corroborated the identity of four genes (SST1, SST3, SST5 and SST6) in S. argus in this study. The resulting phylogenetic tree showed that the four SST genes identified were clustered into the same clade as the corresponding genes in other species. The conservation of synteny around the SST genes confirmed the identities inferred from the phylogeny. In the present study, we could determine the linkage group assignments of these genes to be linkage group 4 (SST1 and SST3), 23 (SST5), and 8 (SST6), as shown in Figure 3. Previously, it was demonstrated that SST1 and SST3 were located on the same chromosome in zebrafish [20]. Similarly, SST2 and SST6 were also located on the same chromosome in teleost species. However, the SST2 and SST4 genes could not be identified in the S. argus genome in the present study. Interestingly, SST2 has been observed in amphibians (but not xenopus) and mammals, and SST4 (derived from SST1) was only found in ostariophysi [20]. The results presented here were consistent with previous conclusions, and this corroborates the hypothesis that SST3 and SST6 likely arose by tandem duplications from SST1 and SST2 in teleost fish, respectively [27]. Overall, the structures of SST genes in S. argus were conserved with respect to their corresponding orthologs in other teleost fishes.
Here, qRT-PCR analysis indicated that SST mRNAs were expressed differentially in the tissues examined. For example, SST1 and SST3 were mainly expressed in the hypothalamus, suggesting neuroregulatory functions. The fact that SST5 was highly expressed in ovaries suggests that this gene may be involved in gonadal development and sexual dimorphism in teleost fishes. These results were consistent with those of previous studies in zebrafish [20]. Similar to reports in E. coioides [13], and goldfish (C. auratus) [42], SST6 was highly expressed in the stomach of S. argus. Taken together, these observations hint at a regulatory function of the gastrointestinal tract, and may also play a role in digestion. Studies have shown that SS-14 in Gadus morhua can significantly reduce basal gastric acid secretion through induction of bombesin and histamine [43].
Gene duplication has been implicated as an important source of evolutionary novelty [44]. Functional differences between duplicates are necessary in order for the duplicates to be retained in the genome [45]. After duplications, the daughter genes are under loose constraint and mutations in the regulatory regions of the genes may be responsible for the observed distinct expression patterns of SST genes [46]. The results presented here further suggest that the different SST genes have different functions in teleost fishes, as evidenced by their differential expression patterns. However, more thorough studies are required to verify the functionality of each SST gene.
Somatostatin plays an important role in the growth of teleost fishes, regulating growth and metabolism by inhibiting the release of hormones such as Gh and Igfs. However, SST exerts specific regulatory effects on the secretion of Gh and Igf in different species. For example, catfish SS-22 does not inhibit the secretion of goldfish Gh [47], but it was able to inhibit the secretion of Gh from rat pituitary cells [48]. To explore the effect of SST on growth functions, the effects of four SST peptides on Igf-1 and Igf-2 expression in S. argus liver fragments were investigated. In Oncorhynchus kisutch, stimulation of SST expression in the hypothalamus impeded hepatic Igf-1 expression [49,50]. In vitro culture of O. mykiss hepatocytes in the presence of SS-14 inhibited Igf-1 expression [7]. It is worth noting that SST1 in S. argus can significantly downregulate the expression of Igf-1 mRNA in hepatocyte cultures in vitro, which was also observed in O. mykiss [7]. Furthermore, SST3 and SST6 reduced the expression of both Igf-1 and Igf-2 at 3 h of treatment at the concentrations of 1 and 10 μM. Taken together, these data suggest that SSTs have an inhibitory effect on the growth of S. argus. In contrast, SST5 had no discernable effect on Igf-1 and Igf-2 expression. Only Igf-1 increased significantly at 6 h, suggesting SST5 may play a different role in mediating the growth regulation of S. argus. However, this requires additional study. These data indicated that SSTs (with the exception of SST5) can interact functionally with the growth axis. Further research is needed to determine growth factors related to SSTs.

5. Conclusions

In the present study, four somatostatin genes (SST1, SST3, SST5, and SST6) were identified and characterized in S. argus. Amino acid sequence alignments were performed to establish their structure. Phylogenetic and syntenic analyses clearly identified orthologous relationships between S. argus and other gnathostome SST genes, supporting the annotations. Based on the observation that specific SST genes were expressed in a tissue specific manner, it was speculated that SSTs perform different functions in different tissues. Liver explant cultures incubated in the presence of different SST peptides showed that all SSTs, with the exception of SST5, reduced the expression of Igf-1 and Igf-2. This provides evidence that SSTs can act on the Gh-Igf pathways in S. argus to temper the growth of the animals. The data presented here provide a framework for future studies of the function of the SST genes in S. argus, and provides corroborating evidence regarding the evolution of SST genes in vertebrates.

Supplementary Materials

The following are available online at https://www.mdpi.com/2073-4425/11/2/194/s1, Figure S1. Nucleotide and deduced amino acid sequences of S. argus SSTs; Figure S2. Comparison of SST amino acid sequences between S. argus and other species; Figure S3. The cDNA structure of four SST genes from S. argus; Table S1. Primers targeting SST genes for cloning and detection of expression; Table S2. Sequence identity comparisons of S. argus SSTs with other vertebrates; Table S3. Genes information for syntenic analyses.

Author Contributions

Conceptualization, P.F. and C.T.; Methodology, P.F. and D.J.; Data curation, P.F., H.S., and X.L.; Writing—original draft preparation, P.F. and C.T.; Writing—review and editing, C.T., S.D., C.Z., and G.L.; Visualization, H.C.; Project administration, C.T. and G.L.; Funding acquisition, G.L. In the genome project: Conceptualization, G.L. and C.T.; Methodology, C.T. and D.J.; Data curation, P.F., H.S., S.D., and C.Z.; Writing—original draft preparation, C.T., and X.L.; Project administration, C.T. and G.L.; Funding acquisition, G.L. All authors have read and agreed to the published version of the manuscript.

Funding

This study was supported by grants from the Key Project of “Blue Granary Science and Technology Innovation” of the Ministry of Science and Technology (2018YFD0901203); the National Natural Science Foundation of China (Nos. 41706174 and 31702326); the Natural Science Foundation of Guangdong Province (2016A030313743, 2017A 030313101, 2018B030311050; 2019A1515010958); the Independent Project of Guangdong Province Laboratory (ZJW-2019-06); the Department of Education of Guangdong Province (2018KQNCX111) and Program for Scientific Research Start-up Funds of Guangdong Ocean University (R19026).

Conflicts of Interest

The authors declare no conflicts of interest. The funders had no role in the design of the study, data collection, analyses, interpretation of data, in the preparation of the manuscript, or in the decision to publish the results.

References

  1. Very, N.; Sheridan, M. The Role of Somatostatins in the Regulation of Growth in Fish. Fish Physiol. Biochem. 2002, 27, 217–226. [Google Scholar] [CrossRef]
  2. Patel, Y.C. Somatostatin and Its Receptor Family. Front. Neuroendocr. 1999, 20, 157–198. [Google Scholar] [CrossRef]
  3. Brazeau, P.; Vale, W.; Burgus, R.; Ling, N.; Butcher, M.; Rivier, J.; Guillemin, R. Hypothalamic Polypeptide That Inhibits the Secretion of Immunoreactive Pituitary Growth Hormone. Science 1973, 179, 77–79. [Google Scholar] [CrossRef]
  4. Sheridan, M.A.; Kittilson, J.D.; Slagter, B.J. Structure-Function Relationships of the Signaling System for the Somatostatin Peptide Hormone Family1. Am. Zoöl. 2000, 40, 269–286. [Google Scholar] [CrossRef] [Green Version]
  5. Sheridan, M.A.; Eilertson, C.D.; Kerstetter, T.H. Changes in plasma somatostatin associated with seawater adaptation and stunting of coho salmon, Oncorhynchus kisutch. Aquaculture 1998, 168, 195–203. [Google Scholar] [CrossRef]
  6. Poppinga, J.; Kittilson, J.; McCormick, S.D.; Sheridan, M.A. Effects of somatostatin on the growth hormone-insulin-like growth factor axis and seawater adaptation of rainbow trout (Oncorhynchus mykiss). Aquaculture 2007, 273, 312–319. [Google Scholar] [CrossRef]
  7. Very, N.M.; Kittilson, J.D.; Klein, S.E.; Sheridan, M.A. Somatostatin inhibits basal and growth hormone-stimulated hepatic insulin-like growth factor-I production. Mol. Cell. Endocrinol. 2008, 281, 19–26. [Google Scholar] [CrossRef] [PubMed]
  8. Andrews, P.C.; Pollock, H.G.; Elliott, W.M.; Youson, J.H.; Plisetskaya, E.M. Isolation and characterization of a variant somatostatin-14 and two related somatostatins of 34 and 37 residues from lamprey (Petromyzon marinus). J. Biol. Chem. 1988, 263, 15809–15814. [Google Scholar]
  9. Fukusumi, S.; Kitada, C.; Takekawa, S.; Kizawa, H.; Sakamoto, J.; Miyamoto, M.; Hinuma, S.; Kitano, K.; Fujino, M. Identification and Characterization of a Novel Human Cortistatin-like Peptide. Biochem. Biophys. Res. Commun. 1997, 232, 157–163. [Google Scholar] [CrossRef] [PubMed]
  10. De Lecea, L.; Criado, J.R.; Prospéro-García, O.; Gautvik, K.M.; Schweitzer, P.; Danielson, P.E.; Dunlop, C.L.M.; Siggins, G.R.; Henriksen, S.J.; Sutcliffe, J.G. A cortical neuropeptide with neuronal depressant and sleep-modulating properties. Nature 1996, 381, 242–245. [Google Scholar] [CrossRef]
  11. Trabucchi, M.; Tostivint, H.; Lihrmann, I.; Blähser, S.; Vallarino, M.; Vaudry, H. Characterization of the cDNA encoding a somatostatin variant in the chicken brain: Comparison of the distribution of the two somatostatin precursor mRNAs. J. Comp. Neurol. 2003, 461, 441–451. [Google Scholar] [CrossRef] [PubMed]
  12. Trabucchi, M.; Lihrmann, I.; Vallarino, M.; Vaudry, H. Molecular cloning of the cDNAs and distribution of the mRNAs encoding two somatostatin precursors in the African lungfish Protopterus annectens. J. Comp. Neurol. 1999, 410, 643–652. [Google Scholar] [CrossRef]
  13. Ye, X.; Li, W.S.; Lin, H.R. Polygenic expression of somatostatin in orange-spotted grouper (Epinephelus coioides): Molecular cloning and distribution of the mRNAs encoding three somatostatin precursors. Mol. Cell. Endocrinol. 2005, 241, 62–72. [Google Scholar]
  14. Feng, X.; Yu, X.; Pang, M.; Liu, H.; Tong, J. Molecular characterization and expression of three preprosomatostatin genes and their association with growth in common carp (Cyprinus carpio). Comp. Biochem. Physiol. Part B Biochem. Mol. Biol. 2015, 182, 37–46. [Google Scholar] [CrossRef] [PubMed] [Green Version]
  15. Quan, F.B.; Kenigfest, N.B.; Mazan, S.; Tostivint, H. Molecular cloning of the cDNAs encoding three somatostatin variants in the dogfish (Scylorhinus canicula). Gen. Comp. Endocrinol. 2013, 180, 1–6. [Google Scholar] [CrossRef] [PubMed]
  16. Tostivint, H.; Dettaï, A.; Quan, F.B.; Ravi, V.; Tay, B.-H.; Rodicio, M.C.; Mazan, S.; Venkatesh, B.; Kenigfest, N.B. Identification of three somatostatin genes in lampreys. Gen. Comp. Endocrinol. 2016, 237, 89–97. [Google Scholar] [CrossRef]
  17. Bosch, J.V.O.D.; Adriaensen, D.; Van Nassauw, L.; Timmermans, J.-P. The role(s) of somatostatin, structurally related peptides and somatostatin receptors in the gastrointestinal tract: A review. Regul. Pept. 2009, 156, 1–8. [Google Scholar] [CrossRef]
  18. Tostivint, H.; Lihrmann, I.; Bucharles, C.; Vieau, D.; Coulouarn, Y.; Fournier, A.; Conlon, J.M.; Vaudry, H. Occurrence of two somatostatin variants in the frog brain: Characterization of the cDNAs, distribution of the mRNAs, and receptor-binding affinities of the peptides. Proc. Natl. Acad. Sci. USA 1996, 93, 12605–12610. [Google Scholar] [CrossRef] [Green Version]
  19. Vaudry, H.; Chartrel, N.; Conlon, J.M. Isolation of [Pro2,Met13]Somatostatin-14 and somatostatin-14 from the frog brain reveals the existence of a somatostatin gene family in a tetrapod. Biochem. Biophys. Res. Commun. 1992, 188, 477–482. [Google Scholar] [CrossRef]
  20. Liu, Y.; Lu, D.; Zhang, Y.; Li, S.; Liu, X.; Lin, H. The evolution of somatostatin in vertebrates. Gene 2010, 463, 21–28. [Google Scholar] [CrossRef]
  21. Tostivint, H.; Lihrmann, I.; Vaudry, H. New insight into the molecular evolution of the somatostatin family. Mol. Cell. Endocrinol. 2008, 286, 5–17. [Google Scholar] [CrossRef] [PubMed] [Green Version]
  22. Tostivint, H.; Daza, D.O.; Bergqvist, C.A.; Quan, F.B.; Bougerol, M.; Lihrmann, I.; Larhammar, D. MOLECULAR EVOLUTION OF GPCRS: Somatostatin/urotensin II receptors. J. Mol. Endocrinol. 2014, 52, T61–T86. [Google Scholar] [CrossRef] [PubMed] [Green Version]
  23. Yun, S.; Furlong, M.; Sim, M.; Cho, M.; Park, S.; Cho, E.B.; Reyes-Alcaraz, A.; Hwang, J.-I.; Kim, J.; Seong, J.Y. Prevertebrate Local Gene Duplication Facilitated Expansion of the Neuropeptide GPCR Superfamily. Mol. Biol. Evol. 2015, 32, 2803–2817. [Google Scholar] [CrossRef] [PubMed] [Green Version]
  24. Dehal, P.; Boore, J.L. Two rounds of whole genome duplication in the ancestral vertebrate. PLoS Biol. 2005, 3, e314. [Google Scholar] [CrossRef] [Green Version]
  25. Putnam, N.H.; Butts, T.; Ferrier, D.E.K.; Furlong, R.F.; Hellsten, U.; Kawashima, T.; Robinson-Rechavi, M.; Shoguchi, E.; Terry, A.; Yu, J.-K.; et al. The amphioxus genome and the evolution of the chordate karyotype. Nature 2008, 453, 1064–1071. [Google Scholar] [CrossRef] [Green Version]
  26. Van De Peer, Y.; Maere, S.; Meyer, A. 2R or not 2R is not the question anymore. Nat. Rev. Genet. 2010, 11, 166. [Google Scholar] [CrossRef] [Green Version]
  27. Tostivint, H.; Gaillard, A.-L.; Mazan, S.; Pézeron, G. Revisiting the evolution of the somatostatin family: Already five genes in the gnathostome ancestor. Gen. Comp. Endocrinol. 2019, 279, 139–147. [Google Scholar] [CrossRef]
  28. Tostivint, H.; Joly, L.; Lihrmann, I.; Ekker, M.; Vaudry, H. Chromosomal localization of three somatostatin genes in zebrafish. Evidence that the [Pro2]-somatostatin-14 isoform and cortistatin are encoded by orthologous genes. J. Mol. Endocrinol. 2004, 33, R1–R8. [Google Scholar] [CrossRef] [Green Version]
  29. Sivan, G.; Radhakrishnan, C.K. Food, Feeding Habits and Biochemical Composition of Scatophagus argus. Turkish J. Fish. Aquat. Sci. 2011, 11, 603–608. [Google Scholar]
  30. Ghazilou, A.; Chenary, F.; Morovvati, H.; Zolgarneine, H. Time course of saltwater adaptation in Spotted Scat (Scatophagus argus) (Pisces): A histomorphometric approach. Ital. J. Zool. 2011, 78, 82–89. [Google Scholar] [CrossRef]
  31. Gupta, S. An Overview on Morphology, Biology, and Culture of Spotted Scat Scatophagus argus (Linnaeus 1766). Rev. Fish. Sci. Aquac. 2016, 24, 203–212. [Google Scholar] [CrossRef]
  32. Altschul, S.F.; Gish, W.; Miller, W.; Myers, E.W.; Lipman, D.J. Basic local alignment search tool. J. Mol. Biol. 1990, 215, 403–410. [Google Scholar] [CrossRef]
  33. Gasteiger, E.; Gattiker, A.; Hoogland, C.; Ivanyi, I.; Appel, R.D.; Bairoch, A. ExPASy: The proteomics server for in-depth protein knowledge and analysis. Nucleic Acids Res. 2003, 31, 3784–3788. [Google Scholar] [CrossRef] [PubMed] [Green Version]
  34. Almagro Armenteros, J.J.; Tsirigos, K.D.; Sønderby, C.K.; Petersen, T.N.; Winther, O.; Brunak, S.; von Heijne, G.; Nielsen, H. SignalP 5.0 improves signal peptide predictions using deep neural networks. Nat. Biotechnol. 2019, 37, 420–423. [Google Scholar] [CrossRef] [PubMed]
  35. Letunic, I.; Bork, P. 20 years of the SMART protein domain annotation resource. Nucleic Acids Res. 2018, 46, D493–D496. [Google Scholar] [CrossRef] [PubMed]
  36. Cunningham, F.; Achuthan, P.; Akanni, W.; Allen, J.; Amode, M.R.; Armean, I.M.; Bennett, R.; Bhai, J.; Billis, K.; Boddu, S.; et al. Ensembl 2019. Nucleic Acids Res. 2019, 47, D745–D751. [Google Scholar] [CrossRef] [PubMed] [Green Version]
  37. Sayers, E.W.; Agarwala, R.; Bolton, E.E.; Brister, J.R.; Canese, K.; Clark, K.; Connor, R.; Fiorini, N.; Funk, K.; Hefferon, T.; et al. Database resources of the National Center for Biotechnology Information. Nucleic Acids Res. 2019, 47, D23–D28. [Google Scholar] [CrossRef] [Green Version]
  38. Wang, M.; Deng, S.-P.; Chen, H.-P.; Jiang, D.-N.; Tian, C.-X.; Yang, W.; Wu, T.-L.; Zhu, C.-H.; Zhang, Y.; Li, G.-L. Phoenixin participated in regulation of food intake and growth in spotted scat, Scatophagus argus. Comp. Biochem. Physiol. Part B Biochem. Mol. Biol. 2018, 226, 36–44. [Google Scholar] [CrossRef]
  39. Conlon, J.; Tostivint, H.; Vaudry, H. Somatostatin- and urotensin II-related peptides: Molecular diversity and evolutionary perspectives. Regul. Pept. 1997, 69, 95–103. [Google Scholar] [CrossRef]
  40. Seidah, N.G.; Chrétien, M. Proprotein and prohormone convertases: A family of subtilases generating diverse bioactive polypeptides. Brain Res. 1999, 848, 45–62. [Google Scholar] [CrossRef]
  41. Trabucchi, M.; Tostivint, H.; Lihrmann, I.; Sollars, C.; Vallarino, M.; Dores, R.M.; Vaudry, H. Polygenic expression of somatostatin in the sturgeon Acipenser transmontanus: Molecular cloning and distribution of the mRNAs encoding two somatostatin precursors. J. Comp. Neurol. 2010, 443, 332–345. [Google Scholar] [CrossRef] [PubMed]
  42. Yunker, W.K.; Smith, S.; Graves, C.; Davis, P.J.; Unniappan, S.; Rivier, J.E.; Peter, R.E.; Chang, J.P. Endogenous Hypothalamic Somatostatins Differentially Regulate Growth Hormone Secretion from Goldfish Pituitary Somatotropes in Vitro. Endocrinology 2003, 144, 4031–4041. [Google Scholar] [CrossRef] [PubMed]
  43. Holstein, B.; Cederberg, C. Effect of somatostatin on basal and stimulated gastric secretion in the cod, Gadus morhua. Am. J. Physiol. Liver Physiol. 1988, 254, G183–G188. [Google Scholar] [CrossRef] [PubMed]
  44. Zhang, J. Evolution by gene duplication: An update. Trends Ecol. Evol. 2003, 18, 292–298. [Google Scholar] [CrossRef] [Green Version]
  45. He, X.; Zhang, J. Rapid Subfunctionalization Accompanied by Prolonged and Substantial Neofunctionalization in Duplicate Gene Evolution. Genetics 2005, 169, 1157–1164. [Google Scholar] [CrossRef] [PubMed] [Green Version]
  46. Brunet, F.G.; Crollius, H.R.; Paris, M.; Aury, J.-M.; Gibert, P.; Jaillon, O.; Laudet, V.; Robinson-Rechavi, M. Gene Loss and Evolutionary Rates Following Whole-Genome Duplication in Teleost Fishes. Mol. Biol. Evol. 2006, 23, 1808–1816. [Google Scholar] [CrossRef]
  47. Marchant, T.A.; Fraser, R.A.; Andrews, P.; Peter, R. The influence of mammalian and teleost somatostatins on the secretion of growth hormone from goldfish (Carassius auratus L.) pituitary fragments in vitro. Regul. Pept. 1987, 17, 41–52. [Google Scholar] [CrossRef]
  48. Oyama, H.; Bradshaw, R.A.; Bates, O.J.; Permutt, A. Amino acid sequence of catfish pancreatic somatostatin I. J. Biol. Chem. 1980, 255, 2251–2254. [Google Scholar]
  49. Very, N.M.; Sheridan, M.A. Somatostatin inhibits insulin-like growth factor-I receptor expression in the gill of a teleost fish (Oncorhynchus mykiss). FEBS Lett. 2007, 581, 4773–4777. [Google Scholar] [CrossRef] [Green Version]
  50. Wang, B.; Jia, J.; Yang, G.; Qin, J.; Zhang, C.; Zhang, Q.; Sun, C.; Li, W. In vitro effects of somatostatin on the growth hormone-insulin-like growth factor axis in orange-spotted grouper (Epinephelus coioides). Gen. Comp. Endocrinol. 2016, 237, 1–9. [Google Scholar] [CrossRef] [Green Version]
Figure 1. Schematic diagram of the exon–intron structure and protein domain prediction of SST genes in S. argus. The white rectangle on the left represents the 5’UTR and the white polygon on the right depicts the 3’UTR. The open reading frame is indicated by colored boxes. The blue arrows represent the start codon position, and signal peptides are marked in red, the low complexity and Pfam: Somatostatin regions are marked in purple and yellow, respectively. Regions encoding mature peptides are indicated by orange boxes. The short solid lines at the top right are scale bars, representing 100 bp.
Genes 11 00194 g001
Figure 2. Phylogenetic tree of the SST family members in selected vertebrate species. The tree was constructed using mega 7.0 and the maximum likelihood approach. Bootstrap testing was based on 500 replicates. The SST genes of S. argus are denoted by triangles. Genbank accession numbers of these genes are provided in Table S2.
Genes 11 00194 g002
Figure 3. Conserved synteny analysis of SST genes from S. argus using the genomes of 10 selected vertebrate species (human, mouse, chicken, lizard, coelacanth, spotted gar, zebrafish, channel catfish, tilapia, and fugu). Genes are represented by pentagons, and the directions of the reading frames are represented by the direction that the pentagon is pointing. Empty circles indicate the end of scaffolds. Gene positions (in megabases -Mb) are displayed below each pentagon. The detailed chromosomal positions of the genes used are presented in Table S3.
Genes 11 00194 g003
Figure 4. The relative expression levels of female and male S. argus SST1 (A), SST3 (B), SST5 (C), and SST6 (D) in different tissues. The error bars represent the standard error of the means of three independent replicates. Significant differences between male and female fish were compared separately. Different letters above the error bar indicate statistical differences at P < 0.05, as determined by one-way Analysis of Variance (ANOVA) followed by a Duncan’s post hoc test. Hy: Hypothalamus; P: Pituitary; Gi: Gill; L: Liver; He: Heart; K: Kidney; Sp: Spleen; St: Stomach; In: Intestine; G: Gonad; Mu: Muscle.
Genes 11 00194 g004
Figure 5. Effects of different concentrations and in vitro incubation times of SST1 (A), SST3 (B), SST5 (C), and SST6 (D) on the expression of Igf-1 and Igf-2 in liver. Black bars represent incubations for 3 h and incubation for 6 h in white bars. Data are presented as mean ± SEM (n = 3). Significant differences at P < 0.05 were labeled with different letters.
Genes 11 00194 g005
Table 1. The somatostatin family genes and their sequence characteristics in three teleost fish species and the spotted gar.
SpeciesGeneAccessionChr.PositionIntron NumberLength (aa)Mol. Wt. (KDa)pI
ScatophagusargusSST1MN503273linkage group 41,497,913–1,500,200112313.508585.927
SST3MN503274linkage group 41,509,010–1,511,180212714.185197.087
SST5MN503275linkage group 236,586,660–6,590,089210612.147125.137
SST6MN503272linkage group 828,731,379–28,732,313111012.329397.054
Danio rerioSST1ENSDARG000000407991536,156,986–36,158,851111412.447376.573
SST3ENSDARG000000331611536,115,955–36,120,277111913.776765.743
SST5XM_001333046719,971,621–19,975,163110712.394346.564
SST6ENSDARG000000316492328,731,379–28,732,313111112.505586.636
Ictalurus punctatusSST1ENSIPUT00000002347.11713,328,384–13,330,108111412.418346.556
SST3ENSIPUG000000016001713,313,346–13,315,085111813.199196.906
SST5NC_030422.1716,459,454–16,460,769110111.596567.196
SST6ENSIPUG000000098851520,806,961–20,808,421110912.428485.960
Lepisosteus oculatusSST1ENSLOCG00000009439LG1419,404,762–19,407,399111412.470245.443
SST3ENSLOCG00000009445LG1419,441,987–19,443,409111613.184077.085
SST5XM_006627348LG257,923,010–57,929,171112213.459599.055
SST6XP_006642047.1LG2511,726,683–11,728,536110912.136117.049

